
Comprehensive Analysis of Prognostic and Genetic Signatures for General Transcription Factor III (GTF3) in Clinical Colorectal Cancer Patients Using Bioinformatics Approaches


 and
and 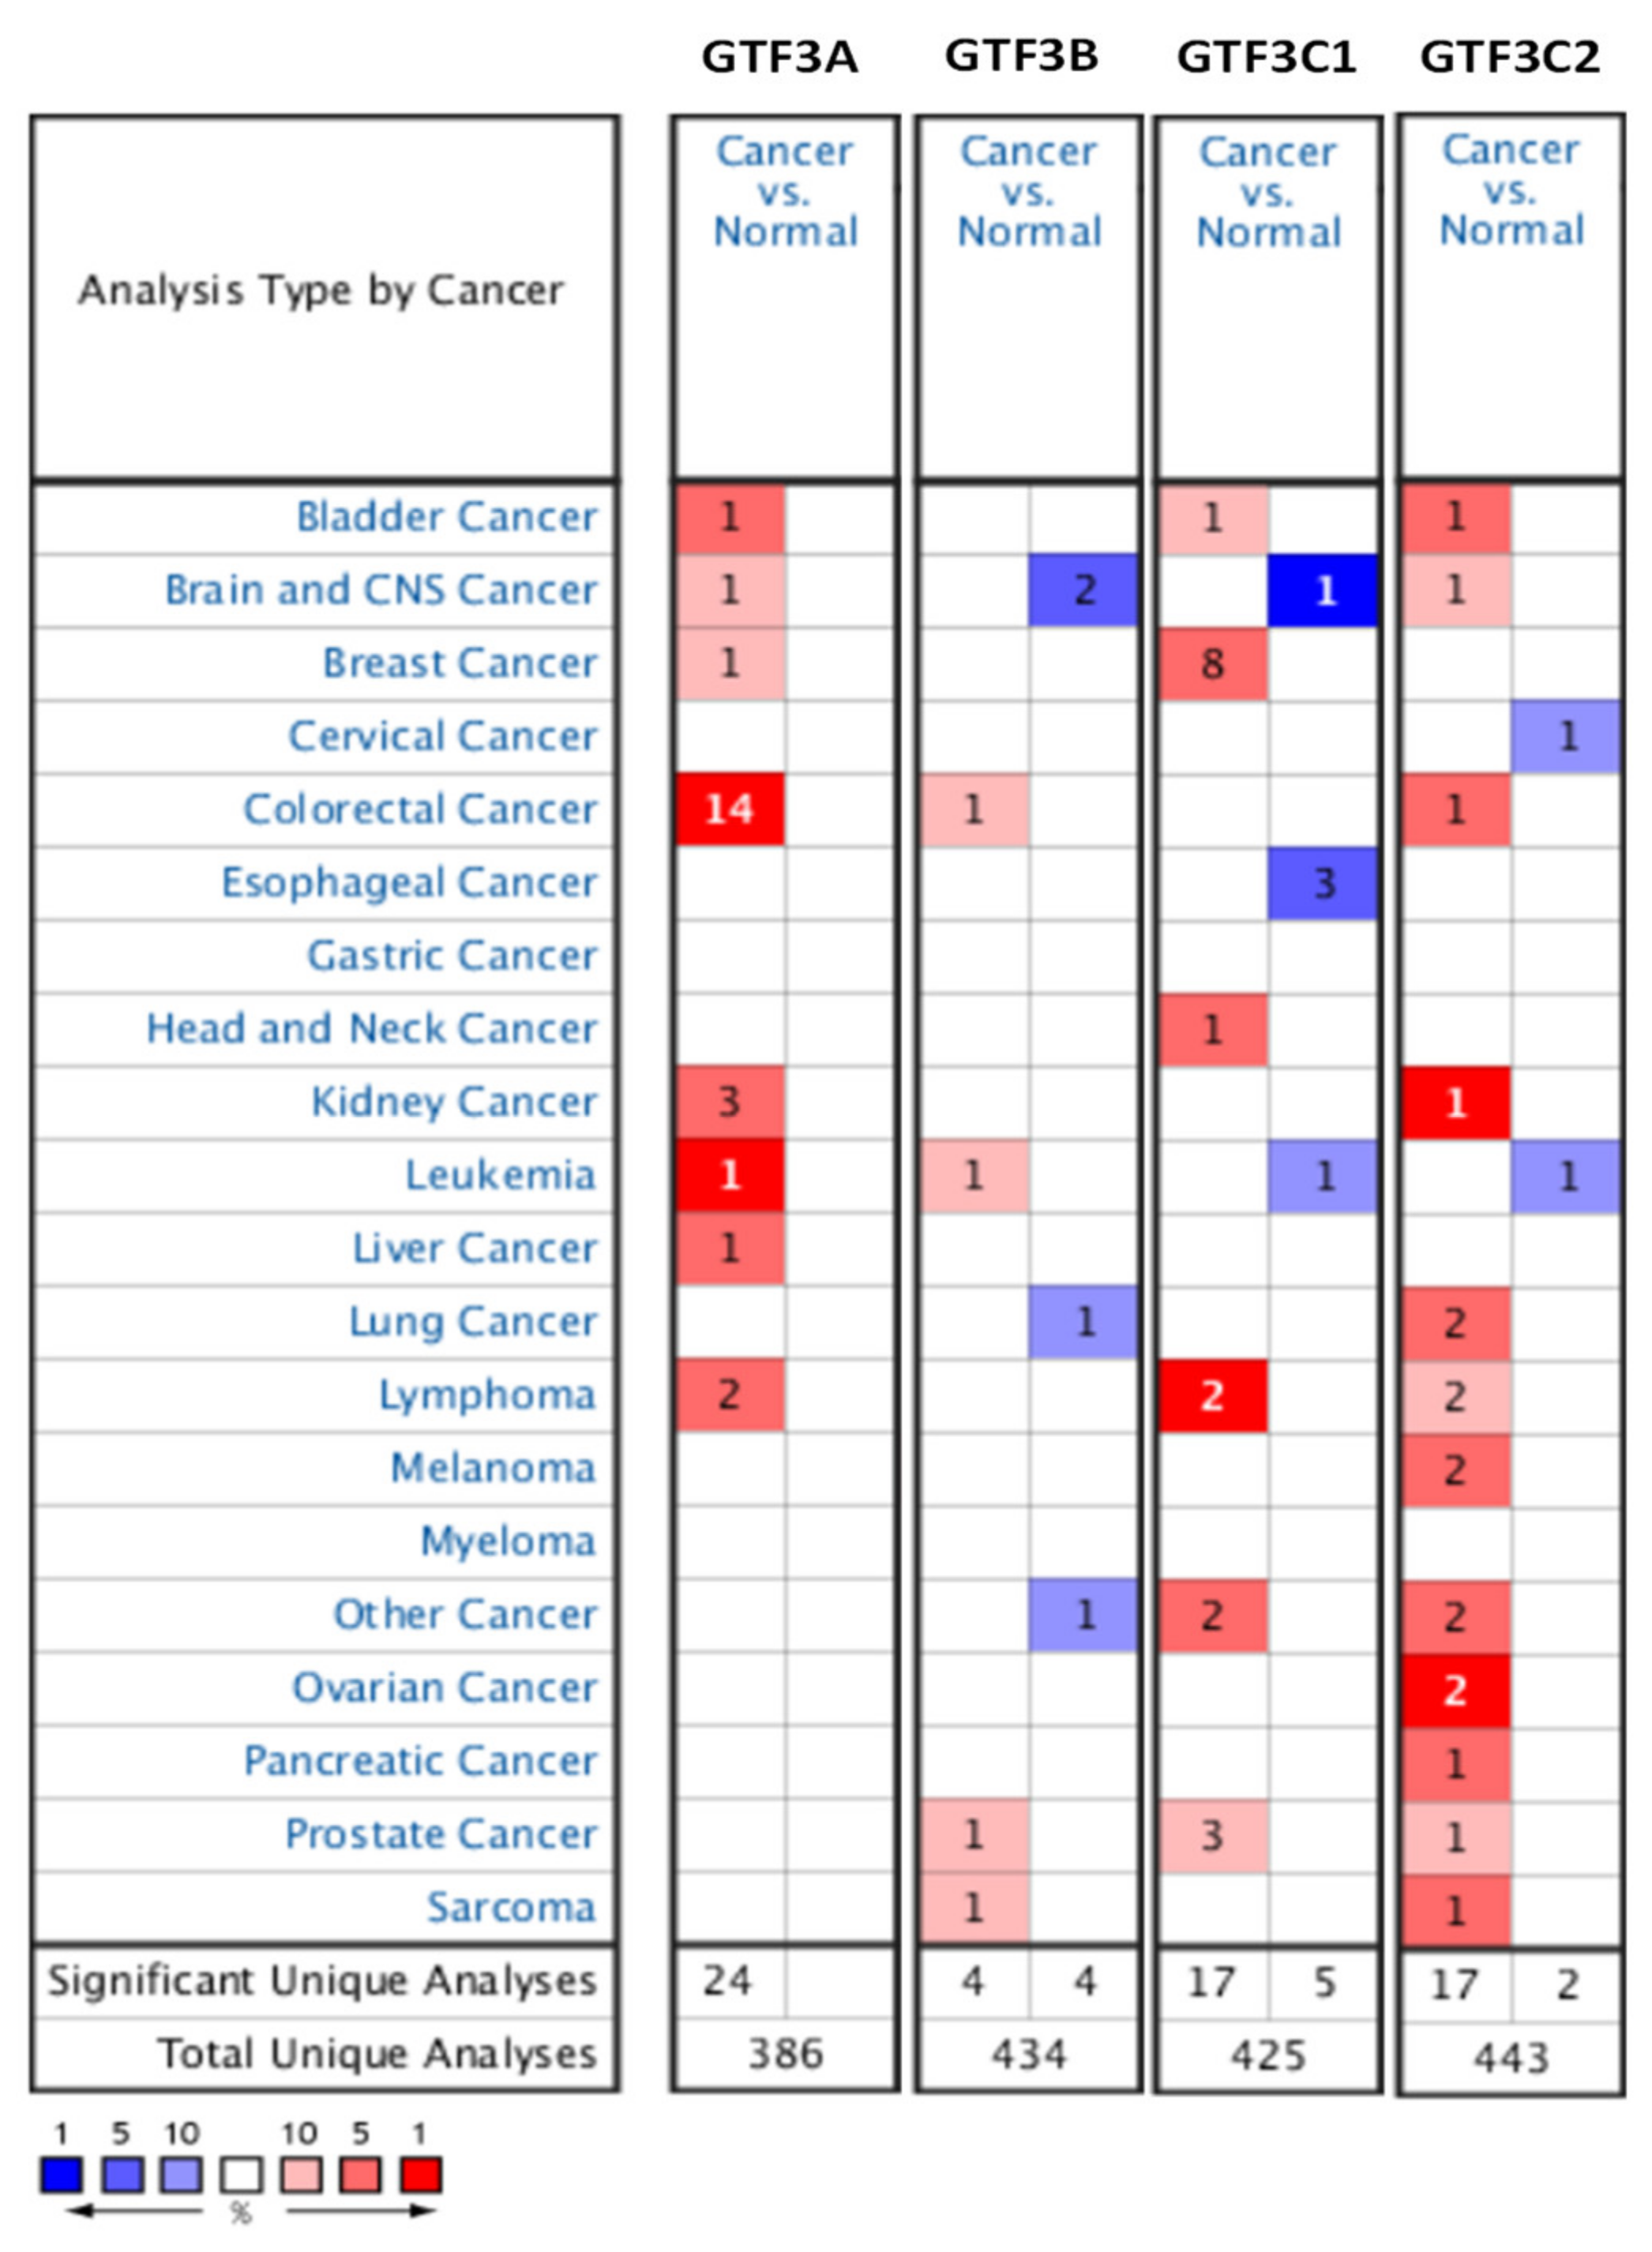
Abstract
:1. Introduction
2. Materials and Methods
2.1. Oncomine Analysis and GEPIA Datasets
2.2. Cancer Cell Line Encyclopedia (CCLE) Analysis
2.3. Differentially Expressed GTF3 Genes: Prognostic Significance and Expression
2.4. Genomic Alterations Analysis
2.5. Functional Enrichment Analysis
3. Results
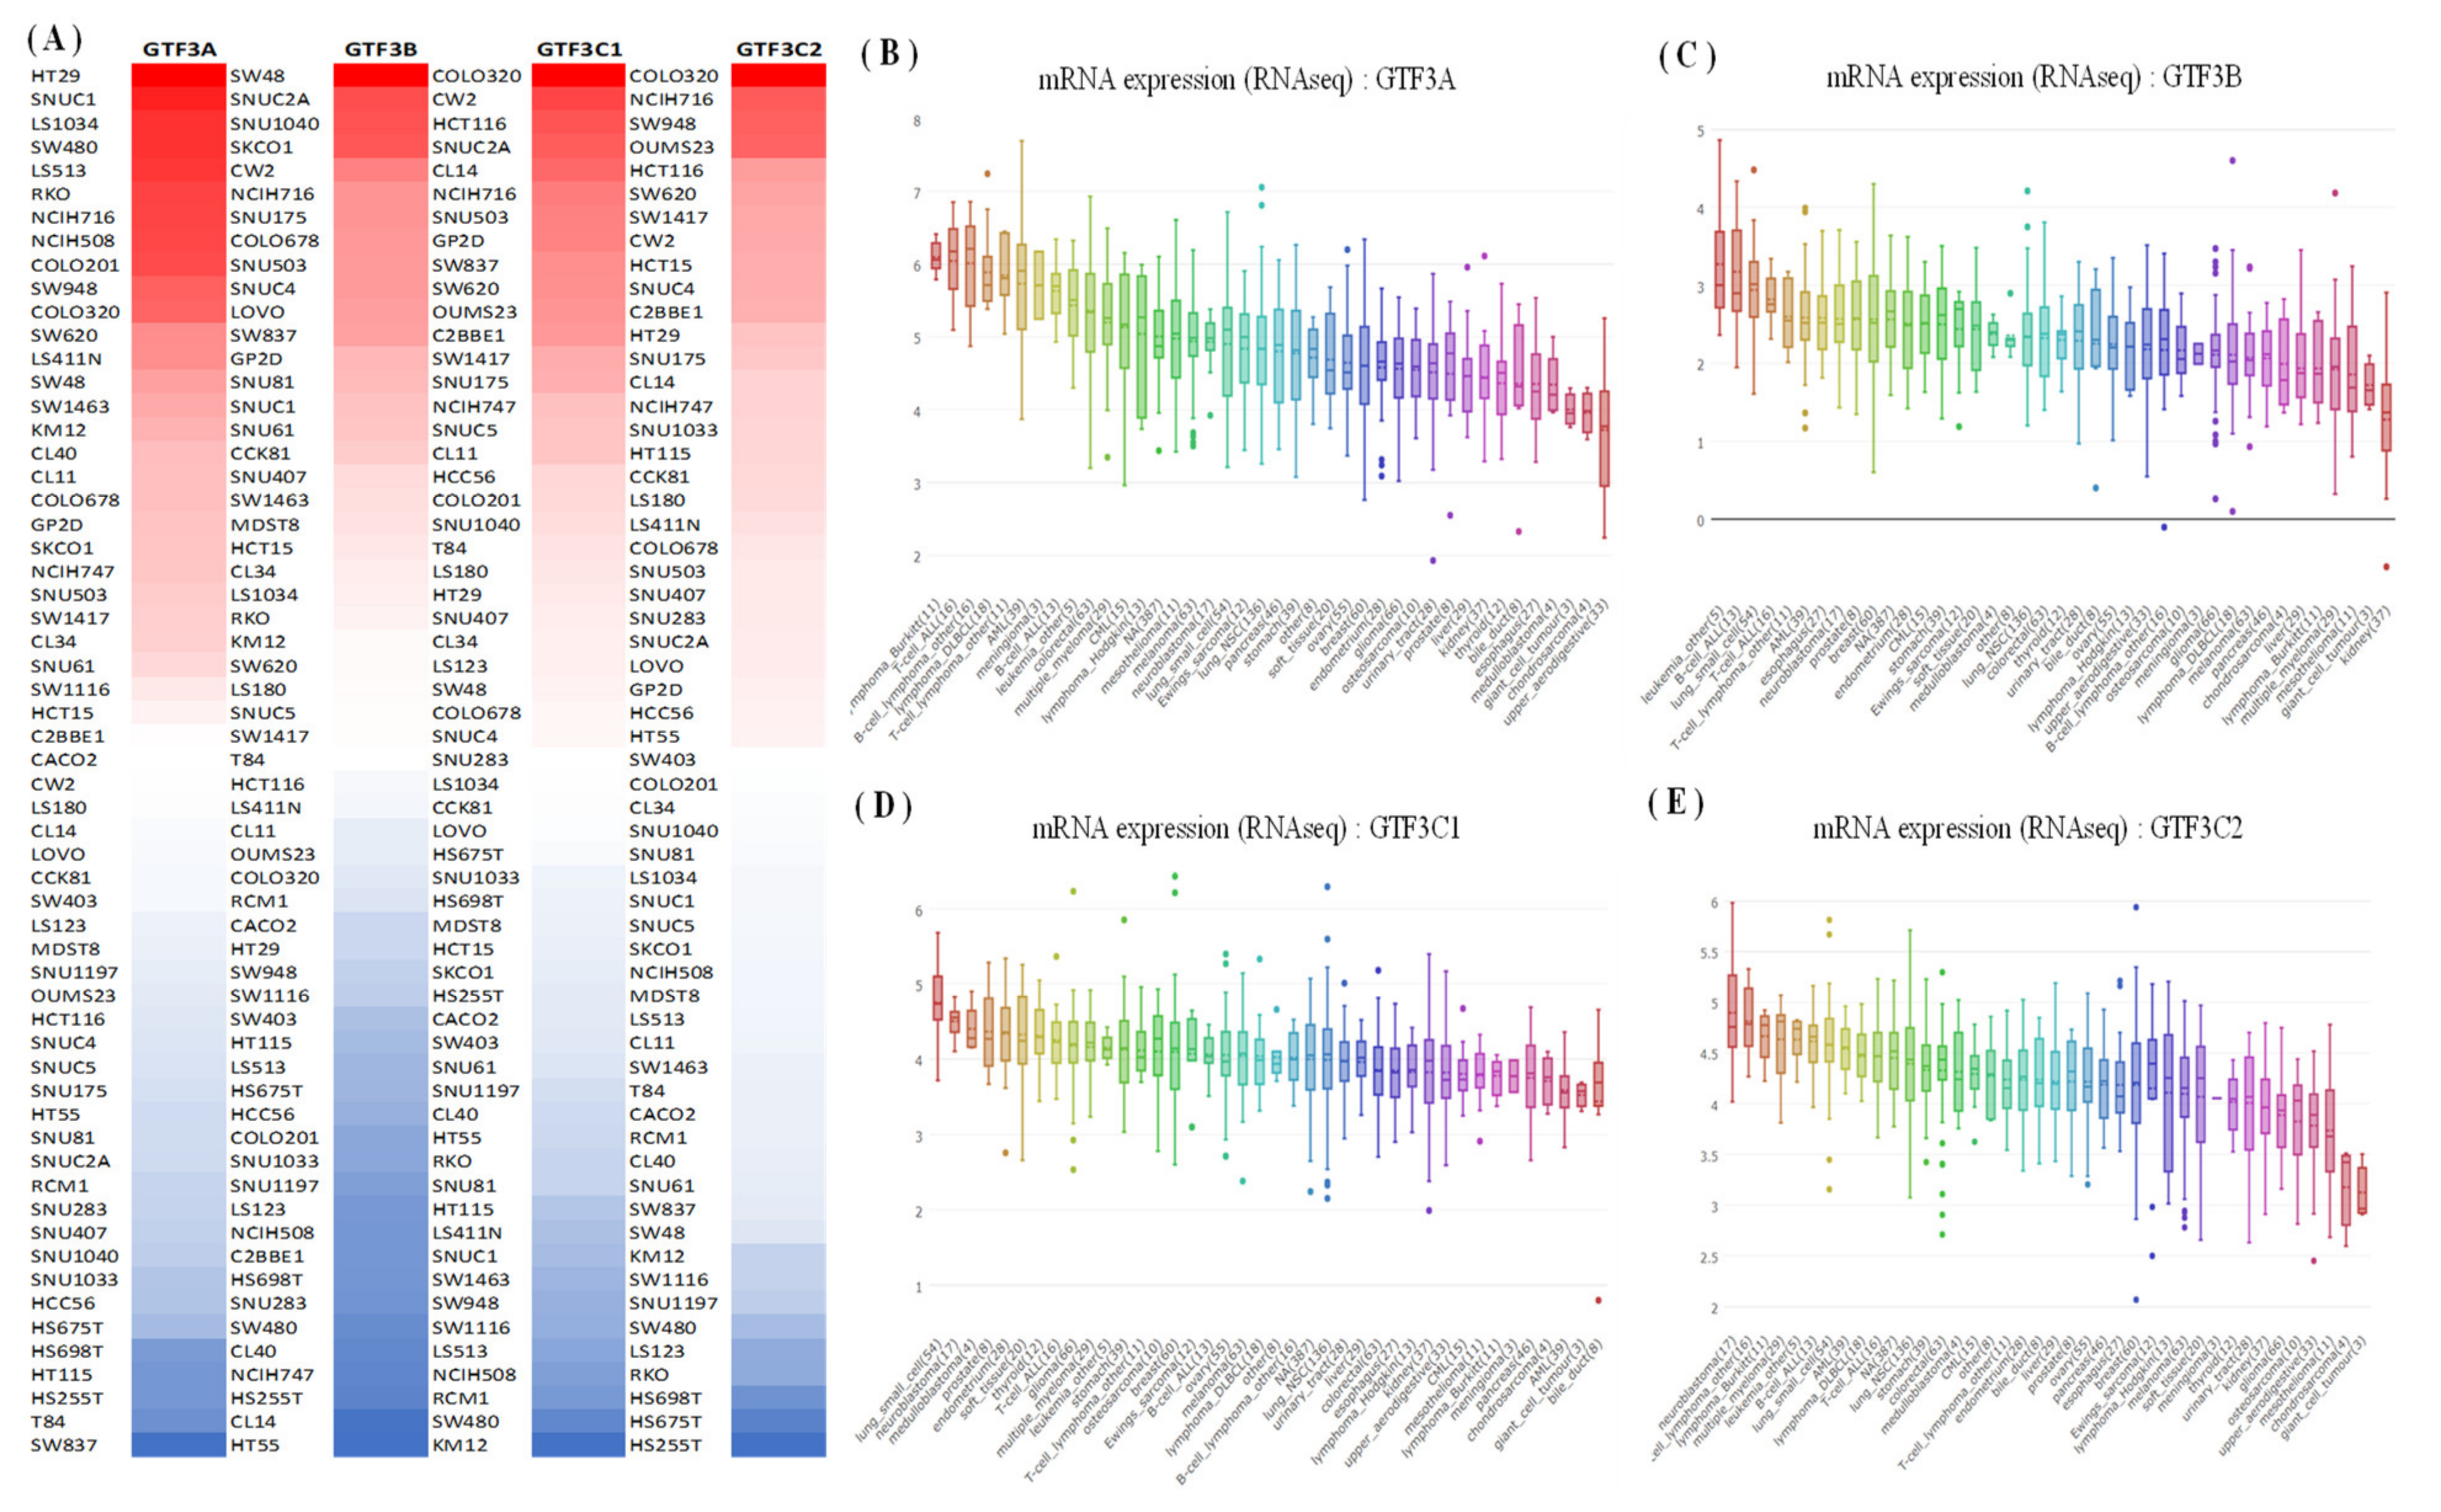
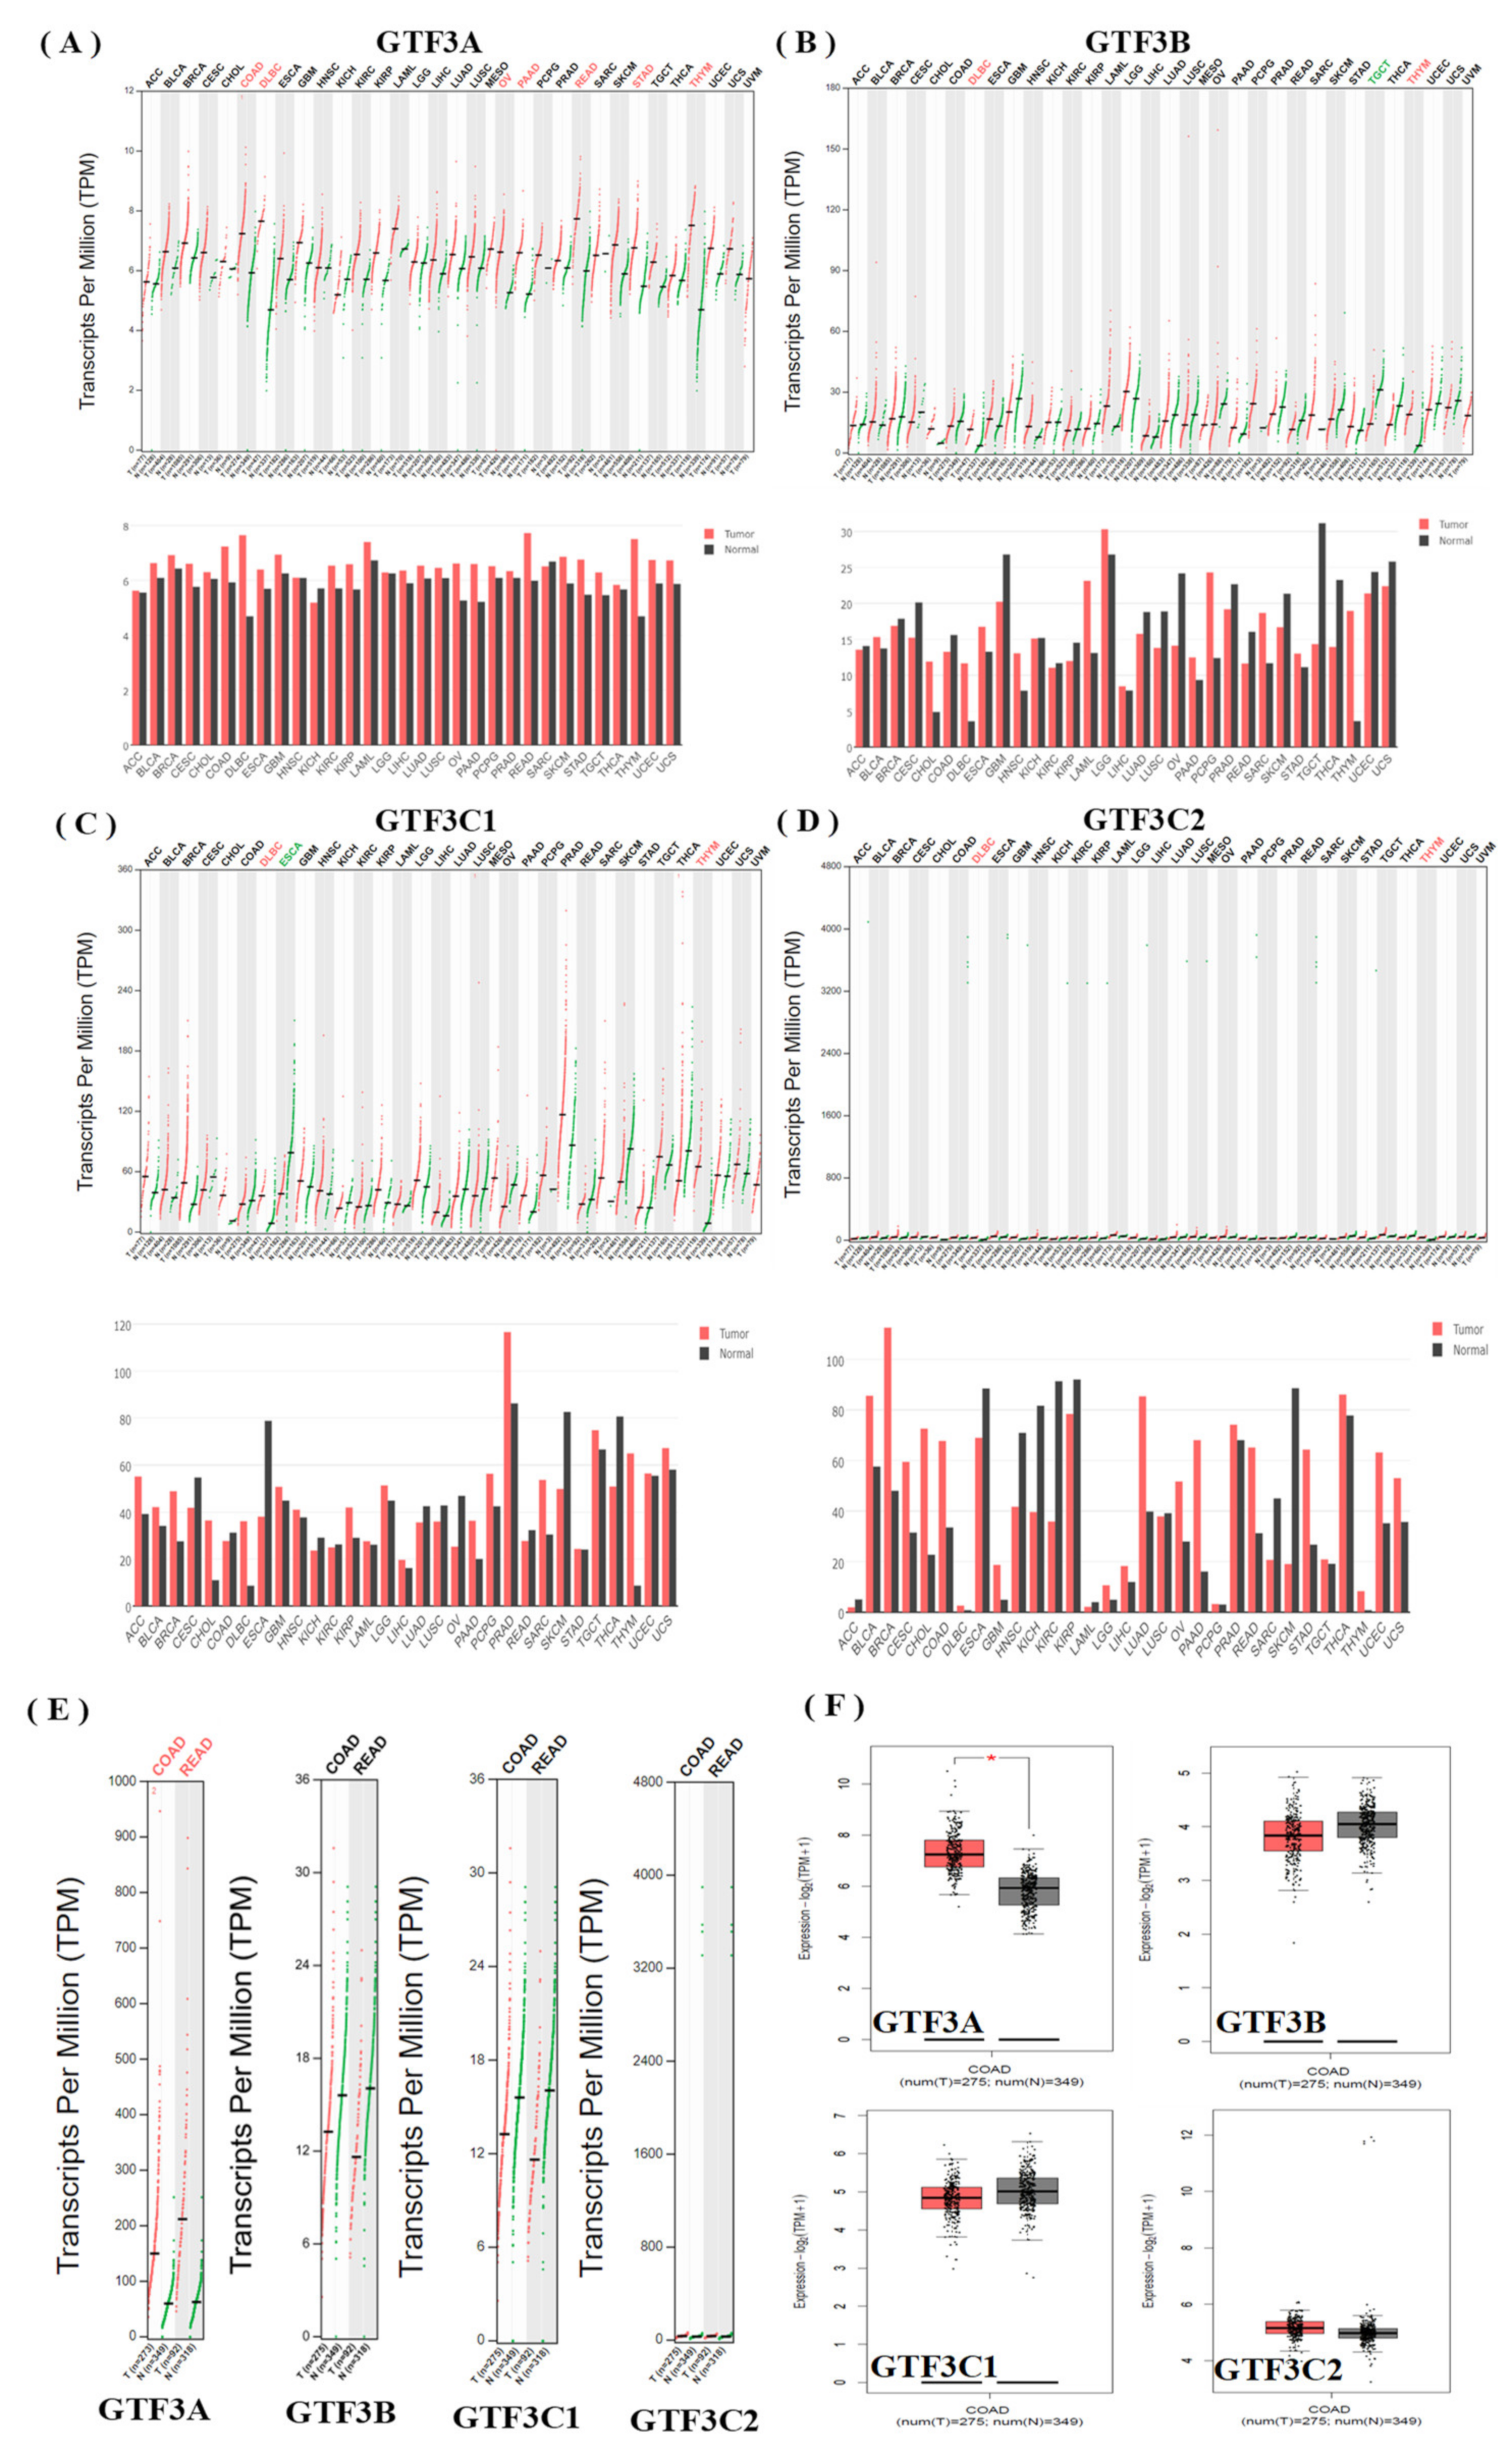
3.1. Expression Pattern of GTF3 Family Genes in CRC
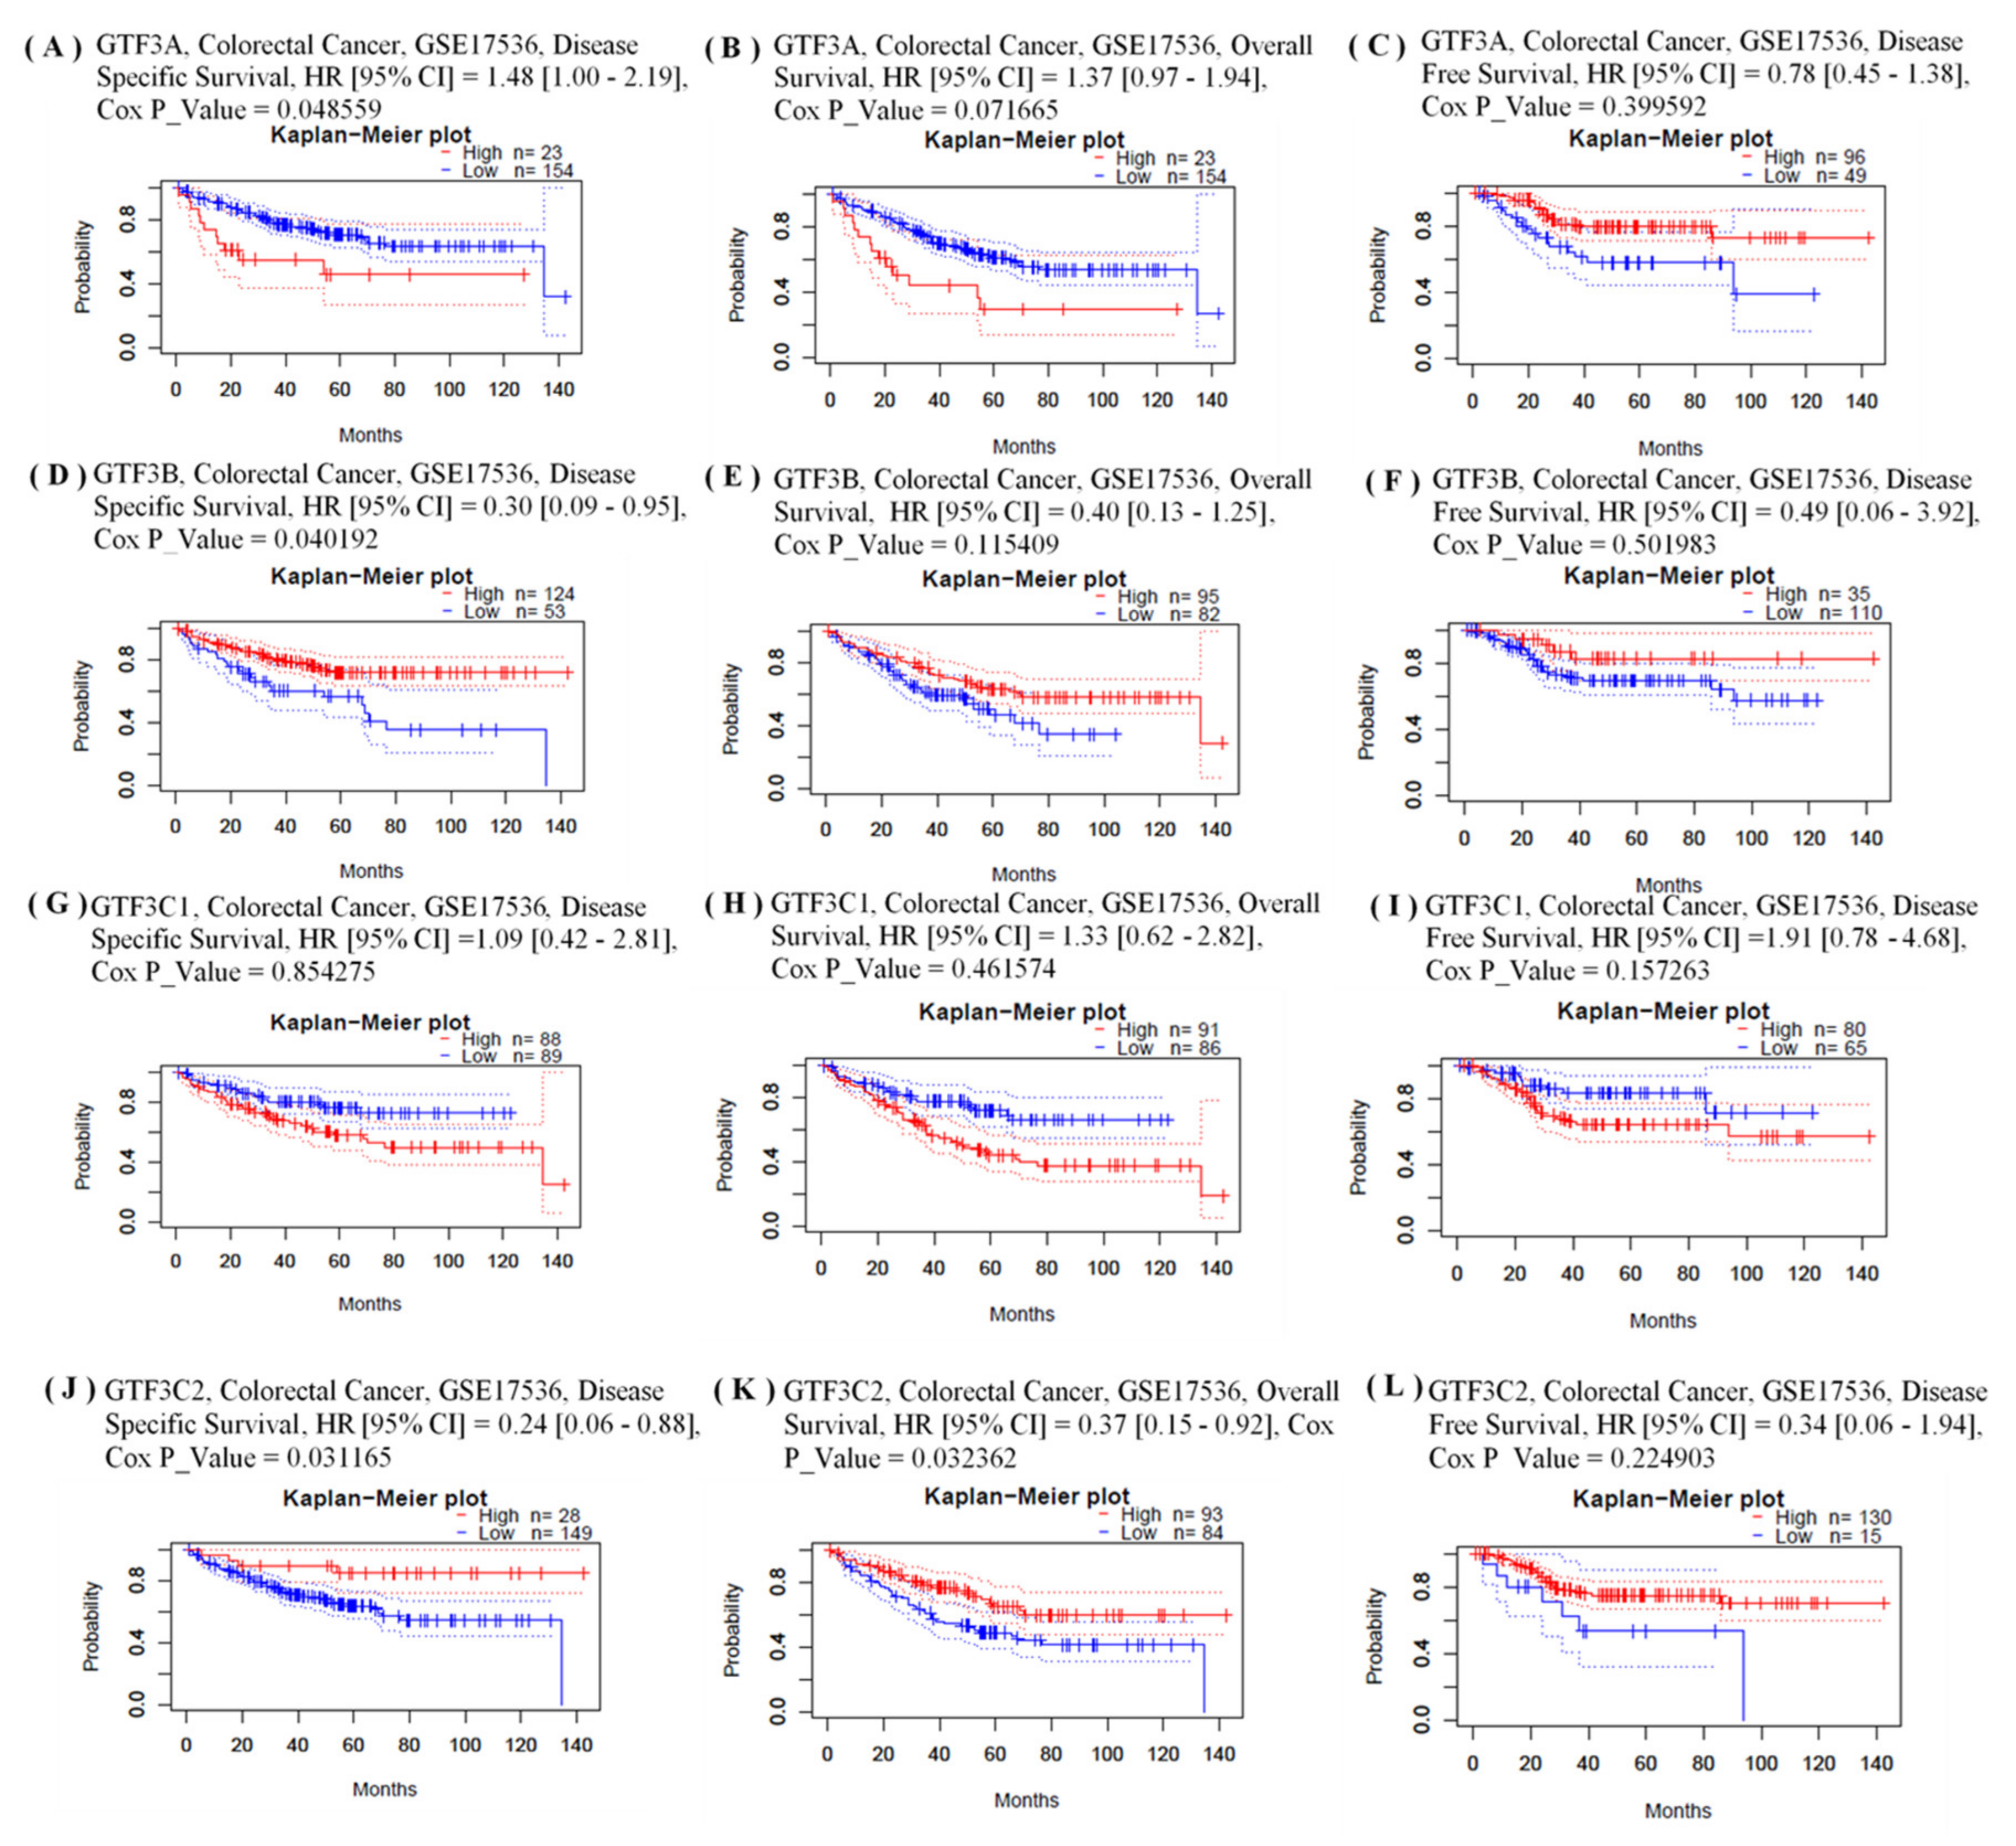
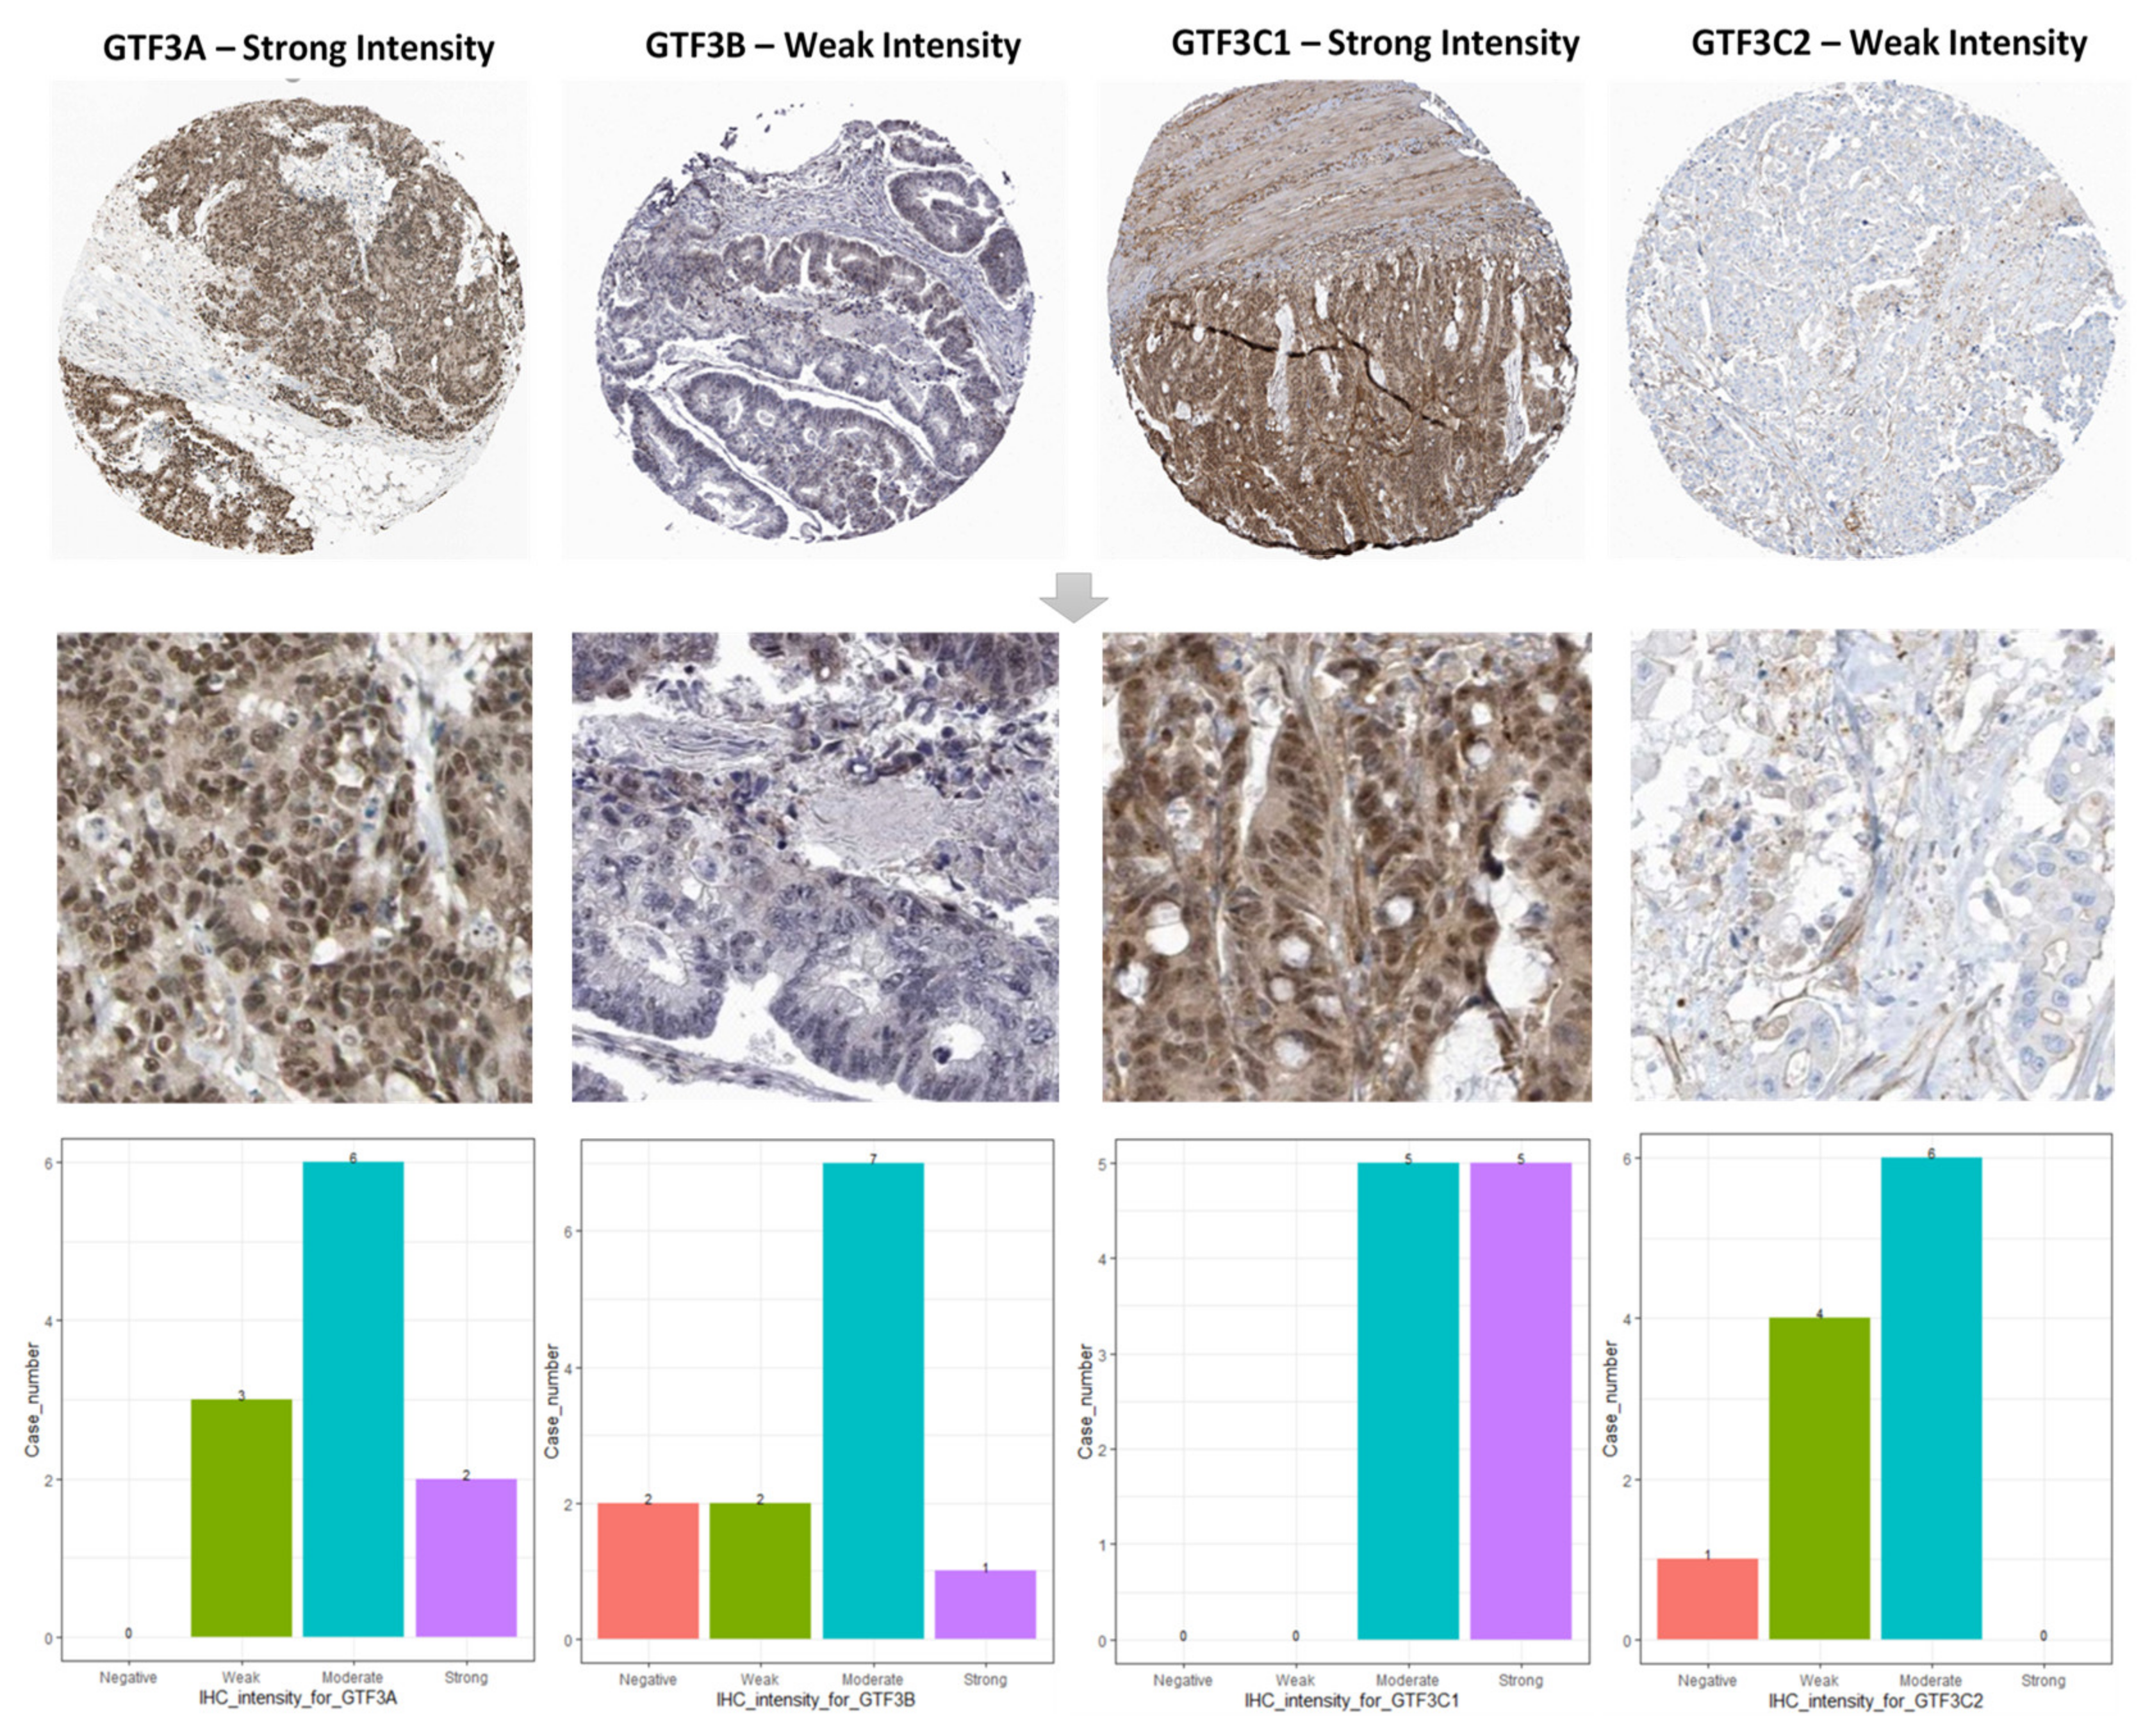
3.2. Prognostic Values and Protein Expressions of GTF3 Family Genes in CRC
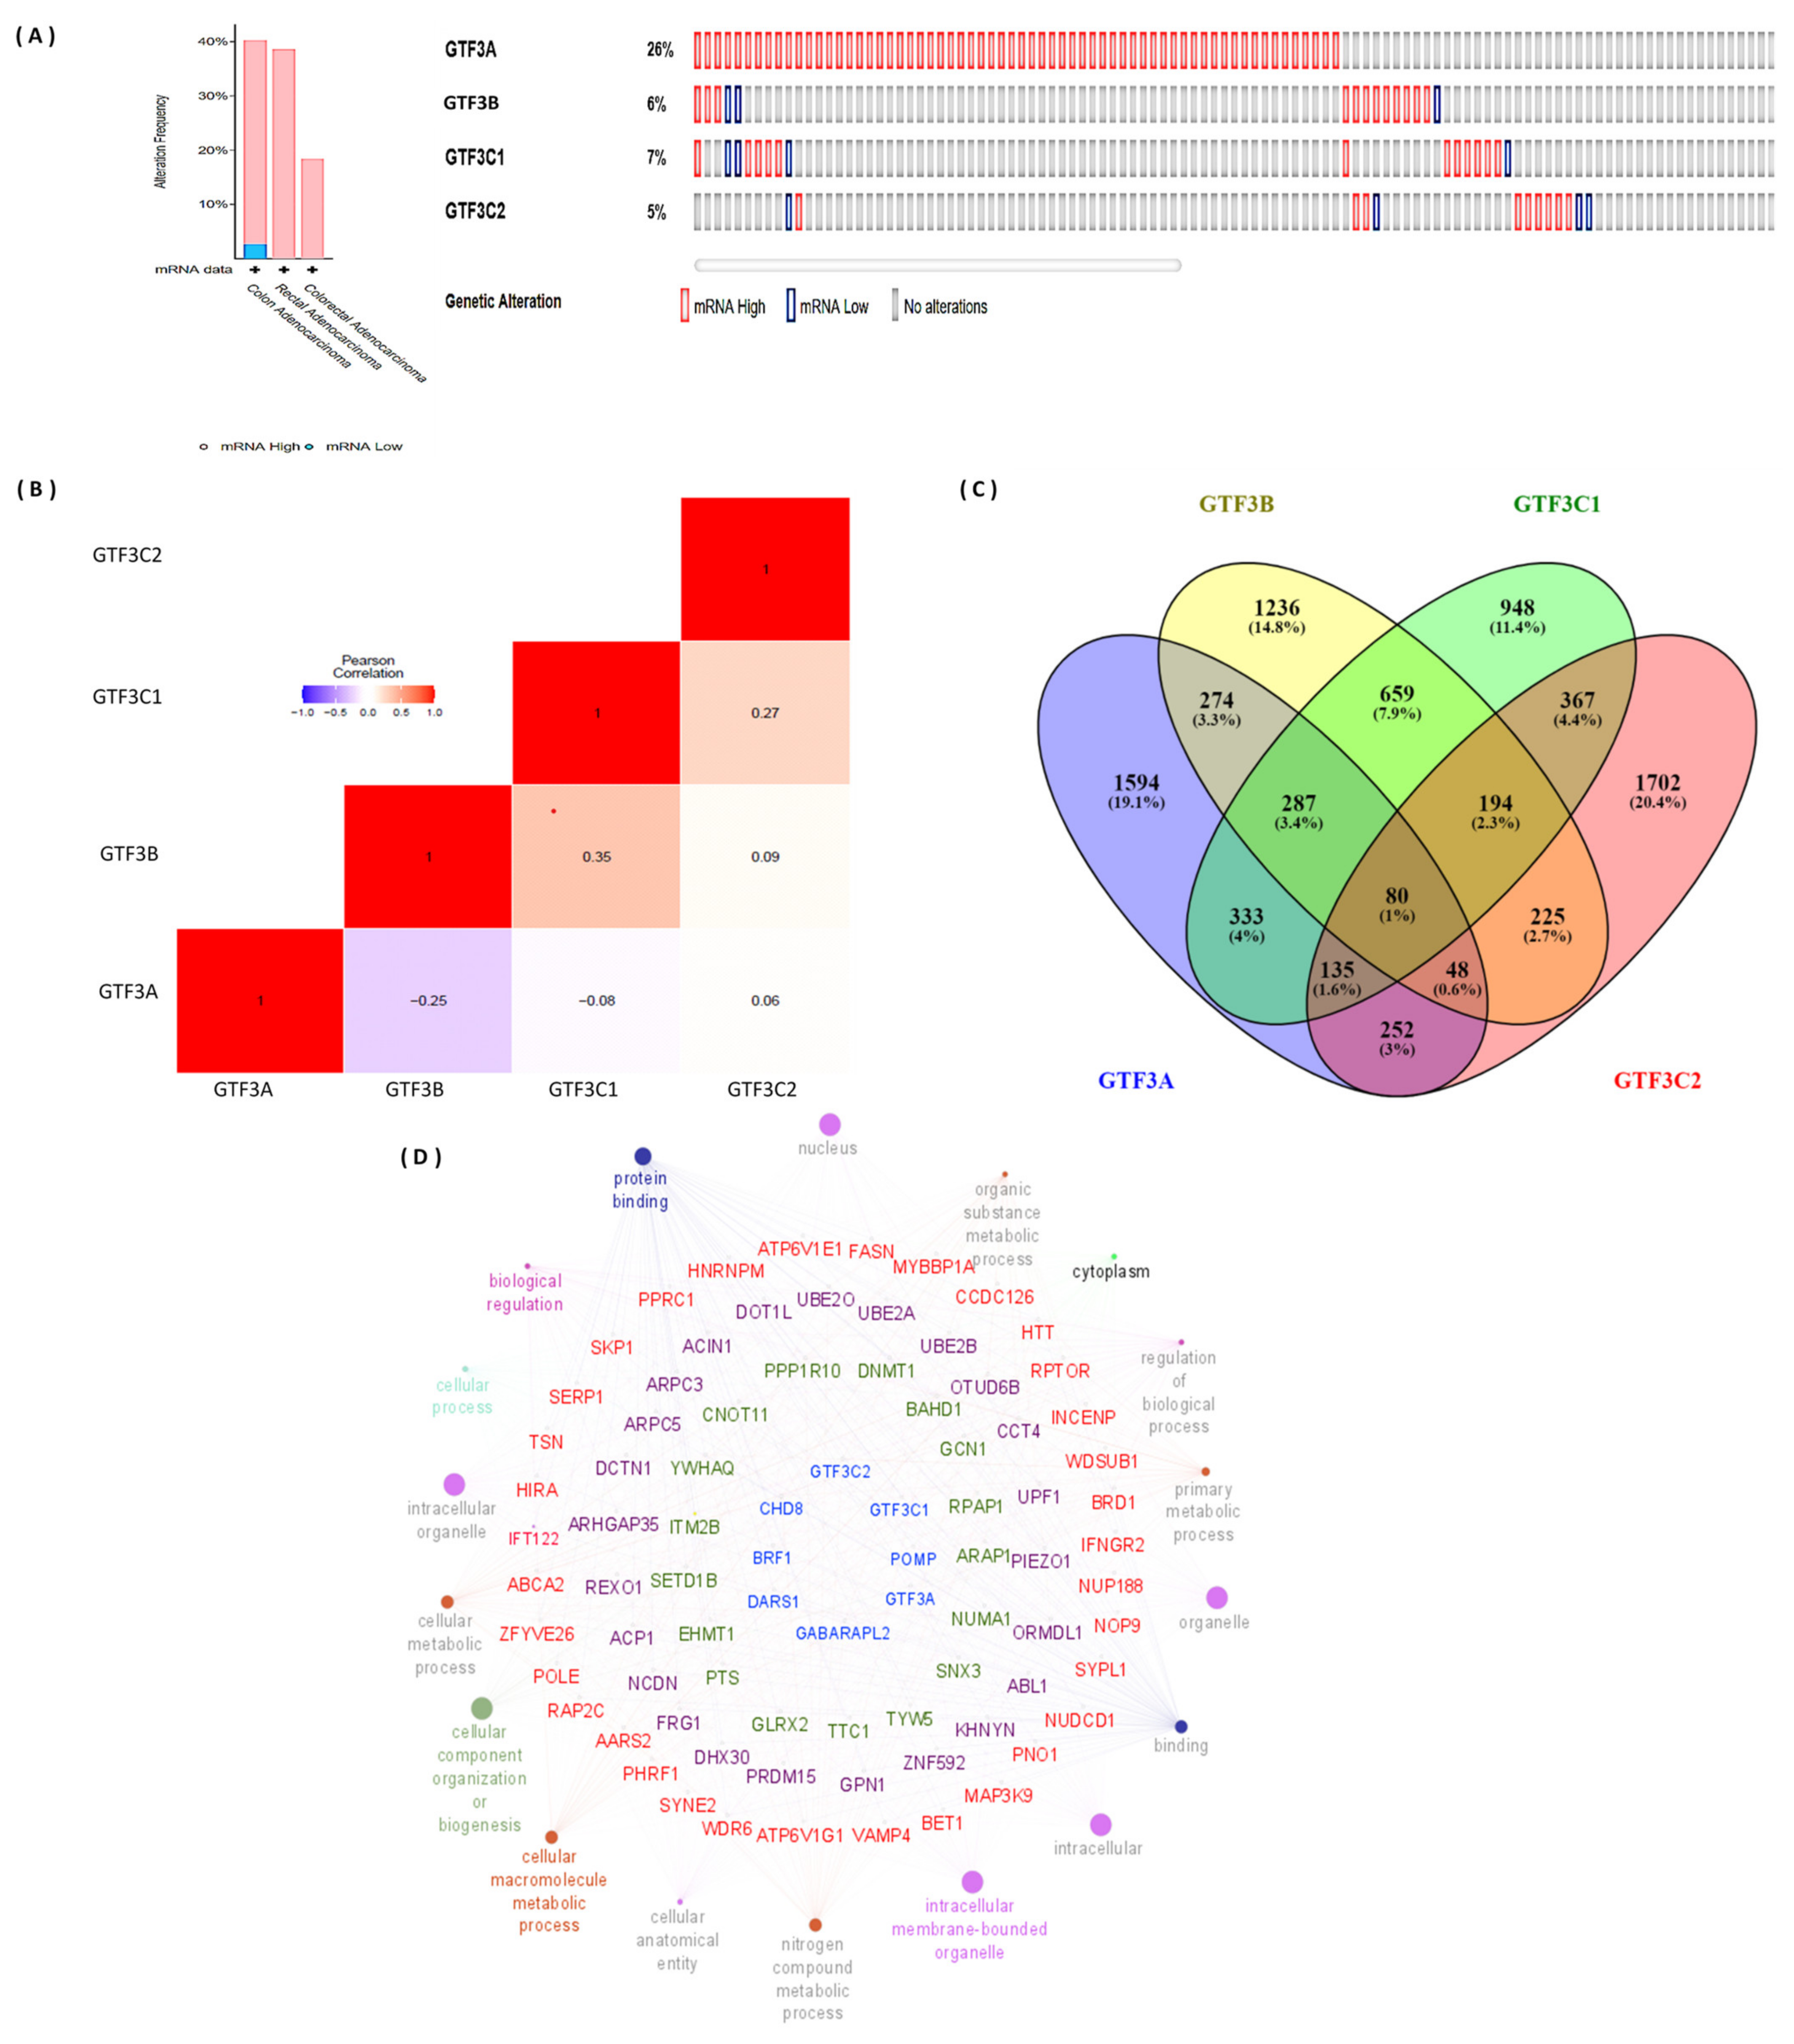
3.3. Genomic Alterations of GTF3 Family Gene Expressions in CRC
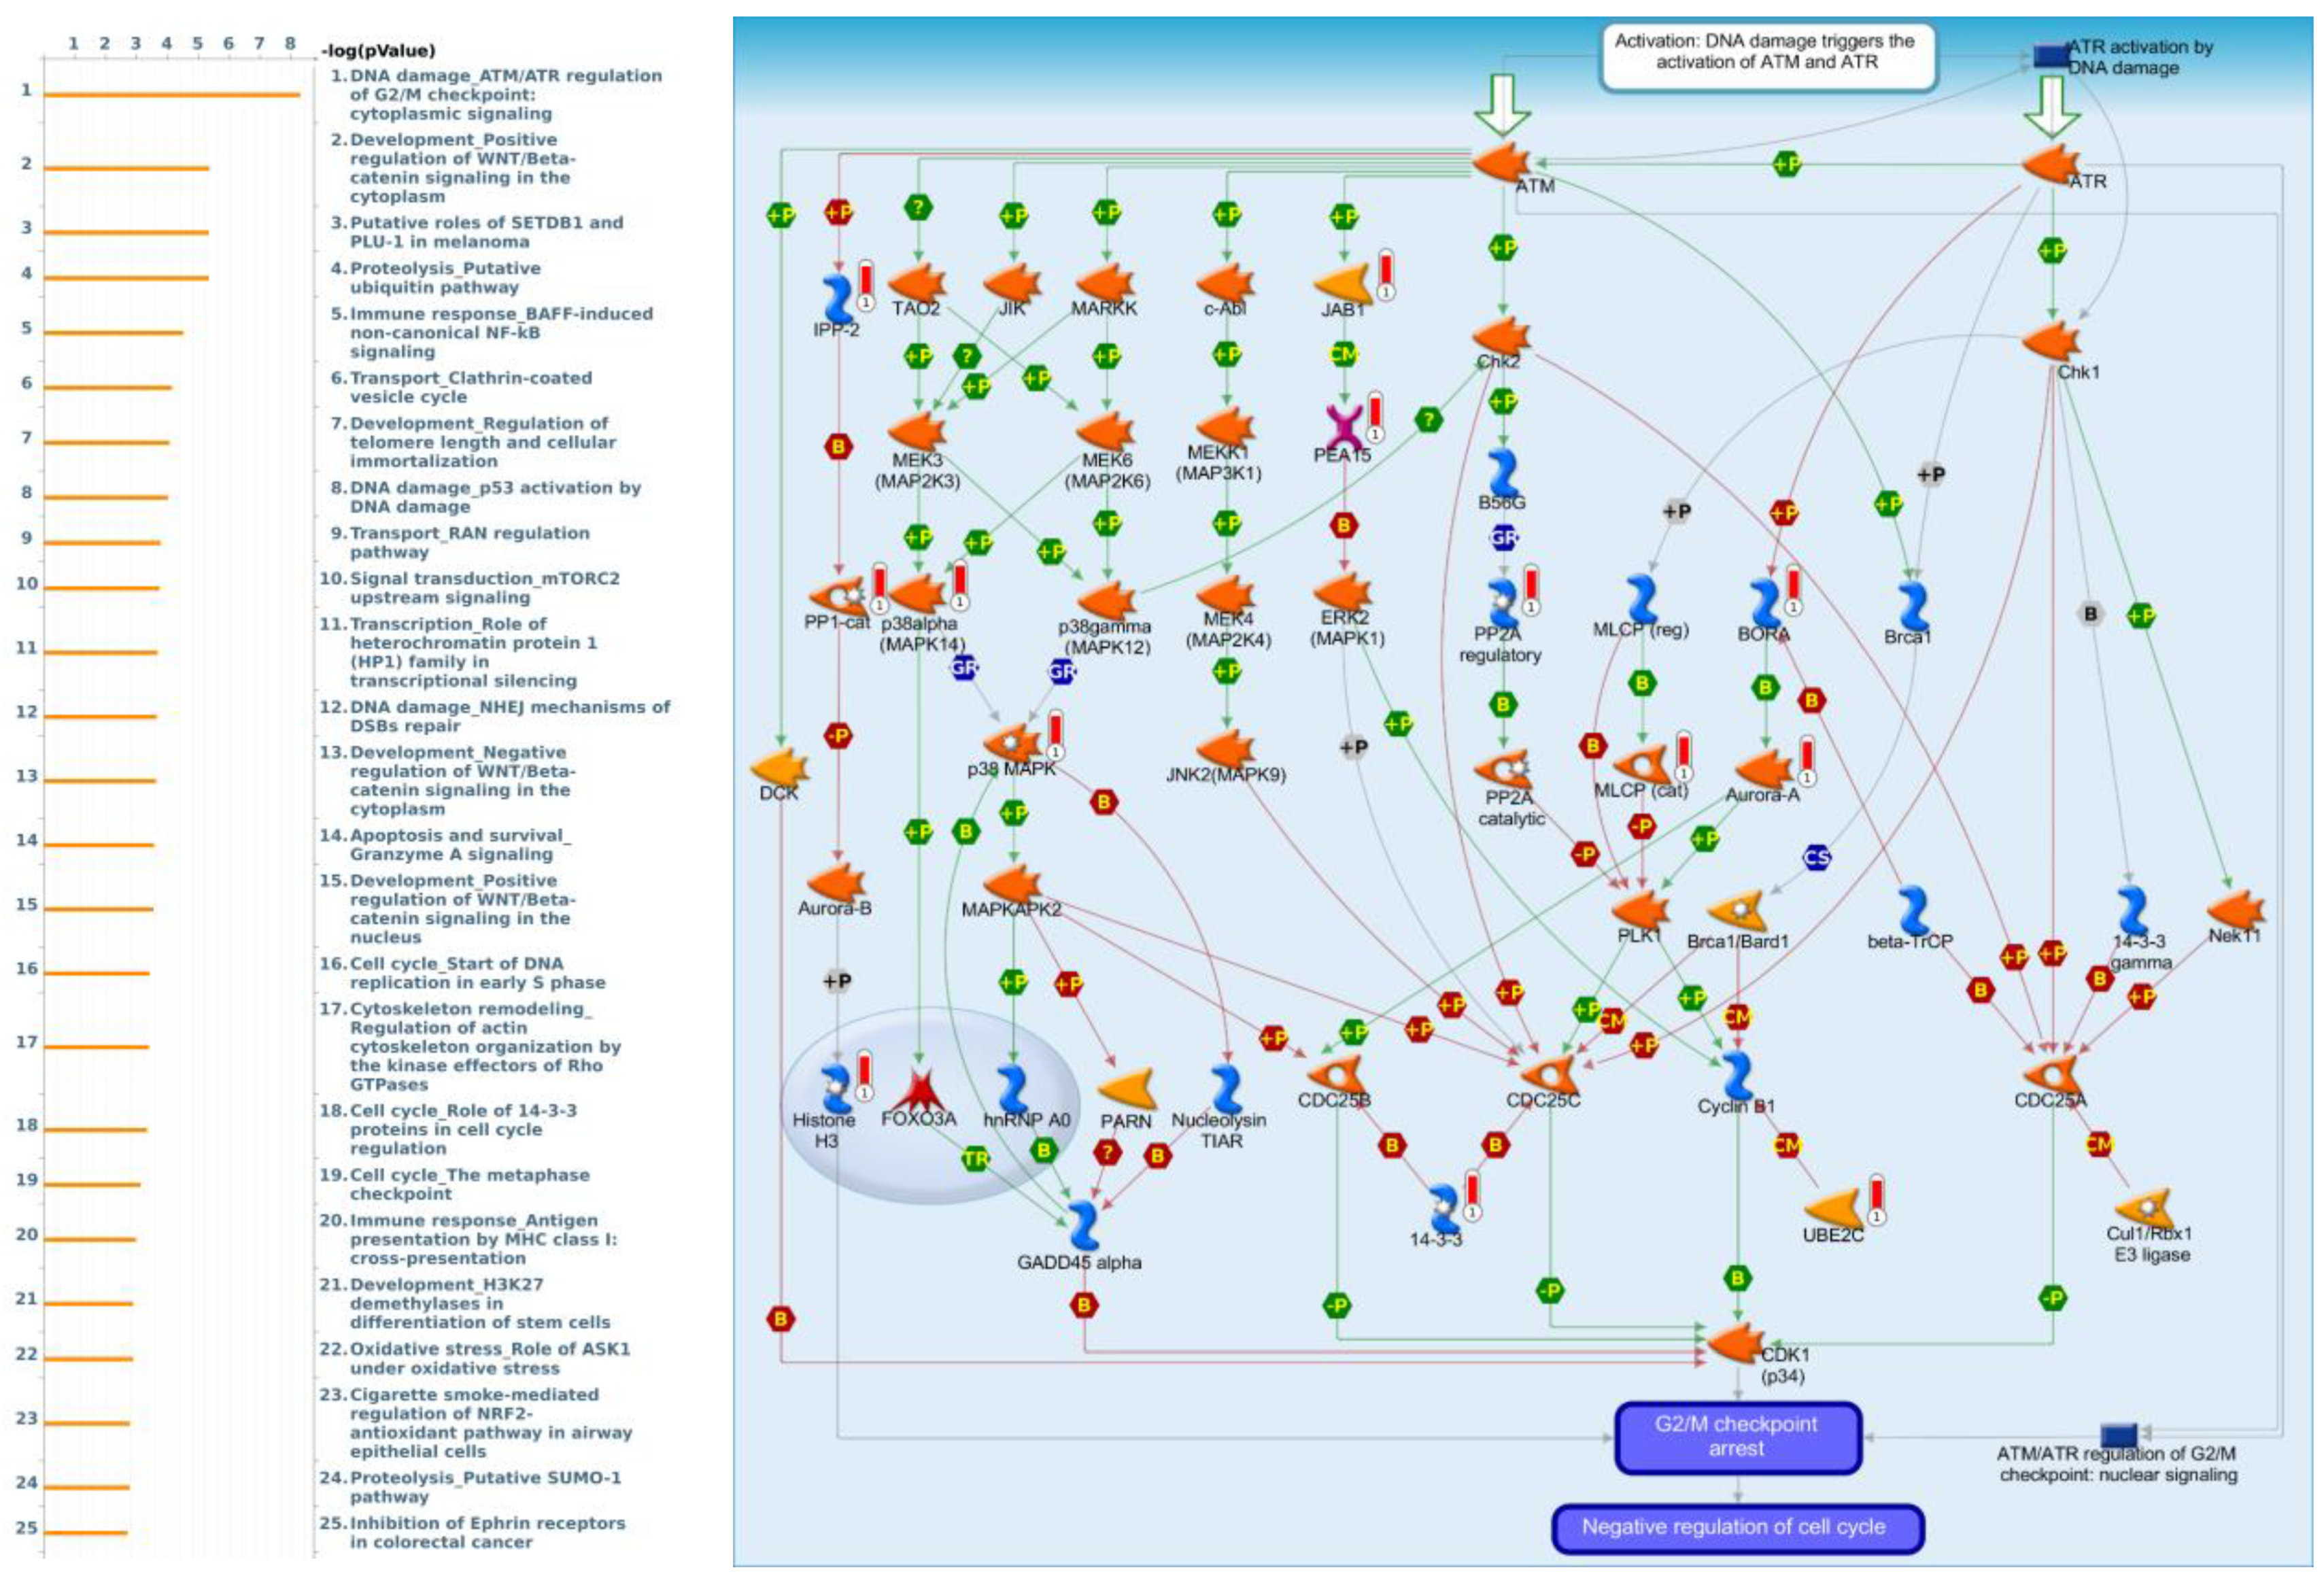
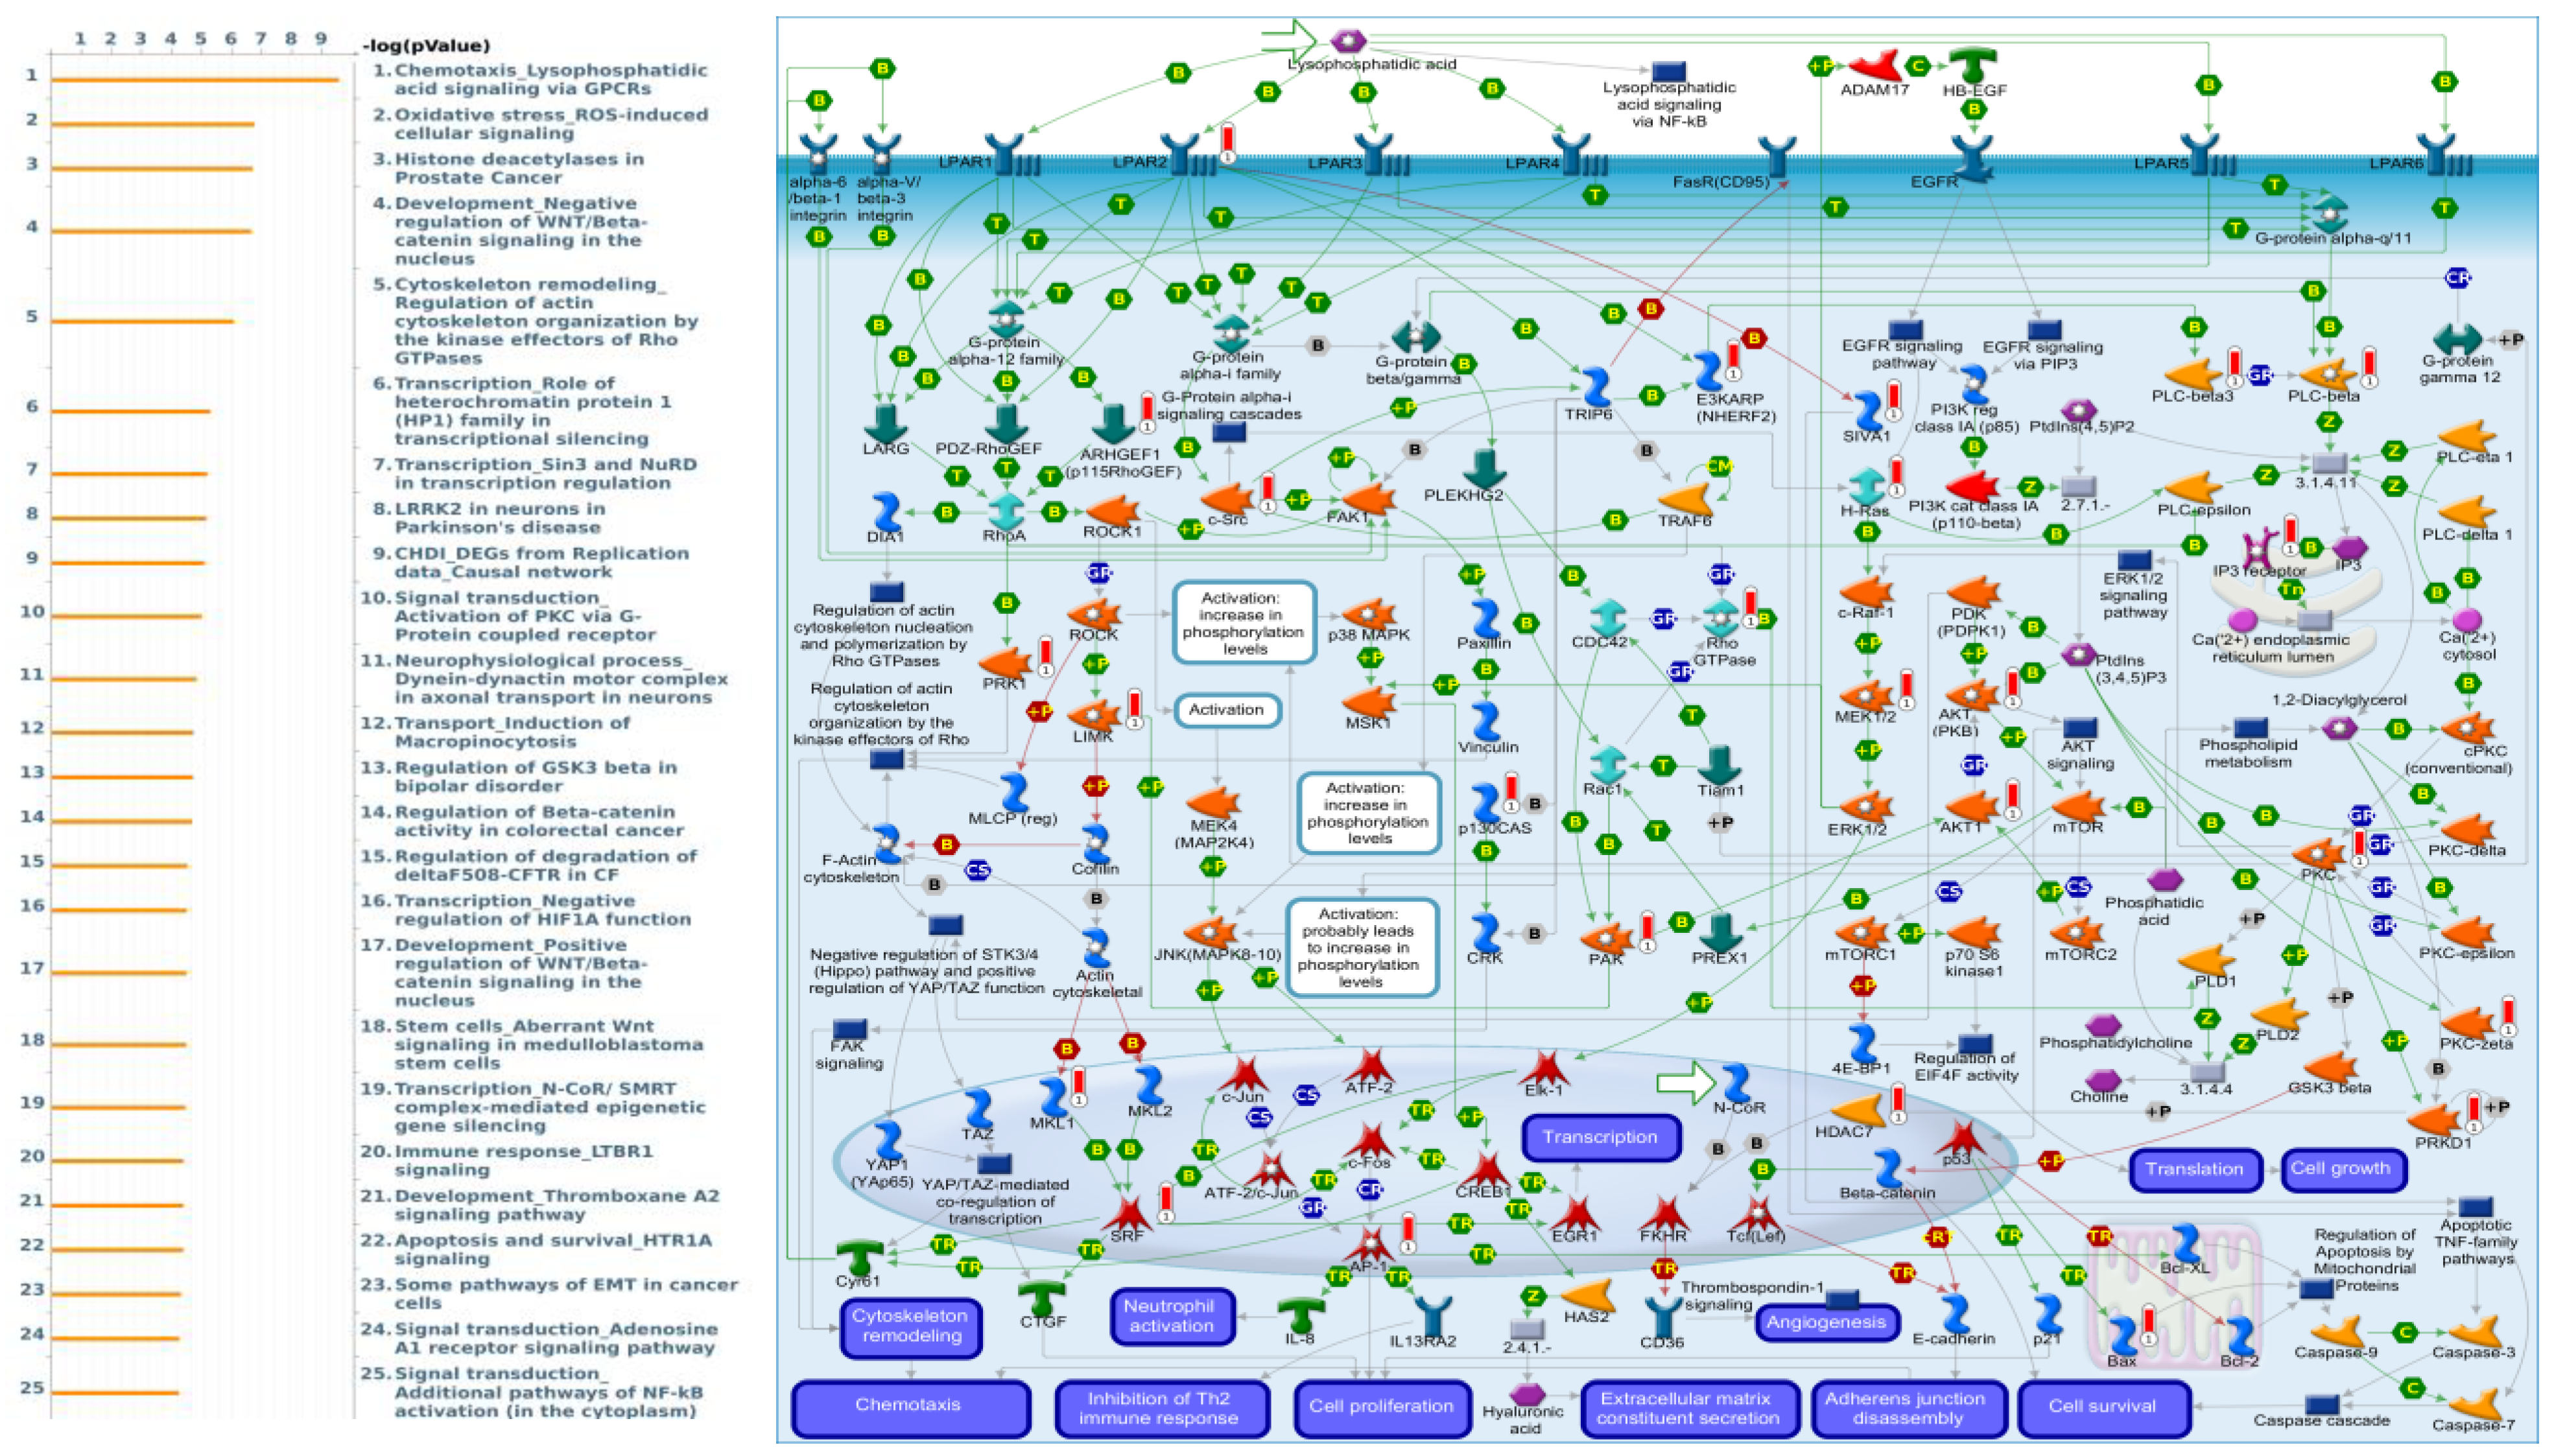
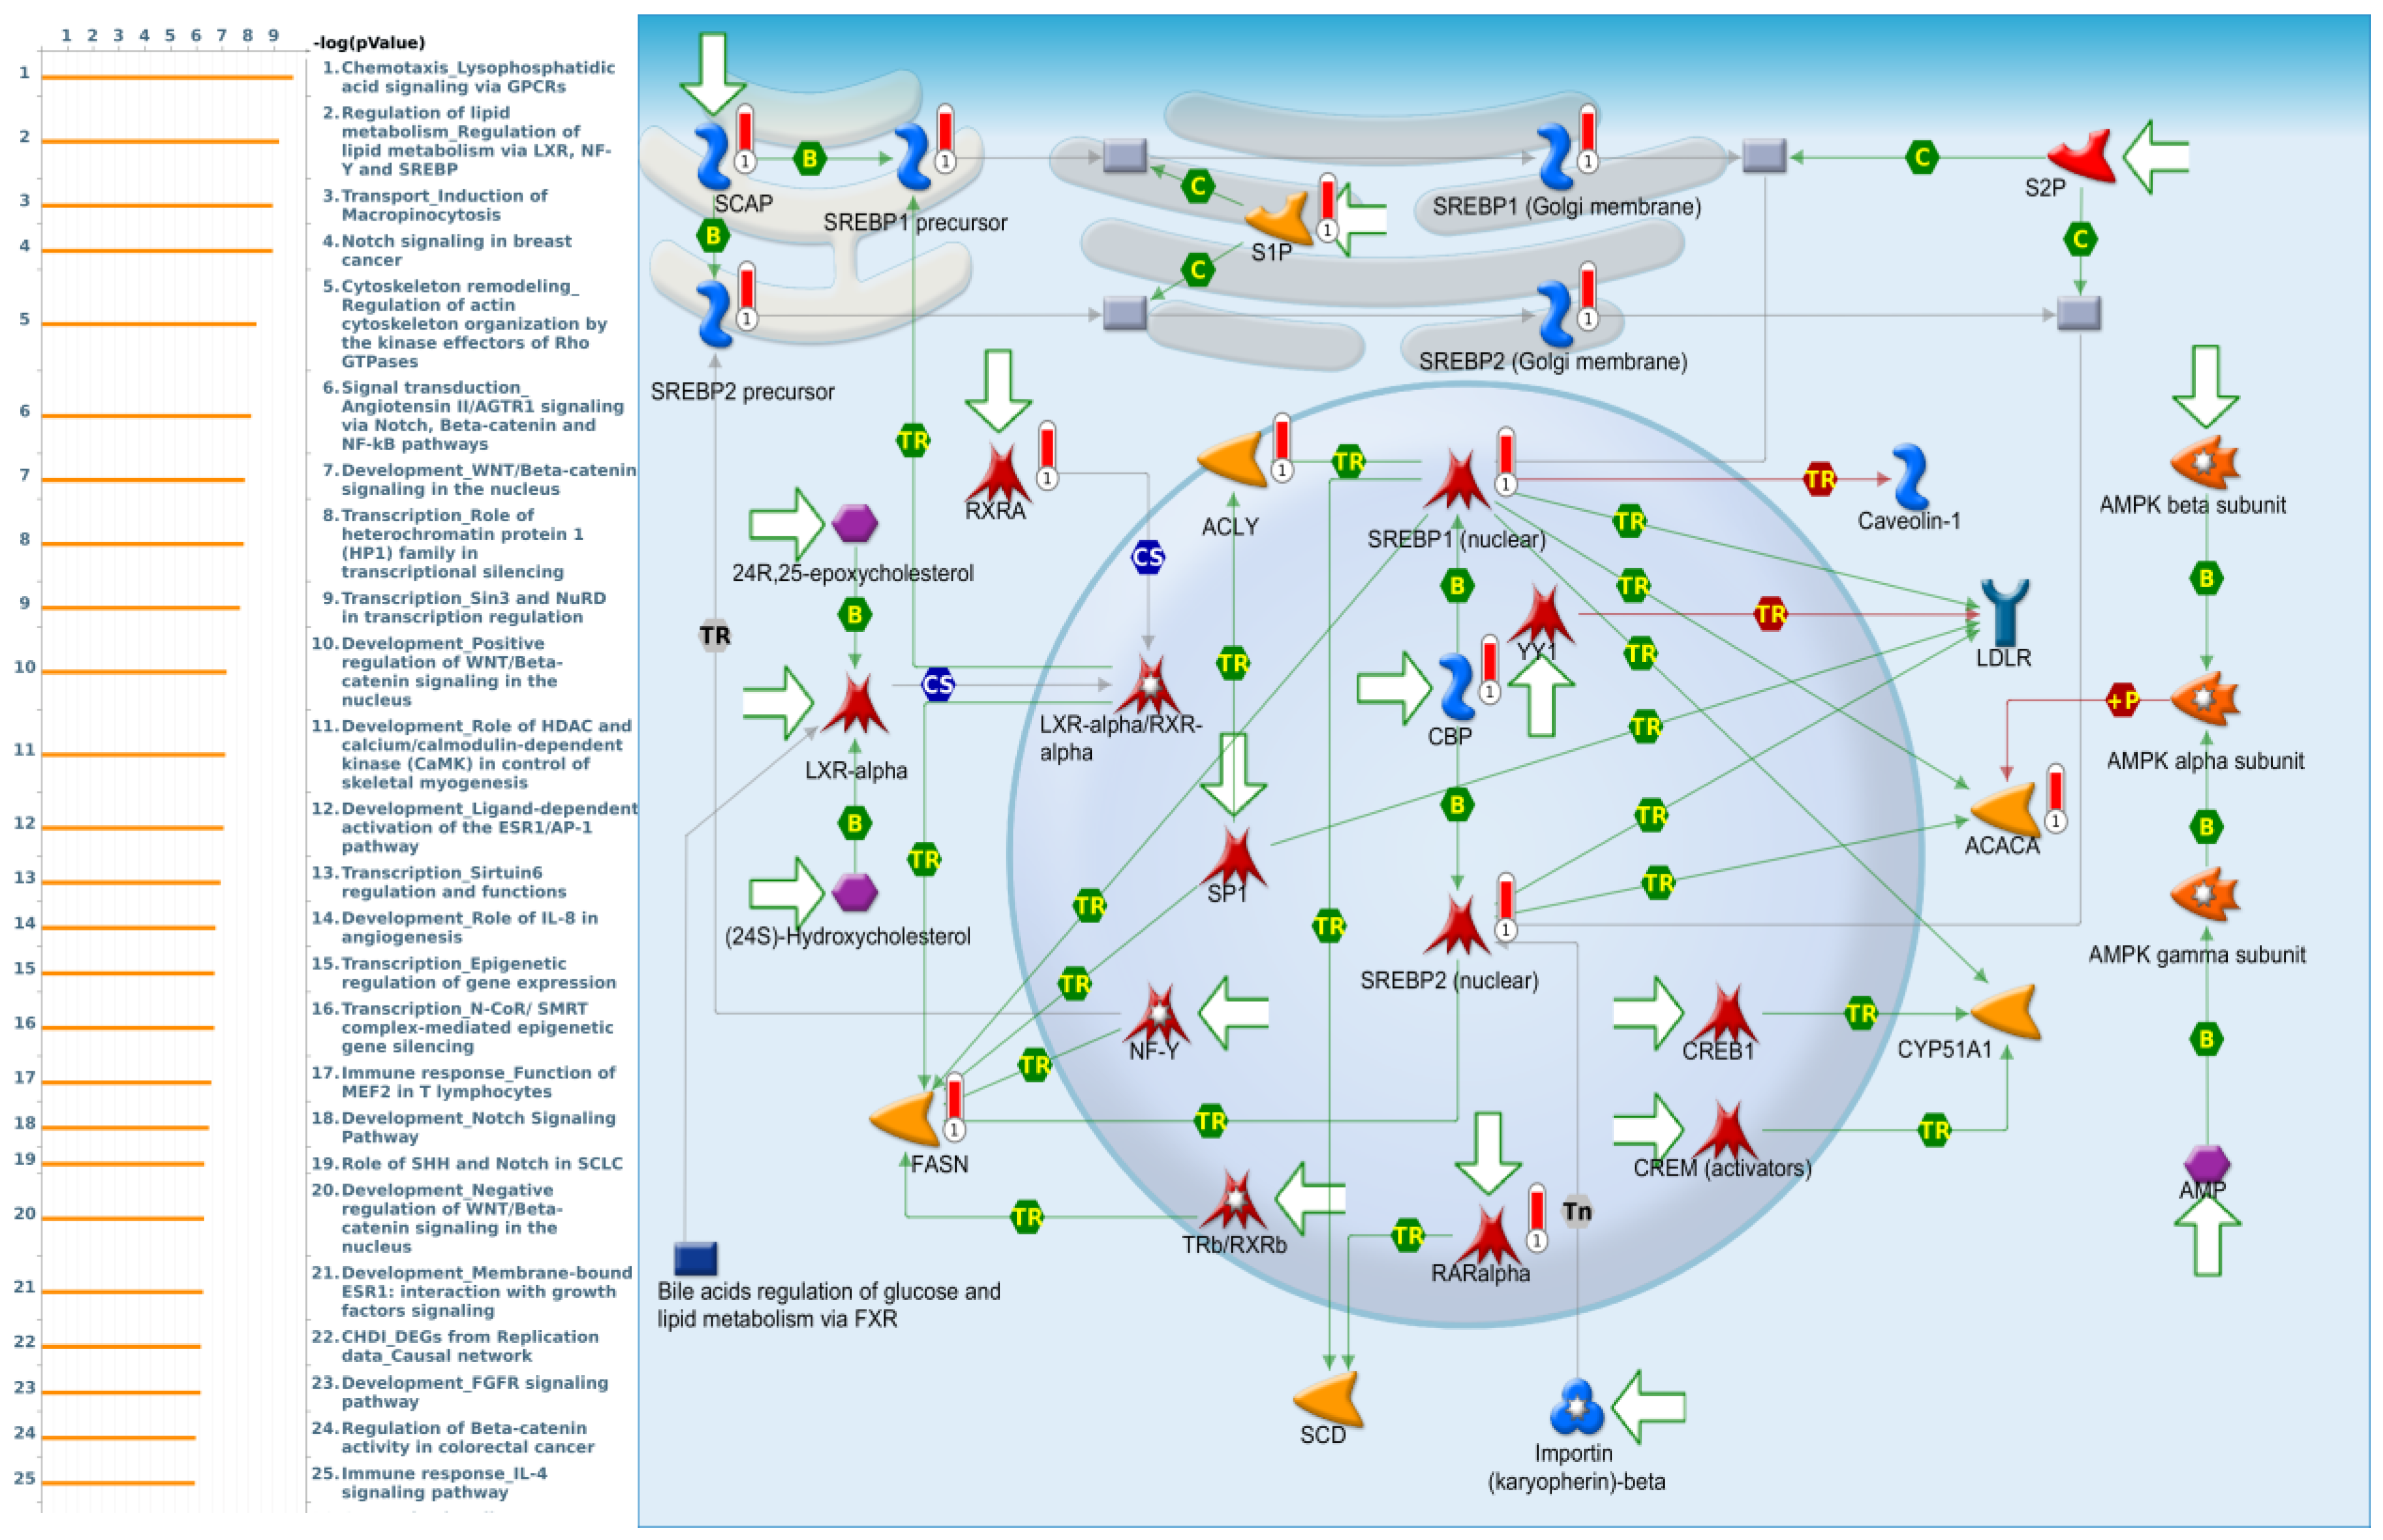
3.4. Pathway Enrichment Analysis
3.5. GTF Coexpressed Genes and Regulated Networks in TCGA Database
4. Discussion
5. Conclusions
Author Contributions
Funding
Data Availability Statement
Conflicts of Interest
References
- Sung, H.; Ferlay, J.; Siegel, R.L.; Laversanne, M.; Soerjomataram, I.; Jemal, A.; Bray, F. Global cancer statistics 2020: GLOBOCAN estimates of incidence and mortality worldwide for 36 cancers in 185 countries. CA Cancer J. Clin. 2021. [Google Scholar] [CrossRef]
- Siegel, R.L.; Miller, K.D.; Goding Sauer, A.; Fedewa, S.A.; Butterly, L.F.; Anderson, J.C.; Cercek, A.; Smith, R.A.; Jemal, A. Colorectal cancer statistics. CA Cancer J. Clin. 2020, 70, 145–164. [Google Scholar] [CrossRef] [Green Version]
- Bishehsari, F.; Mahdavinia, M.; Vacca, M.; Malekzadeh, R.; Mariani-Costantini, R. Epidemiological transition of colorectal cancer in developing countries: Environmental factors, molecular pathways, and opportunities for prevention. World J. Gastroenterol. 2014, 20, 6055–6072. [Google Scholar] [CrossRef] [PubMed]
- Kuipers, E.J.; Grady, W.M.; Lieberman, D.; Seufferlein, T.; Sung, J.J. Colorectal cancer. Nat. Rev. Dis. Primers 2015, 1, 15065. [Google Scholar] [CrossRef] [PubMed] [Green Version]
- Yancik, R. Population aging and cancer: A cross-national concern. Cancer J. 2005, 11, 437–441. [Google Scholar] [CrossRef] [PubMed]
- Kuo, T.-T.; Chang, H.-Y.; Chen, T.-Y.; Liu, B.-C.; Chen, H.-Y.; Hsiung, Y.-C.; Hsia, S.-M.; Chang, C.-J.; Huang, T.-C. Melissa officinalis Extract Induces Apoptosis and Inhibits Migration in Human Colorectal Cancer Cells. ACS Omega 2020, 5. [Google Scholar] [CrossRef]
- Leung, S.W.; Chou, C.-J.; Huang, T.-C.; Yang, P.-M.A. integrated bioinformatics analysis repurposes an antihelminthic drug niclosamide for treating HMGA2-overexpressing human colorectal cancer. Cancers 2019, 11, 1482. [Google Scholar] [CrossRef] [PubMed] [Green Version]
- Huang, H.-L.; Liu, Y.-M.; Sung, T.-Y.; Huang, T.-C.; Cheng, Y.-W.; Liou, J.-P.; Pan, S.-L. TIMP3 expression associates with prognosis in colorectal cancer and its novel arylsulfonamide inducer, MPT0B390, inhibits tumor growth, metastasis and angiogenesis. Theranostics 2019, 9, 6676. [Google Scholar] [CrossRef] [PubMed]
- Lee, C.-H.; Lin, Y.-F.; Chen, Y.-C.; Wong, S.-M.; Juan, S.-H.; Huang, H.-M. MPT0B169 and MPT0B002, new tubulin inhibitors, induce growth inhibition, G2/M cell cycle arrest, and apoptosis in human colorectal cancer cells. Pharmacology 2018, 102, 262–271. [Google Scholar] [CrossRef] [PubMed]
- Lee, W.-R.; Shen, S.-C.; Shih, Y.-H.; Chou, C.-L.; Tseng, J.T.-P.; Chin, S.-Y.; Liu, K.-H.; Chen, Y.-C.; Jiang, M.-C. Early decline in serum phospho-CSE1L levels in vemurafenib/sunitinib-treated melanoma and sorafenib/lapatinib-treated colorectal tumor xenografts. J. Transl. Med. 2015, 13, 1–12. [Google Scholar] [CrossRef] [PubMed] [Green Version]
- Chien, C.-C.; Wu, M.-S.; Shen, S.-C.; Ko, C.-H.; Chen, C.-H.; Yang, L.-L.; Chen, Y.-C. Activation of JNK contributes to evodiamine-induced apoptosis and G 2/M arrest in human colorectal carcinoma cells: A structure-activity study of evodiamine. PLoS ONE 2014, 9, 99729. [Google Scholar] [CrossRef] [PubMed]
- Nguyen, T.T.; Le, N.Q.; Ho, Q.T.; Phan, D.V.; Ou, Y.Y. TNFPred: Identifying tumor necrosis factors using hybrid features based on word embeddings. BMC Med. Genomics. 2020, 13, 155. [Google Scholar] [CrossRef] [PubMed]
- Hsu, J.B.; Lee, G.A.; Chang, T.H.; Huang, S.W.; Le, N.Q.K.; Chen, Y.C.; Kuo, D.P.; Li, Y.T.; Chen, C.Y. Radiomic Immunophenotyping of GSEA-Assessed Immunophenotypes of Glioblastoma and Its Implications for Prognosis: A Feasibility Study. Cancers 2020, 12, 3039. [Google Scholar] [CrossRef] [PubMed]
- Nagarajan, N.; Yapp, E.K.Y.; Le, N.Q.K.; Kamaraj, B.; Al-Subaie, A.M.; Yeh, H.Y. Application of Computational Biology and Artificial Intelligence Technologies in Cancer Precision Drug Discovery. Biomed. Res. Int. 2019, 2019, 8427042. [Google Scholar] [CrossRef] [Green Version]
- Lee, T.Y.; Huang, K.Y.; Chuang, C.H.; Lee, C.Y.; Chang, T.H. Incorporating deep learning and multi-omics autoencoding for analysis of lung adenocarcinoma prognostication. Comput. Biol. Chem. 2020, 87, 107277. [Google Scholar] [CrossRef] [PubMed]
- Yadav, V.K.; Lee, T.Y.; Hsu, J.B.; Huang, H.D.; Yang, W.V.; Chang, T.H. Computational analysis for identification of the extracellular matrix molecules involved in endometrial cancer progression. PLoS ONE 2020, 15, e0231594. [Google Scholar] [CrossRef] [Green Version]
- Chang, Y.A.; Weng, S.L.; Yang, S.F.; Chou, C.H.; Huang, W.C.; Tu, S.J.; Chang, T.H.; Huang, C.N.; Jong, Y.J.; Huang, H.D. A Three-MicroRNA Signature as a Potential Biomarker for the Early Detection of Oral Cancer. Int. J. Mol. Sci. 2018, 19, 758. [Google Scholar] [CrossRef] [PubMed] [Green Version]
- Barrett, T.; Wilhite, S.E.; Ledoux, P.; Evangelista, C.; Kim, I.F.; Tomashevsky, M.; Marshall, K.A.; Phillippy, K.H.; Sherman, P.M.; Holko, M. NCBI GEO: Archive for functional genomics data sets—update. Nucleic Acids Res. 2012, 41, 991–995. [Google Scholar] [CrossRef] [PubMed] [Green Version]
- Rhodes, D.R.; Kalyana-Sundaram, S.; Mahavisno, V.; Varambally, R.; Yu, J.; Briggs, B.B.; Barrette, T.R.; Anstet, M.J.; Kincead-Beal, C.; Kulkarni, P.; et al. Oncomine 3.0: Genes, pathways, and networks in a collection of 18,000 cancer gene expression profiles. Neoplasia 2007, 9, 166–180. [Google Scholar] [CrossRef] [Green Version]
- Liu, T.-P.; Hong, Y.-H.; Tung, K.-Y.; Yang, P.-M. In silico and experimental analyses predict the therapeutic value of an EZH2 inhibitor GSK343 against hepatocellular carcinoma through the induction of metallothionein genes. Oncoscience 2016, 3, 9. [Google Scholar] [CrossRef]
- Hsieh, Y.-Y.; Liu, T.-P.; Yang, P.M. In silico repurposing the Rac1 inhibitor NSC23766 for treating PTTG1-high expressing clear cell renal carcinoma. Pathol. Res. Pract. 2019, 215, 152373. [Google Scholar] [CrossRef] [PubMed]
- Yang, P.-M.; Lin, L.-S.; Liu, T.P. Sorafenib inhibits ribonucleotide reductase regulatory subunit M2 (RRM2) in hepatocellular carcinoma cells. Biomolecules 2020, 10, 117. [Google Scholar] [CrossRef] [PubMed] [Green Version]
- Arakawa, H.; Nagase, H.; Hayashi, N.; Ogawa, M.; Nagata, M.; Fujiwara, T.; Takahashi, E.; Shin, S.; Nakamura, Y. Molecular cloning, characterization, and chromosomal mapping of a novel human gene (GTF3A) that is highly homologous to Xenopus transcription factor IIIA. Cytogenet. Cell Genet. 1995, 70, 235–238. [Google Scholar] [CrossRef]
- Kim, J.Y.; Jung, H.H.; Sohn, I.; Woo, S.Y.; Cho, H.; Cho, E.Y.; Lee, J.E.; Kim, S.W.; Nam, S.J.; Park, Y.H.; et al. Prognostication of a 13-immune-related-gene signature in patients with early triple-negative breast cancer. Breast Cancer Res. Treat. 2020, 184, 325–334. [Google Scholar] [CrossRef] [PubMed]
- Tang, Z.; Li, C.; Kang, B.; Gao, G.; Li, C.; Zhang, Z. GEPIA: A web server for cancer and normal gene expression profiling and interactive analyses. Nucleic Acids Res. 2017, 45, 98–102. [Google Scholar] [CrossRef] [PubMed] [Green Version]
- Chen, P.S.; Hsu, H.P.; Phan, N.N.; Yen, M.C.; Chen, F.W.; Liu, Y.W.; Lin, F.P.; Feng, S.Y.; Cheng, T.L.; Yeh, P.H.; et al. CCDC167 as a potential therapeutic target and regulator of cell cycle-related networks in breast cancer. Aging 2021, 12, 4157. [Google Scholar] [CrossRef] [PubMed]
- Wu, P.S.; Yen, J.H.; Wang, C.Y.; Chen, P.Y.; Hung, J.H.; Wu, M.J. 8-Hydroxydaidzein, an Isoflavone from Fermented Soybean, Induces Autophagy, Apoptosis, Differentiation, and Degradation of Oncoprotein BCR-ABL in K562 Cells. Biomedicines 2020, 8, 506. [Google Scholar] [CrossRef] [PubMed]
- Wu, C.C.; Ekanem, T.I.; Phan, N.N.; Loan, D.T.T.; Hou, S.Y.; Lee, K.H.; Wang, C.Y. Gene signatures and prognostic analyses of the Tob/BTG pituitary tumor-transforming gene (PTTG) family in clinical breast cancer patients. Int. J. Med. Sci. 2020, 17, 3112–3124. [Google Scholar] [CrossRef]
- Lin, Y.Y.; Wang, C.Y.; Phan, N.N.; Chiao, C.C.; Li, C.Y.; Sun, Z.; Hung, J.H.; Chen, Y.L.; Yen, M.C.; Weng, T.Y.; et al. PODXL2 maintains cellular stemness and promotes breast cancer development through the Rac1/Akt pathway. Int. J. Med. Sci. 2020, 17, 1639–1651. [Google Scholar] [CrossRef] [PubMed]
- Phan, N.N.; Liu, S.; Wang, C.Y.; Hsu, H.P.; Lai, M.D.; Li, C.Y.; Chen, C.F.; Chiao, C.C.; Yen, M.C.; Sun, Z.; et al. Overexpressed gene signature of EPH receptor A/B family in cancer patients-comprehensive analyses from the public high-throughput database. Int. J. Clin. Exp. Pathol. 2020, 13, 1220–1242. [Google Scholar] [PubMed]
- Barretina, J.; Caponigro, G.; Stransky, N.; Venkatesan, K.; Margolin, A.A.; Kim, S.; Wilson, C.J.; Lehar, J.; Kryukov, G.V.; Sonkin, D.; et al. The Cancer Cell Line Encyclopedia enables predictive modelling of anticancer drug sensitivity. Nature 2012, 483, 603–607. [Google Scholar] [CrossRef] [PubMed]
- Chen, B.; Lai, J.; Dai, D.; Chen, R.; Li, X.; Liao, N. JAK1 as a prognostic marker and its correlation with immune infiltrates in breast cancer. Aging 2019, 11, 11124. [Google Scholar] [CrossRef] [PubMed]
- Mizuno, H.; Kitada, K.; Nakai, K.; Sarai, A. PrognoScan: A new database for meta-analysis of the prognostic value of genes. BMC Med. Genomics. 2009, 2, 18. [Google Scholar] [CrossRef] [PubMed] [Green Version]
- Uhlen, M.; Bjorling, E.; Agaton, C.; Szigyarto, C.A.; Amini, B.; Andersen, E.; Andersson, A.C.; Angelidou, P.; Asplund, A.; Asplund, C.; et al. A human protein atlas for normal and cancer tissues based on antibody proteomics. Mol. Cell Proteomics. 2005, 4, 1920–1932. [Google Scholar] [CrossRef] [PubMed] [Green Version]
- Gao, J.; Aksoy, B.A.; Dogrusoz, U.; Dresdner, G.; Gross, B.; Sumer, S.O.; Sun, Y.; Jacobsen, A.; Sinha, R.; Larsson, E.; et al. Integrative analysis of complex cancer genomics and clinical profiles using the cBioPortal. Sci. Signal. 2013, 6, 1. [Google Scholar] [CrossRef] [Green Version]
- Jiang, H.H.; Zhang, Z.Y.; Wang, X.Y.; Tang, X.; Liu, H.L.; Wang, A.L.; Li, H.G.; Tang, E.J.; Lin, M.B. Prognostic significance of lymphovascular invasion in colorectal cancer and its association with genomic alterations. World J. Gastroenterol. 2019, 25, 2489–2502. [Google Scholar] [CrossRef]
- Anand, S.; Khan, M.A.; Khushman, M.; Dasgupta, S.; Singh, S.; Singh, A.P. Comprehensive Analysis of Expression, Clinicopathological Association and Potential Prognostic Significance of RABs in Pancreatic Cancer. Int. J. Mol. Sci. 2020, 21, 5580. [Google Scholar] [CrossRef]
- Yang, Q.; Wang, S.; Dai, E.; Zhou, S.; Liu, D.; Liu, H.; Meng, Q.; Jiang, B.; Jiang, W. Pathway enrichment analysis approach based on topological structure and updated annotation of pathway. Brief. Bioinform. 2019, 20, 168–177. [Google Scholar] [CrossRef]
- Wang, C.Y.; Chiao, C.C.; Phan, N.N.; Li, C.Y.; Sun, Z.D.; Jiang, J.Z.; Hung, J.H.; Chen, Y.L.; Yen, M.C.; Weng, T.Y.; et al. Gene signatures and potential therapeutic targets of amino acid metabolism in estrogen receptor-positive breast cancer. Am. J. Cancer Res. 2020, 10, 95–113. [Google Scholar] [PubMed]
- Wu, Y.H.; Yeh, I.J.; Phan, N.N.; Yen, M.C.; Liu, H.L.; Wang, C.Y.; Hsu, H.P. Severe acute respiratory syndrome coronavirus (SARS-CoV)-2 infection induces dysregulation of immunity: In silico gene expression analysis. Int. J. Med. Sci. 2021, 18, 1143–1152. [Google Scholar] [CrossRef] [PubMed]
- Wang, C.Y.; Chao, Y.J.; Chen, Y.L.; Wang, T.W.; Phan, N.N.; Hsu, H.P.; Shan, Y.S.; Lai, M.D. Upregulation of peroxisome proliferator-activated receptor-α and the lipid metabolism pathway promotes carcinogenesis of ampullary cancer. Int. J. Med. Sci. 2021, 18, 256–269. [Google Scholar] [CrossRef] [PubMed]
- Cheng, L.C.; Chao, Y.J.; Wang, C.Y.; Phan, N.N.; Chen, Y.L.; Wang, T.W.; Hsu, H.P.; Lin, Y.J.; Shan, Y.S.; Lai, M.D. Cancer-Derived Transforming Growth Factor-β Modulates Tumor-Associated Macrophages in Ampullary Cancer. Onco. Targets Ther. 2020, 13, 7503–7516. [Google Scholar] [CrossRef] [PubMed]
- Liu, H.L.; Yeh, I.J.; Phan, N.N.; Wu, Y.H.; Yen, M.C.; Hung, J.H.; Chiao, C.C.; Chen, C.F.; Sun, Z.; Jiang, J.Z.; et al. Gene signatures of SARS-CoV/SARS-CoV-2-infected ferret lungs in short- and long-term models. Infect. Genet. Evol. 2020, 85, 1044. [Google Scholar] [CrossRef]
- Shannon, P.; Markiel, A.; Ozier, O.; Baliga, N.S.; Wang, J.T.; Ramage, D.; Amin, N.; Schwikowski, B.; Ideker, T. Cytoscape: A software environment for integrated models of biomolecular interaction networks. Genome Res. 2003, 13, 2498–2504. [Google Scholar] [CrossRef] [PubMed]
- Smith, J.J.; Deane, N.G.; Wu, F.; Merchant, N.B.; Zhang, B.; Jiang, A.; Lu, P.; Johnson, J.C.; Schmidt, C.; Bailey, C.E. Experimentally derived metastasis gene expression profile predicts recurrence and death in patients with colon cancer. Gastroenterology 2010, 138, 958–968. [Google Scholar] [CrossRef] [PubMed] [Green Version]
- Liu, Y.; Cao, J.; Zhu, Y.N.; Ma, Y.; Murtaza, G.; Li, Y.; Wang, J.H.; Pu, Y.S. C1222C Deletion in Exon 8 of ABL1 Is Involved in Carcinogenesis and Cell Cycle Control. of Colorectal Cancer Through IRS1/PI3K/Akt Pathway. Front Oncol. 2020, 10, 1385. [Google Scholar] [CrossRef] [PubMed]
- Douglas, J.K.; Callahan, R.E.; Hothem, Z.A.; Cousineau, C.S.; Kawak, S.; Thibodeau, B.J.; Bergeron, S.; Li, W.; Peeples, C.E.; Wasvary, H.J. Genomic variation as a marker of response to neoadjuvant therapy in locally advanced rectal cancer. Mol. Cell Oncol. 2020, 7, 1716618. [Google Scholar] [CrossRef] [PubMed]
- Xu, K.; Zhang, Y.Y.; Han, B.; Bai, Y.; Xiong, Y.; Song, Y.; Zhou, L.M. Suppression subtractive hybridization identified differentially expressed genes in colorectal cancer: microRNA-451a as a novel colorectal cancer-related gene. Tumour Biol. 2017, 39, 1010428317705504. [Google Scholar] [CrossRef] [Green Version]
- Jiang, Y.H.; Zhu, X.Y.; Guo, Z.Y.; Yang, Z.H. Increased long non-coding RNA ARAP1-AS1 expression and its prognostic significance in human gastric cancer: A preliminary study. Eur. Rev. Med. Pharmacol. Sci. 2020, 24, 1815–1820. [Google Scholar]
- Ye, Y.; Gu, B.; Wang, Y.; Shen, S.; Huang, W. YY1-Induced Upregulation of Long Noncoding RNA ARAP1-AS1 Promotes Cell Migration and Invasion in Colorectal Cancer Through the Wnt/beta-Catenin Signaling Pathway. Cancer Biother. Radiopharm. 2019, 34, 519–528. [Google Scholar] [CrossRef] [PubMed]
- Luo, Y.; Xie, C.; Brocker, C.N.; Fan, J.; Wu, X.; Feng, L.; Wang, Q.; Zhao, J.; Lu, D.; Tandon, M.; et al. Intestinal PPARalpha Protects Against Colon Carcinogenesis via Regulation of Methyltransferases DNMT1 and PRMT6. Gastroenterology 2019, 157, 744–759. [Google Scholar] [CrossRef] [PubMed]
- Kumamoto, T.; Yamada, K.; Yoshida, S.; Aoki, K.; Hirooka, S.; Eto, K.; Yanaga, K.; Yoshida, K. Impairment of DYRK2 by DNMT1mediated transcription augments carcinogenesis in human colorectal cancer. Int. J. Oncol. 2020, 56, 1529–1539. [Google Scholar] [PubMed]
- Bowler, E.H.; Smith-Vidal, A.; Lester, A.; Bell, J.; Wang, Z.; Bell, C.G.; Wang, Y.; Divecha, N.; Skipp, P.J.; Ewing, R.M. Deep proteomic analysis of Dnmt1 mutant/hypomorphic colorectal cancer cells reveals dysregulation of epithelial-mesenchymal transition and subcellular re-localization of Beta-Catenin. Epigenetics 2020, 15, 107–121. [Google Scholar] [CrossRef] [PubMed]
- Wang, C.; Ma, X.; Zhang, J.; Jia, X.; Huang, M. DNMT1 maintains the methylation of miR-152-3p to regulate TMSB10 expression, thereby affecting the biological characteristics of colorectal cancer cells. IUBMB Life 2020, 72, 2432–2443. [Google Scholar] [CrossRef]
- Han, G.; Wei, Z.; Cui, H.; Zhang, W.; Wei, X.; Lu, Z.; Bai, X. NUSAP1 gene silencing inhibits cell proliferation, migration and invasion through inhibiting DNMT1 gene expression in human colorectal cancer. Exp. Cell Res. 2018, 367, 216–221. [Google Scholar] [CrossRef] [PubMed]
- Yu, W.; Ling, J.; Yu, H.; Du, J.; Liu, T. AZGP1 suppresses the process of colorectal cancer after upregulating FASN expression via mTOR signal pathway. Gen. Physiol. Biophys. 2020, 39, 239–248. [Google Scholar] [CrossRef]
- Long, Q.Q.; Yi, Y.X.; Qiu, J.; Xu, C.J.; Huang, P.L. Fatty acid synthase (FASN) levels in serum of colorectal cancer patients: Correlation with clinical outcomes. Tumour Biol. 2014, 35, 3855–3859. [Google Scholar] [CrossRef] [PubMed]
- Makondi, P.T.; Lee, C.-H.; Huang, C.-Y.; Chu, C.-M.; Chang, Y.-J.; Wei, P.-L. Prediction of novel target genes and pathways involved in bevacizumab-resistant colorectal cancer. PLoS ONE 2018, 13, e0189582. [Google Scholar] [CrossRef] [PubMed]
- Makondi, P.T.; Wei, P.-L.; Huang, C.-Y.; Chang, Y.-J. Development of novel predictive miRNA/target gene pathways for colorectal cancer distance metastasis to the liver using a bioinformatic approach. PLoS ONE 2019, 14, e0211968. [Google Scholar] [CrossRef] [PubMed] [Green Version]
- Chang, T.-C.; Wei, P.-L.; Makondi, P.T.; Chen, W.-T.; Huang, C.-Y.; Chang, Y.-J. Bromelain inhibits the ability of colorectal cancer cells to proliferate via activation of ROS production and autophagy. PLoS ONE 2019, 14, e0210274. [Google Scholar] [CrossRef] [PubMed]
- Huang, C.-Y.; Wei, P.-L.; Chen, W.-Y.; Chang, W.-C.; Chang, Y.-J. Silencing heat shock protein 27 inhibits the progression and metastasis of colorectal cancer (CRC) by maintaining the stability of stromal interaction molecule 1 (STIM1) proteins. Cells 2018, 7, 262. [Google Scholar] [CrossRef] [PubMed] [Green Version]
- Greally, M.; Kelly, C.M.; Cercek, A. HER2: An. emerging target in colorectal cancer. Curr. Probl. Cancer 2018, 42, 560–571. [Google Scholar] [CrossRef] [PubMed]
- Bhullar, D.S.; Barriuso, J.; Mullamitha, S.; Saunders, M.P.; O’Dwyer, S.T.; Aziz, O. Biomarker concordance between primary colorectal cancer and its metastases. EBioMedicine 2019, 40, 363–374. [Google Scholar] [CrossRef] [Green Version]
- Dienstmann, R.; Vermeulen, L.; Guinney, J.; Kopetz, S.; Tejpar, S.; Tabernero, J. Consensus molecular subtypes and the evolution of precision medicine in colorectal cancer. Nat. Rev. Cancer 2017, 17, 79–92. [Google Scholar] [CrossRef] [PubMed]
- Ahluwalia, P.; Mondal, A.K.; Bloomer, C.; Fulzele, S.; Jones, K.; Ananth, S.; Gahlay, G.K.; Heneidi, S.; Rojiani, A.M.; Kota, V.; et al. Identification and Clinical Validation of a Novel 4 Gene-Signature with Prognostic Utility in Colorectal Cancer. Int. J. Mol. Sci. 2019, 20, 3818. [Google Scholar] [CrossRef] [PubMed] [Green Version]
- Choi, Y.; Kwon, C.H.; Lee, S.J.; Park, J.; Shin, J.Y.; Park, D.Y. Integrative analysis of oncogenic fusion genes and their functional impact in colorectal cancer. Br. J. Cancer 2018, 119, 230–240. [Google Scholar] [CrossRef] [PubMed]
- Pagani, F.; Randon, G.; Guarini, V.; Raimondi, A.; Prisciandaro, M.; Lobefaro, R.; Di Bartolomeo, M.; Sozzi, G.; de Braud, F.; Gasparini, P.; et al. The Landscape of Actionable Gene Fusions in Colorectal Cancer. Int. J. Mol. Sci. 2019, 20, 5319. [Google Scholar]
- Wang, Y.; Ji, P.; Liu, J.; Broaddus, R.R.; Xue, F.; Zhang, W. Centrosome-associated regulators of the G2/M checkpoint as targets for cancer therapy. Mol. Cancer 2009, 8, 8. [Google Scholar] [CrossRef] [PubMed] [Green Version]
- Bakkenist, C.J.; Kastan, M.B. DNA damage activates ATM through intermolecular autophosphorylation and dimer dissociation. Nature 2003, 421, 499–506. [Google Scholar] [CrossRef] [PubMed]
- Beggs, A.D.; Domingo, E.; McGregor, M.; Presz, M.; Johnstone, E.; Midgley, R.; Kerr, D.; Oukrif, D.; Novelli, M.; Abulafi, M.; et al. Loss of expression of the double strand break repair protein ATM is associated with worse prognosis in colorectal cancer and loss of Ku70 expression is associated with CIN. Oncotarget 2012, 3, 1348–1355. [Google Scholar]
- Takai, N.; Hamanaka, R.; Yoshimatsu, J.; Miyakawa, I. Polo-like kinases (Plks) and cancer. Oncogene 2005, 24, 287–291. [Google Scholar] [CrossRef] [PubMed] [Green Version]
- Thompson, B.J. YAP/TAZ: Drivers of Tumor Growth, Metastasis, and Resistance to Therapy. Bioessays 2020, 42, 1900162. [Google Scholar] [CrossRef] [PubMed] [Green Version]
- Ji, B.; Feng, Y.; Sun, Y.; Ji, D.; Qian, W.; Zhang, Z.; Wang, Q.; Zhang, Y.; Zhang, C.; Sun, Y. GPR56 promotes proliferation of colorectal cancer cells and enhances metastasis via epithelial-mesenchymal transition through PI3K/AKT signaling activation. Oncol. Rep. 2018, 40, 1885–1896. [Google Scholar] [CrossRef] [Green Version]
- Geraldo, L.H.M.; Spohr, T.C.L.d.S.; Amaral, R.F.d.; Fonseca, A.C.C.d.; Garcia, C.; Mendes, F.d.A.; Freitas, C.; dos Santos, M.F.; Lima, F.R.S. Role of lysophosphatidic acid and its receptors in health and disease: Novel therapeutic strategies. Signal Transduct. Target. Ther. 2021, 6, 45. [Google Scholar] [CrossRef]
- Yun, C.C. Lysophosphatidic Acid and Autotaxin-associated Effects on the Initiation and Progression of Colorectal Cancer. Cancers 2019, 11, 958. [Google Scholar] [CrossRef] [PubMed] [Green Version]
- Tveteraas, I.H.; Aasrum, M.; Brusevold, I.J.; Ødegård, J.; Christoffersen, T.; Sandnes, D. Lysophosphatidic acid induces both EGFR-dependent and EGFR-independent effects on DNA synthesis and migration in pancreatic and colorectal carcinoma cells. Tumor Biol. 2016, 37, 2519–2526. [Google Scholar] [CrossRef] [PubMed]
- Karlsson-Rosenthal, C.; Millar, J.B. Cdc25: Mechanisms of checkpoint inhibition and recovery. Trends Cell Biol. 2006, 16, 285–292. [Google Scholar] [CrossRef]
- Shen, T.; Huang, S. The role of Cdc25A in the regulation of cell proliferation and apoptosis. Anticancer Agents Med. Chem. 2012, 12, 631–639. [Google Scholar] [CrossRef] [PubMed]
- De Oliveira, P.E.; Zhang, L.; Wang, Z.; Lazo, J.S. Hypoxia-mediated regulation of Cdc25A phosphatase by p21 and miR-21. Cell Cycle 2009, 8, 3157–3164. [Google Scholar] [CrossRef] [PubMed]
- Liffers, S.T.; Munding, J.B.; Vogt, M.; Kuhlmann, J.D.; Verdoodt, B.; Nambiar, S.; Maghnouj, A.; Mirmohammadsadegh, A.; Hahn, S.A.; Tannapfel, A. MicroRNA-148a is down-regulated in human pancreatic ductal adenocarcinomas and regulates cell survival by targeting CDC25B. Lab. Investig. 2011, 91, 1472–1479. [Google Scholar] [CrossRef] [PubMed] [Green Version]
- Wang, Z.; Trope, C.G.; Florenes, V.A.; Suo, Z.; Nesland, J.M.; Holm, R. Overexpression of CDC25B, CDC25C and phospho-CDC25C (Ser216) in vulvar squamous cell carcinomas are associated with malignant features and aggressive cancer phenotypes. BMC Cancer 2010, 10, 233. [Google Scholar] [CrossRef] [PubMed] [Green Version]
- Fang, Y.; Yu, H.; Liang, X.; Xu, J.; Cai, X. Chk1-induced CCNB1 overexpression promotes cell proliferation and tumor growth in human colorectal cancer. Cancer Biol. Ther. 2014, 15, 1268–1279. [Google Scholar] [CrossRef] [PubMed] [Green Version]


Publisher’s Note: MDPI stays neutral with regard to jurisdictional claims in published maps and institutional affiliations. |
© 2021 by the authors. Licensee MDPI, Basel, Switzerland. This article is an open access article distributed under the terms and conditions of the Creative Commons Attribution (CC BY) license (https://creativecommons.org/licenses/by/4.0/).
Share and Cite
Anuraga, G.; Tang, W.-C.; Phan, N.N.; Ta, H.D.K.; Liu, Y.-H.; Wu, Y.-F.; Lee, K.-H.; Wang, C.-Y. Comprehensive Analysis of Prognostic and Genetic Signatures for General Transcription Factor III (GTF3) in Clinical Colorectal Cancer Patients Using Bioinformatics Approaches. Curr. Issues Mol. Biol. 2021, 43, 2-20. https://0-doi-org.brum.beds.ac.uk/10.3390/cimb43010002
Anuraga G, Tang W-C, Phan NN, Ta HDK, Liu Y-H, Wu Y-F, Lee K-H, Wang C-Y. Comprehensive Analysis of Prognostic and Genetic Signatures for General Transcription Factor III (GTF3) in Clinical Colorectal Cancer Patients Using Bioinformatics Approaches. Current Issues in Molecular Biology. 2021; 43(1):2-20. https://0-doi-org.brum.beds.ac.uk/10.3390/cimb43010002
Chicago/Turabian StyleAnuraga, Gangga, Wan-Chun Tang, Nam Nhut Phan, Hoang Dang Khoa Ta, Yen-Hsi Liu, Yung-Fu Wu, Kuen-Haur Lee, and Chih-Yang Wang. 2021. "Comprehensive Analysis of Prognostic and Genetic Signatures for General Transcription Factor III (GTF3) in Clinical Colorectal Cancer Patients Using Bioinformatics Approaches" Current Issues in Molecular Biology 43, no. 1: 2-20. https://0-doi-org.brum.beds.ac.uk/10.3390/cimb43010002