
Short-Term Functional and Morphological Changes in the Primary Cultures of Trigeminal Ganglion Cells

 , , and
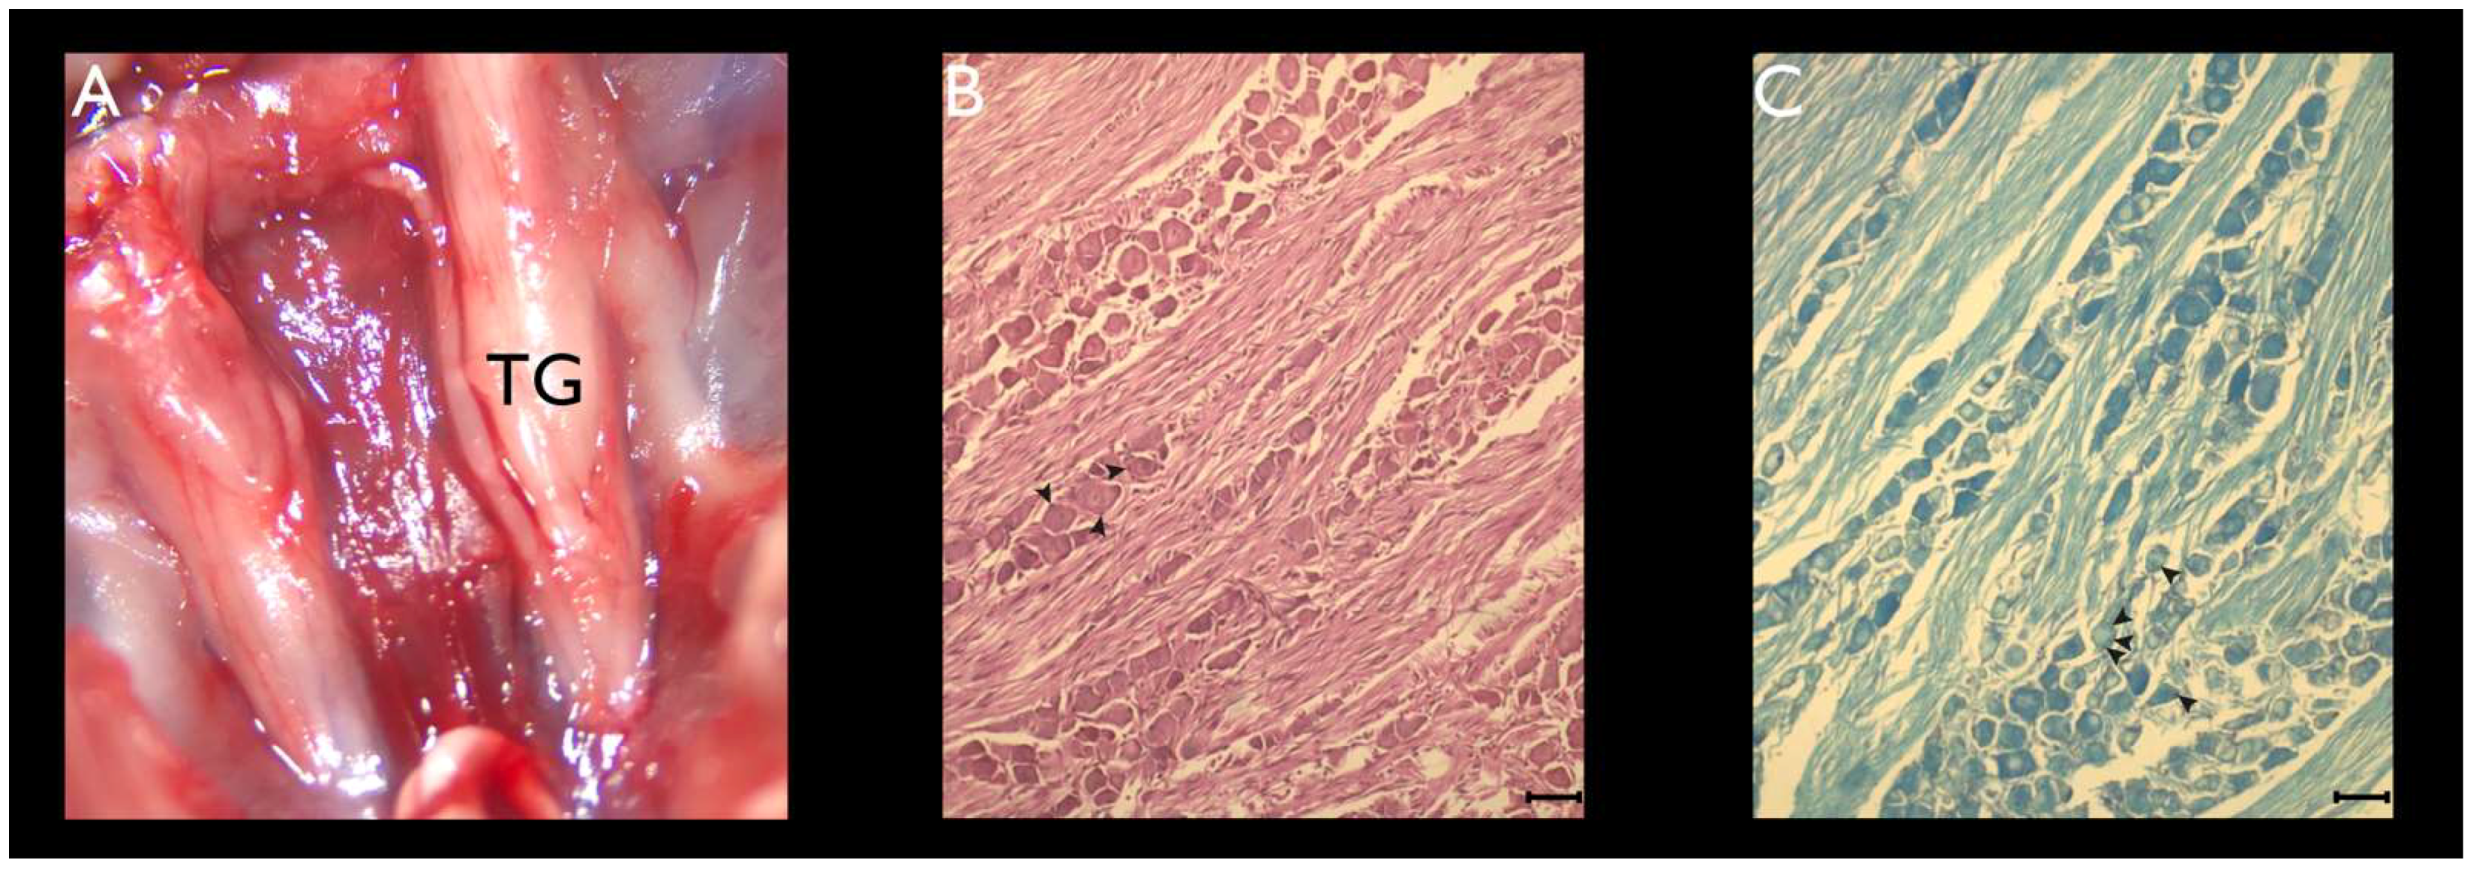
Abstract
:1. Introduction
2. Materials and Methods
2.1. Animals
2.2. TG Dissection
2.3. Primary Culture of TG Cells
2.4. Histochemistry
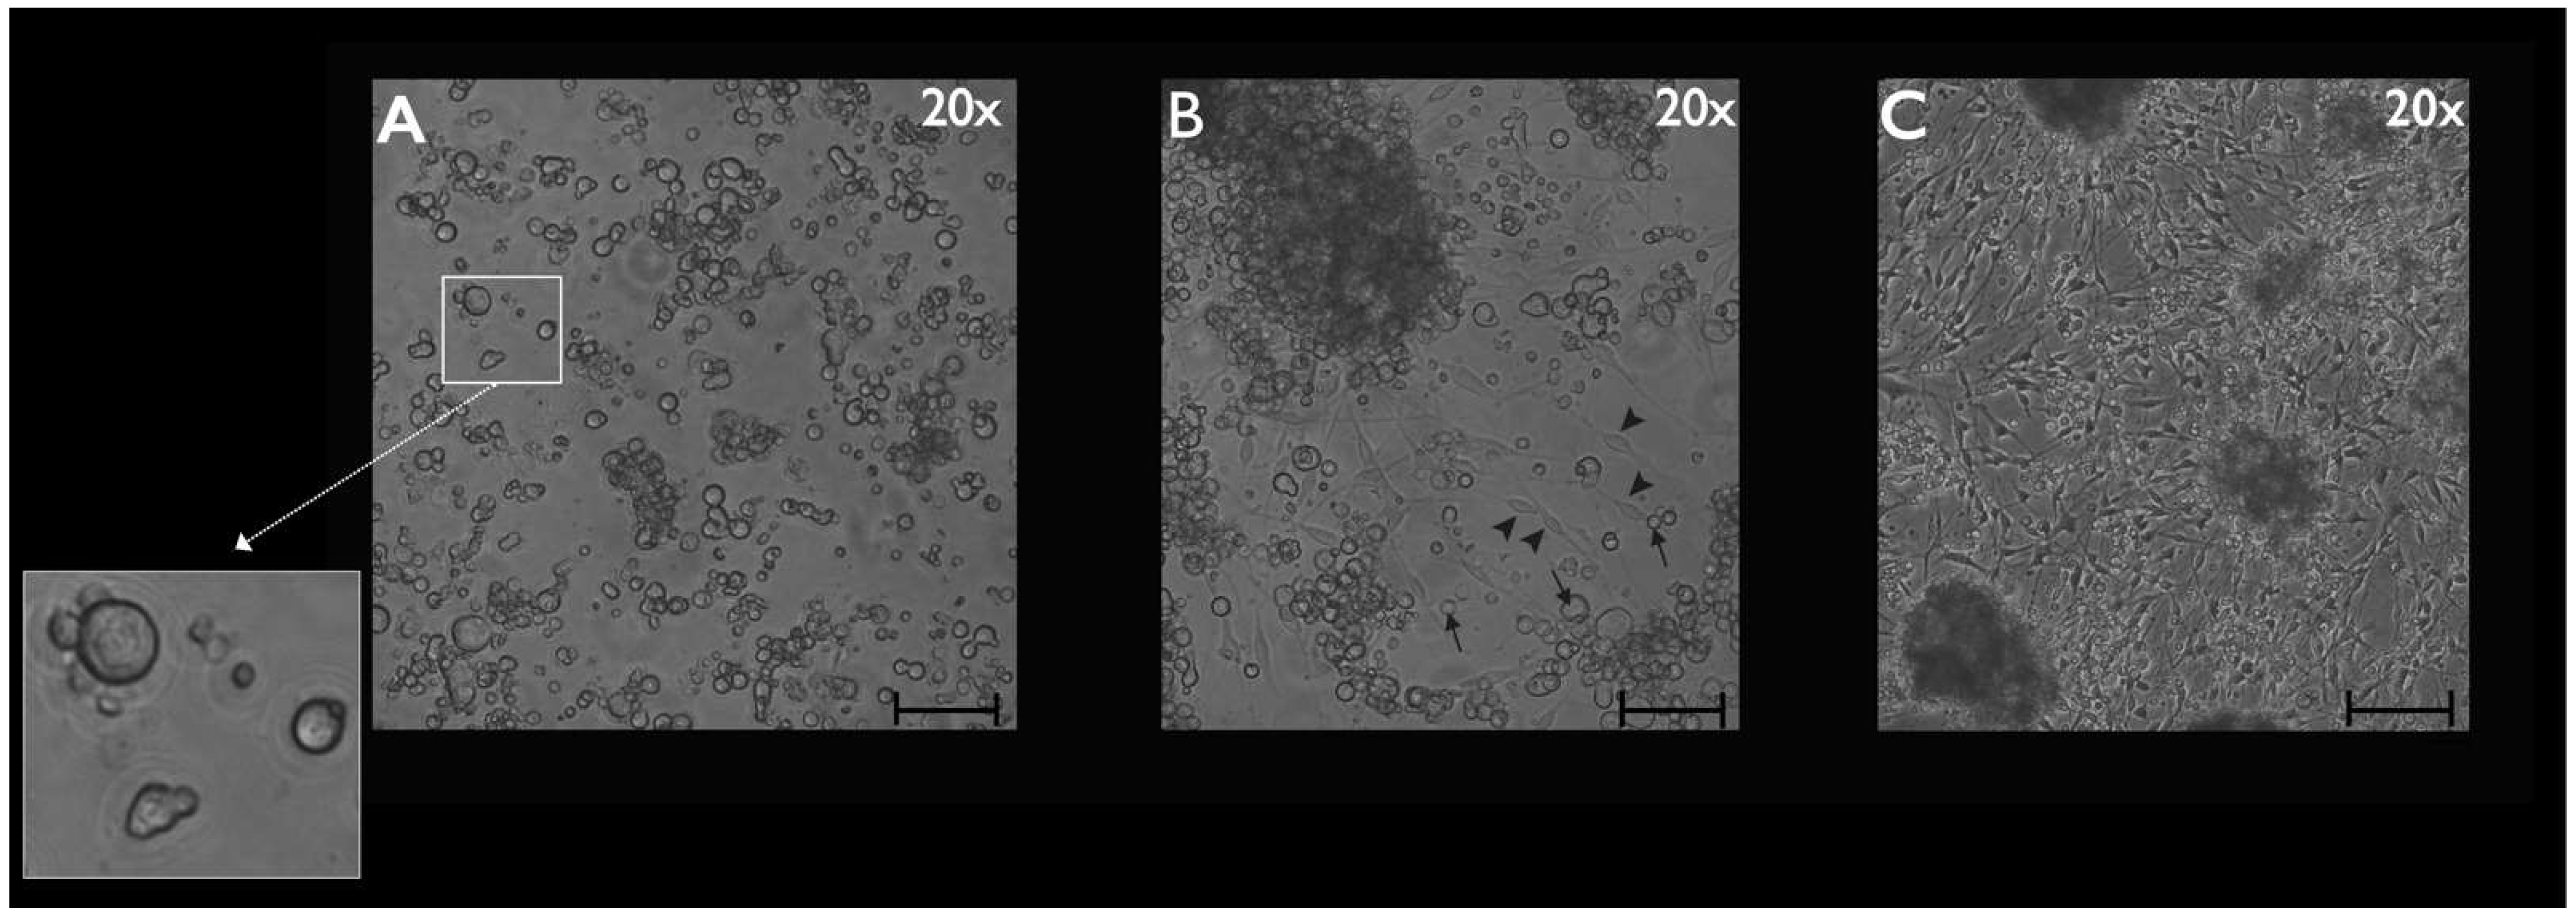
2.5. Phase-Contrast Microscopy
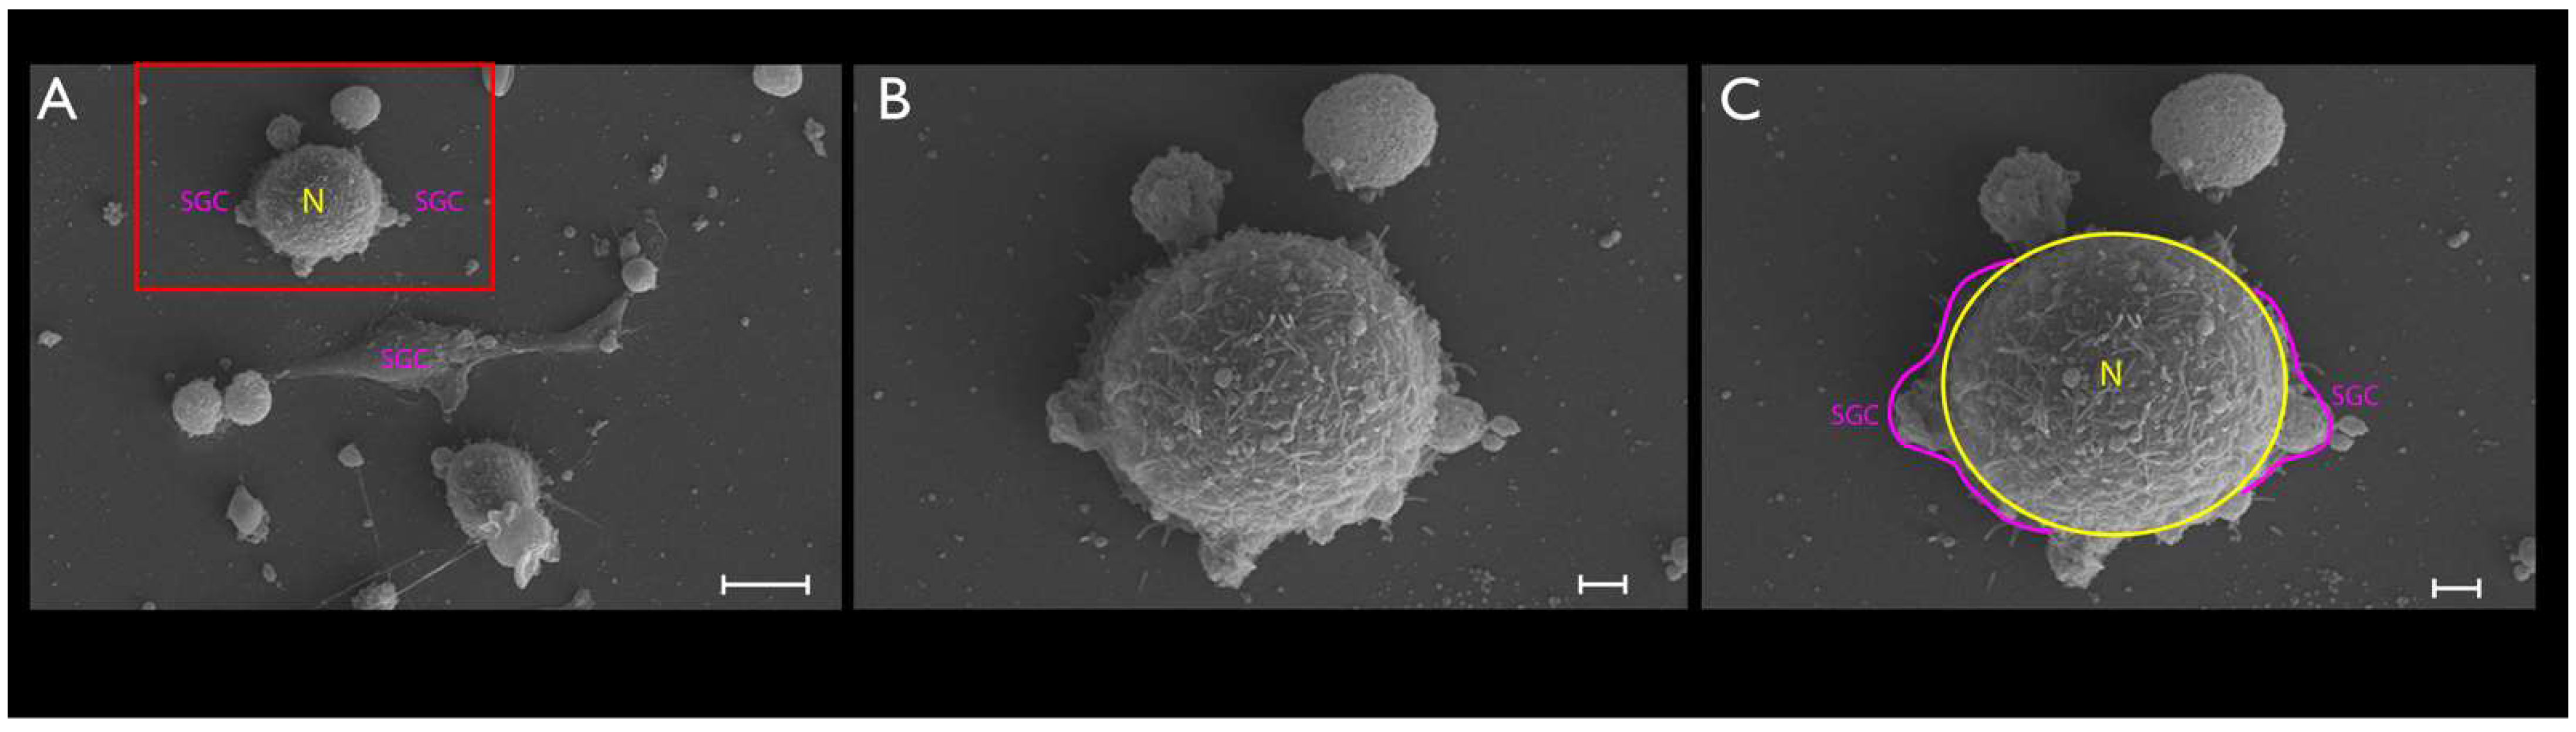
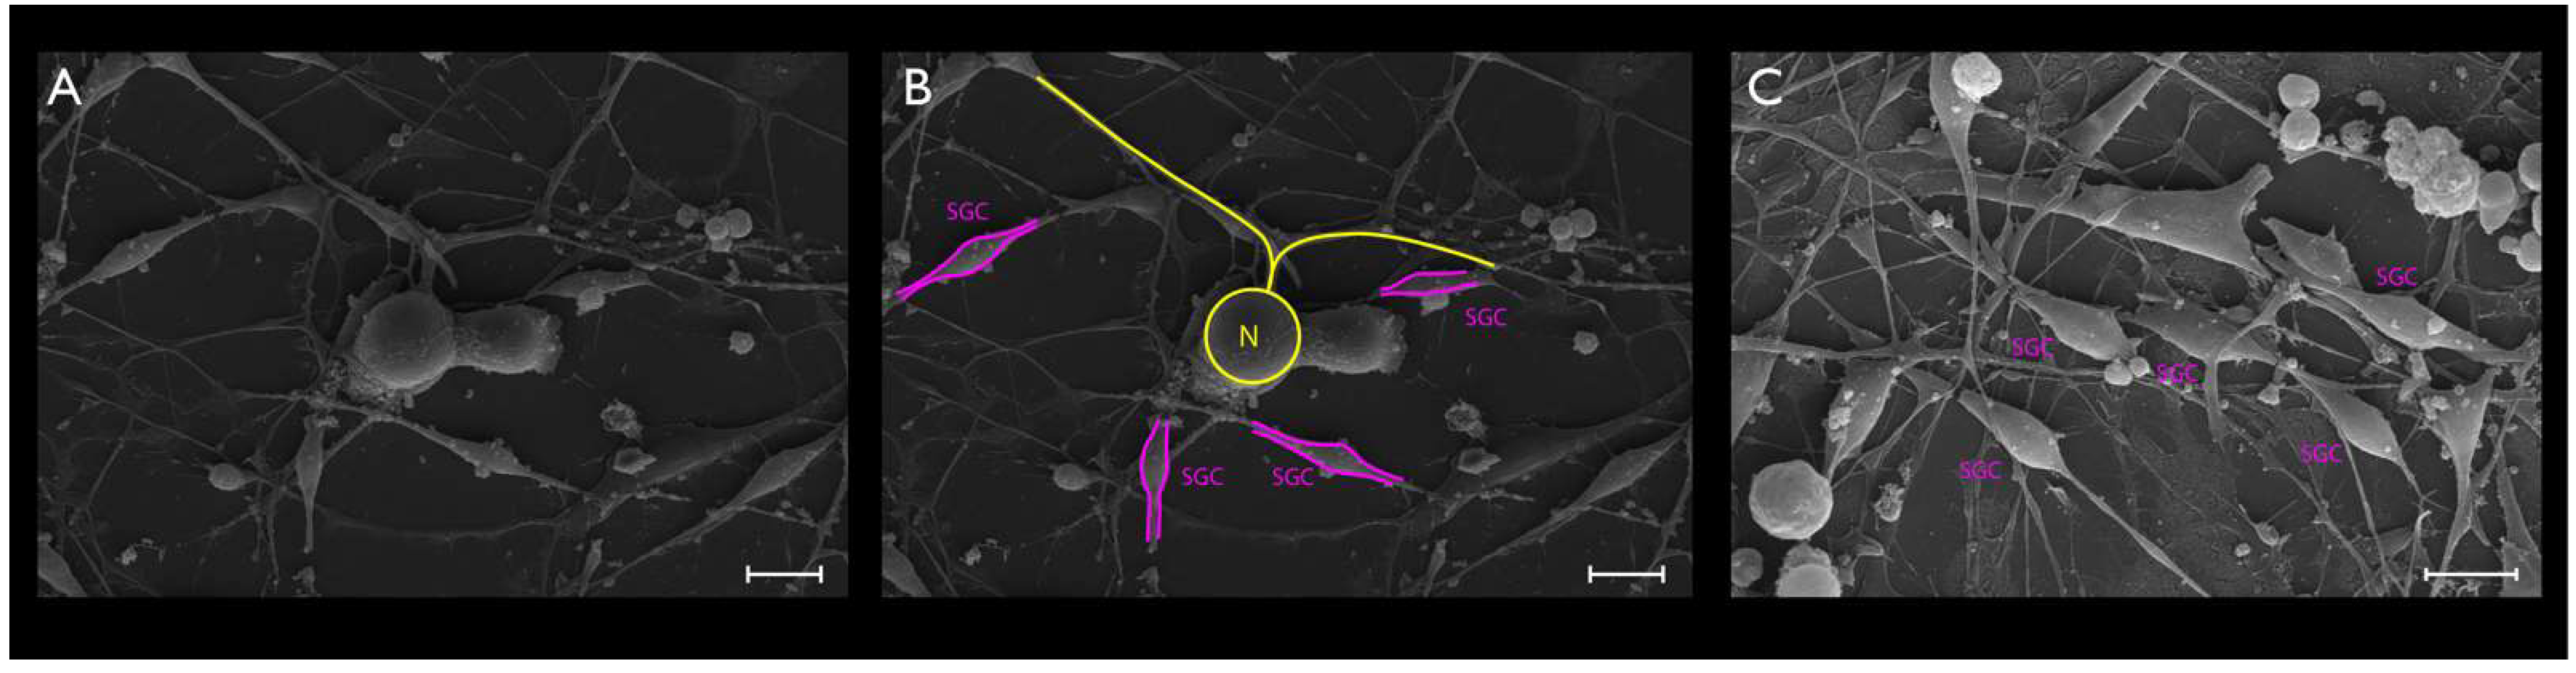
2.6. SEM
2.7. Time-Lapse Photography and Analysis
2.8. Immunocytochemistry
2.9. Statistical Analysis
3. Results
3.1. Histochemistry
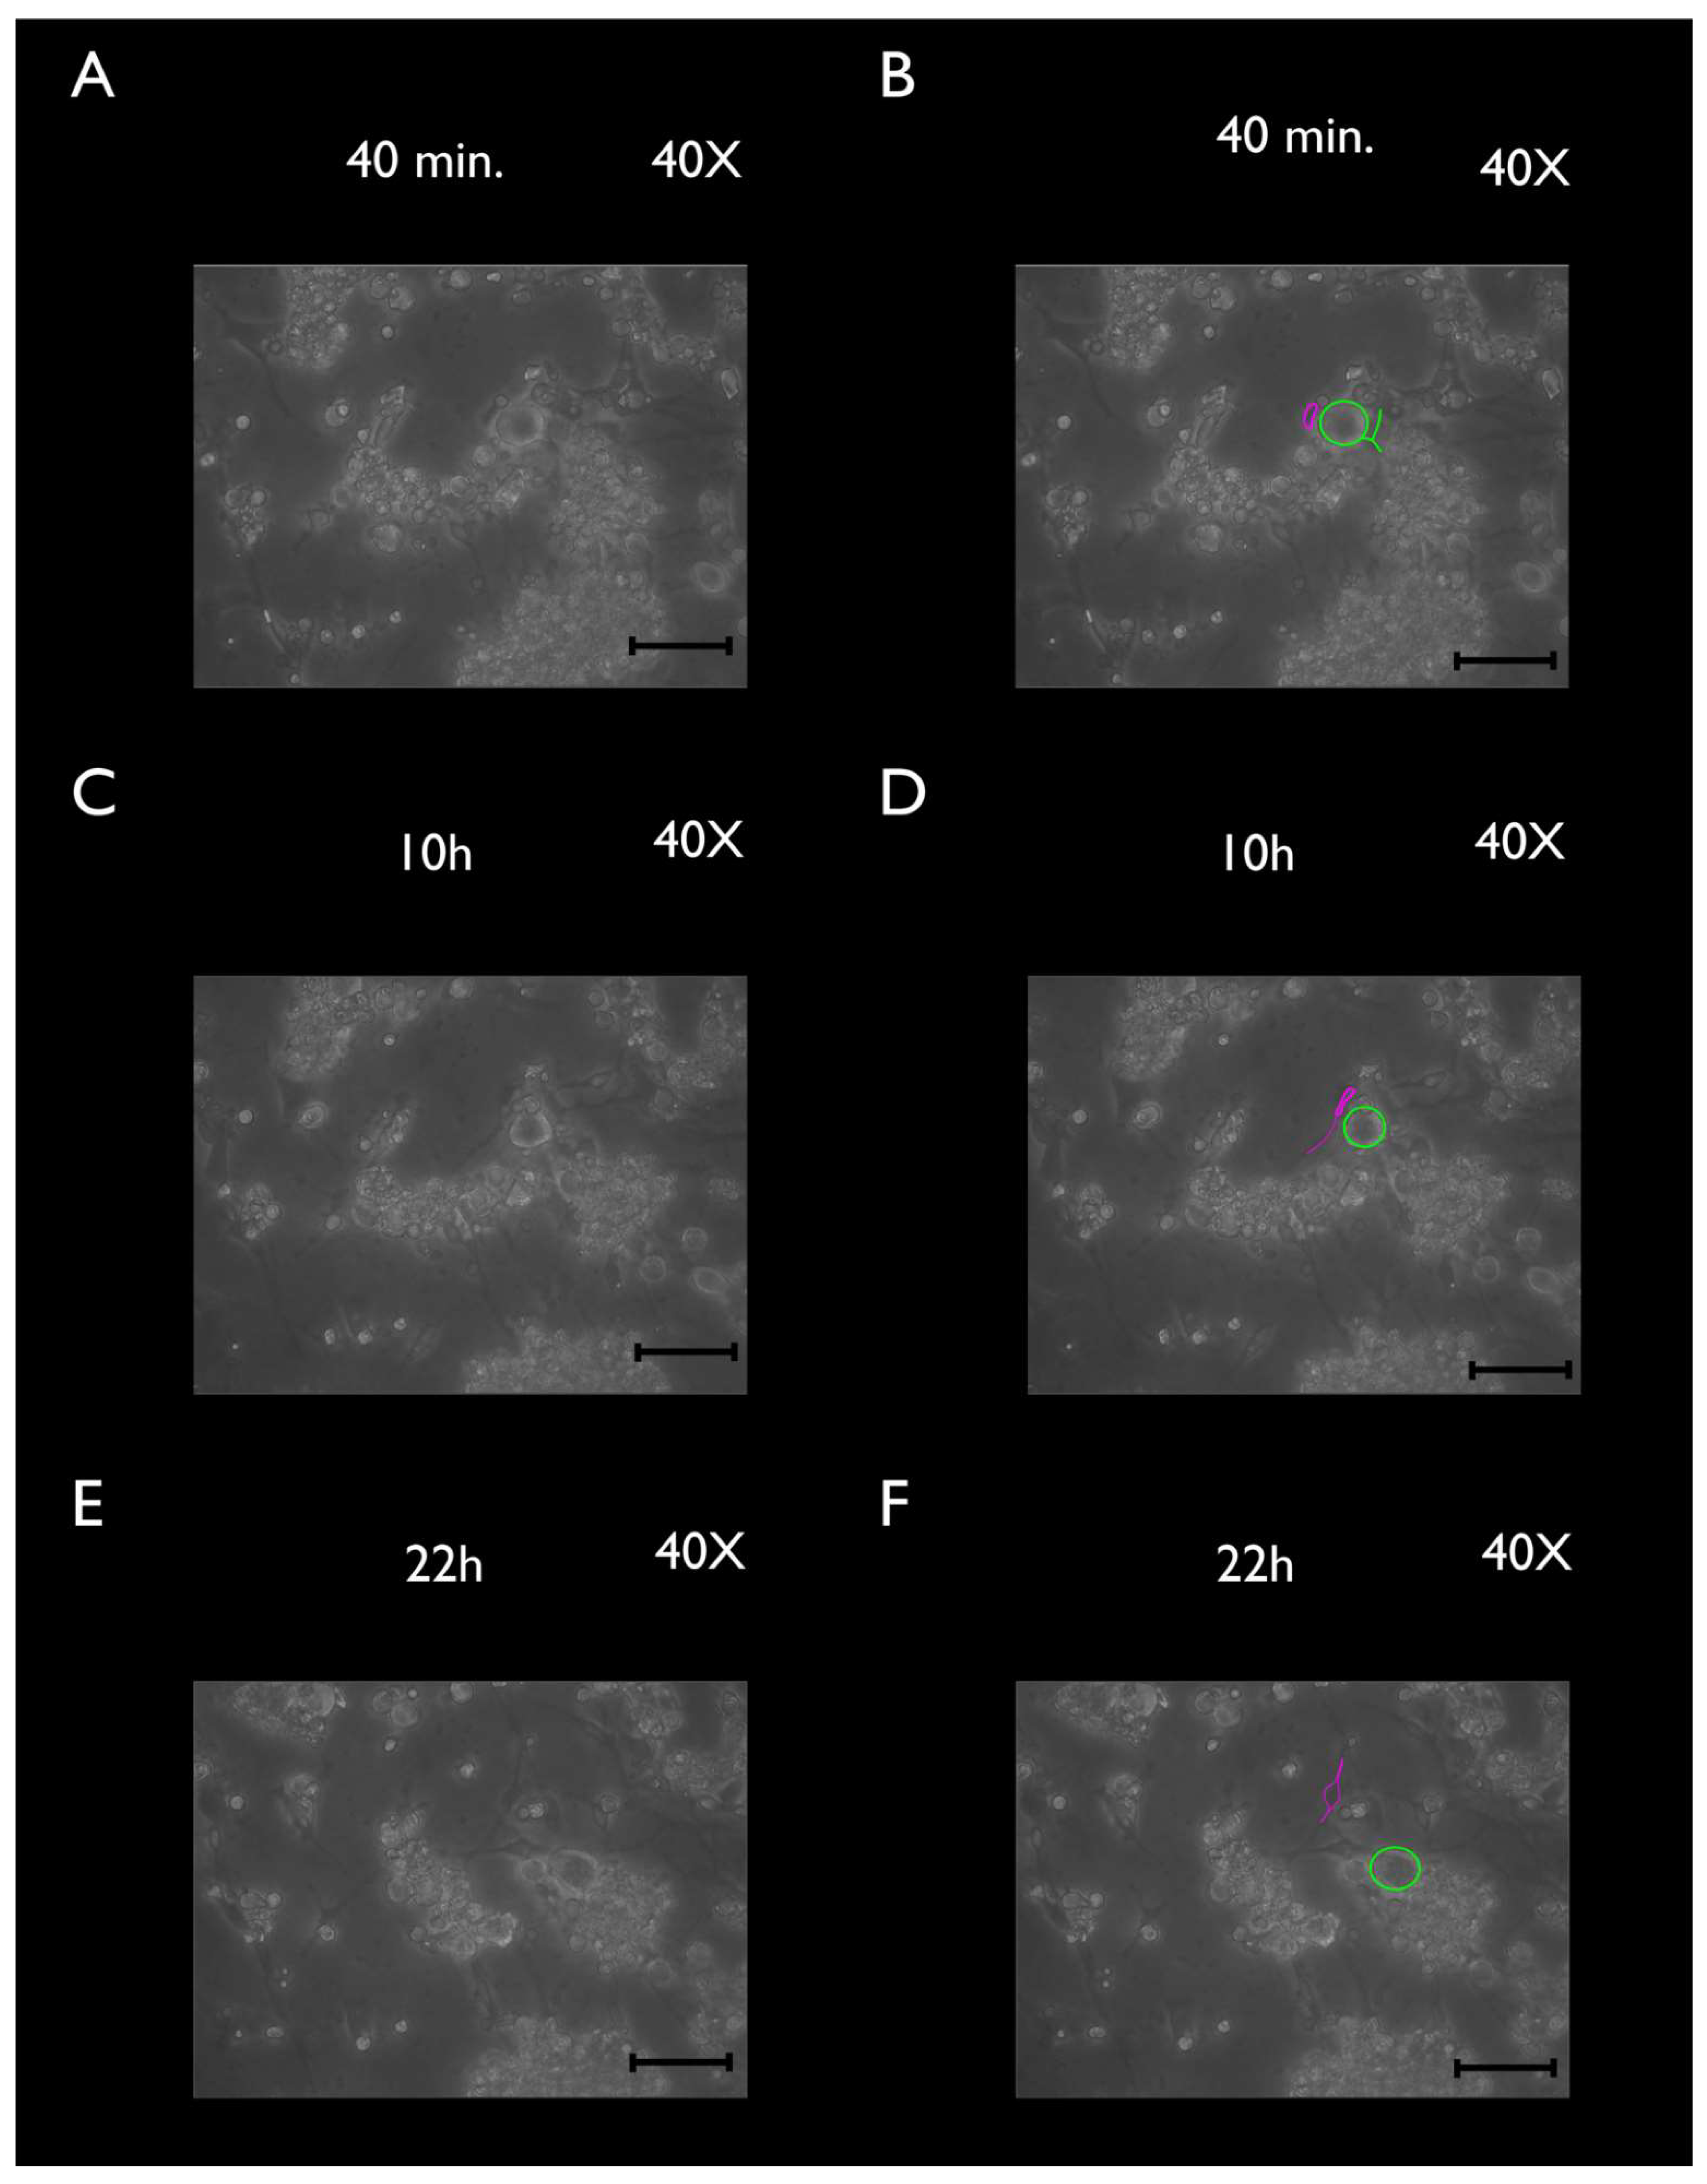
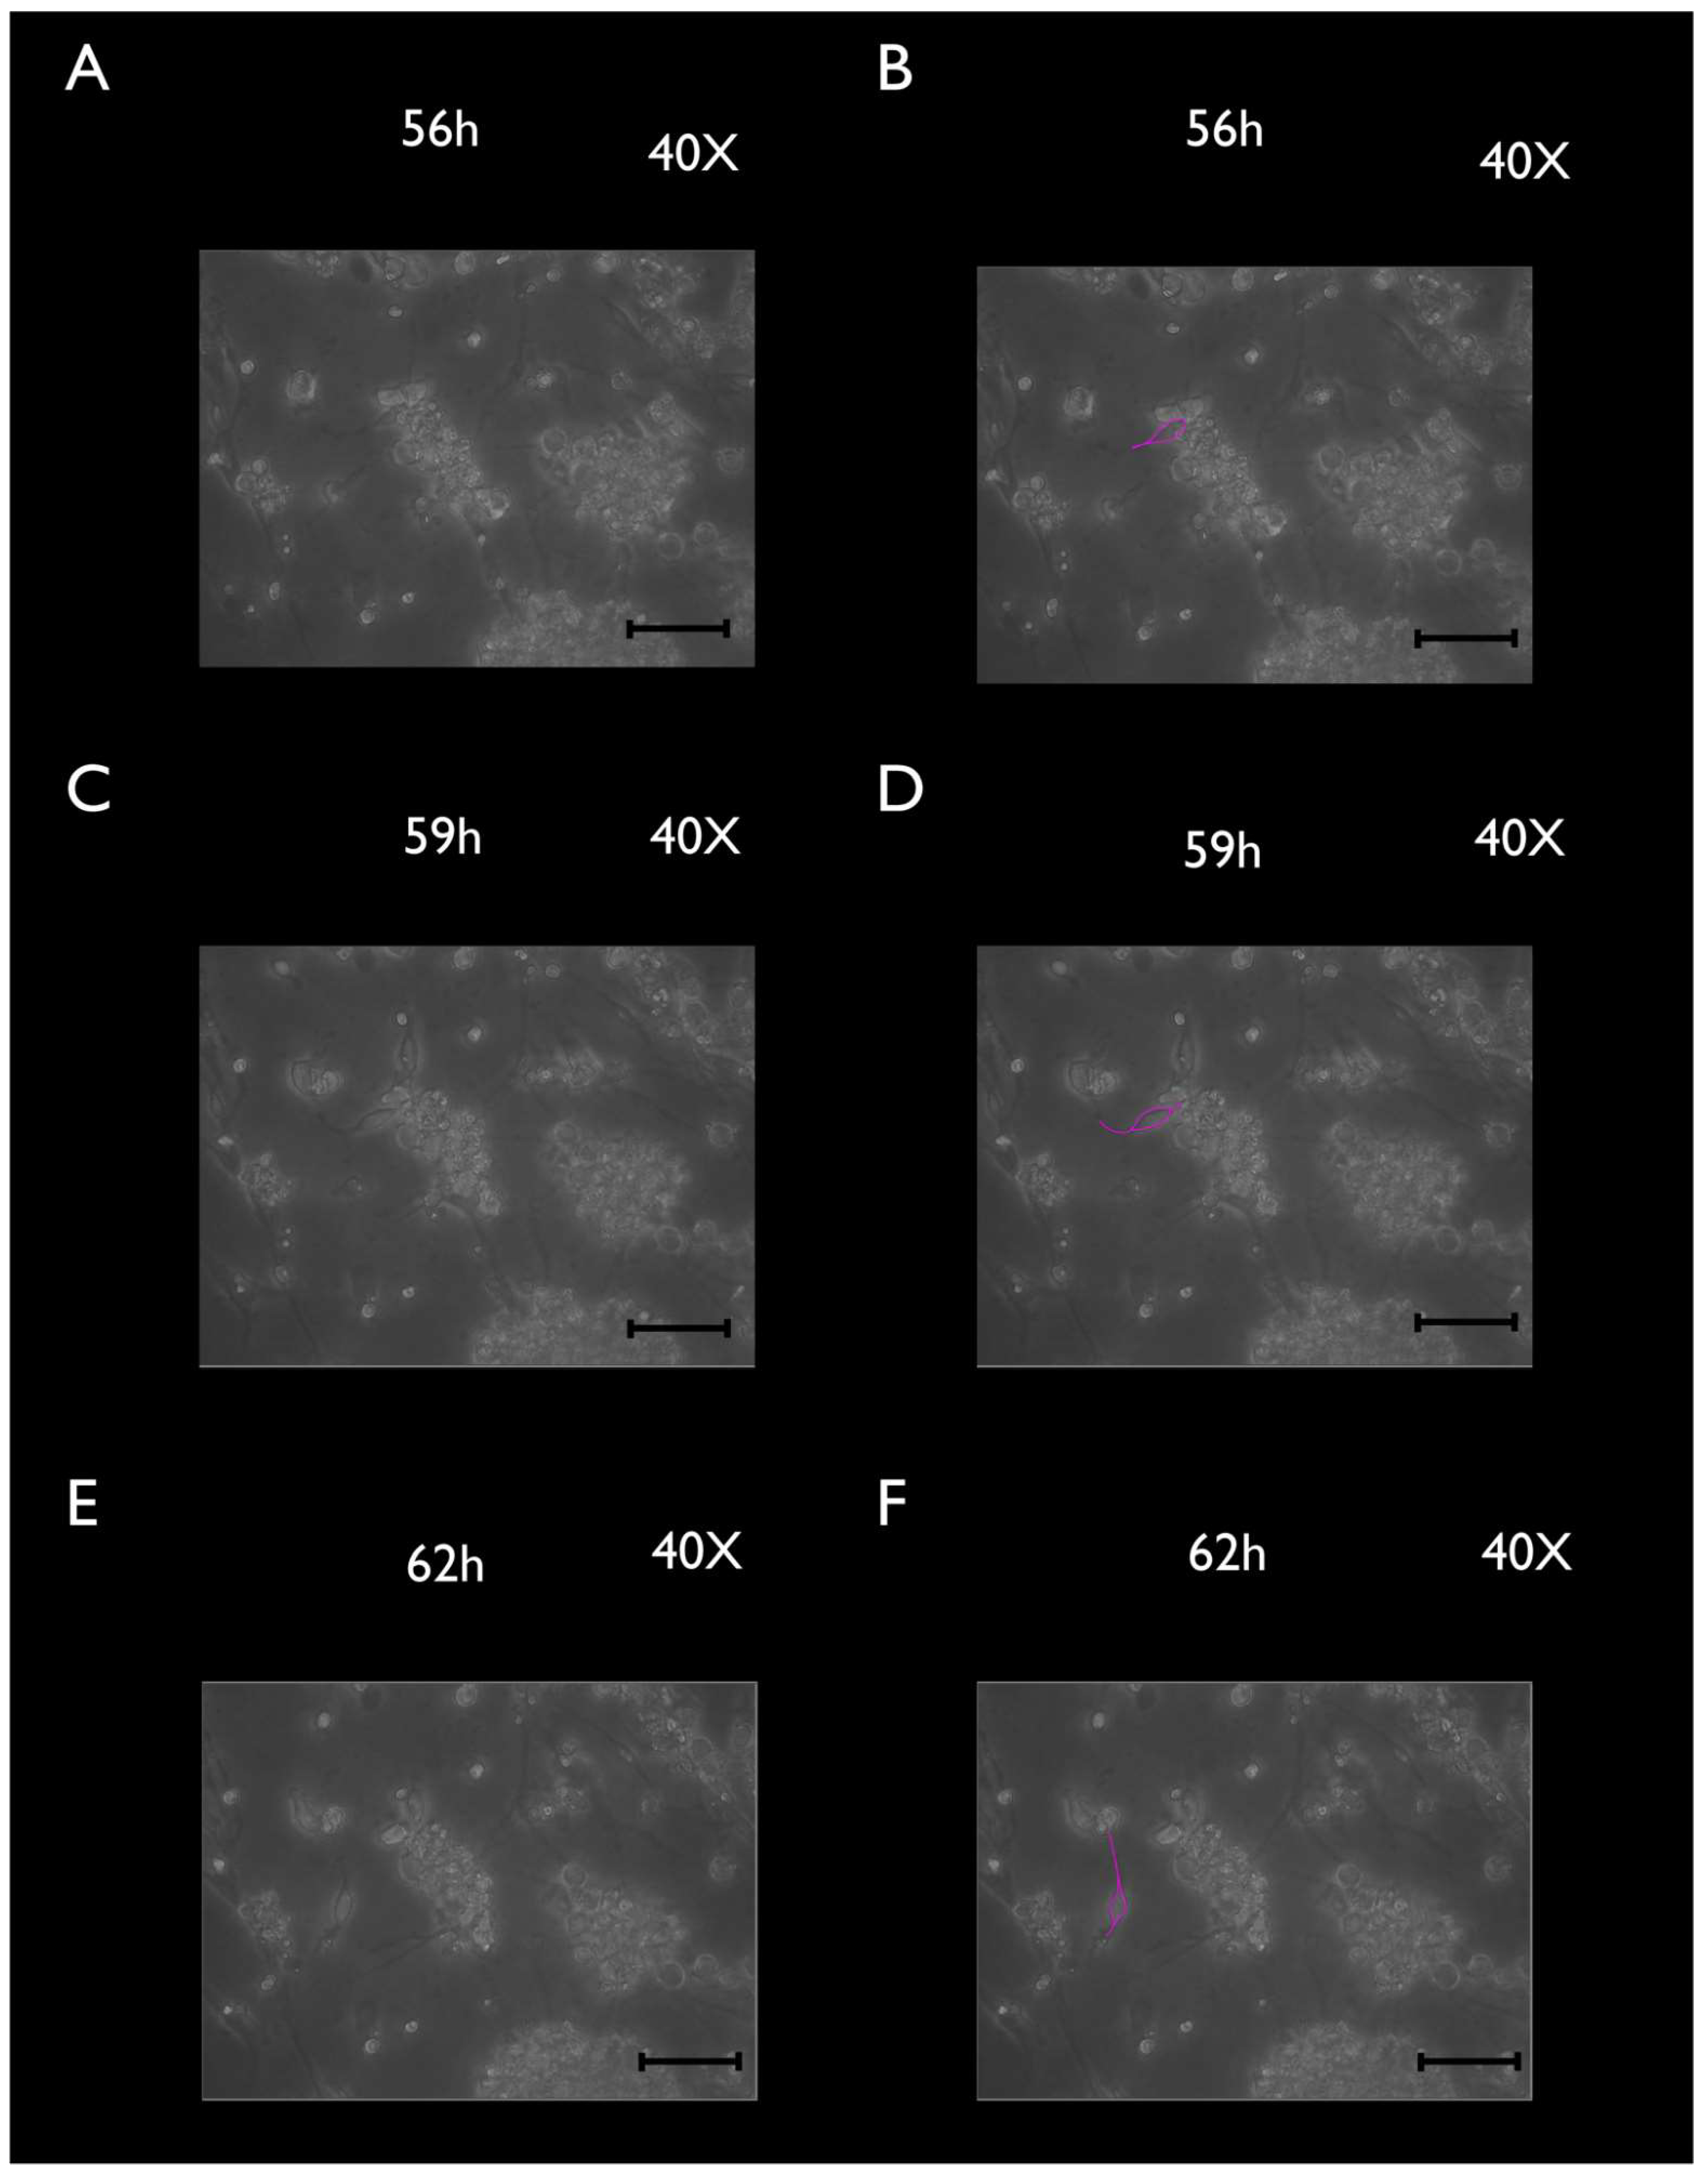
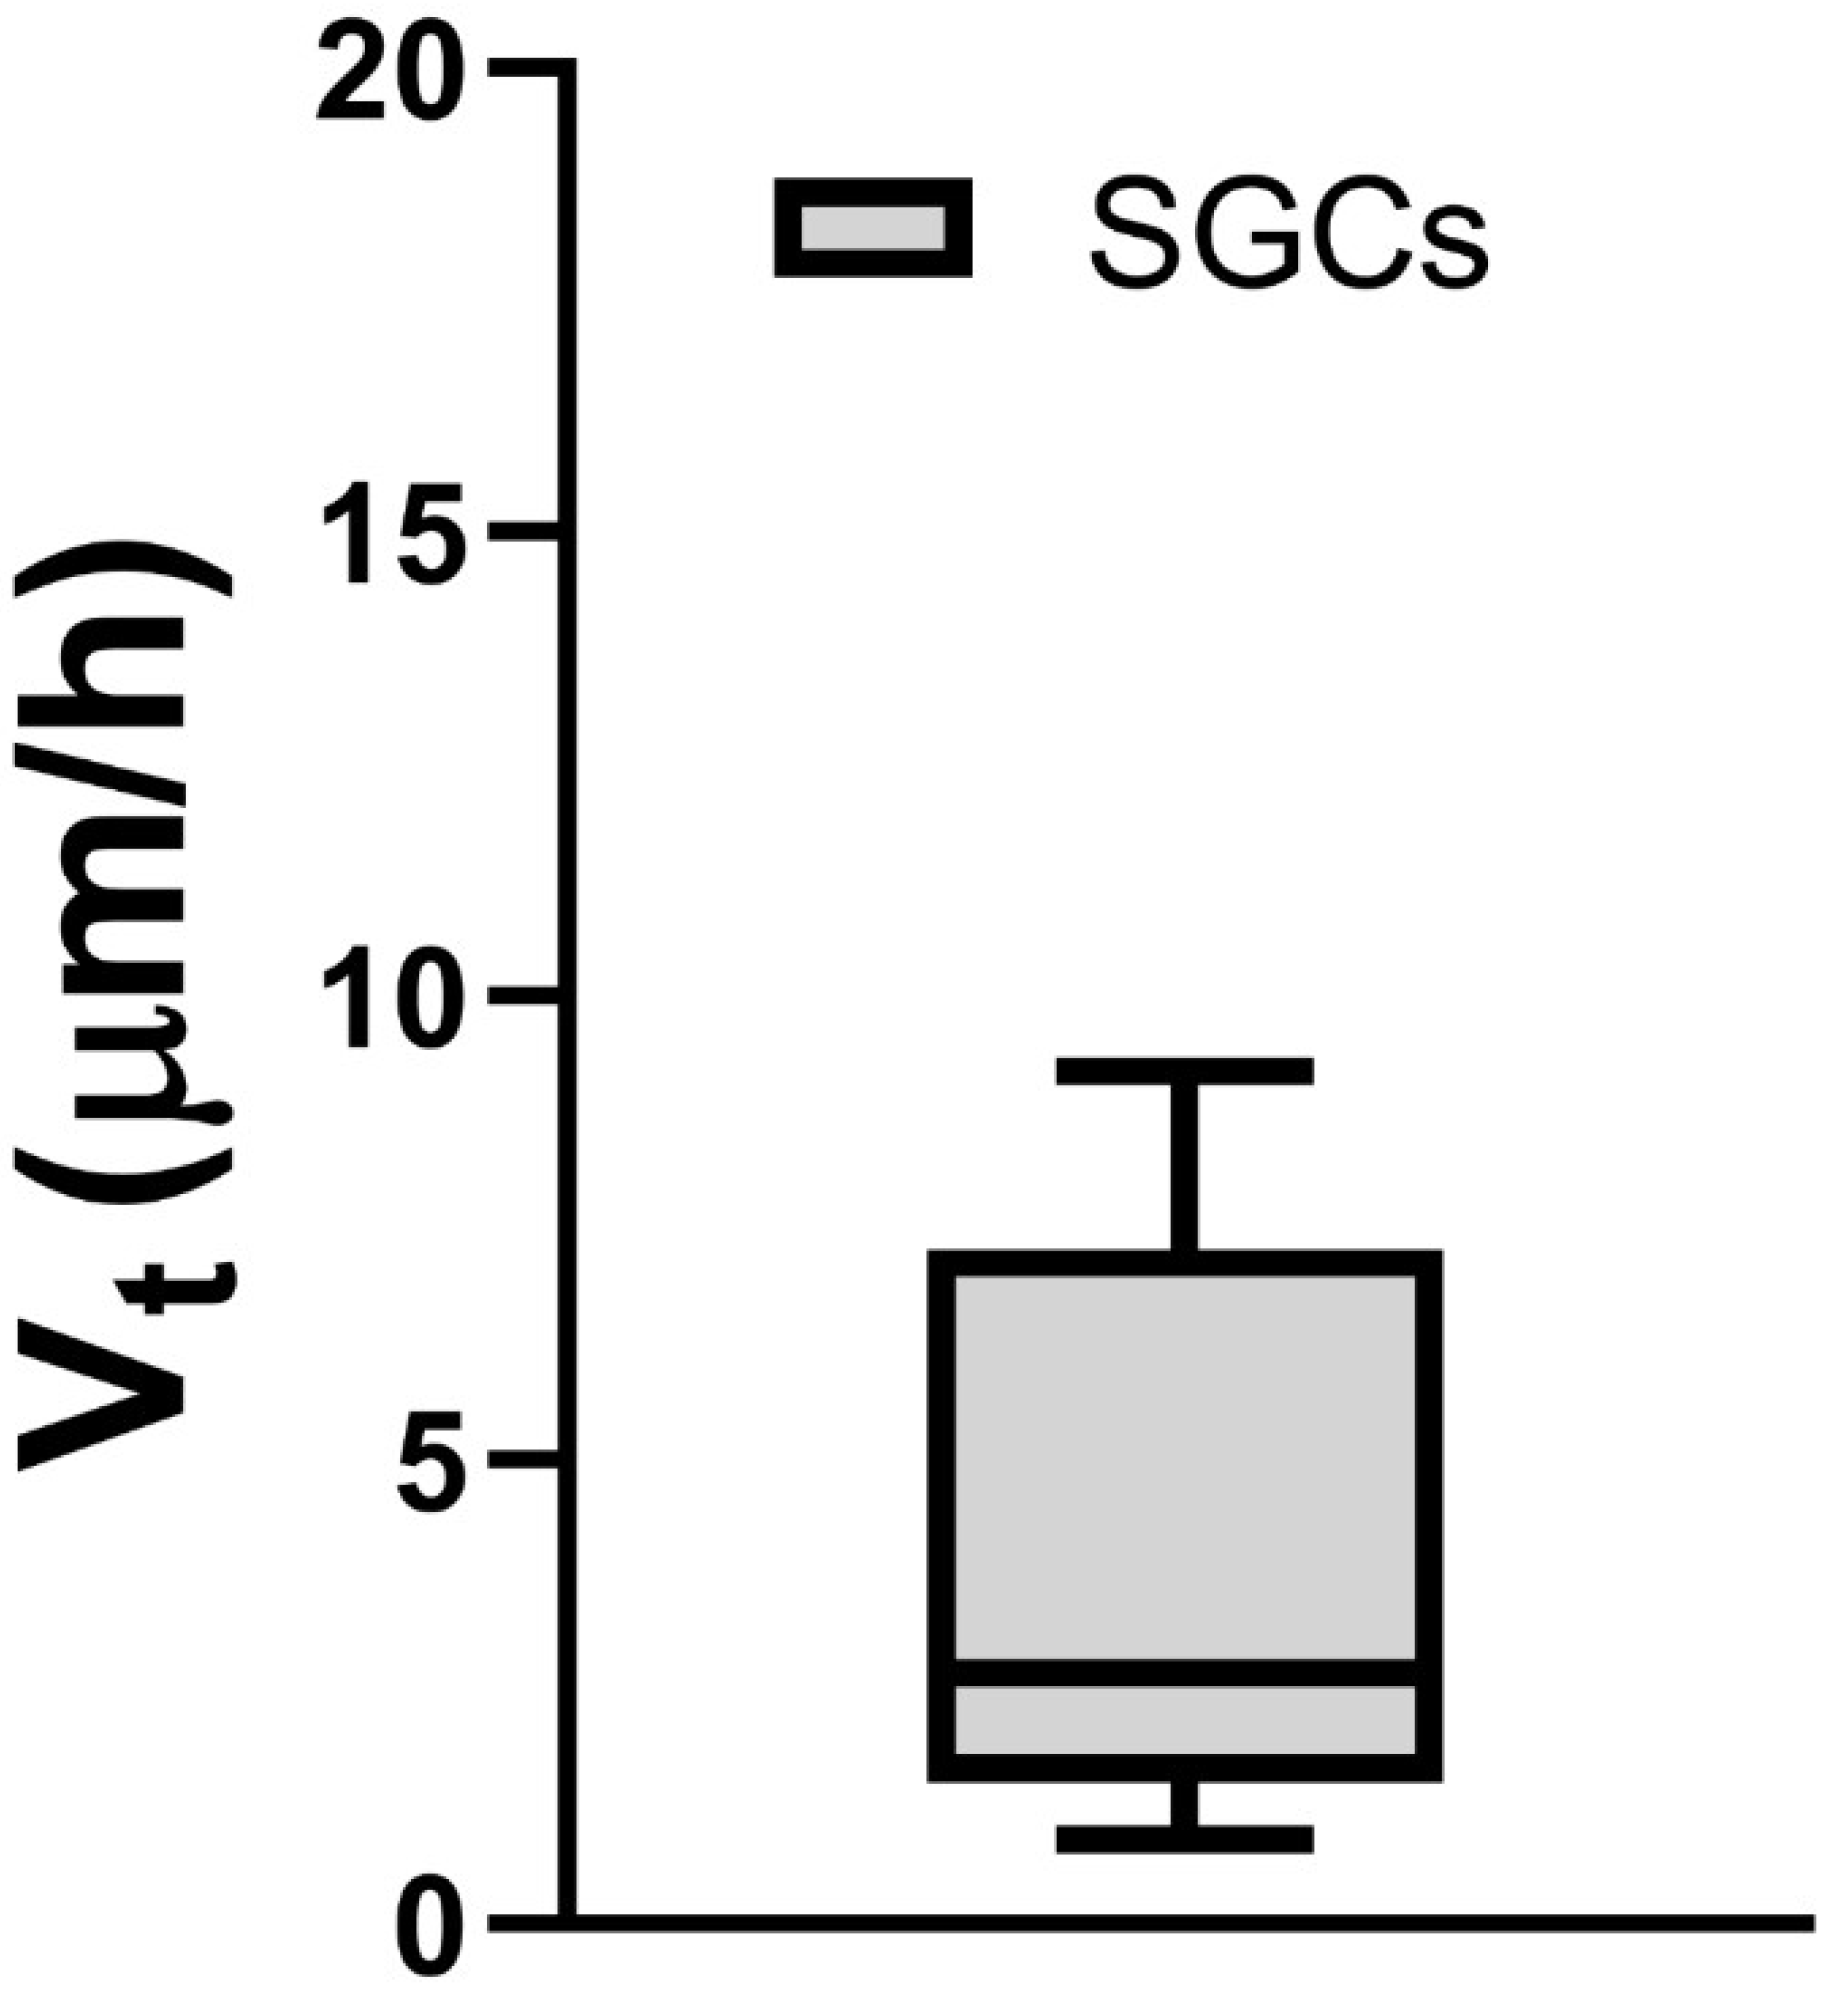
3.2. Phase-Contrast Microscopy, SEM, and Time-Lapse Photography Analyses
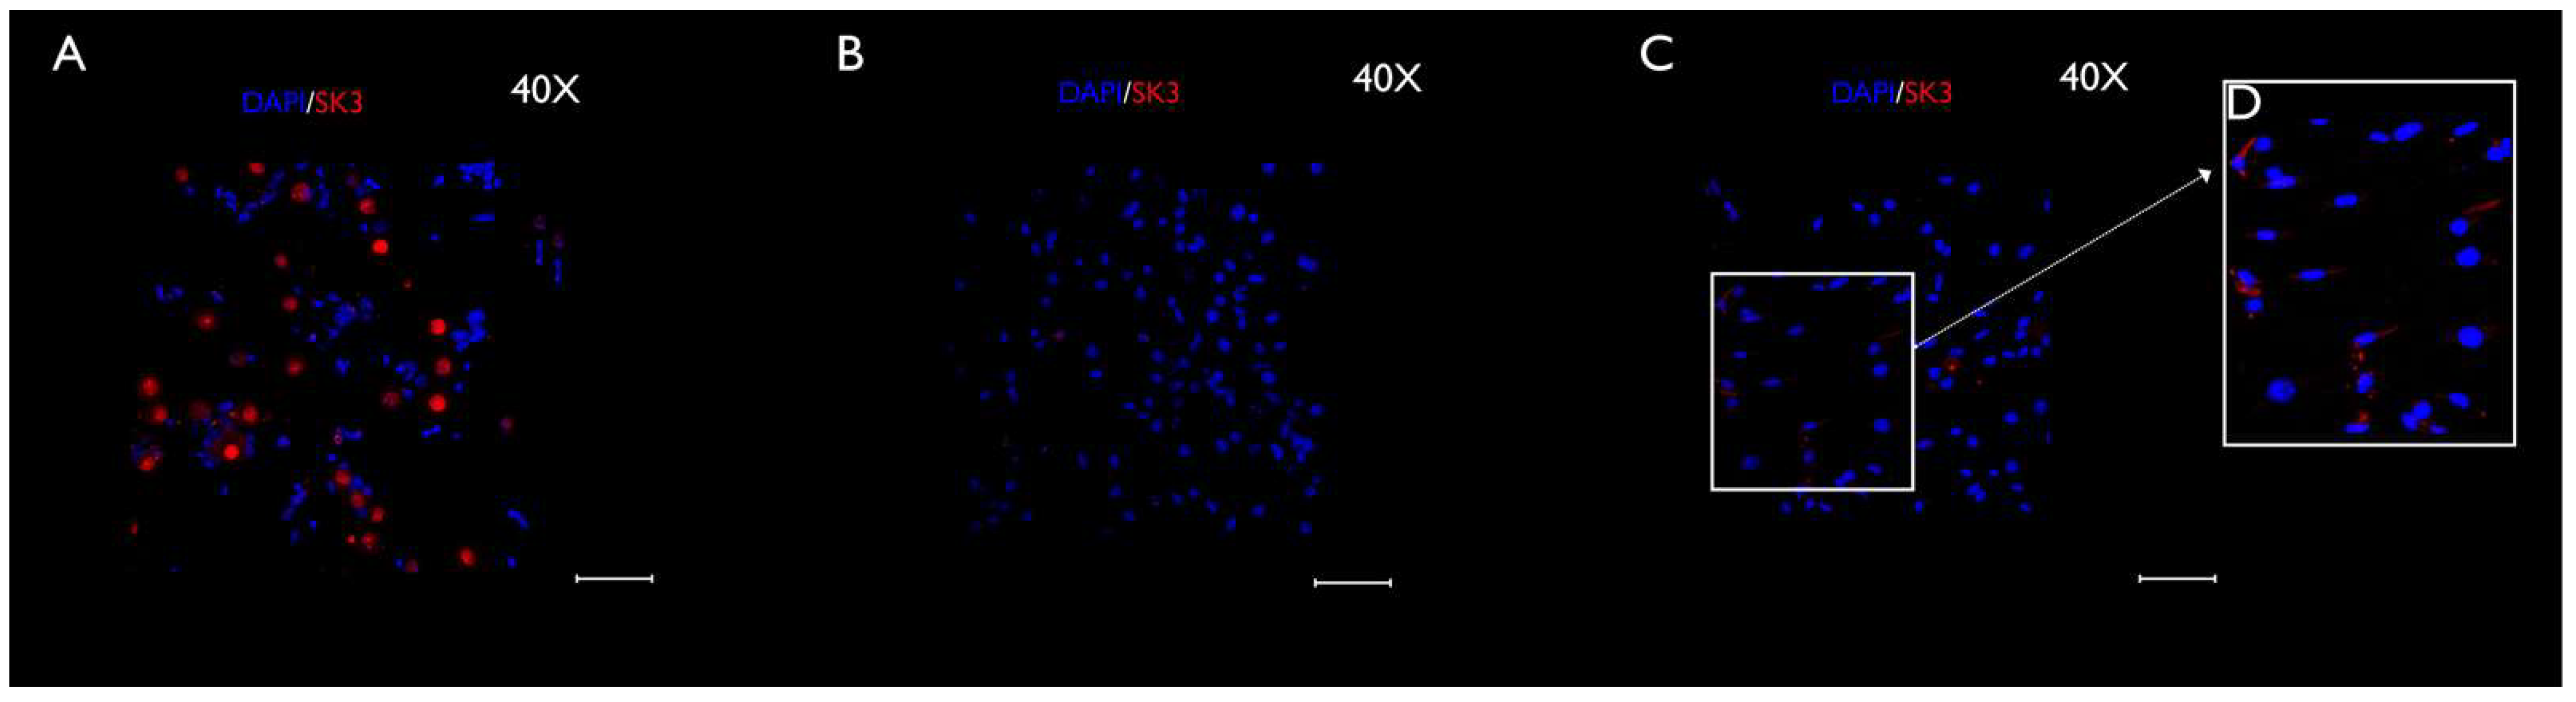
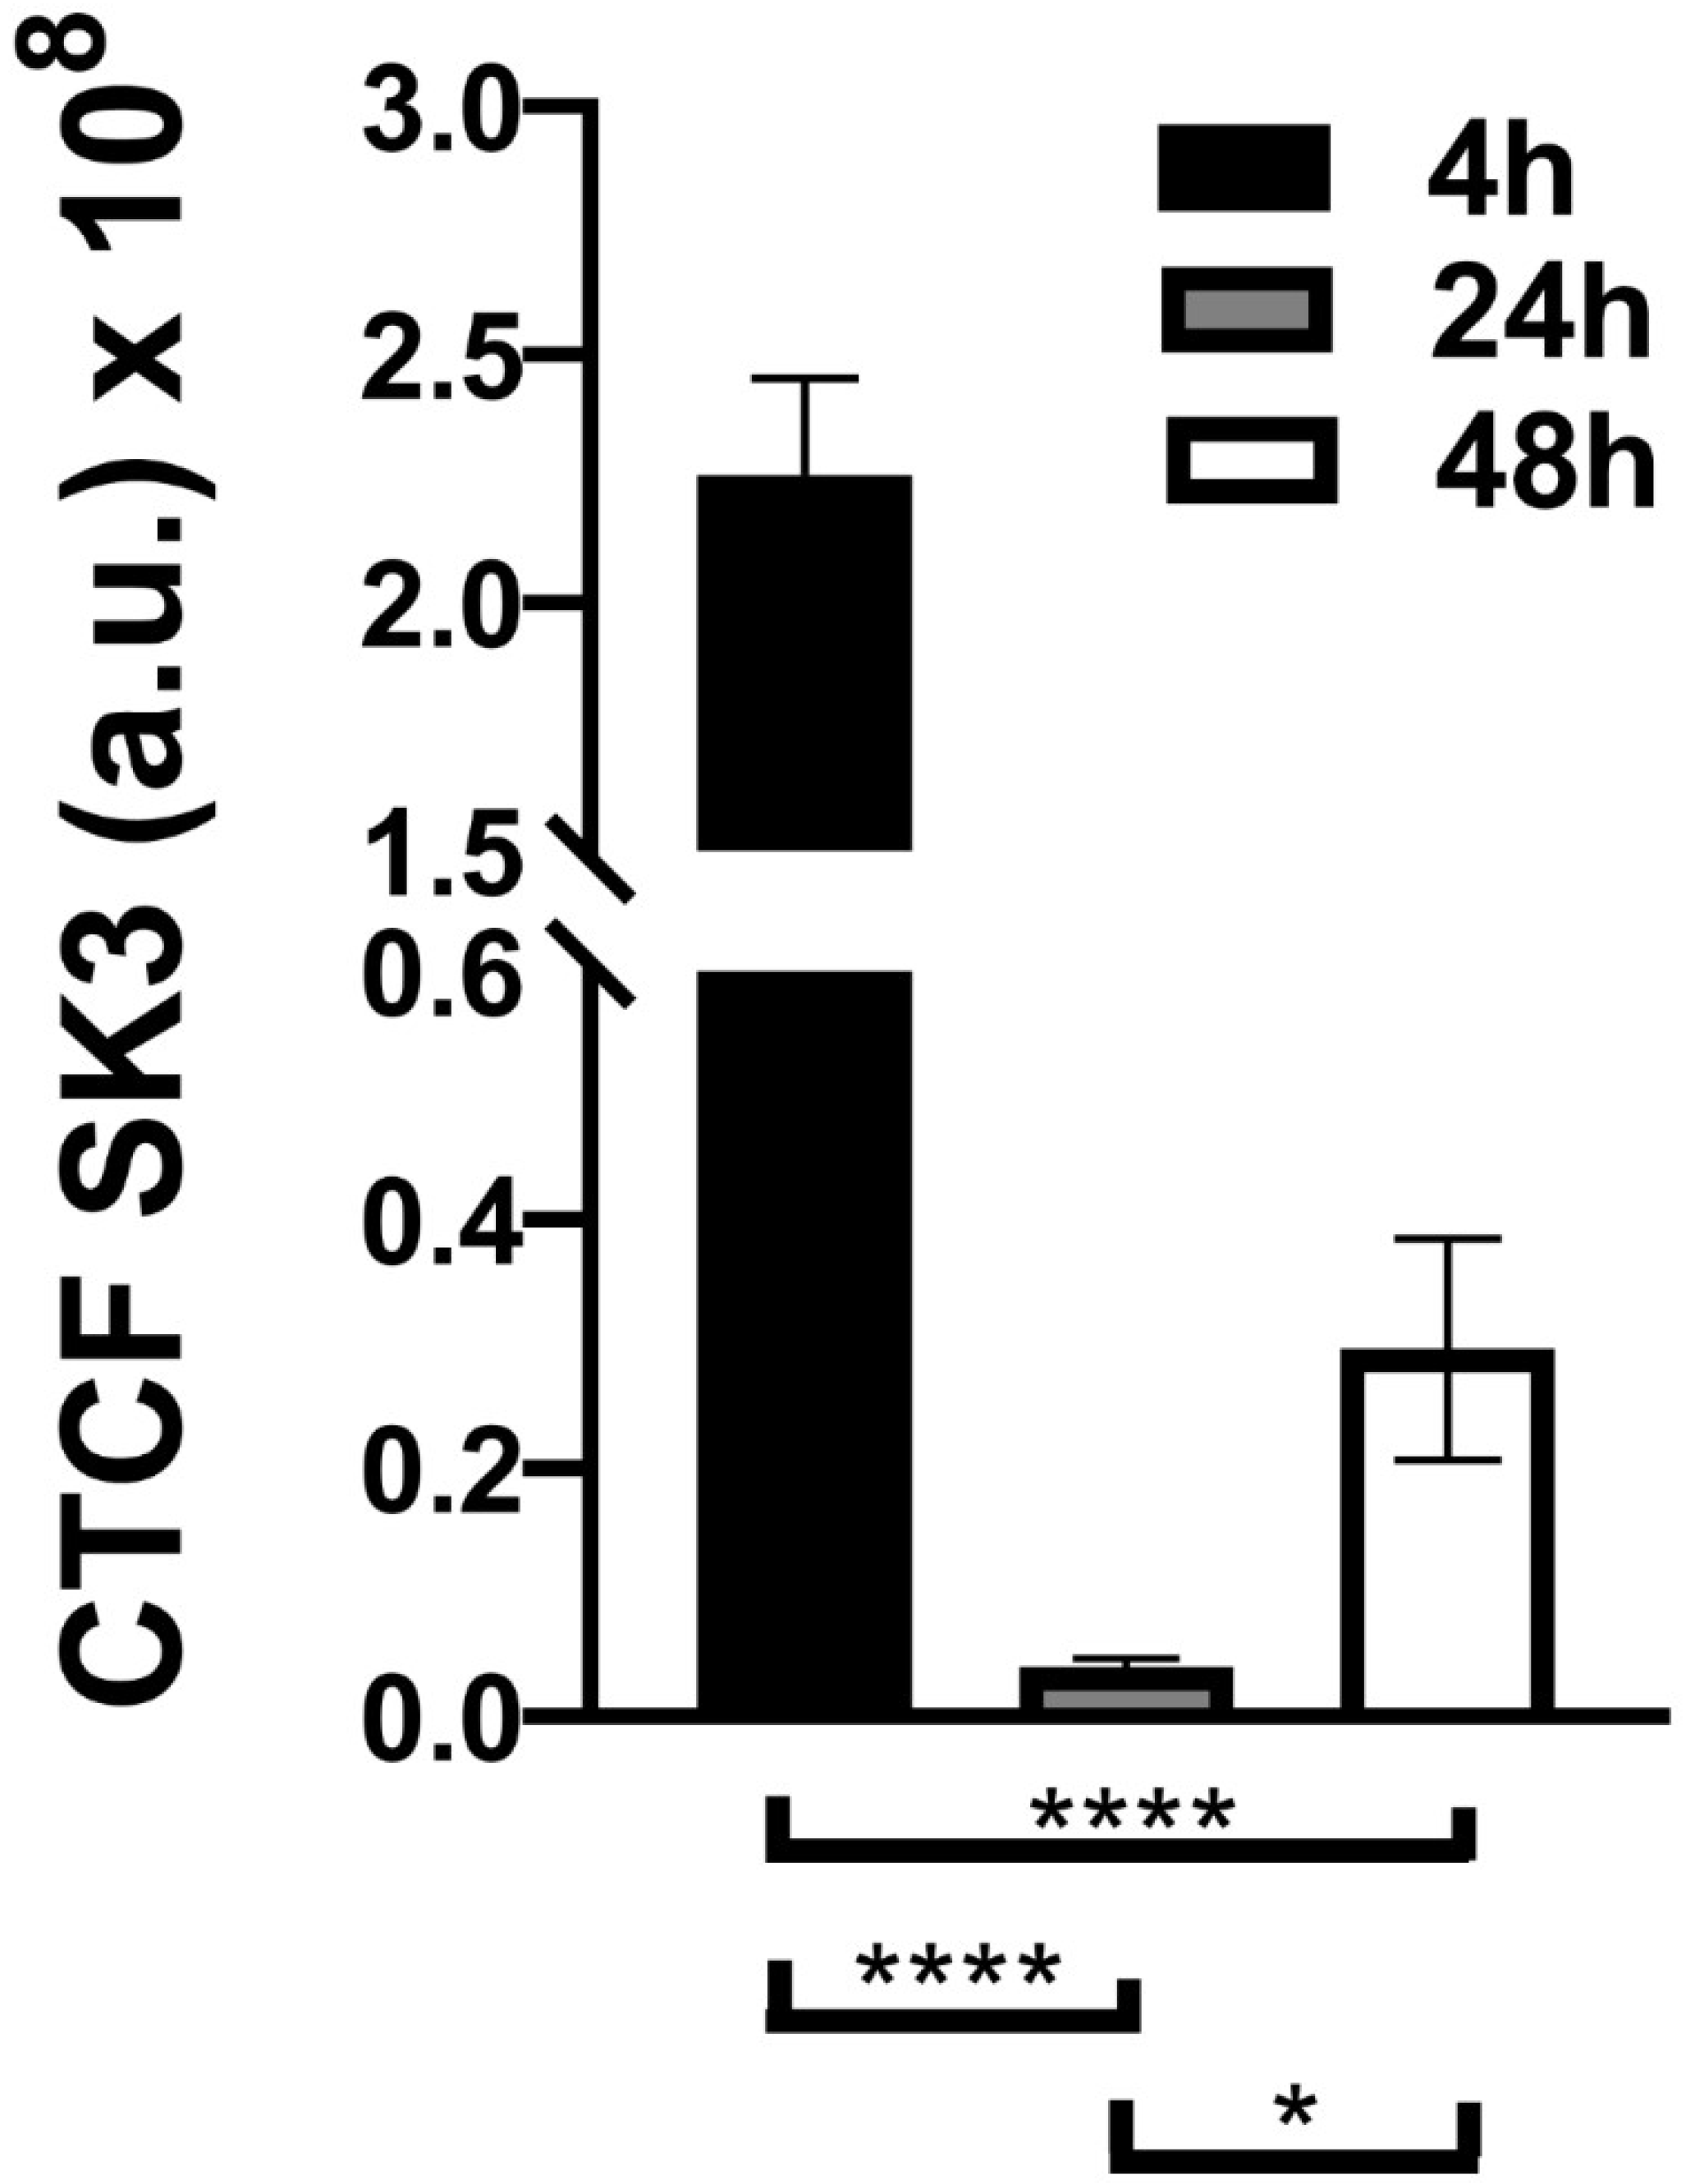
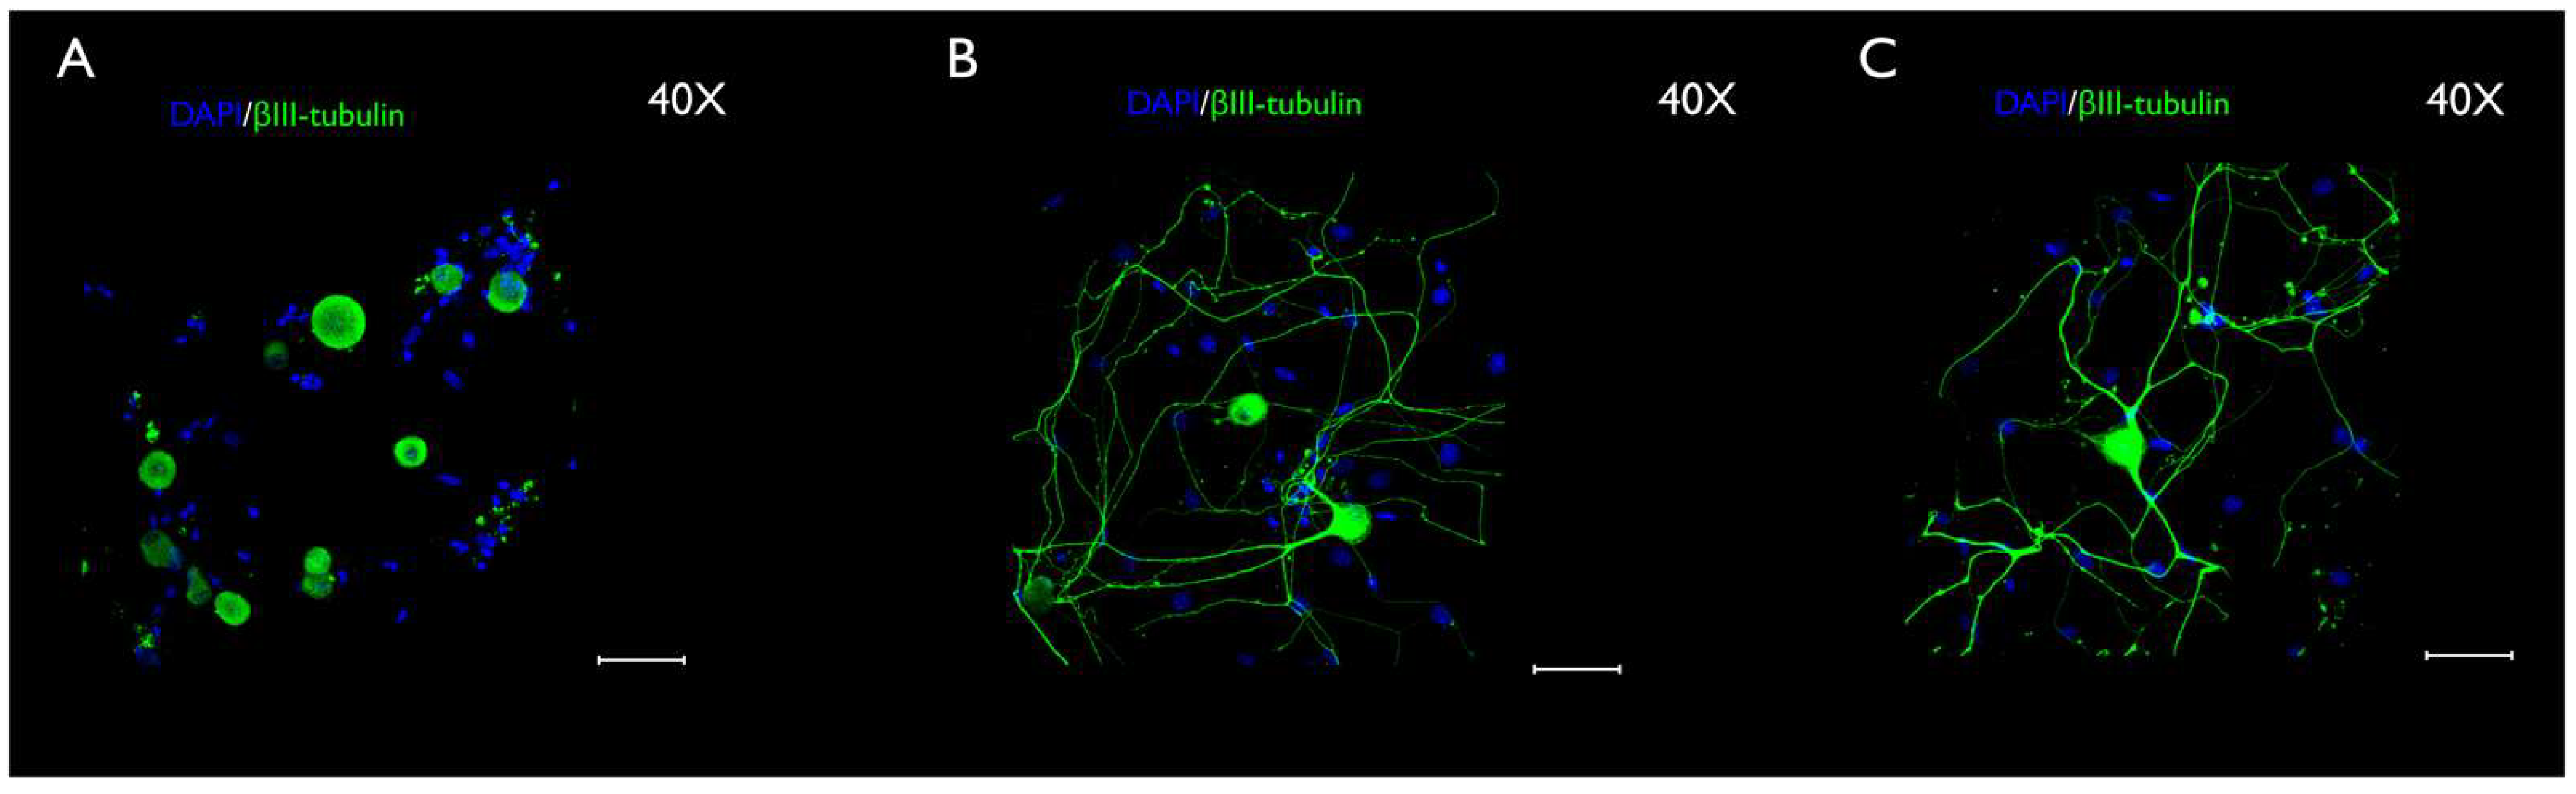
3.3. Immunocytochemistry Evaluation
4. Discussion
5. Conclusions
Supplementary Materials
Author Contributions
Funding
Institutional Review Board Statement
Data Availability Statement
Acknowledgments
Conflicts of Interest
References
- Macfarlane, T.V.; Blinkhorn, A.S.; Davies, R.M.; Kincey, J.; Worthington, H.V. Oro-facial pain in the community: Prevalence and associated impact. Community Dent. Oral Epidemiol. 2002, 30, 52–60. [Google Scholar] [CrossRef] [PubMed]
- Riley, J.L., 3rd; Gilbert, G.H. Orofacial pain symptoms: An interaction between age and sex. Pain 2001, 90, 245–256. [Google Scholar] [CrossRef]
- Häggman-Henrikson, B.; Alstergren, P.; Davidson, T.; Högestätt, E.D.; Östlund, P.; Tranaeus, S.; Vitols, S.; List, T. Pharmacological treatment of oro-facial pain-health technology assessment including a systematic review with network meta-analysis. J. Oral Rehabil. 2017, 44, 800–826. [Google Scholar] [CrossRef] [PubMed]
- Patton, L.L.; Siegel, M.A.; Benoliel, R.; De Laat, A. Management of burning mouth syndrome: Systematic review and management recommendations. Oral Surg. Oral Med. Oral Pathol. Oral Radiol. Endod. 2007, 103, S39.e1–S39.e13. [Google Scholar] [CrossRef]
- Bendtsen, L.; Zakrzewska, J.M.; Abbott, J.; Braschinsky, M.; Di Stefano, G.; Donnet, A.; Eide, P.K.; Leal, P.R.L.; Maarbjerg, S.; May, A.; et al. European Academy of Neurology guideline on trigeminal neuralgia. Eur. J. Neurol. 2019, 26, 831–849. [Google Scholar] [CrossRef] [Green Version]
- Cohen, S.P.; Mao, J. Neuropathic pain: Mechanisms and their clinical implications. BMJ 2014, 348, f7656. [Google Scholar] [CrossRef] [Green Version]
- Mao, J. Current challenges in translational pain research. Trends Pharmacol. Sci. 2012, 33, 568–573. [Google Scholar] [CrossRef] [Green Version]
- Cairns, B.E. Pathophysiology of TMD pain—Basic mechanisms and their implications for pharmacotherapy. J. Oral Rehabil. 2010, 37, 391–410. [Google Scholar] [CrossRef]
- Boye Larsen, D.; Ingemann Kristensen, G.; Panchalingam, V.; Laursen, J.C.; Nørgaard Poulsen, J.; Skallerup Andersen, M.; Kandiah, A.; Gazerani, P. Investigating the expression of metabotropic glutamate receptors in trigeminal ganglion neurons and satellite glial cells: Implications for craniofacial pain. J. Recept. Signal Transduct. Res. 2014, 34, 261–269. [Google Scholar] [CrossRef] [Green Version]
- Ceruti, S.; Fumagalli, M.; Villa, G.; Verderio, C.; Abbracchio, M.P. Purinoceptor-mediated calcium signaling in primary neuron-glia trigeminal cultures. Cell Calcium 2008, 43, 576–590. [Google Scholar] [CrossRef]
- Ceruti, S.; Villa, G.; Fumagalli, M.; Colombo, L.; Magni, G.; Zanardelli, M.; Fabbretti, E.; Verderio, C.; van den Maagdenberg, A.M.; Nistri, A.; et al. Calcitonin gene-related peptide-mediated enhancement of purinergic neuron/glia communication by the algogenic factor bradykinin in mouse trigeminal ganglia from wild-type and R192Q Cav2.1 Knock-in mice: Implications for basic mechanisms of migraine pain. J. Neurosci. 2011, 31, 3638–3649. [Google Scholar] [CrossRef] [PubMed] [Green Version]
- Dubový, P.; Klusáková, I.; Svízenská, I.; Brázda, V. Satellite glial cells express IL-6 and corresponding signal-transducing receptors in the dorsal root ganglia of rat neuropathic pain model. Neuron. Glia Biol. 2010, 6, 73–83. [Google Scholar] [CrossRef] [PubMed]
- Hu, P.; McLachlan, E.M. Macrophage and lymphocyte invasion of dorsal root ganglia after peripheral nerve lesions in the rat. Neuroscience 2002, 112, 23–38. [Google Scholar] [CrossRef]
- Huang, L.Y.; Gu, Y.; Chen, Y. Communication between neuronal somata and satellite glial cells in sensory ganglia. Glia 2013, 61, 1571–1581. [Google Scholar] [CrossRef] [Green Version]
- Hanani, M. Satellite glial cells in sensory ganglia: From form to function. Brain Res. Rev. 2005, 48, 457–476. [Google Scholar] [CrossRef]
- Maro, G.S.; Vermeren, M.; Voiculescu, O.; Melton, L.; Cohen, J.; Charnay, P.; Topilko, P. Neural crest boundary cap cells constitute a source of neuronal and glial cells of the PNS. Nat. Neurosci. 2004, 7, 930–938. [Google Scholar] [CrossRef]
- Coelho-Aguiar, J.e.M.; Bon-Frauches, A.C.; Gomes, A.L.; Veríssimo, C.P.; Aguiar, D.P.; Matias, D.; Thomasi, B.B.; Gomes, A.S.; Brito, G.A.; Moura-Neto, V. The enteric glia: Identity and functions. Glia 2015, 63, 921–935. [Google Scholar] [CrossRef]
- Ji, R.R.; Berta, T.; Nedergaard, M. Glia and pain: Is chronic pain a gliopathy? Pain 2013, 154, S10–S28. [Google Scholar] [CrossRef]
- Pannese, E.; Ledda, M.; Cherkas, P.S.; Huang, T.Y.; Hanani, M. Satellite cell reactions to axon injury of sensory ganglion neurons: Increase in number of gap junctions and formation of bridges connecting previously separate perineuronal sheaths. Anat. Embryol. 2003, 206, 337–347. [Google Scholar] [CrossRef]
- Hanani, M.; Spray, D.C. Emerging importance of satellite glia in nervous system function and dysfunction. Nat. Rev. Neurosci. 2020, 21, 485–498. [Google Scholar] [CrossRef]
- Pannese, E. The Satellite Cells of the Sensory Ganglia; Springer: Berlin/Heidelberg, Germany, 1981; Volume 65, 111p. [Google Scholar]
- Basbaum, A.I.; Bautista, D.M.; Scherrer, G.; Julius, D. Cellular and molecular mechanisms of pain. Cell 2009, 139, 267–284. [Google Scholar] [CrossRef] [PubMed] [Green Version]
- Fishman, S.; Ballantyne, J.; Rathmell, J.P.; Bonica, J.J. Bonica’s Management of Pain; Lippincott, Williams & Wilkins: Philadelphia, PA, USA, 2010. [Google Scholar]
- Wilcox, S.L.; Gustin, S.M.; Eykman, E.N.; Fowler, G.; Peck, C.C.; Murray, G.M.; Henderson, L.A. Trigeminal nerve anatomy in neuropathic and non-neuropathic orofacial pain patients. J. Pain 2013, 14, 865–872. [Google Scholar] [CrossRef] [PubMed]
- Standring, S. Gray’s Anatomy: The Anatomical Basis of Clinical Practice, 40th ed.; Churchill Livingstone: Edinburgh, UK, 2008. [Google Scholar]
- Vos, B.P.; Strassman, A.M.; Maciewicz, R.J. Behavioral evidence of trigeminal neuropathic pain following chronic constriction injury to the rat’s infraorbital nerve. J. Neurosci. 1994, 14, 2708–2723. [Google Scholar] [CrossRef] [PubMed] [Green Version]
- Zhao, J.; Zhang, Y.; Liu, X.; Rao, Y.; Fu, J.; Hua, L.; Ou, C. Activation of SK3 channel plays a pivotal role in modulation of trigeminal neuralgia. Neurol. Res. 2021, 43, 1005–1012. [Google Scholar] [CrossRef] [PubMed]
- Kohler, M.; Hirschberg, B.; Bond, C.T.; Kinzie, J.M.; Marrion, N.V.; Maylie, J.; Adelman, J.P. Small-conductance, calcium-activated potassium channels from mammalian brain. Science 1996, 273, 1709–1714. [Google Scholar] [CrossRef]
- Stocker, M.; Pedarzani, P. Differential distribution of three Ca(2+)-activated K(+) channel subunits, SK1, SK2, and SK3, in the adult rat central nervous system. Mol. Cell Neurosci. 2000, 15, 476–493. [Google Scholar] [CrossRef]
- Bahia, P.K.; Suzuki, R.; Benton, D.C.; Jowett, A.J.; Chen, M.X.; Trezise, D.J.; Dickenson, A.H.; Moss, G.W. A functional role for small-conductance calcium-activated potassium channels in sensory pathways including nociceptive processes. J. Neurosci. 2005, 25, 3489–3498. [Google Scholar] [CrossRef] [Green Version]
- Mongan, L.C.; Hill, M.J.; Chen, M.X.; Tate, S.N.; Collins, S.D.; Buckby, L.; Grubb, B.D. The distribution of small and intermediate conductance calcium-activated potassium channels in the rat sensory nervous system. Neuroscience 2005, 131, 161–175. [Google Scholar] [CrossRef]
- Vit, J.P.; Jasmin, L.; Bhargava, A.; Ohara, P.T. Satellite glial cells in the trigeminal ganglion as a determinant of orofacial neuropathic pain. Neuron. Glia Biol. 2006, 2, 247–257. [Google Scholar] [CrossRef] [Green Version]
- Poulsen, J.N.; Larsen, F.; Duroux, M.; Gazerani, P. Primary culture of trigeminal satellite glial cells: A cell-based platform to study morphology and function of peripheral glia. Int. J. Physiol. Pathophysiol. Pharmacol. 2014, 6, 1–12. [Google Scholar]
- Erzurumlu, R.S.; Jhaveri, S.; Takahashi, H.; McKay, R.D. Target-derived influences on axon growth modes in cultures of trigeminal neurons. Proc. Natl. Acad. Sci. USA 1993, 90, 7235–7239. [Google Scholar] [CrossRef] [PubMed] [Green Version]
- Belzer, V.; Shraer, N.; Hanani, M. Phenotypic changes in satellite glial cells in cultured trigeminal ganglia. Neuron. Glia Biol. 2010, 6, 237–243. [Google Scholar] [CrossRef] [PubMed]
- Jager, S.B.; Pallesen, L.T.; Vaegter, C.B. Isolation of satellite glial cells for high-quality RNA purification. J. Neurosci. Methods 2018, 297, 1–8. [Google Scholar] [CrossRef] [PubMed]
- Jager, S. Satellite Glial Cell Involvement in Neuropathic Pain; Aarhus University: Aarhus, Denmark, 2018. [Google Scholar]
- Jager, S.E.; Pallesen, L.T.; Richner, M.; Harley, P.; Hore, Z.; McMahon, S.; Denk, F.; Vaegter, C.B. Changes in the transcriptional fingerprint of satellite glial cells following peripheral nerve injury. Glia 2020, 68, 1375–1395. [Google Scholar] [CrossRef]
- Weick, M.; Cherkas, P.S.; Hartig, W.; Pannicke, T.; Uckermann, O.; Bringmann, A.; Tal, M.; Reichenbach, A.; Hanani, M. P2 receptors in satellite glial cells in trigeminal ganglia of mice. Neuroscience 2003, 120, 969–977. [Google Scholar] [CrossRef]
- Kilkenny, C.; Browne, W.J.; Cuthill, I.C.; Emerson, M.; Altman, D.G. Improving bioscience research reporting: The arrive guidelines for reporting animal research. PLoS Biol. 2010, 8, e1000412. [Google Scholar] [CrossRef]
- Hossain, M.Z.; Unno, S.; Ando, H.; Masuda, Y.; Kitagawa, J. Neuron-Glia Crosstalk and Neuropathic Pain: Involvement in the Modulation of Motor Activity in the Orofacial Region. Int. J. Mol. Sci. 2017, 18, 2051. [Google Scholar] [CrossRef] [Green Version]
- Milosavljevic, A.; Jancic, J.; Mircic, A.; Dozic, A.; Boljanovic, J.; Milisavljevic, M.; Cetkovic, M. Morphological and functional characteristics of satellite glial cells in the peripheral nervous system. Folia Morphol. 2021, 80, 745–755. [Google Scholar] [CrossRef]
- George, D.; Ahrens, P.; Lambert, S. Satellite glial cells represent a population of developmentally arrested Schwann cells. Glia 2018, 66, 1496–1506. [Google Scholar] [CrossRef]
- Jessen, K.R.; Mirsky, R. The origin and development of glial cells in peripheral nerves. Nat. Rev. Neurosci. 2005, 6, 671–682. [Google Scholar] [CrossRef]
- Fex Svenningsen, A.; Colman, D.R.; Pedraza, L. Satellite cells of dorsal root ganglia are multipotential glial precursors. Neuron. Glia Biol. 2004, 1, 85–93. [Google Scholar] [CrossRef] [PubMed] [Green Version]
- Li, H.Y.; Say, E.H.; Zhou, X.F. Isolation and characterization of neural crest progenitors from adult dorsal root ganglia. Stem. Cells 2007, 25, 2053–2065. [Google Scholar] [CrossRef] [PubMed] [Green Version]
- Capuano, A.; De Corato, A.; Lisi, L.; Tringali, G.; Navarra, P.; Dello Russo, C. Proinflammatory-activated trigeminal satellite cells promote neuronal sensitization: Relevance for migraine pathology. Mol. Pain 2009, 5, 43. [Google Scholar] [CrossRef] [PubMed] [Green Version]
- Kristiansen, K.A.; Edvinsson, L. Neurogenic inflammation: A study of rat trigeminal ganglion. J. Headache Pain 2010, 11, 485–495. [Google Scholar] [CrossRef] [Green Version]
- Simonetti, M.; Fabbro, A.; D’Arco, M.; Zweyer, M.; Nistri, A.; Giniatullin, R.; Fabbretti, E. Comparison of P2X and TRPV1 receptors in ganglia or primary culture of trigeminal neurons and their modulation by NGF or serotonin. Mol. Pain 2006, 2, 11. [Google Scholar] [CrossRef] [PubMed] [Green Version]
- Ruan, H.Z.; Moules, E.; Burnstock, G. Changes in P2X3 purinoceptors in sensory ganglia of the mouse during embryonic and postnatal development. Histochem. Cell Biol. 2004, 122, 539–551. [Google Scholar] [CrossRef] [PubMed]


Publisher’s Note: MDPI stays neutral with regard to jurisdictional claims in published maps and institutional affiliations. |
© 2022 by the authors. Licensee MDPI, Basel, Switzerland. This article is an open access article distributed under the terms and conditions of the Creative Commons Attribution (CC BY) license (https://creativecommons.org/licenses/by/4.0/).
Share and Cite
Veríssimo, C.P.; Acosta Filha, L.G.; Moreira da Silva, F.J.; Westgarth, H.; Coelho Aguiar, J.D.M.; Pontes, B.; Moura-Neto, V.; Gazerani, P.; DosSantos, M.F. Short-Term Functional and Morphological Changes in the Primary Cultures of Trigeminal Ganglion Cells. Curr. Issues Mol. Biol. 2022, 44, 1257-1272. https://0-doi-org.brum.beds.ac.uk/10.3390/cimb44030084
Veríssimo CP, Acosta Filha LG, Moreira da Silva FJ, Westgarth H, Coelho Aguiar JDM, Pontes B, Moura-Neto V, Gazerani P, DosSantos MF. Short-Term Functional and Morphological Changes in the Primary Cultures of Trigeminal Ganglion Cells. Current Issues in Molecular Biology. 2022; 44(3):1257-1272. https://0-doi-org.brum.beds.ac.uk/10.3390/cimb44030084
Chicago/Turabian StyleVeríssimo, Carla Pires, Lionete Gall Acosta Filha, Fábio Jorge Moreira da Silva, Harrison Westgarth, Juliana De Mattos Coelho Aguiar, Bruno Pontes, Vivaldo Moura-Neto, Parisa Gazerani, and Marcos F. DosSantos. 2022. "Short-Term Functional and Morphological Changes in the Primary Cultures of Trigeminal Ganglion Cells" Current Issues in Molecular Biology 44, no. 3: 1257-1272. https://0-doi-org.brum.beds.ac.uk/10.3390/cimb44030084