Influence of Functional Classification on Skill Tests in Elite Female Wheelchair Basketball Athletes

 , ,
, ,
Abstract
:1. Introduction
2. Materials and Methods
2.1. Participants
2.2. Field-Based Skill Tests
2.2.1. 20 m Sprint
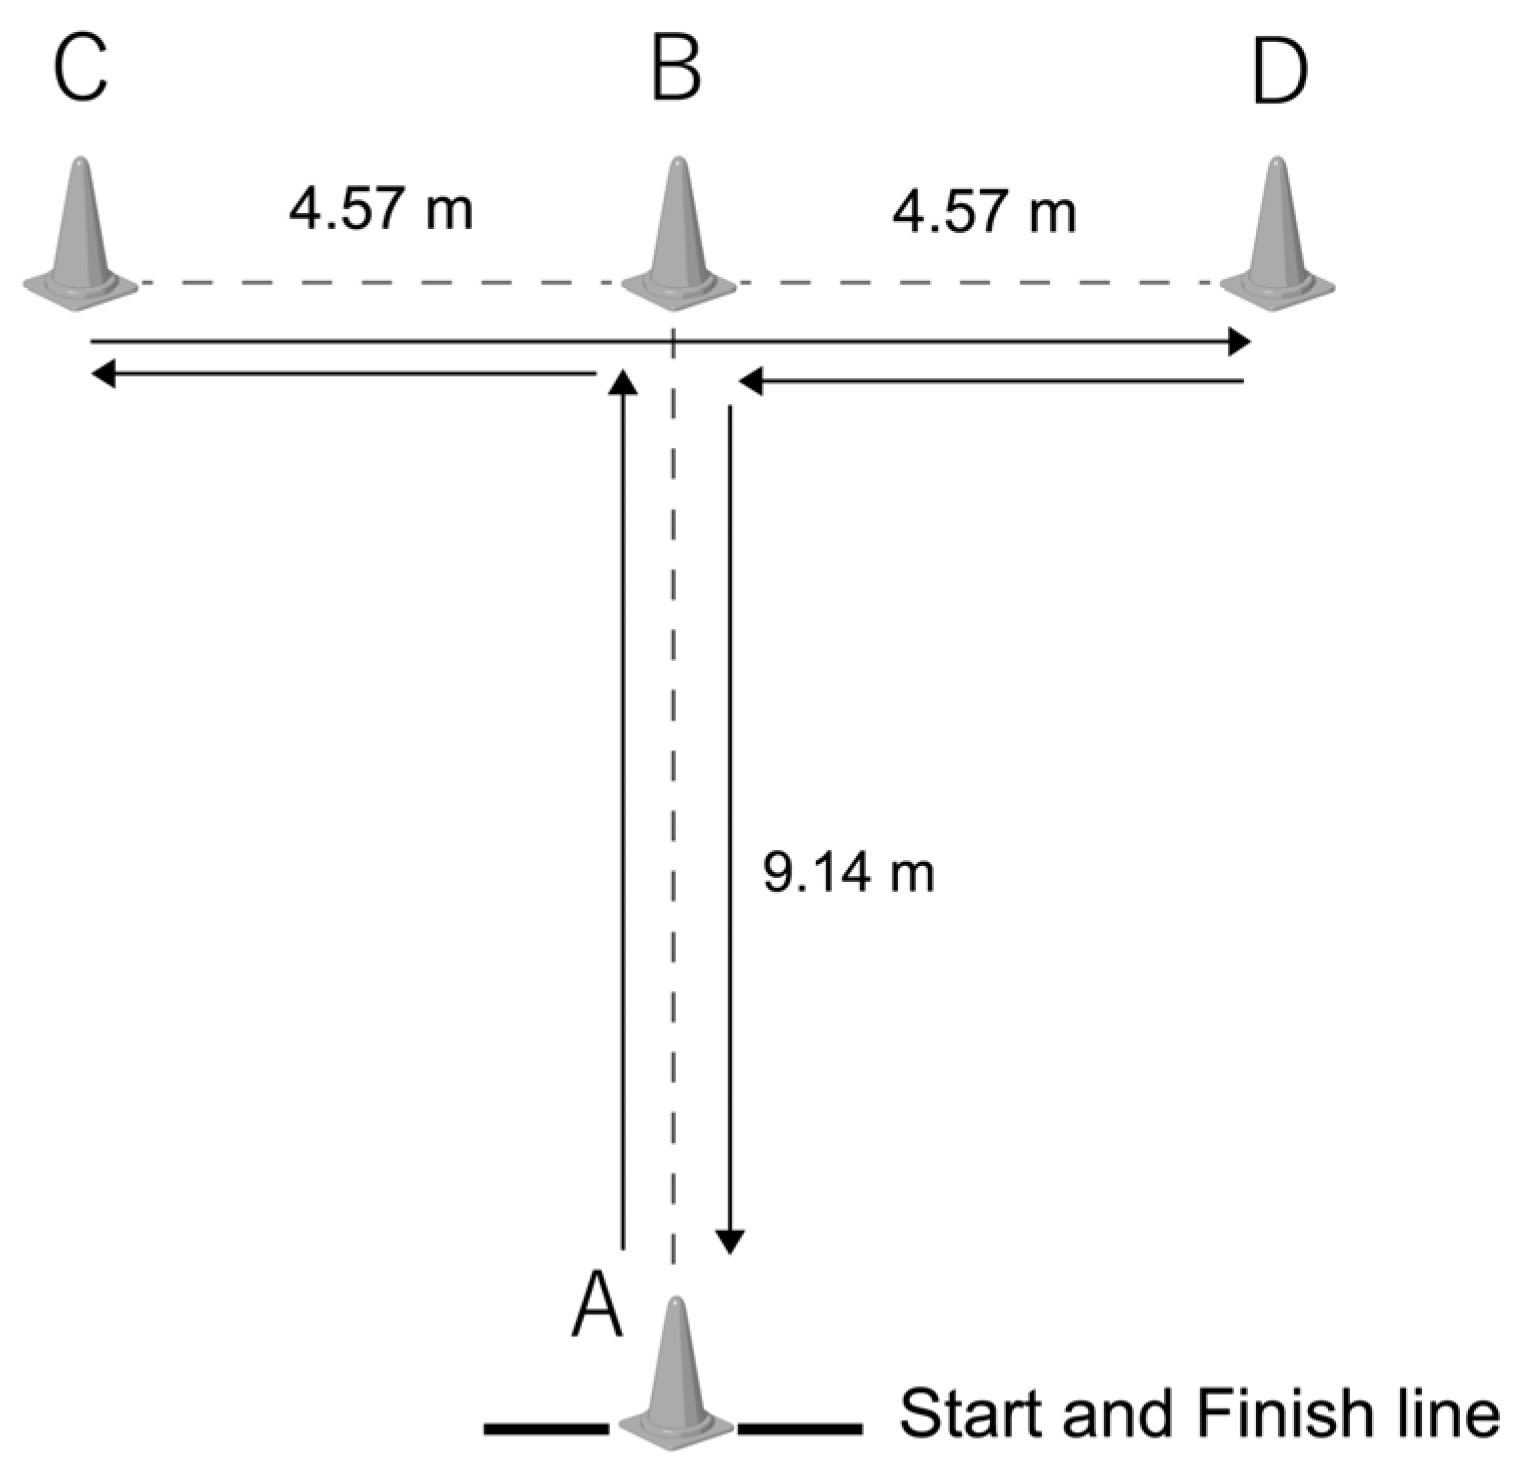
2.2.2. Agility T-Test (Figure 1)
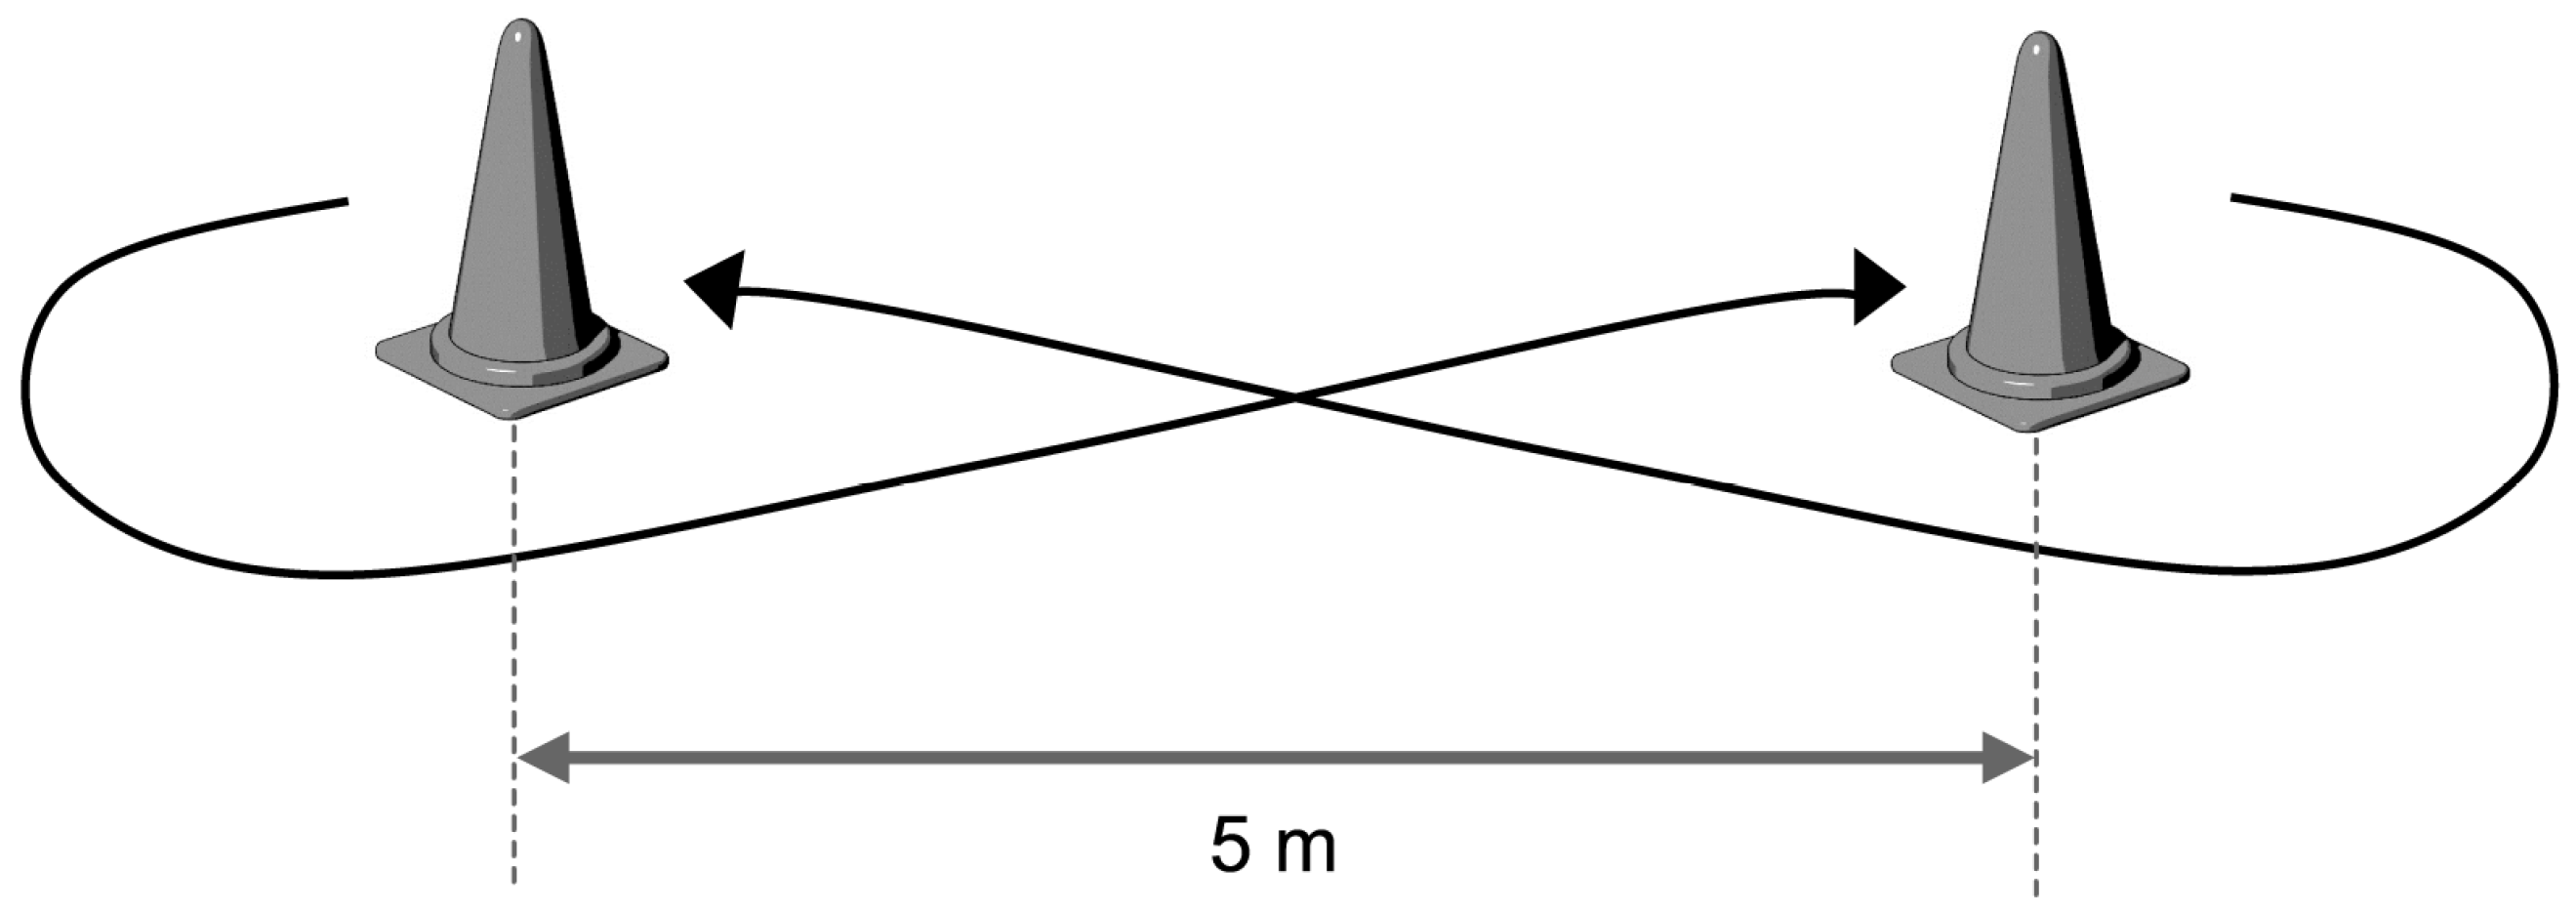
2.2.3. Figure-Eight with a Ball Test (Figure 2)
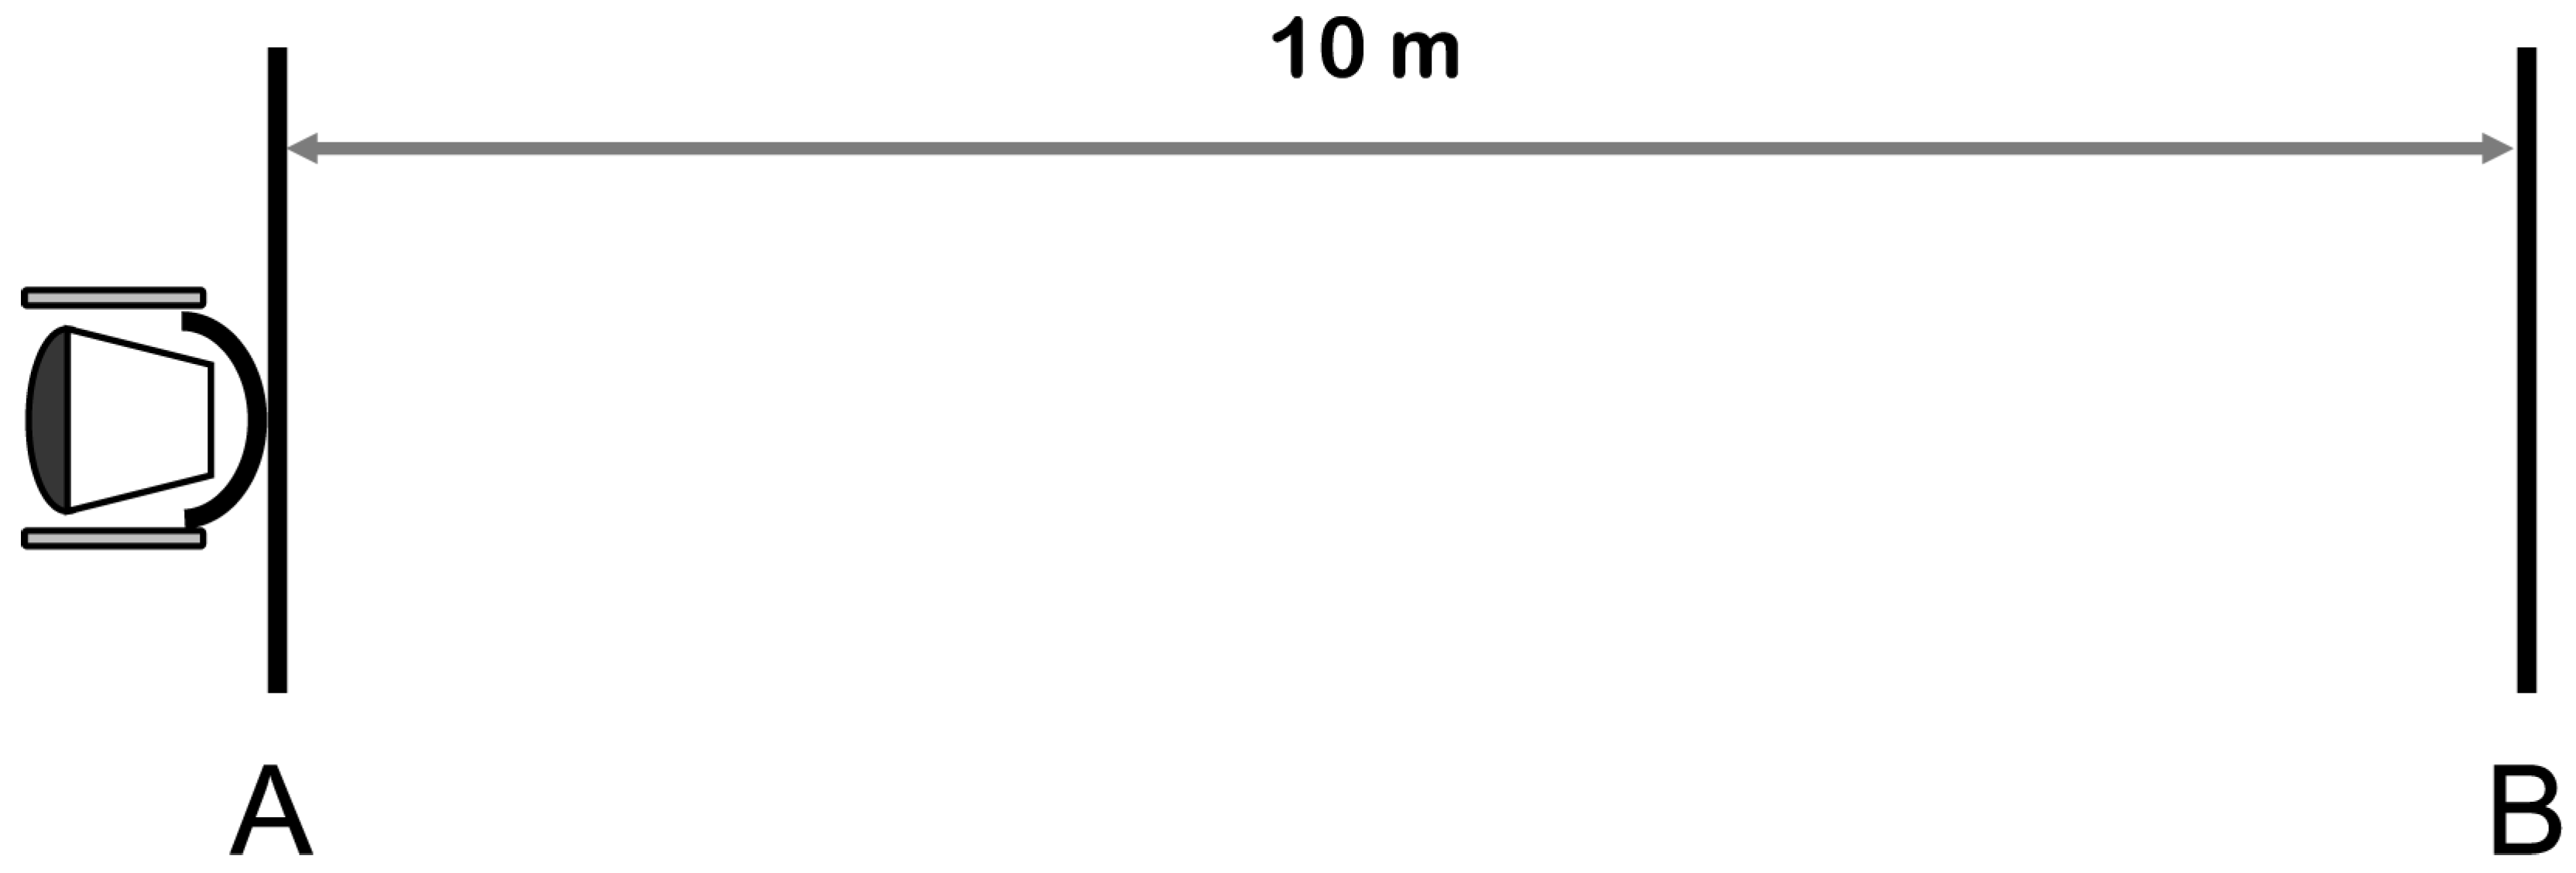
2.2.4. Yo-Yo 10 m Recovery Test (Figure 3)
2.2.5. Maximal Pass
2.3. Statistical Analysis
3. Results
4. Discussion
5. Conclusions
Author Contributions
Funding
Acknowledgments
Conflicts of Interest
References
- International Wheelchair Basketball Federation. IWBF Official Player Classification Manual 2014. Available online: https://iwbf.org/wp-content/uploads/2017/09/CLASSIFICATION-MANUAL-2014-2018-ENGLISH-FINAL.pdf (accessed on 7 October 2019).
- Hutzler, Y.; Ochana, S.; Bolotin, R.; Kalina, E. Aerobic and anaerobic arm-cranking power outputs of males with lower limb impairments: Relationship with sport participation intensity, age, impairment and functional classification. Spinal Cord 1998, 36, 205–212. [Google Scholar] [CrossRef] [PubMed]
- Molik, B.; Kosmol, A.; Laskin, J.J.; Morgulec-Adamowicz, N. Wheelchair basketball skill tests: Differences between athletes’ functional classification level and disability type. Fiz. Rehabil. 2010, 21, 11–19. [Google Scholar]
- De Lira, C.A.; Vancini, R.L.; Minozzo, F.C.; Sousa, B.S.; Dubas, J.P.; Andrade, M.S.; Steinberg, L.L.; da Silva, A.C. Relationship between aerobic and anaerobic parameters and functional classification in wheelchair basketball players. Scand. J. Med. Sci. Sports 2010, 20, 638–643. [Google Scholar] [CrossRef] [PubMed]
- Marszalek, J.; Gryko, K.; Kosmol, A.; Morgulec-Adamowicz, N.; Mróz, A.; Molik, B. Wheelchair basketball competition heart rate profile according to players’ functional classification, tournament level, game type, game quarter and playing time. Front. Psychol. 2019, 10, 773. [Google Scholar] [CrossRef]
- Gil-Agudo, A.; Del Ama-Espinosa, A.; Crespo-Ruiz, B. Wheelchair basketball quantification. Phys. Med. Rehabil. Clin. N. Am. 2010, 21, 141–156. [Google Scholar] [CrossRef]
- Vanlandewijck, Y.C.; Spaepen, A.J.; Lysens, R.J. Wheelchair propulsion: Functional ability dependent factors in wheelchair basketball players. Scand. J. Rehabil. Med. 1994, 26, 37–48. [Google Scholar]
- Vanlandewijck, Y.C.; Spaepen, A.J.; Lysens, R.J. Relationship between the level of physical impairment and sports performance in elite wheelchair basketball athletes. Adapt. Phys. Act. Q. 1995, 12, 139–150. [Google Scholar] [CrossRef]
- Vanlandewijck, Y.C.; Evaggelinou, C.; Daly, D.D.; Van Houtte, S.; Verellen, J.; Aspeslagh, V.; Hendrickx, R.; Piessens, T.; Zwakhoven, B. Proportionality in wheelchair basketball classification. Adapt. Phys. Act. Q. 2003, 20, 369–380. [Google Scholar] [CrossRef]
- Vanlandewijck, Y.C.; Evaggelinou, C.; Daly, D.J.; Verellen, J.; Van Houtte, S.; Aspeslagh, V.; Hendrickx, R.; Piessens, T.; Zwakhoven, B. The relationship between functional potential and field performance in elite female wheelchair basketball players. J. Sports Sci. 2004, 22, 668–675. [Google Scholar] [CrossRef]
- Molik, B.; Laskin, J.J.; Kosmol, A.; Skucas, K.; Bida, U. Relationship between functional classification levels and anaerobic performance of wheelchair basketball athletes. Res. Q. Exerc. Sport 2010, 81, 69–73. [Google Scholar] [CrossRef]
- Molik, B.; Laskin, J.J.; Kosmol, A.; Marszalek, J. Relationships between anaerobic performance, field tests, and functional level of elite female wheelchair basketball athletes. Hum. Mov. 2013, 14, 366–371. [Google Scholar] [CrossRef]
- Gil, S.M.; Yanci, J.; Otero, M.; Olasagasti, J.; Badiola, A.; Bidaurrazaga-Letona, I.; Iturricastillo, A.; Granados, C. The functional classification and field test performance in wheelchair basketball players. J. Hum. Kinet. 2015, 46, 219–230. [Google Scholar] [CrossRef] [PubMed]
- Cavedon, V.; Zancanaro, C.; Milanese, C. Physique and performance of young wheelchair basketball players in relation with classification. PLoS ONE 2015, 10, e0143621. [Google Scholar] [CrossRef]
- Marszalek, J.; Kosmol, A.; Morgulec-Adamowicz, N.; Mróz, A.; Gryko, K.; Klavina, A.; Skucas, K.; Navia, J.A.; Molik, B. Laboratory and non-laboratory assessment of anaerobic performance of elite male wheelchair basketball athletes. Front. Psychol. 2019, 10, 514. [Google Scholar] [CrossRef] [PubMed]
- Yanci, J.; Granados, C.; Otero, M.; Badiola, A.; Olasagasti, J.; Bidaurrazaga-Letona, I.; Iturricastillo, A.; Gil, S.M. Sprint, agility, strength and endurance capacity in wheelchair basketball players. Biol. Sport 2015, 32, 71–78. [Google Scholar] [CrossRef]
- Sassi, R.H.; Dardouri, W.; Yahmed, M.H.; Gmada, N.; Mahfoudhi, M.E.; Gharbi, Z. Relative and absolute reliability of a modified agility T-test and its relationship with vertical jump and straight sprint. J. Strength Cond. Res. 2009, 23, 1644–1651. [Google Scholar] [CrossRef]
- Vanlandewijck, Y.C.; Daly, D.J.; Theisen, D.M. Field test evaluation of aerobic, anaerobic, and wheelchair basketball skill performances. Int. J. Sports Med. 1999, 20, 548–554. [Google Scholar] [CrossRef]
- Cohen, J. Statistical Power Analysis for the Behavioral Sciences; Lawrence Earlbaum Associates: Hillsdale, NJ, USA, 1988. [Google Scholar]
- Frogley, M. Wheelchair basketball. In Wheelchair Sport; Goosey-Tolfrey, V., Ed.; Human Kinetics: Champaign, IL, USA, 2010; pp. 120–132. [Google Scholar]
- Brasile, F.M.; Hedrick, B.N. The relationship of skills of elite wheelchair basketball competitors to the International Functional Classification System. Recreat. J. 1996, 30, 114–127. [Google Scholar]
- Wilson, J.R.; Liegey-Dougall, A.; Garner, D. Relationship between elite women’s wheelchair basketball skills testing and future success in the sport. Sports Exerc. Med. 2018, 4, 3–8. [Google Scholar] [CrossRef]
- Doi, T.; Mutsuzaki, H.; Tachibana, K.; Wadano, Y.; Iwai, K. Contributions to the team score by male wheelchair basketball players with different physical capacities at the Rio 2016 Paralympics. J. Phys. Sci. 2018, 30, 948–951. [Google Scholar] [CrossRef]
- Doi, T.; Mutsuzaki, H.; Tachibana, K.; Wadano, Y.; Iwai, K. Difference in contributions to the team’s score in female wheelchair basketball at the 2016 Rio Paralympics by physical capability classification. J. Phys. Sci. 2018, 30, 500–503. [Google Scholar] [CrossRef]
- Brasile, F.M. Performance evaluation of wheelchair athletes: More than a disability classification level issue. Adapt. Phys. Act. Q. 1990, 7, 289–297. [Google Scholar] [CrossRef]
- De Groot, S.; Balvers, I.J.; Kouwenhoven, S.M.; Janssen, T.W. Validity and reliability of tests determining performance-related components of wheelchair basketball. J. Sports Sci. 2012, 30, 879–887. [Google Scholar] [CrossRef] [PubMed]
- De Witte, A.M.H.; Hoozemans, M.J.M.; Berger, M.A.M.; van der Slikke, R.M.A.; van der Woude, L.H.V.; Veeger, D.H.E.J. Development, construct validity and test-retest reliability of a field-based wheelchair mobility performance test for wheelchair basketball. J. Sports Sci. 2018, 36, 23–32. [Google Scholar] [CrossRef] [PubMed]
- Van der Slikke, R.M.; Berger, M.A.; Bregman, D.J.; Lagerberg, A.H.; Veeger, H.E. Opportunities for measuring wheelchair kinematics in match settings; reliability of a three inertial sensor configuration. J. Biomech. 2015, 48, 3398–3405. [Google Scholar] [CrossRef] [PubMed]
- Van der Slikke, R.M.A.; Berger, M.A.M.; Bregman, D.J.J.; Bregman, D.J.J.; Veeger, H.E.J. From big data to rich data: The key features of athlete wheelchair mobility performance. J. Biomech. 2016, 49, 3340–3346. [Google Scholar] [CrossRef]
- Van der Slikke, R.M.A.; Bregman, D.J.J.; Berger, M.A.M.; de Witte, A.M.H.; Veeger, D.H.E.J. The future of classification in wheelchair sports: Can data science and technological advancement offer an alternative point of view? Int. J. Sports Physiol. Perform. 2018, 13, 742–749. [Google Scholar] [CrossRef]


| N | Mean ± SD or % | |
|---|---|---|
| age (years) | 26 | 31.2 ± 8.0 |
| wheelchair basketball experience (years) | 26 | 10.7 ± 6.4 |
| height (cm) | 26 | 154.7 ± 11.0 |
| arm span (cm) | 26 | 160.8 ± 6.3 |
| underlying disease | ||
| spinal cord injury | 12 | 46.2% |
| spina bifida | 6 | 23.1% |
| skeletal system disorder | 6 | 23.1% |
| amputation | 2 | 7.7% |
| class (IWBF classification) | ||
| class 1 (classes 1.0 and 1.5) | 7 | 26.9% |
| class 2 (classes 2.0 and 2.5) | 7 | 26.9% |
| class 3 (classes 3.0 and 3.5) | 4 | 15.4% |
| class 4 (classes 4.0 and 4.5) | 8 | 30.8% |
| Class 1 | Class 2 | Class 3 | Class 4 | ANOVA | Effect Size | ||
|---|---|---|---|---|---|---|---|
| (n = 7) | (n = 7) | (n = 4) | (n = 8) | F | P | η2 | |
| age (years) | 29.7 ± 11.07 | 30.0 ± 7.4 | 37.5 ± 3.9 | 30.25 ± 6.6 | 0.992 | 0.415 | 0.12 |
| wheelchair basketball experience (years) | 12.9 ± 8.23 | 9.9 ± 5.0 | 12.5 ± 8.2 | 8.63 ± 5.2 | 0.657 | 0.587 | 0.08 |
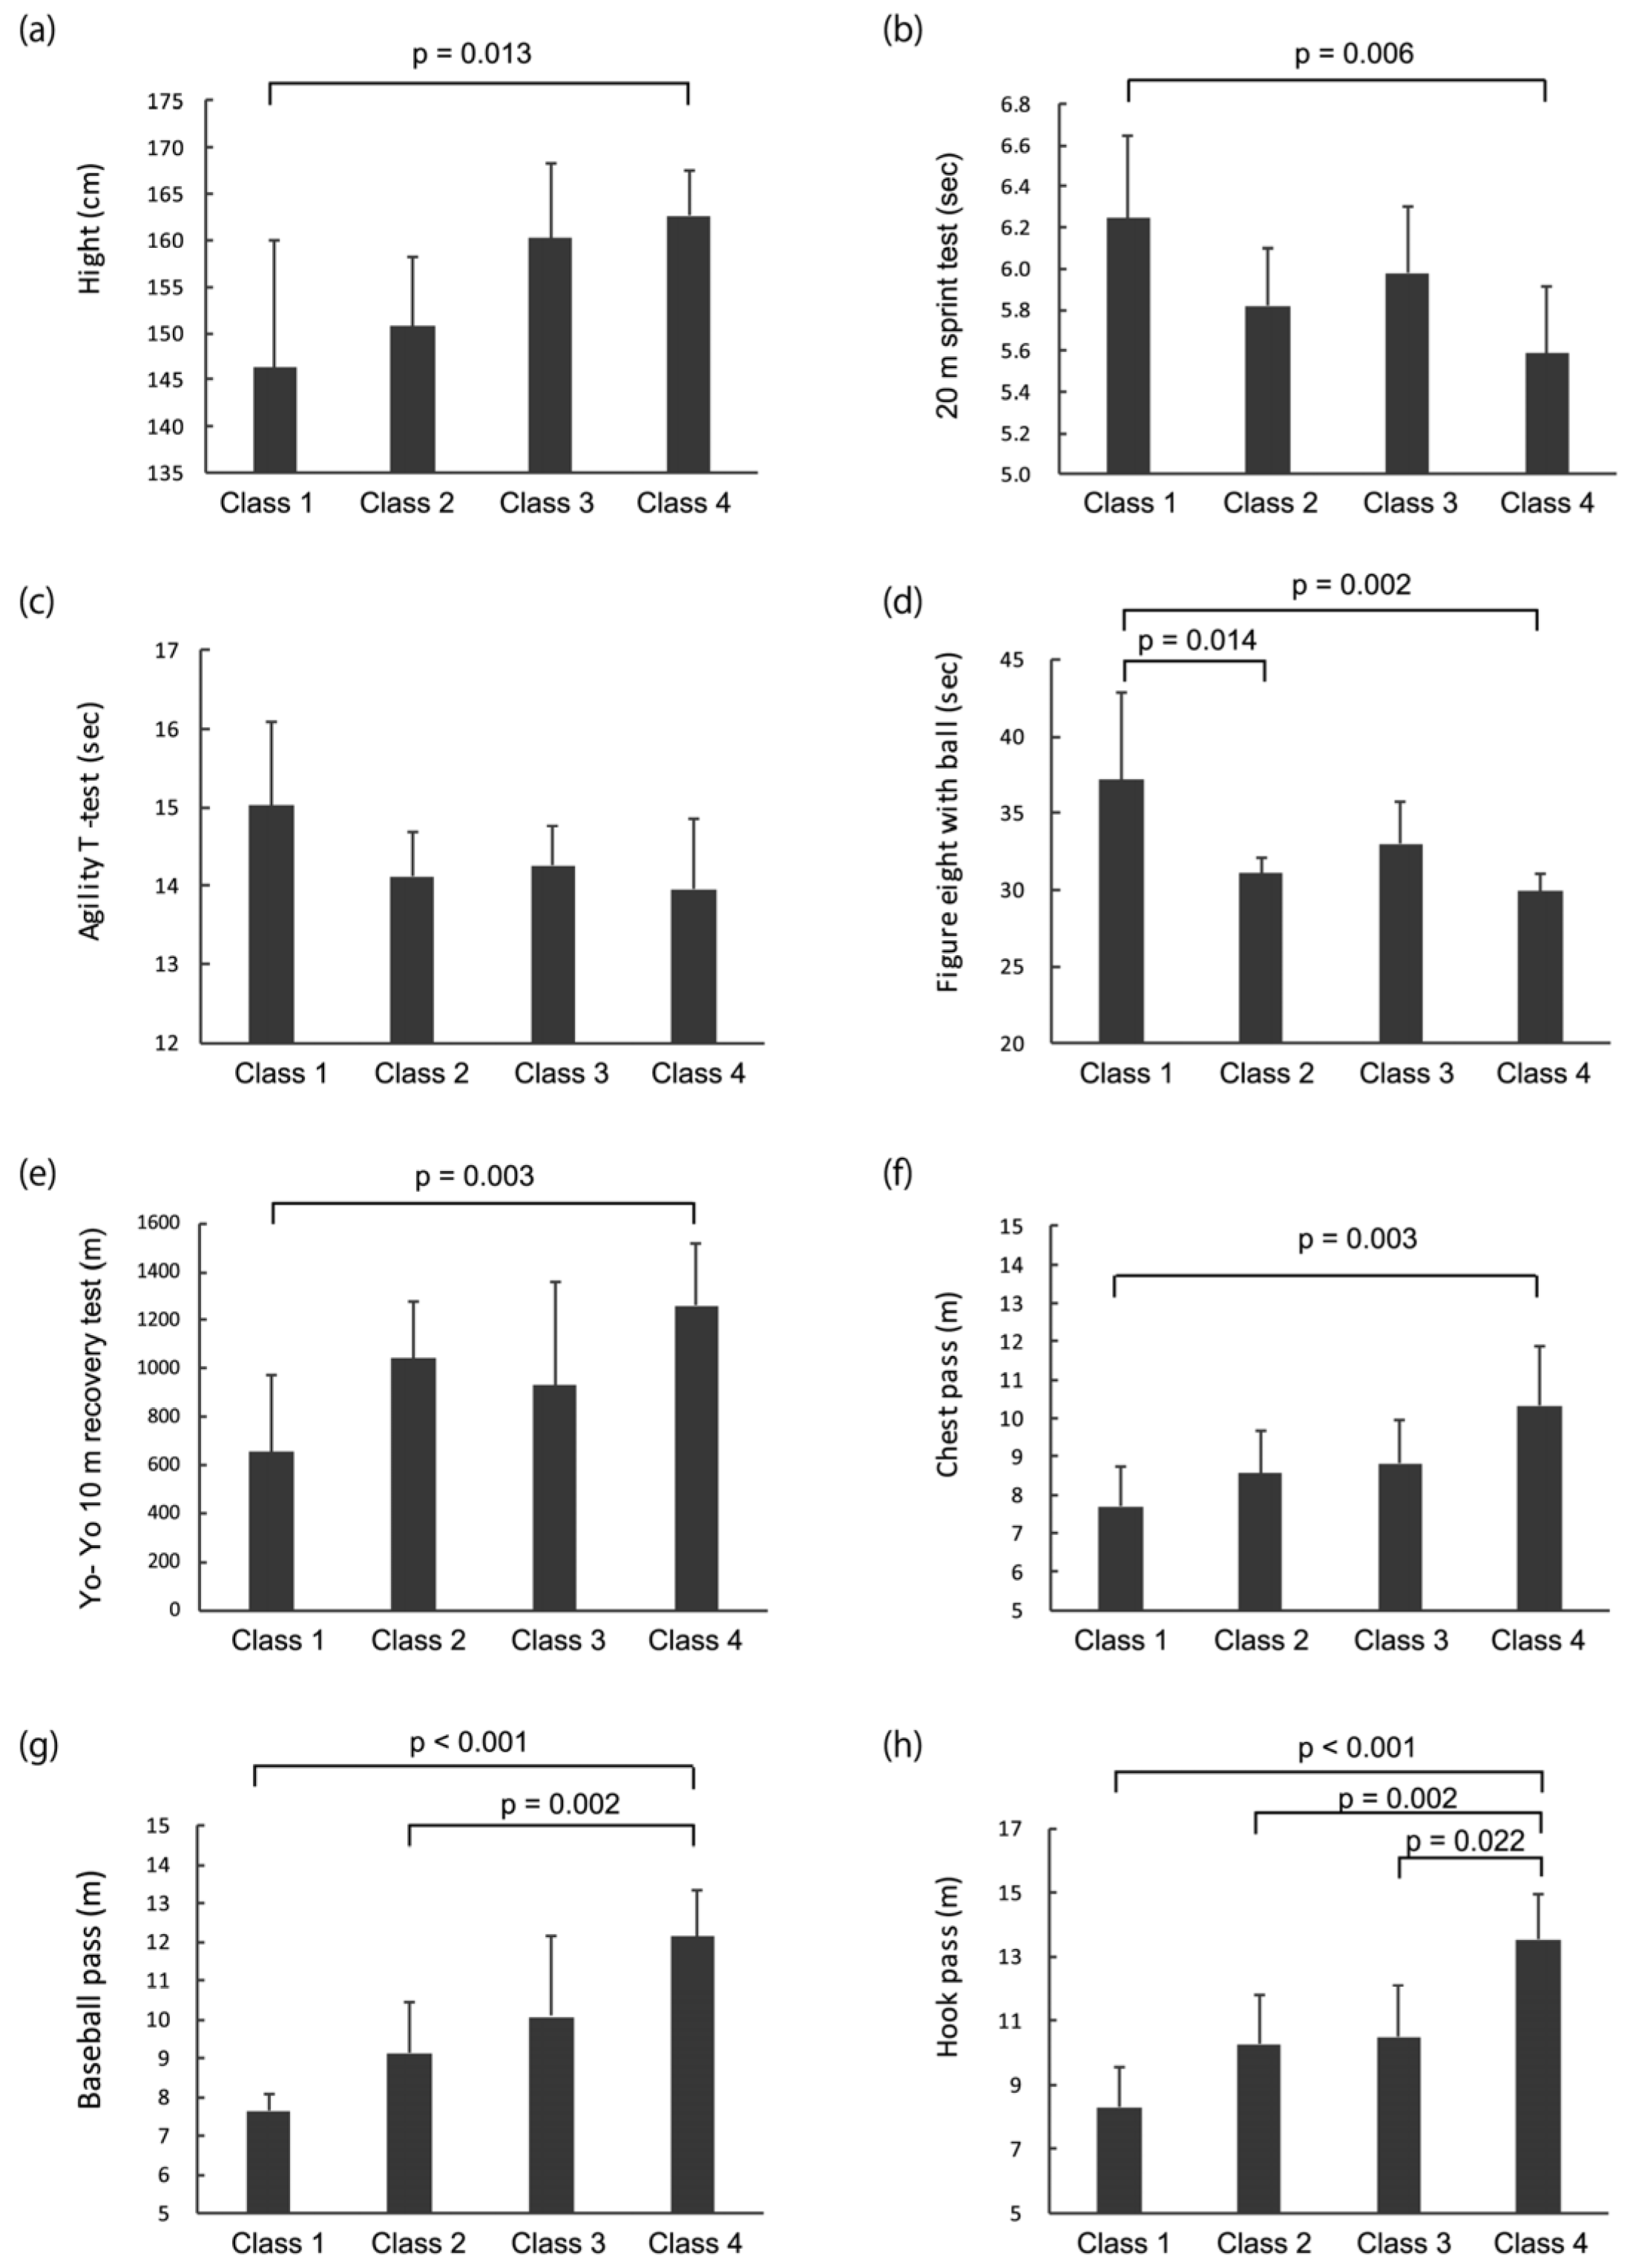
| height (cm) | 146.35 ± 13.7 | 150.8 ± 7.5 | 160.2 ± 8.2 | 162.7 ± 4.9 | 5.469 ^ | 0.019 * | 0.40 |
| arm span (cm) | 159.5 ± 5.5 | 157.5 ± 7.2 | 163.0 ± 4.4 | 163.7 ± 6.3 | 1.528 | 0.235 | 0.17 |
| grip power of dominant hand (kg) | 32.94 ± 5.323 | 33.0 ± 4.9 | 33.1 ± 0.9 | 32.9 ± 5.2 | 0.002 | 1.000 | 0.00 |
| 20 m sprint (s) | 6.25 ± 0.40 | 5.82 ± 0.28 | 5.98 ± 0.32 | 5.59 ± 0.33 | 4.971 | 0.009 * | 0.40 |
| agility t-test (s) | 15.02 ± 1.08 | 14.12 ± 0.56 | 14.26 ± 0.50 | 13.95 ± 0.90 | 2.288 | 0.107 | 0.24 |
| figure-eight with a ball test (s) | 37.15 ± 5.79 | 31.07 ± 1.09 | 33.00 ± 2.71 | 29.93 ± 1.14 | 4.647 ^ | 0.031 * | 0.48 |
| Yo-Yo 10 m recovery test (m) | 657.14 ± 288.3 | 1042.9 ± 231.4 | 930.0 ± 429.1 | 1250.0 ± 240.5 | 5.570 | 0.005 * | 0.43 |
| maximal pass | |||||||
| chest pass (m) | 7.7 ± 1.1 | 8.6 ± 1.1 | 8.8 ± 1.2 | 10.3 ± 1.5 | 5.704 | 0.005 * | 0.44 |
| baseball pass by dominant hand (m) | 7.6 ± 0.4 | 9.1 ± 1.3 | 10.0 ± 2.1 | 12.3 ± 1.7 | 18.720 ^ | <0.001 * | 0.66 |
| hook pass by dominant hand (m) | 8.3 ± 1.3 | 10.3 ± 1.6 | 10.5 ± 1.6 | 13.5 ± 1.4 | 15.721 | <0.001 * | 0.68 |
| B | SE | β | P | 95% CI | |||
|---|---|---|---|---|---|---|---|
| Constant | −2.001 | 5.905 | 0.739 | −14.459 | - | 10.457 | |
| age | 0.001 | 0.027 | 0.004 | 0.984 | −0.056 | - | 0.057 |
| wheelchair basketball experience | 0.004 | 0.036 | 0.020 | 0.917 | −0.072 | - | 0.080 |
| height | 0.044 | 0.024 | 0.399 | 0.082 | −0.006 | - | 0.094 |
| grip power of dominant hand | −0.005 | 0.054 | −0.017 | 0.934 | −0.118 | - | 0.109 |
| arm span | −0.025 | 0.038 | −0.129 | 0.525 | −0.105 | - | 0.055 |
| agility t-test | 0.15 | 0.359 | 0.112 | 0.680 | −0.607 | - | 0.908 |
| figure-eight with ball | −0.092 | 0.066 | −0.326 | 0.181 | −0.231 | - | 0.047 |
| shoulder pass by the dominant hand | 0.268 | 0.112 | 0.508 | 0.029 | 0.031 | - | 0.505 |
© 2019 by the authors. Licensee MDPI, Basel, Switzerland. This article is an open access article distributed under the terms and conditions of the Creative Commons Attribution (CC BY) license (http://creativecommons.org/licenses/by/4.0/).
Share and Cite
Tachibana, K.; Mutsuzaki, H.; Shimizu, Y.; Doi, T.; Hotta, K.; Wadano, Y. Influence of Functional Classification on Skill Tests in Elite Female Wheelchair Basketball Athletes. Medicina 2019, 55, 740. https://0-doi-org.brum.beds.ac.uk/10.3390/medicina55110740
Tachibana K, Mutsuzaki H, Shimizu Y, Doi T, Hotta K, Wadano Y. Influence of Functional Classification on Skill Tests in Elite Female Wheelchair Basketball Athletes. Medicina. 2019; 55(11):740. https://0-doi-org.brum.beds.ac.uk/10.3390/medicina55110740
Chicago/Turabian StyleTachibana, Kaori, Hirotaka Mutsuzaki, Yukiyo Shimizu, Takashi Doi, Kazushi Hotta, and Yasuyoshi Wadano. 2019. "Influence of Functional Classification on Skill Tests in Elite Female Wheelchair Basketball Athletes" Medicina 55, no. 11: 740. https://0-doi-org.brum.beds.ac.uk/10.3390/medicina55110740