1. Introduction
Nonalcoholic fatty liver disease (NAFLD) refers to a group of conditions characterized by fatty deposits in the liver in the absence of alcohol consumption. Excessive accumulation of hepatic fat occurs in a disease spectrum from simple steatosis, through to nonalcoholic steatohepatitis (NASH), fibrosis and cirrhosis, liver failure and hepatocellular carcinoma (HCC). Available data suggest that nearly 30% of the general population have steatosis and up to 5% of this population develops NASH [
1]. Early stage NASH patients will progress to cirrhosis in 9% to 20% over a period of 5–10 years [
2]. In a systematic review of patients with NAFLD, the risk of HCC among the cirrhotic group ranged from 2.4% over seven years to 12.8% over three years [
3]. Higher overall mortality rates in patients with NAFLD compared with the general population have also been reported [
4]. In addition, NAFLD is identified to displace viral hepatitis as the primary cause of end-stage liver disease and liver transplantation over the following decade [
5].
Confirming accurate staging of liver disease is essential for allowing both a timely therapeutic approach and prognostic evaluations. The diagnosis of NASH, evaluation and staging of fibrosis are based on histological examination of a tissue specimen obtained by liver biopsy. Although this approach is still considered to be the gold standard in all currently available guidelines [
6,
7,
8], liver biopsy cannot be recommended for all patients, considering the limitations (invasiveness, sampling variability and cost) and high prevalence of NAFLD worldwide [
9]. There is a risk of complications arising from liver biopsy, from mild ones such as pneumothorax to severe hemorrhage, liver rupture and injury to the biliary system [
10]. Attributable to the risk of complications, some patients may refuse a liver biopsy [
11]. Moreover, it is less likely that there will be enough medical workforce to perform a liver biopsy on all potential NAFLD patients [
12]. The newly published study also reported only 24% of physicians routinely perform a liver biopsy to diagnose NASH [
13]. A liver ultrasound (US) examination is a primary imaging method useful for confirming steatosis [
14]. Despite the benefits of a US, regarded as being non-invasive, widely available and low cost, it has certain limitations, as well as limited accuracy in obese patients [
14,
15]. Alternative methods to a liver biopsy in NASH patients are computed tomography (CT), magnetic resonance imaging (MRI) with chemical shift imaging and particularly magnetic resonance spectroscopy and elastography [
16,
17]. Although imaging methods such as CT and MRI are more sensitive modalities for quantifying steatosis, neither can evaluate liver fibrosis and NASH [
18,
19]. Non-invasive evaluation of liver fibrosis and NASH may be performed by ultrasound elastography and magnetic resonance elastography. However, none of these imaging techniques has sufficient sensitivity and specificity for staging the disease and cannot distinguish between simple steatosis and NASH [
17].
Another non-invasive approach is to develop clinical and biochemical parameters that can identify fibrosis in a cohort of patients with NAFLD, to replace liver biopsy, at least to some extent. Various non-invasive panels have been suggested to stage liver disease [
20]. Many currently available tests have certain limitations, which has significant clinical implications [
21]. These considerations accentuate the need for non-invasive methods that are inexpensive, reliable and reproducible to distinguish between simple steatosis and NASH. Furthermore, the non-invasive approach may limit the need for a liver rebiopsy and consequently lead to a more efficient follow-up [
22,
23].
This study aimed to investigate the independent predictors and develop a non-invasive, easy-to-perform, low-cost set of parameters that may be used in clinical practice to differentiate simple steatosis from NASH.
2. Materials and Methods
We conducted a cross-sectional study of 111 patients with NAFLD, recruited on an outpatient basis. The study was performed from October 2014 to October 2017. A patient’s eligibility was based on their medical history, physical examination, biochemical testing and liver ultrasound imaging, performed during the screening visit. The inclusion criteria were age >18 years, bright liver on ultrasound imaging and the patient’s consent to participate in the study. The following exclusion criteria were applied: alcohol consumption >20 g/day, other liver diseases (liver cirrhosis, viral hepatitis, autoimmune hepatitis, primary sclerosing cholangitis, primary biliary cirrhosis and overlap syndromes, hemochromatosis, Wilson’s disease, α1-antitrypsin deficiency and medication-induced liver disease), diabetes mellitus type I and II, hypothyroidism or hyperthyroidism, adrenal insufficiency, renal failure, malignant diseases, addiction to any medication and the use of the following medications within a year prior to screening: estrogens, progestins, glucocorticosteroids, thiazolidinediones, orlistat, spironolactone, vitamins E, C and B, folate and iron supplements, ursodeoxycholic acid, tamoxifen, amiodarone, biologic agents and statins.
2.1. Patients
Patients were divided into two groups: group I—simple steatosis (SS) and group II—NASH. More specifically, 82 patients were determined to have simple steatosis (out of which 33 had undergone a liver biopsy) while 29 patients had biopsy-proven NASH. Liver biopsies were scored using a NAFLD activity score (NAS) and fibrosis staging according to Kleiner et al. [
24].
The histopathologist who reported the liver biopsies was blinded to other parameters. Information on socio-demography, economic and lifestyle characteristics and pre-existing medical conditions were gathered as part of a standardized personal interview. Participants were asked to report their age, smoking status, frequency of alcohol intake, nutritional habits, education and occupation. Body mass index was calculated as body weight (kg) divided by the square of height (m
2). Waist and hip circumference were measured (in cm) with an inelastic tape in line with WHO guidelines [
25]. A blood pressure measurement was performed with patients in the seated position, according to standard protocol. Venous blood was collected from each patient after an overnight fast, serum was used for the biochemical analysis. Insulin resistance was evaluated through the program Homeostasis Model Assessment (HOMA) Calculator v2.2.2 [
26] based on the following equation: Fasting insulin (microU/L) × fasting glucose (nmol/L)/22.5.
2.2. Laboratory Analyses
Laboratory analyses included the full blood count, erythrocyte sedimentation rate (ESR), C-reactive protein (CRP), standard liver enzymes: Alanine aminotransferase (ALT), aspartate aminotransferase (AST) and gamma-glutamyl transferase (GGT); total cholesterol (TC), high-density lipoprotein (HDL), low-density lipoprotein (LDL), triglycerides (TG), bilirubin, total proteins, albumin, urea, creatinine, iron, ferritin, folate, vitamin B12, insulin and serum uric acid (SUA). All blood samples were aliquoted at the same day and stored at −80 °C for further analysis of leptin, interleukin 6 (IL-6), homocysteine and sulfhydryl groups. These parameters were measured using validated standard methods and devices available at the Medical Biochemistry Department.
2.3. Statistical Analysis
Categorical variables are presented as numbers/percentages while continuous variables are shown as mean ± standard deviation, or median with interquartile range Kolmogorov–Smirnov test was used to evaluate the normality of distribution. The statistical analysis was performed in three steps. The first step comprised a simple comparison between groups (SS and NASH) using a chi-square test for categorical variables and t-test or Mann–Whitney test for continuous variables. The second step included an analysis of covariance (ANCOVA) to investigate if parameters differ between the observed groups. Spearman’s rank correlation coefficient was applied to correlate the NAS score and fibrosis with the proposed parameters of the HUFA index. The third step included a multivariate logistic regression analysis of the significant independent variables identified in the previous testing. All reported p-values were two-tailed, and those less than 0.05 were deemed statistically significant.
The area under the curve of the receiving operating characteristic (ROC) was used to evaluate the sensitivity, specificity, positive predictive value (PPV) and negative predictive value (NPV) of the proposed model for the prediction of NASH. Statistical analysis was performed with the Statistical Package for Social Science version 17.0 software (SPSS, Chicago, IL, USA).
2.4. Ethical Considerations
The study was conducted in accordance with Guidelines for Good Clinical Practice, the Declaration of Helsinki and local laws and regulations. The protocol was approved by joint Research and Ethics Committee of the Clinical Centre of Serbia, Belgrade, filed under number 262/2. Written informed consent was obtained from all the participants in the study.
3. Results
To identify the predictive factors linked to NASH, we compared variables between groups. Anthropometric and clinical characteristics of the patients included in the study are given in
Table 1. No significant differences between groups in age, body mass index (BMI), waist and hip circumferences were detected.
Comparative data of groups, in regards to parameters measured in serum and estimated ones are shown in
Table 2. We identified significantly higher values of ALT and AST in conjunction with different AST/ALT ratio as anticipated among the observed groups. Interestingly, we noticed that total proteins, albumin and sulfhydryl groups, total cholesterol, LDL, SUA ferritin, insulin and HOMA index were also significantly different between NASH and SS groups.
Parameters that have shown statistical significance in observed patient groups SS vs. NASH (p < 0.05) were further entered into the ANCOVA analysis to control for confounding variables (age, sex and BMI). The results showed that sulfhydryl groups, CRP, ESR, ferritin and SUA were statistically different between SS and NASH groups at the level p < 0.05, while the statistical significance between these groups were more pronounced (p < 0.001) for ALT, AST/ALT ratio and homeostatic model assessment of insulin resistance (HOMA-IR). Furthermore, sulfhydryl groups, CRP, ESR and the AST/ALT ratio yielded an area under the receiver operator characteristic curve (AUROC) of 0.642, 0.332, 0.277 and 0.524, respectively. AUROC less than 0.7 is considered a low-performance indicator, thus those parameters were omitted from the final model. Lastly, the final model was created based on the four remaining variables.
Histological characteristics of NASH patients based on the NAS score were compared to selected variables from the final model (
Table 3).
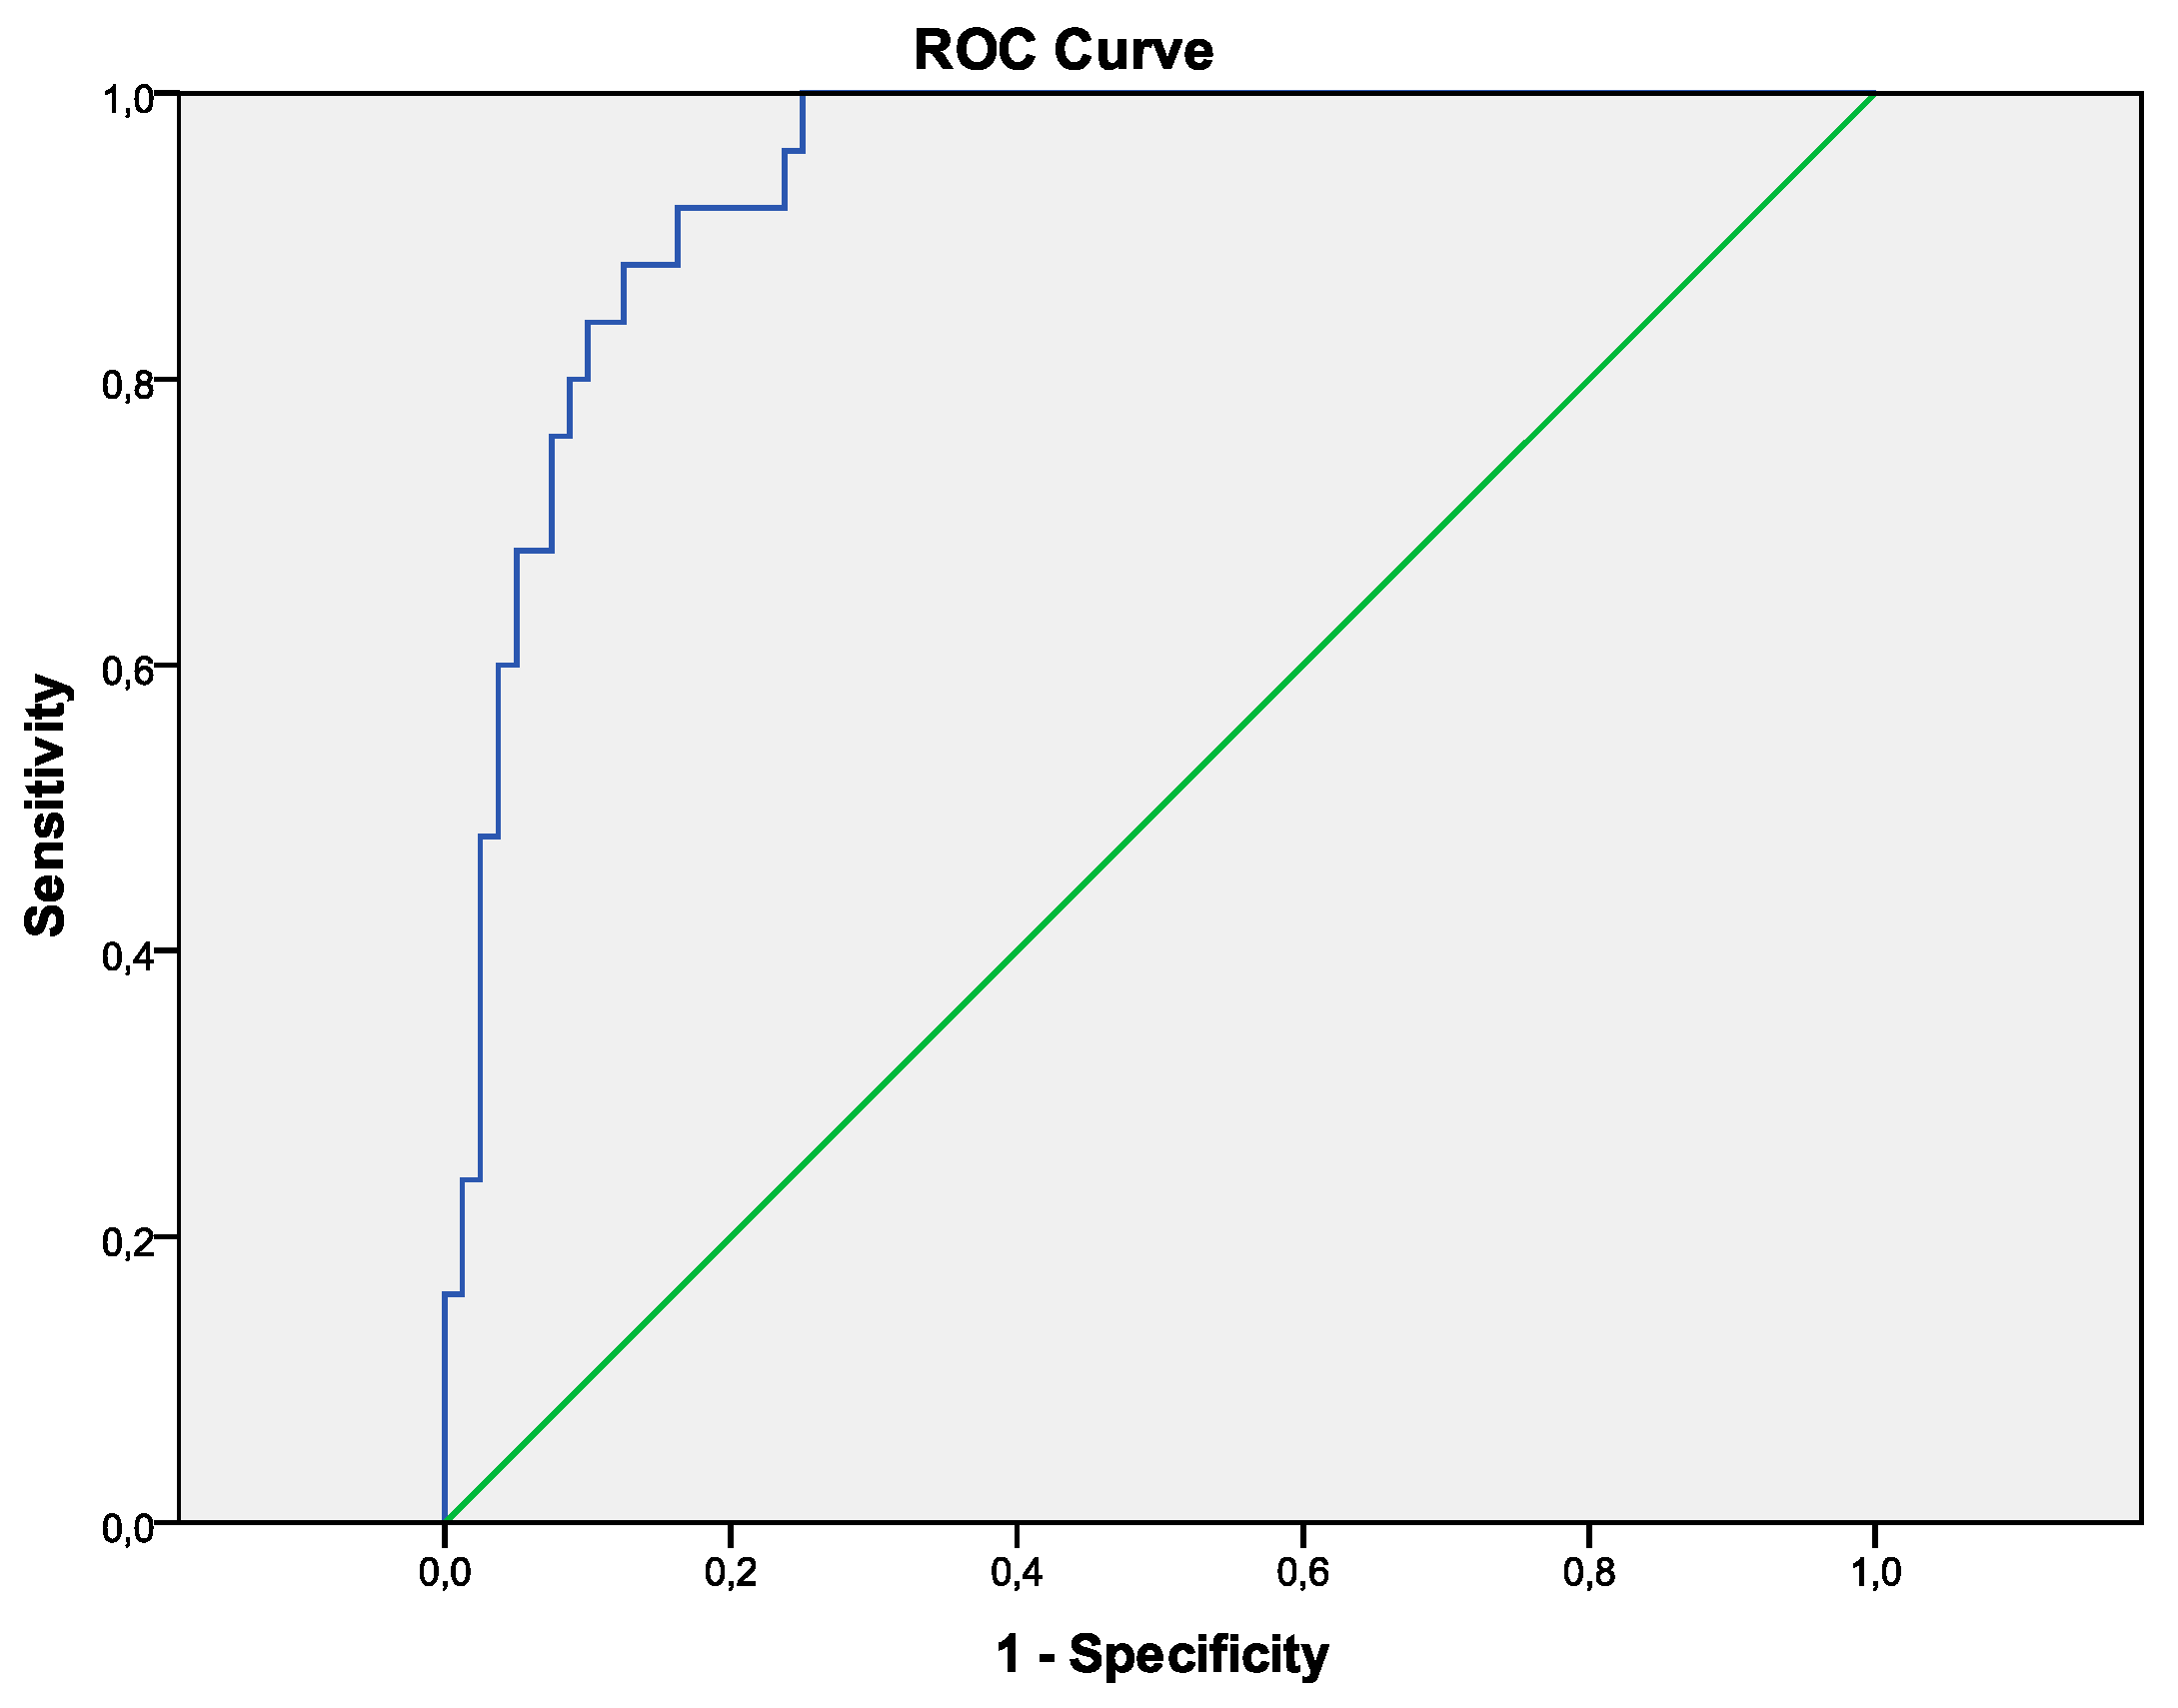
The probability of NASH was the highest when HOMA-IR was above 2.5, uric acid above 380 µmol/L, ferritin above 100 µg/L and ALT above 45 U/L. This combined model resulted in a higher area under the ROC curve (0.94)than for any individual model, provided sensitivity, specificity, positive predictive value and negative predictive value for NASH of 70.3%, 95.1%, 83.1% and 90.0%, respectively (
Table 4 and
Table 5,
Figure 1).
4. Discussion
Screening for significant liver injury in patients with NAFLD will develop into a critical medical challenge in the near future, owing to the epidemic proportions of obesity and diabetes. The prevalence of obesity has more than doubled worldwide since 1980, as indicated by the World Health Organization. In 2014 more than 1.9 billion adults were overweight, of whom more than 600 million were obese. The prevalence of simple steatosis in obese patients is 60%, while 20–25% progress to NASH and 2–3% develop cirrhosis [
27,
28]. It is estimated that up to 75% of type 2 diabetic patients may present some form of NAFLD [
29]. Moreover, and interestingly, a newly reported finding revealed that NAFLD is now considered a strong determinant for the development of metabolic syndrome (MS), rather than the hepatic manifestation of the MS, as previously emphasized [
30]. Great effort is nonetheless being made toward the identification of sensitive diagnostic tests that do not involve invasive procedures to address a common concern in patients with NAFLD—whether they have NASH or simple steatosis. It is essential to permit early detection, timely treatment and its prompt management.
4.1. HOMA-IR Score
Given the complexity of the pathogenesis of NASH, it is likely that multiple pathways play a significant role in the development of the disease. Oxidative stress, insulin resistance and systemic inflammation are considered central in the pathogenesis of NAFLD and NASH [
31]. Higher HOMA-IR scores are independent clinical predictors for NASH [
32]. Our results are in line with these findings, as the highest exponent for prediction of NASH was observed for HOMA-IR (
Table 4). These outcomes indicate that one unit increase in HOMA-IR score leads to an average of 1.263-fold increase in the odds of NASH occurrence. Moreover, a recently published multicenter study in Japanese NAFLD patients reported that insulin resistance is correlated with the severity of liver histology [
33]. Different HOMA cut-offs were proposed through the literature to define insulin resistance. Similar to Shimada et al. [
34] but opposed to Dixon et al. [
27], our data suggest that all values equal or higher than 2.5 indicate insulin resistance, hence imply an alarm towards further investigation of steatotic patients in the direction of NASH.
4.2. Serum Uric Acid
In humans, SUA is the final oxidation product of purine metabolism and is excreted in urine. Besides a known fact that hyperuricemia is a cause of gouty arthritis, it has also been linked to the development of hypertension, kidney disease, metabolic syndrome and cardiovascular disease. It has been observed that oxidative stress and lipid peroxidation injury play a major role in the pathogenesis of NAFLD [
35]. One of the proposed mechanisms is the induction by hyperuricemia of endothelial dysfunction, insulin resistance, oxidative stress and systemic inflammation [
36]. Results from a large observational study involving the US adult population linked elevated uric acid level with increasing severity of NAFLD [
37]. Similar findings were reported earlier in a prospective observational study that showed the elevation of SUA levels as an independent predictor of an increased risk for incident NAFLD [
38]. Furthermore, hyperuricemia was a common finding in male patients with NAFLD and was independently related to early stage of NASH, as recently noted by Sertoglu et al. [
39]. Lately, published findings in non-obese postmenopausal women describe higher SUA levels with a positive and independent association to hepatic steatosis [
40]. The newest study by Wu et al. [
41] showed that a sex-specific SUA level was independently associated with NAFLD and reported significantly greater SUA levels in females than in males. Our finding of SUA level above 380µmol/L has been noted as an independent predictive factor in NASH detection. Additionally, we detected raised albumin and SH group levels, denoting the significance of hyperuricemia induced oxidative stress in the pathogenesis of NASH. Albumin is the primary source of reduced SH groups that are recognized as potent scavengers of reactive oxygen and nitrogen species [
42].
4.3. Ferritin
We detected significantly different ferritin levels without iron overload in the NASH group, even though it was still in the referent range when compared to simple steatosis. Sumida et al. [
43] included ferritin in their prediction model but suggested higher levels as a cut off than we found in our study. Even more demanding levels were recommended in the previously published research where a threshold serum ferritin >1.5 upper limits of normal was associated with a diagnosis of NASH [
44]. Conversely, our findings in regards to ferritin levels in both observed groups are more in line with a study published by Polyzos et al. [
23]. However, it has not been clearly established whether the elevated serum ferritin is a consequence of systemic inflammation or a marker of iron overload in patients with NAFLD. Interestingly, even in patients without a hepatic iron overload (such as our patients), a higher serum ferritin was correlated with disease progression. This implies the presence of systemic inflammation that is independent to iron overload [
44].
4.4. Alanine Aminotransferase
Clinicians need to consider NASH as the most probable cause of unexplained elevation of ALT, usually minor, in a patient with metabolic risk factors. Although ALT is not an ideal biomarker for differentiating simple steatosis from NASH, several studies demonstrated that high levels of ALT are correlated with an increased risk of NASH [
45]. Thus far, no optimal ALT level has yet been proposed to predict NASH. Nonetheless, recently published results showed the significantly lower incidence of NASH in normal ALT group compared with a raised ALT group [
46]. Our findings appeared to be in line with the findings above. Elevated ALT levels usually initiate further abdominal imaging or histological assessment, which may elucidate why patients with normal ALT levels in our study were older than those with raised ALT levels. This finding is consistent with a study by Fracanzani et al. [
47].
4.5. Diagnostic Panels
Various diagnostic panels for differentiating NASH from simple steatosis have been previously suggested. In more details, the NAFLD diagnostic panel [
48] recommended five markers (diabetes, gender, BMI, triglycerides and cytokeratin-18 (CK18) fragments) and performed better than the NASH diagnostic [
49] that included three biomarkers (CK18, adiponectin and resistin) for NASH prediction. The panels showed a good performance with an AUROC of 0.81 and 0.73, respectively. CKs 8 and 18, besides having a structural role in terms of assuring hepatocytes stability, additionally act as a target by toxic stress implying apoptosis/necrosis [
50]. In spite of the fact that previous research showed promising results in using CK18 as a useful marker for NASH, more recently published studies cast doubt on its clinical utility. Cusi et al. confirmed the limited value of CK18 as a biomarker of NASH, regarding restrained sensitivity for staging NASH [
51]. Again, the study subjects were morbidly obese, so the results may not be adaptable to a patient population with a lower BMI. Moreover, the NAFIC scoring system [
43] with a good performance of predicting NASH (AUROC 0.85) used three parameters (ferritin, insulin and type IV collagen 7S), also outperformed several other panels earlier published. The results of this research, nevertheless, may not apply to our patient population as all participants included were Japanese. A statistically significant correlation has been observed with the NAS score and all four parameters included in our HUFA index. On contrary, we did not detect any significant correlation with observed parameters and fibrosis stages. Thus, biochemical parameters used in our index albeit not associated with the fibrosis stage may help early detection of necroinflammation in NAFLD.
The results obtained in this study support the importance of four variables (HOMA-IR, SUA, ferritin and ALT) in differentiating NASH from SS. Hence, their odd ratios indicate a certain increase for one unit raise in parameter values (ranging from 1% to 26%;
Table 4) in the odds of the NASH occurrence. Namely, if taken into account the range values of the parameters, the SUA and ferritin for 50 units increase and ALT for 10 units increase may be more clinically relevant. In addition, based on the direct comparison, the performance of our diagnostic index was quite well with an AUROC 0.94. Additionally, we reported a fair sensitivity of 70.3%, excellent specificity of 95.1%, and quite good PPV and NPV (83.1% and 90.0%, respectively). Our model advocates four easy-to-perform, low-cost set of parameters, available in routine clinical practice. The evidence for each of these independently observed parameters supports our hypothesis to use them in a combined prediction model, to distinguish steatosis from early-stage NASH even more accurately, rather than perceive them separately. If all the exclusion criteria are utilized, and the patient fulfills all of the following criteria: HOMA above 2.5, SUA greater than 380 µmol/L, ferritin above 100 µg/L and ALT above 45U/L, NASH may be considered.
The important cost aspect should not be neglected, especially in resource-limited countries such as ours, ensuring parameters/procedures in affordability in the health care system. Furthermore, in a newly published study that provided a cost-utility analysis of a NASH screening [
52], liver biopsy confirmation was not found to be cost-effective. In our study more than one third of steatosis patients had undergone a liver biopsy, and steatohepatitis was biopsy confirmed in all participants in the NASH cohort. Since pharmacotherapy for NASH is not clearly established, it is not necessary to perform a liver biopsy in all patients [
53]. Furthermore, this invasive modality cannot be suggested for all patients [
9]. Thus we performed liver biopsy when clinical data was not conclusive. Strict inclusion criteria and a variety of measured/estimated parameters supported our findings. Nonetheless, our diagnostic index need to be tested and validated in different conditions and cohorts, but can easily be implemented in everyday clinical practice, without additional time and cost.
5. Conclusions
We suggest a simple non-invasive HUFA index that encompasses four easily available parameters (HOMA, uric acid, ferritin and ALT) to identify patients with NASH, which may reduce the need for a liver biopsy on a routine basis in patients with NAFLD.
Author Contributions
Conceptualization, M.C., S.V.K. and D.C.; Formal analysis, M.C. and S.V.K.; Investigation, M.C., M.S., Z.V. and D.C.; Methodology, S.V.K. and D.C.; Resources, V.D. and B.M.; Supervision, V.D. and D.C.; Writing—original draft, M.C.; Writing—review & editing, M.C., S.V.K., B.M. and D.C.
Funding
This research received no external funding.
Conflicts of Interest
The authors declare no conflict of interest.
References
- Neuschwander-Tetri, B.A.; Caldwell, S.H. Nonalcoholic steatohepatitis: Summary of an AASLD Single Topic Conference. Hepatology 2003, 37, 1202–1219. [Google Scholar] [CrossRef] [PubMed]
- Ong, J.P.; Younossi, Z.M. Nonalcoholic fatty liver disease (NAFLD)—Two decades later: Are we smarter about its natural history? Am. J. Gastroenterol. 2003, 98, 1915–1917. [Google Scholar] [CrossRef] [PubMed]
- White, D.L.; Kanwal, F.; El-Serag, H.B. Association between nonalcoholic fatty liver disease and risk for hepatocellular cancer, based on systematic review. Clin. Gastroenterol. Hepatol. Off. Clin. Pract. J. Am. Gastroenterol. Assoc. 2012, 10, 1342–1359e2. [Google Scholar] [CrossRef] [PubMed]
- Soderberg, C.; Stal, P.; Askling, J.; Glaumann, H.; Lindberg, G.; Marmur, J.; Hultcrantz, R. Decreased survival of subjects with elevated liver function tests during a 28-year follow-up. Hepatology 2010, 51, 595–602. [Google Scholar] [CrossRef] [PubMed]
- Ray, K. Obesity: Fatty liver and the metabolic syndrome-fructose at fault? Nat. Rev. Gastroenterol. Hepatol. 2013, 10, 623. [Google Scholar] [CrossRef]
- Chalasani, N.; Younossi, Z.; Lavine, J.E.; Diehl, A.M.; Brunt, E.M.; Cusi, K.; Charlton, M.; Sanyal, A.J.; American Gastroenterological Association; American Association for the Study of Liver Diseases; et al. The diagnosis and management of non-alcoholic fatty liver disease: Practice guideline by the American Gastroenterological Association, American Association for the Study of Liver Diseases, and American College of Gastroenterology. Gastroenterology 2012, 142, 1592–1609. [Google Scholar] [CrossRef]
- Fan, J.G.; Jia, J.D.; Li, Y.M.; Wang, B.Y.; Lu, L.G.; Shi, J.P.; Chan, L.Y.; Chinese Association for the Study of Liver, Disease. Guidelines for the diagnosis and management of nonalcoholic fatty liver disease: Update 2010. J. Dig. Dis. 2011, 12, 38–44. [Google Scholar] [CrossRef]
- Ratziu, V.; Bellentani, S.; Cortez-Pinto, H.; Day, C.; Marchesini, G. A position statement on NAFLD/NASH based on the EASL 2009 special conference. J. Hepatol. 2010, 53, 372–384. [Google Scholar] [CrossRef] [Green Version]
- Castera, L.; Vilgrain, V.; Angulo, P. Noninvasive evaluation of NAFLD. Nature reviews. Gastroenterol.Hepatol. 2013, 10, 666–675. [Google Scholar]
- Campbell, M.D.; Jeffers, L.J.; Reddy, K.R. Liver biopsy and laparoscopy. In Schiff’s Diseases of the Liver, 10th ed.; Schiff, E.R., Sorrell, M.F., Maddrey, W.C., Eds.; Lippincott Williams & Wilkins: Philadelphia, PA, USA, 2007; pp. 61–81. [Google Scholar]
- Baranova, A.; Lal, P.; Birerdinc, A.; Younossi, Z.M. Non-invasive markers for hepatic fibrosis. BMC Gastroenterol. 2011, 11, 91. [Google Scholar] [CrossRef]
- Bataller, R.; Brenner, D.A. Liver fibrosis. J. Clin. Investig. 2005, 115, 209–218. [Google Scholar] [CrossRef] [PubMed]
- Shah, A.G.; Lydecker, A.; Murray, K.; Tetri, B.N.; Contos, M.J.; Sanyal, A.J.; Nash Clinical Research Network. Comparison of noninvasive markers of fibrosis in patients with nonalcoholic fatty liver disease. Clin. Gastroenterol. Hepatol. Off. Clin. Pract. J. Am. Gastroenterol. Assoc. 2009, 7, 1104–1112. [Google Scholar] [CrossRef] [PubMed]
- Rinella, M.E.; Lominadze, Z.; Loomba, R.; Charlton, M.; Neuschwander-Tetri, B.A.; Caldwell, S.H.; Kowdley, K.; Harrison, S.A. Practice patterns in NAFLD and NASH: Real life differs from published guidelines. Therap. Adv. Gastroenterol. 2015, 9, 4–12. [Google Scholar] [CrossRef]
- Chen, X.L.; Chen, T.W.; Zhang, X.M.; Li, Z.L.; Zeng, N.L.; Li, T.; Wang, D.; Li, J.; Fang, Z.J.; Li, H.; et al. Quantitative assessment of the presence and severity of cirrhosis in patients with hepatitis B using right liver lobe volume and spleen size measured at magnetic resonance imaging. PLoS ONE 2014, 9, e89973. [Google Scholar] [CrossRef]
- Khov, N.; Sharma, A.; Riley, T.R. Bedside ultrasound in the diagnosis of nonalcoholic fatty liver disease. World J. Gastroenterol. WJG 2014, 20, 6821–6825. [Google Scholar] [CrossRef] [PubMed]
- Venkatesh, S.K.; Yin, M.; Ehman, R.L. Magnetic resonance elastography of liver: Technique, analysis, and clinical applications. J. Magn. Reason. Imaging JMRI 2013, 37, 544–555. [Google Scholar] [CrossRef] [PubMed] [Green Version]
- Koplay, M.; Sivri, M.; Erdogan, H.; Nayman, A. Importance of imaging and recent developments in diagnosis of nonalcoholic fatty liver disease. World J. Hepatol. 2015, 7, 769–776. [Google Scholar] [CrossRef] [PubMed]
- Polyzos, S.A.; Mantzoros, C.S. Necessity for timely noninvasive diagnosis of nonalcoholic fatty liver disease. Metab. Clin. Exp. 2014, 63, 161–167. [Google Scholar] [CrossRef]
- Musso, G.; Gambino, R.; Cassader, M.; Pagano, G. Meta-analysis: natural history of non-alcoholic fatty liver disease (NAFLD) and diagnostic accuracy of non-invasive tests for liver disease severity. Ann. Med. 2011, 43, 617–649. [Google Scholar] [CrossRef]
- Pinzani, M.; Vizzutti, F.; Arena, U.; Marra, F. Technology Insight: noninvasive assessment of liver fibrosis by biochemical scores and elastography. Nat. Clin. Pract. Gastroenterol. Hepatol. 2008, 5, 95–106. [Google Scholar] [CrossRef]
- Pearce, S.G.; Thosani, N.C.; Pan, J.J. Noninvasive biomarkers for the diagnosis of steatohepatitis and advanced fibrosis in NAFLD. Biomark. Res. 2013, 1, 7. [Google Scholar] [CrossRef] [PubMed]
- Polyzos, S.A.; Kountouras, J.; Zavos, C.; Deretzi, G. Nonalcoholic fatty liver disease: multimodal treatment options for a pathogenetically multiple-hit disease. J. Clin. Gastroenterol. 2012, 46, 272–284. [Google Scholar] [CrossRef]
- Kleiner, D.E.; Brunt, E.M.; Van Natta, M.; Behling, C.; Contos, M.J.; Cummings, O.W.; Ferrell, L.D.; Liu, Y.C.; Torbenson, M.S.; Unalp-Arida, A.; et al. Design and validation of a histological scoring system for nonalcoholic fatty liver disease. Hepatology 2005, 41, 1313–1321. [Google Scholar] [CrossRef]
- World Health Organization (WHO). Waist Circumference and Waist-Hip Ratio: Report of a WHO Expert Consultation. Geneva, 8–11 December 2008; World Health Organization: Geneva, Switzerland, 2011. [Google Scholar]
- HOMA2 Calculator. Available online: https://www.dtu.ox.ac.uk/homacalculator/ (accessed on 27 January 2019).
- Dixon, J.B.; Bhathal, P.S.; O’Brien, P.E. Nonalcoholic fatty liver disease: Predictors of nonalcoholic steatohepatitis and liver fibrosis in the severely obese. Gastroenterology 2001, 121, 91–100. [Google Scholar] [CrossRef] [PubMed]
- Ratziu, V.; Giral, P.; Charlotte, F.; Bruckert, E.; Thibault, V.; Theodorou, I.; Khalil, L.; Turpin, G.; Opolon, P.; Poynard, T. Liver fibrosis in overweight patients. Gastroenterology 2000, 118, 1117–1123. [Google Scholar] [CrossRef]
- Medina, J.; Fernandez-Salazar, L.I.; Garcia-Buey, L.; Moreno-Otero, R. Approach to the pathogenesis and treatment of nonalcoholic steatohepatitis. Diabetes Care 2004, 27, 2057–2066. [Google Scholar] [CrossRef]
- Lonardo, A.; Ballestri, S.; Marchesini, G.; Angulo, P.; Loria, P. Nonalcoholic fatty liver disease: A precursor of the metabolic syndrome. Dig. Liver Dis. Off. J. Italian Soc. Gastroenterol. Italian Assoc. Study Liver 2015, 47, 181–190. [Google Scholar] [CrossRef]
- Sanyal, A.J. Mechanisms of Disease: Pathogenesis of nonalcoholic fatty liver disease. Nat. Clin. Pract. Gastroenterol. Hepatol. 2005, 2, 46–53. [Google Scholar] [CrossRef]
- Sobhonslidsuk, A.; Jongjirasiri, S.; Thakkinstian, A.; Wisedopas, N.; Bunnag, P.; Puavilai, G. Visceral fat and insulin resistance as predictors of non-alcoholic steatohepatitis. World J. Gastroenterol. WJG 2007, 13, 3614–3618. [Google Scholar] [CrossRef]
- Kessoku, T.; Yoneda, M.; Sumida, Y.; Eguchi, Y.; Fujii, H.; Hyogo, H.; Ono, M.; Kawaguchi, T.; Nakajima, A.; Japan Study Group of NAFLD. Insulin resistance correlated with the severity of liver histology in Japanese NAFLD patients: A multicenter retrospective study. J. Clin. Gastroenterol. 2015, 49, 169–170. [Google Scholar] [CrossRef]
- Shimada, M.; Kawahara, H.; Ozaki, K.; Fukura, M.; Yano, H.; Tsuchishima, M.; Tsutsumi, M.; Takase, S. Usefulness of a combined evaluation of the serum adiponectin level, HOMA-IR, and serum type IV collagen 7S level to predict the early stage of nonalcoholic steatohepatitis. Am. J. Gastroenterol. 2007, 102, 1931–1938. [Google Scholar] [CrossRef] [PubMed]
- Xiu-li, L.M.W. The recent advances in the pathogenesis of nonalcoholic fatty liver disease. Lishzhen Med. Mater. Med. Res. 2010, 21, 2647–2648. [Google Scholar]
- Feig, D.I.; Kang, D.H.; Johnson, R.J. Uric acid and cardiovascular risk. N. Engl. J. Med. 2008, 359, 1811–1821. [Google Scholar] [CrossRef]
- Sirota, J.C.; McFann, K.; Targher, G.; Johnson, R.J.; Chonchol, M.; Jalal, D.I. Elevated serum uric acid levels are associated with non-alcoholic fatty liver disease independently of metabolic syndrome features in the United States: Liver ultrasound data from the National Health and Nutrition Examination Survey. Metab. Clin. Exp. 2013, 62, 392–399. [Google Scholar] [CrossRef] [PubMed] [Green Version]
- Xu, C.; Yu, C.; Xu, L.; Miao, M.; Li, Y. High serum uric acid increases the risk for nonalcoholic Fatty liver disease: a prospective observational study. PLoS ONE 2010, 5, e11578. [Google Scholar] [CrossRef] [PubMed]
- Sertoglu, E.; Ercin, C.N.; Celebi, G.; Gurel, H.; Kayadibi, H.; Genc, H.; Kara, M.; Dogru, T. The relationship of serum uric acid with non-alcoholic fatty liver disease. Clin. Biochem. 2014, 47, 383–388. [Google Scholar] [CrossRef] [PubMed]
- Liu, P.J.; Ma, F.; Lou, H.P.; Zhu, Y.N.; Chen, Y. Relationship between serum uric acid levels and hepatic steatosis in non-obese postmenopausal women. Climacteric J. Int. Menopause Soc. 2014, 17, 692–699. [Google Scholar] [CrossRef]
- Wu, S.J.; Zhu, G.Q.; Ye, B.Z.; Kong, F.Q.; Zheng, Z.X.; Zou, H.; Shi, K.Q.; Lin, L.; Braddock, M.; Huang, W.J.; et al. Association between sex-specific serum uric acid and non-alcoholic fatty liver disease in Chinese adults: A large population-based study. Medicine 2015, 94, e802. [Google Scholar] [CrossRef]
- Quinlan, G.J.; Margarson, M.P.; Mumby, S.; Evans, T.W.; Gutteridge, J.M. Administration of albumin to patients with sepsis syndrome: A possible beneficial role in plasma thiol repletion. Clin. Sci. 1998, 95, 459–465. [Google Scholar] [CrossRef]
- Sumida, Y.; Yoneda, M.; Hyogo, H.; Yamaguchi, K.; Ono, M.; Fujii, H.; Eguchi, Y.; Suzuki, Y.; Imai, S.; Kanemasa, K.; et al. A simple clinical scoring system using ferritin, fasting insulin, and type IV collagen 7S for predicting steatohepatitis in nonalcoholic fatty liver disease. J. Gastroenterol. 2011, 46, 257–268. [Google Scholar] [CrossRef]
- Kowdley, K.V.; Belt, P.; Wilson, L.A.; Yeh, M.M.; Neuschwander-Tetri, B.A.; Chalasani, N.; Sanyal, A.J.; Nelson, J.E.; Network, N.C.R. Serum ferritin is an independent predictor of histologic severity and advanced fibrosis in patients with nonalcoholic fatty liver disease. Hepatology 2012, 55, 77–85. [Google Scholar] [CrossRef] [PubMed]
- Angulo, P.; Hui, J.M.; Marchesini, G.; Bugianesi, E.; George, J.; Farrell, G.C.; Enders, F.; Saksena, S.; Burt, A.D.; Bida, J.P.; et al. The NAFLD fibrosis score: A noninvasive system that identifies liver fibrosis in patients with NAFLD. Hepatology 2007, 45, 846–854. [Google Scholar] [CrossRef]
- Verma, S.; Jensen, D.; Hart, J.; Mohanty, S.R. Predictive value of ALT levels for non-alcoholic steatohepatitis (NASH) and advanced fibrosis in non-alcoholic fatty liver disease (NAFLD). Liver Int. Off. J. Int. Assoc. Study Liver 2013, 33, 1398–1405. [Google Scholar] [CrossRef] [PubMed]
- Fracanzani, A.L.; Valenti, L.; Bugianesi, E.; Andreoletti, M.; Colli, A.; Vanni, E.; Bertelli, C.; Fatta, E.; Bignamini, D.; Marchesini, G.; et al. Risk of severe liver disease in nonalcoholic fatty liver disease with normal aminotransferase levels: a role for insulin resistance and diabetes. Hepatology 2008, 48, 792–798. [Google Scholar] [CrossRef]
- Younossi, Z.M.; Page, S.; Rafiq, N.; Birerdinc, A.; Stepanova, M.; Hossain, N.; Afendy, A.; Younoszai, Z.; Goodman, Z.; Baranova, A. A biomarker panel for non-alcoholic steatohepatitis (NASH) and NASH-related fibrosis. Obes. Surg. 2011, 21, 431–439. [Google Scholar] [CrossRef] [PubMed]
- Younossi, Z.M.; Jarrar, M.; Nugent, C.; Randhawa, M.; Afendy, M.; Stepanova, M.; Rafiq, N.; Goodman, Z.; Chandhoke, V.; Baranova, A. A novel diagnostic biomarker panel for obesity-related nonalcoholic steatohepatitis (NASH). Obes. Surg. 2008, 18, 1430–1437. [Google Scholar] [CrossRef] [PubMed]
- Tarantino, G.; Conca, P.; Coppola, A.; Vecchione, R.; Di Minno, G. Serum concentrations of the tissue polypeptide specific antigen in patients suffering from non-alcoholic steatohepatitis. Eur. J. Clin. Investig. 2006, 37, 48–53. [Google Scholar] [CrossRef] [PubMed]
- Cusi, K.; Chang, Z.; Harrison, S.; Lomonaco, R.; Bril, F.; Orsak, B.; Ortiz-Lopez, C.; Hecht, J.; Feldstein, A.E.; Webb, A.; et al. Limited value of plasma cytokeratin-18 as a biomarker for NASH and fibrosis in patients with non-alcoholic fatty liver disease. J. Hepatol. 2014, 60, 167–174. [Google Scholar] [CrossRef]
- Zhang, E.; Wartelle-Bladou, C.; Lepanto, L.; Lachaine, J.; Cloutier, G.; Tang, A. Cost-utility analysis of nonalcoholic steatohepatitis screening. Eur. Radiol. 2015, 25, 3282–3294. [Google Scholar] [CrossRef] [Green Version]
- Gunn, N.T.; Shiffman, M.L. The Use of Liver Biopsy in Nonalcoholic Fatty Liver Disease: When to Biopsy and in Whom. Clin. Liver Dis. 2018, 22, 109–119. [Google Scholar] [CrossRef] [PubMed]
© 2019 by the authors. Licensee MDPI, Basel, Switzerland. This article is an open access article distributed under the terms and conditions of the Creative Commons Attribution (CC BY) license (http://creativecommons.org/licenses/by/4.0/).

 ,
, 

