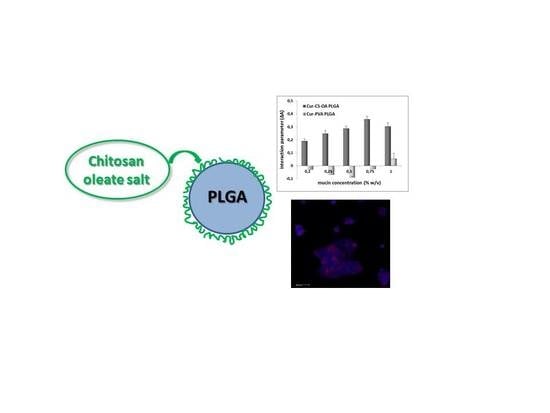
Chitosan Oleate Salt as an Amphiphilic Polymer for the Surface Modification of Poly-Lactic-Glycolic Acid (PLGA) Nanoparticles. Preliminary Studies of Mucoadhesion and Cell Interaction Properties

 , ,
, ,  ,
,
Abstract
:
1. Introduction
2. Results and Discussion
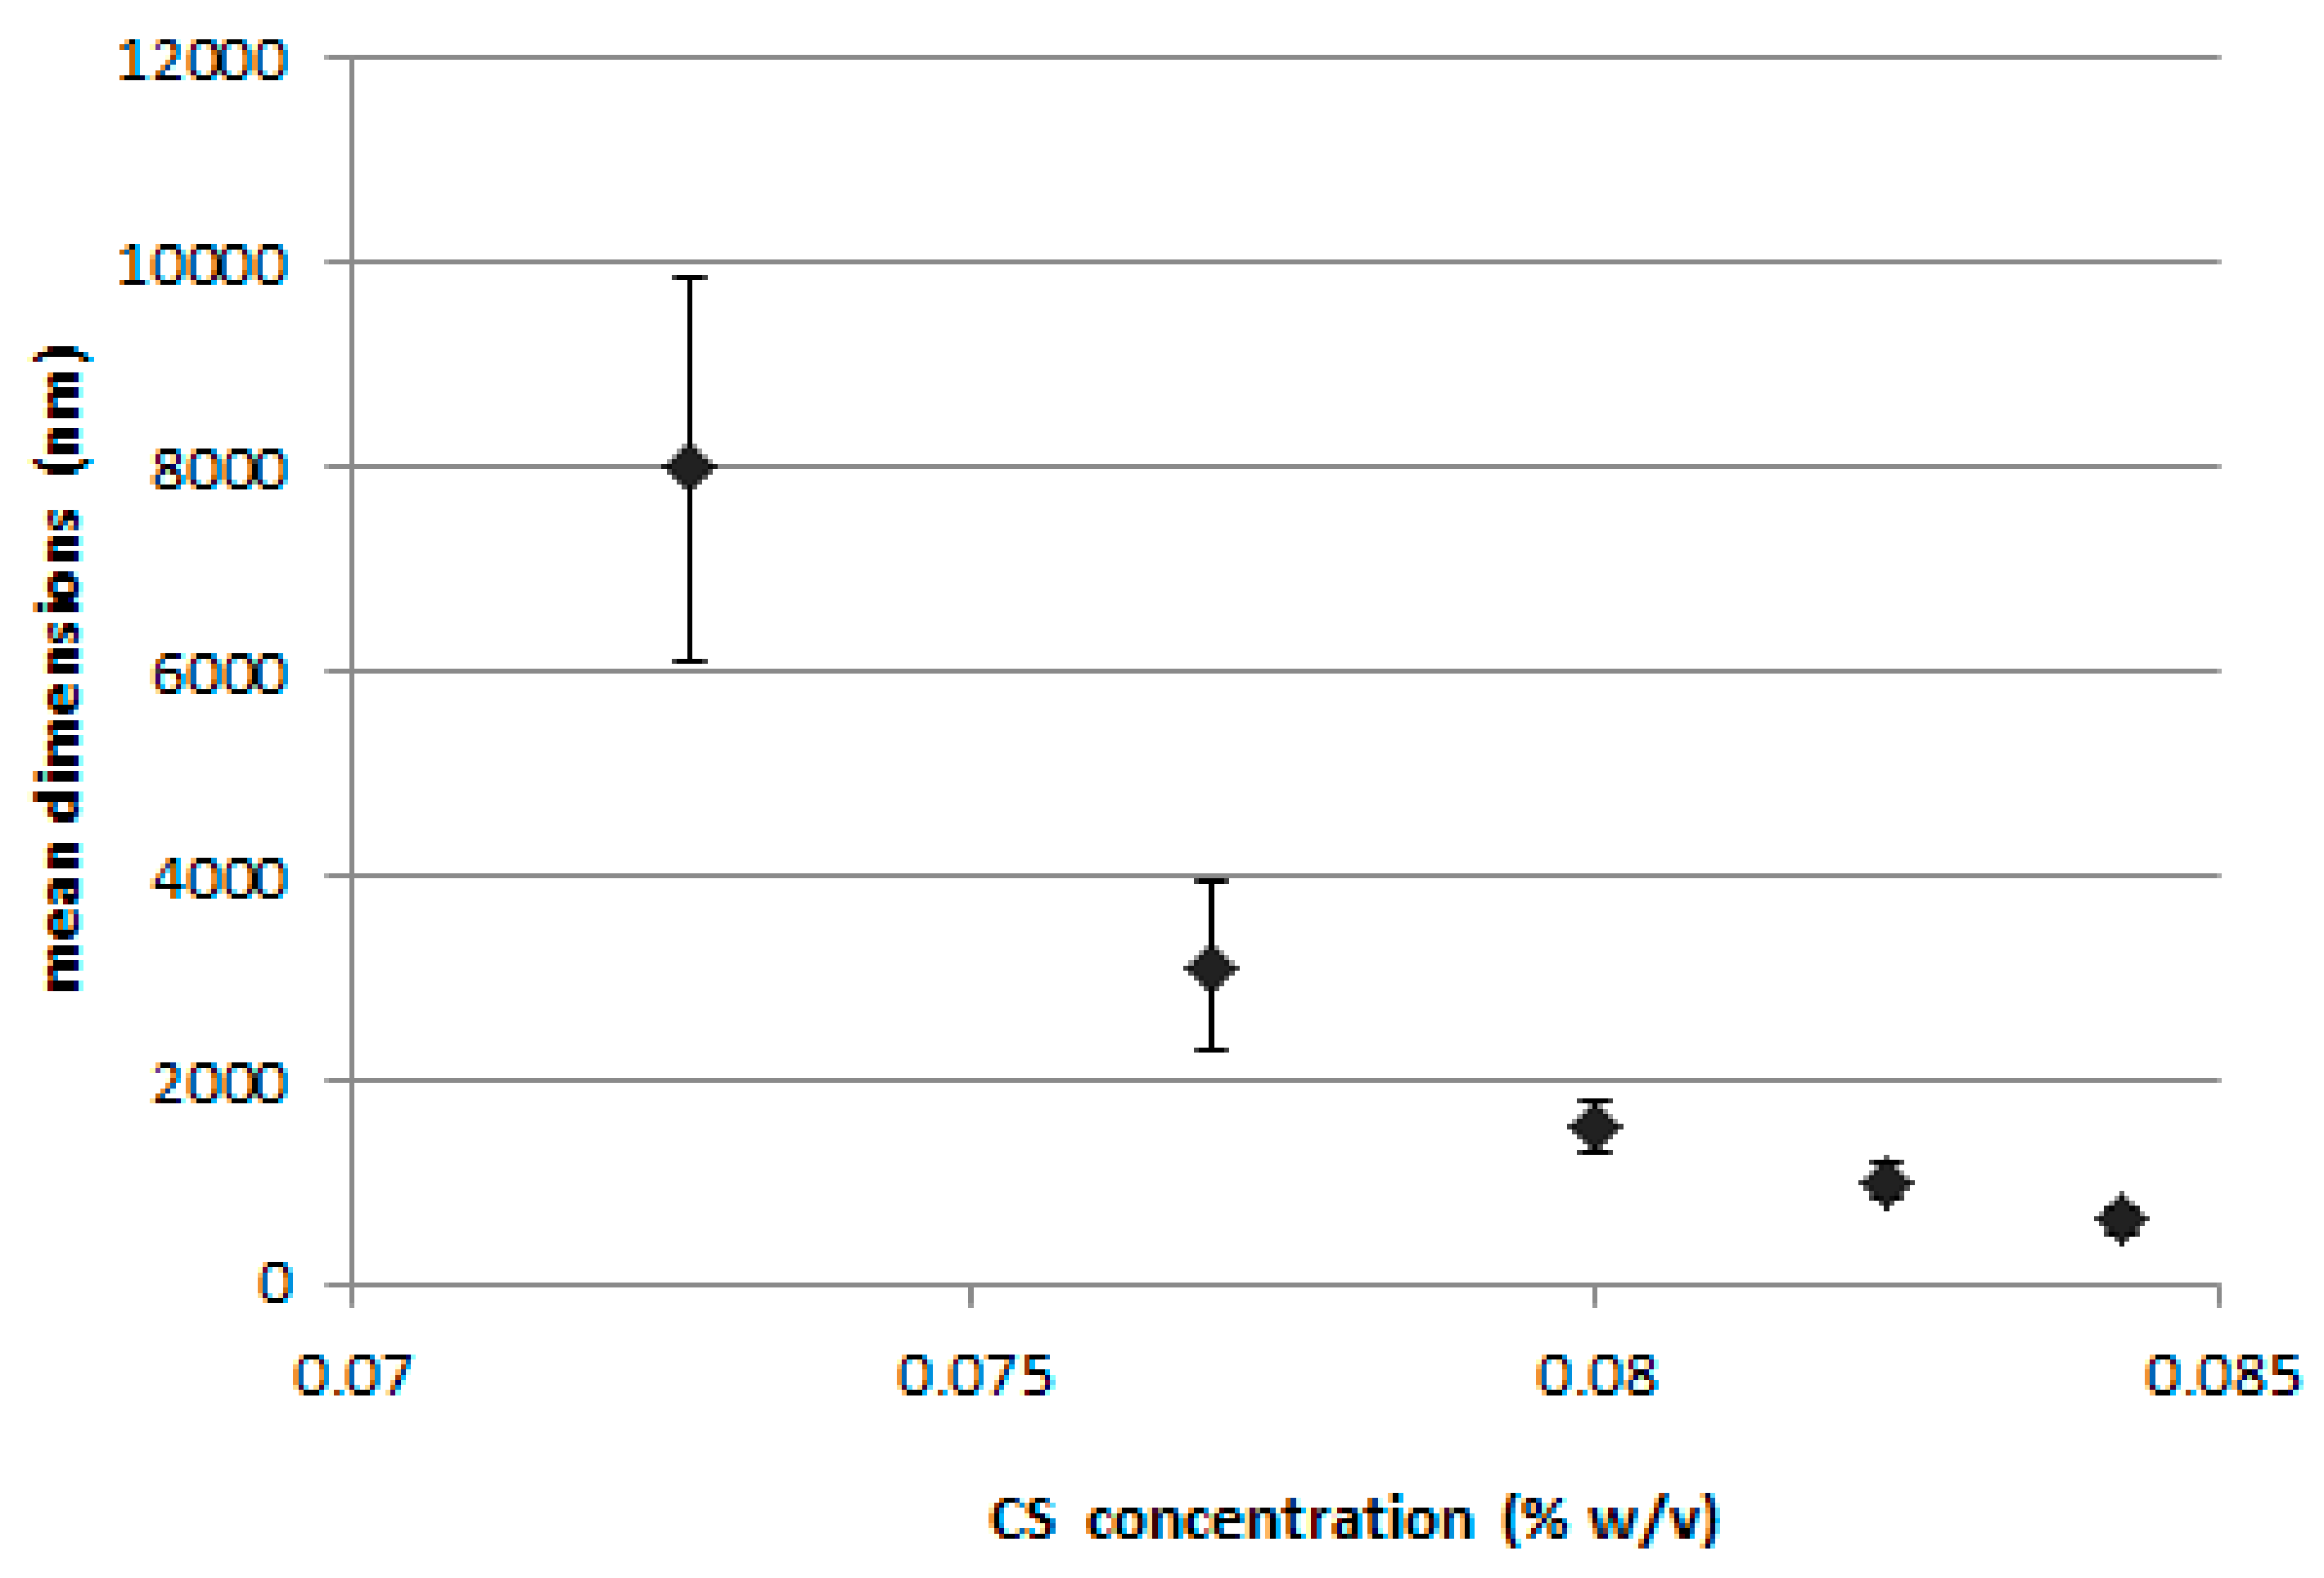
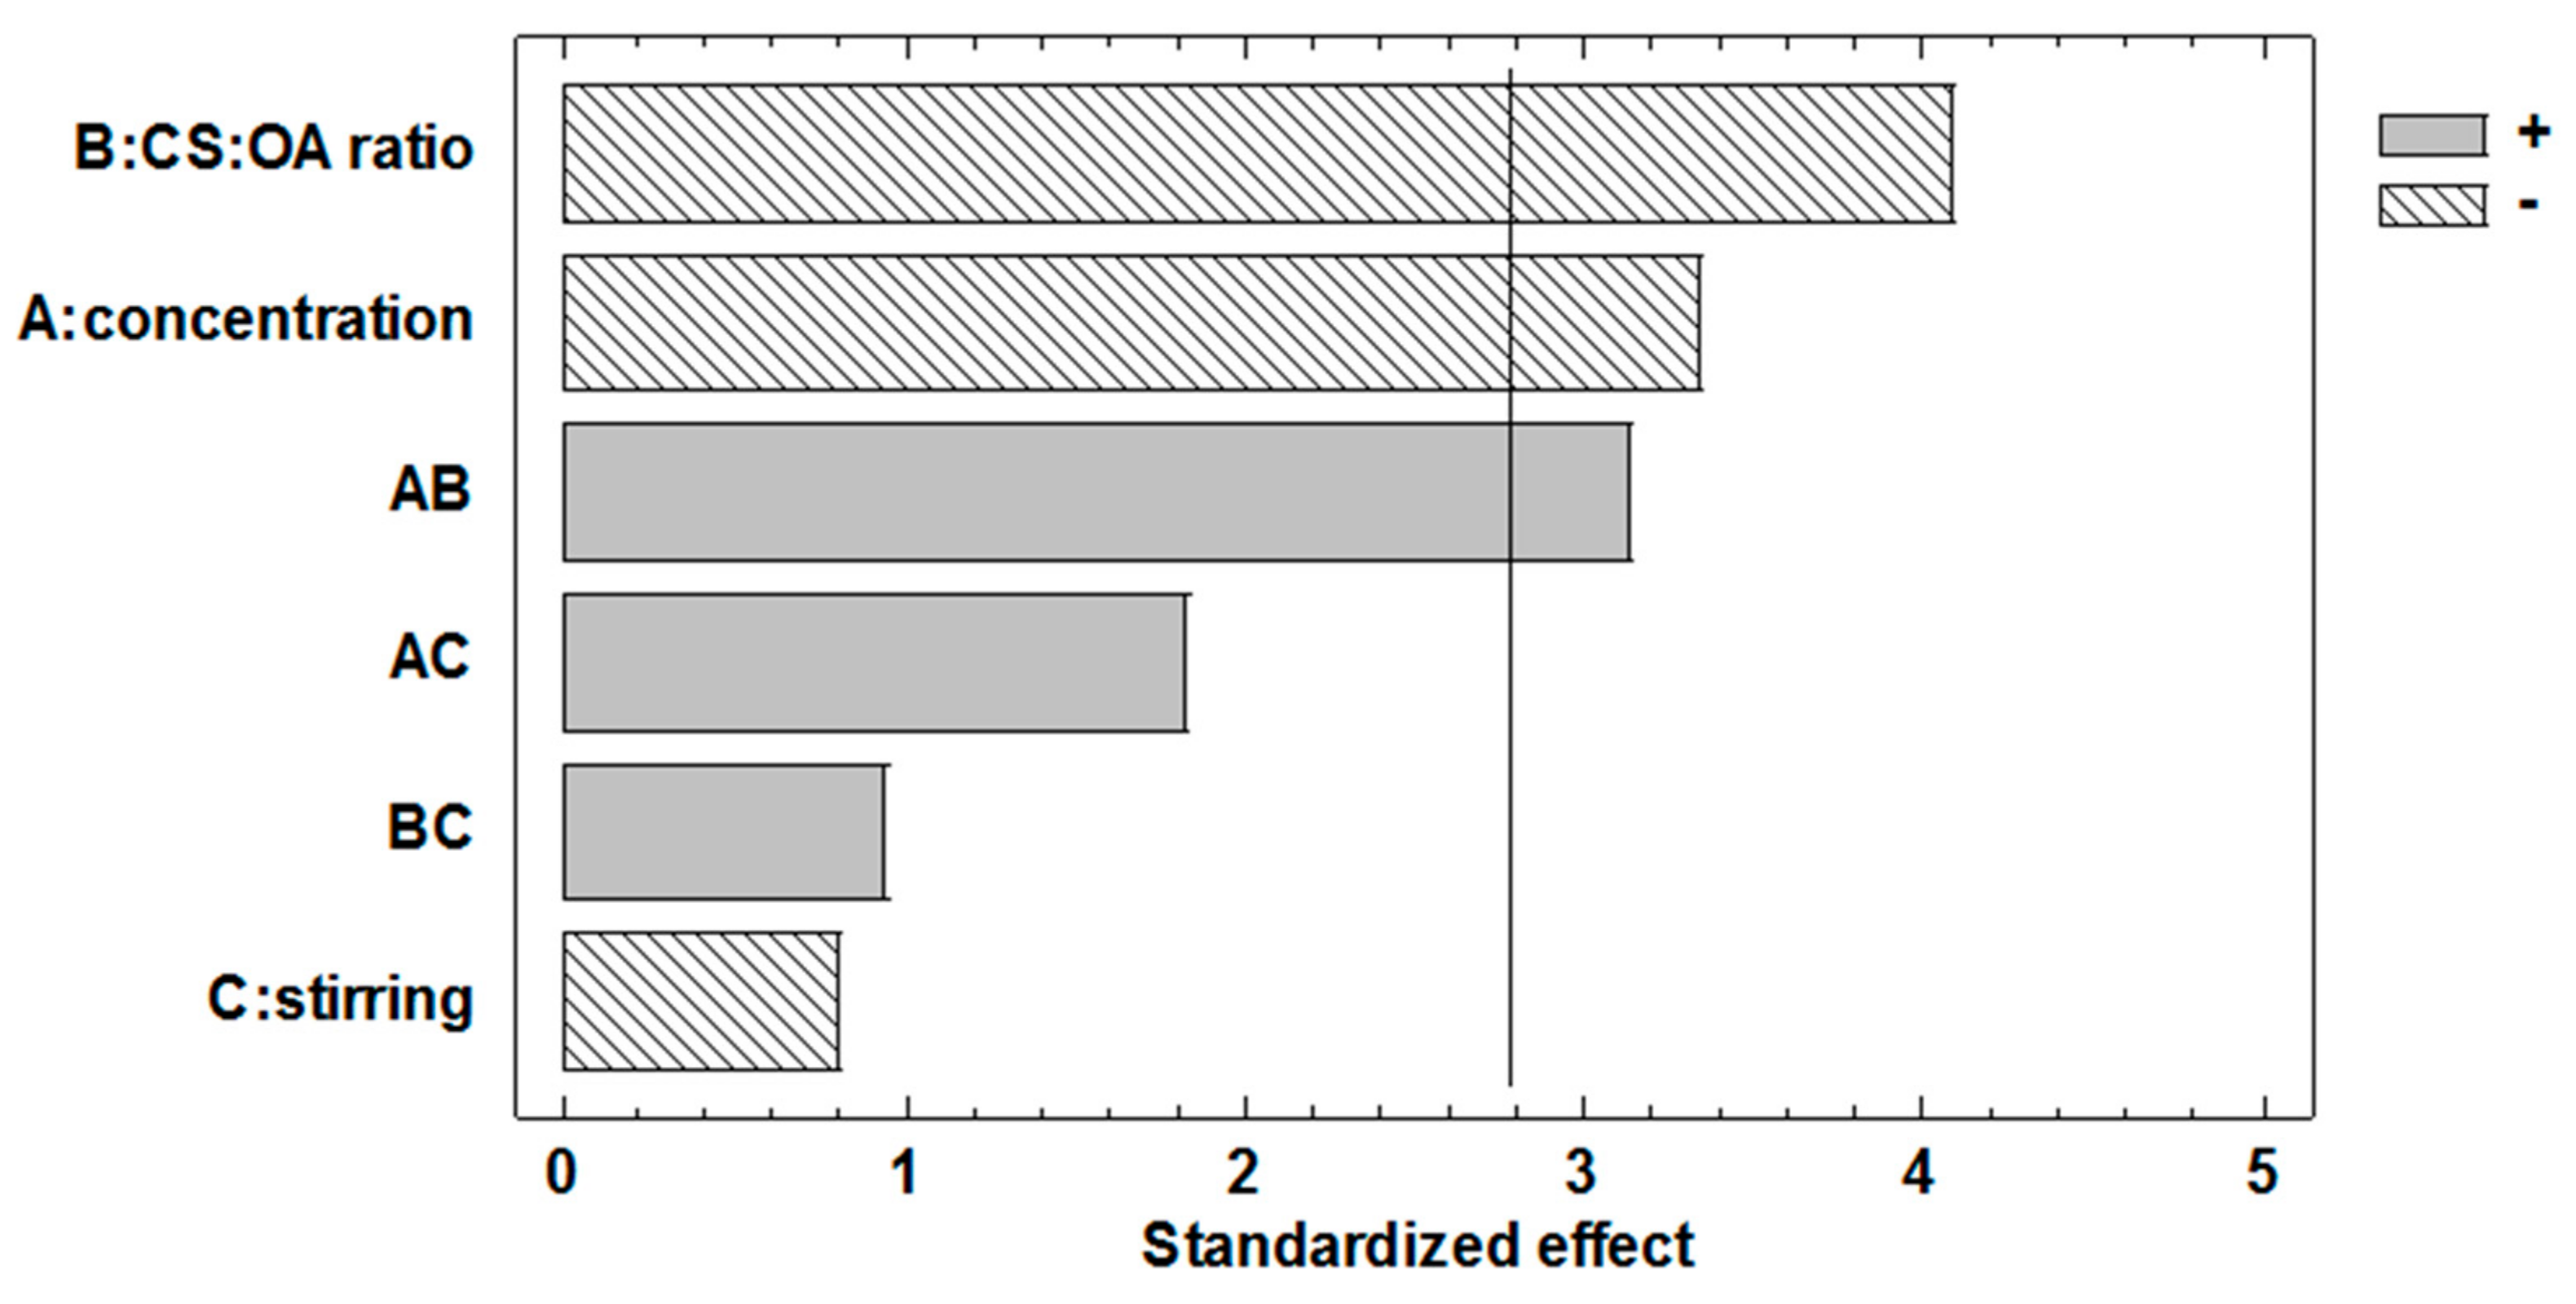
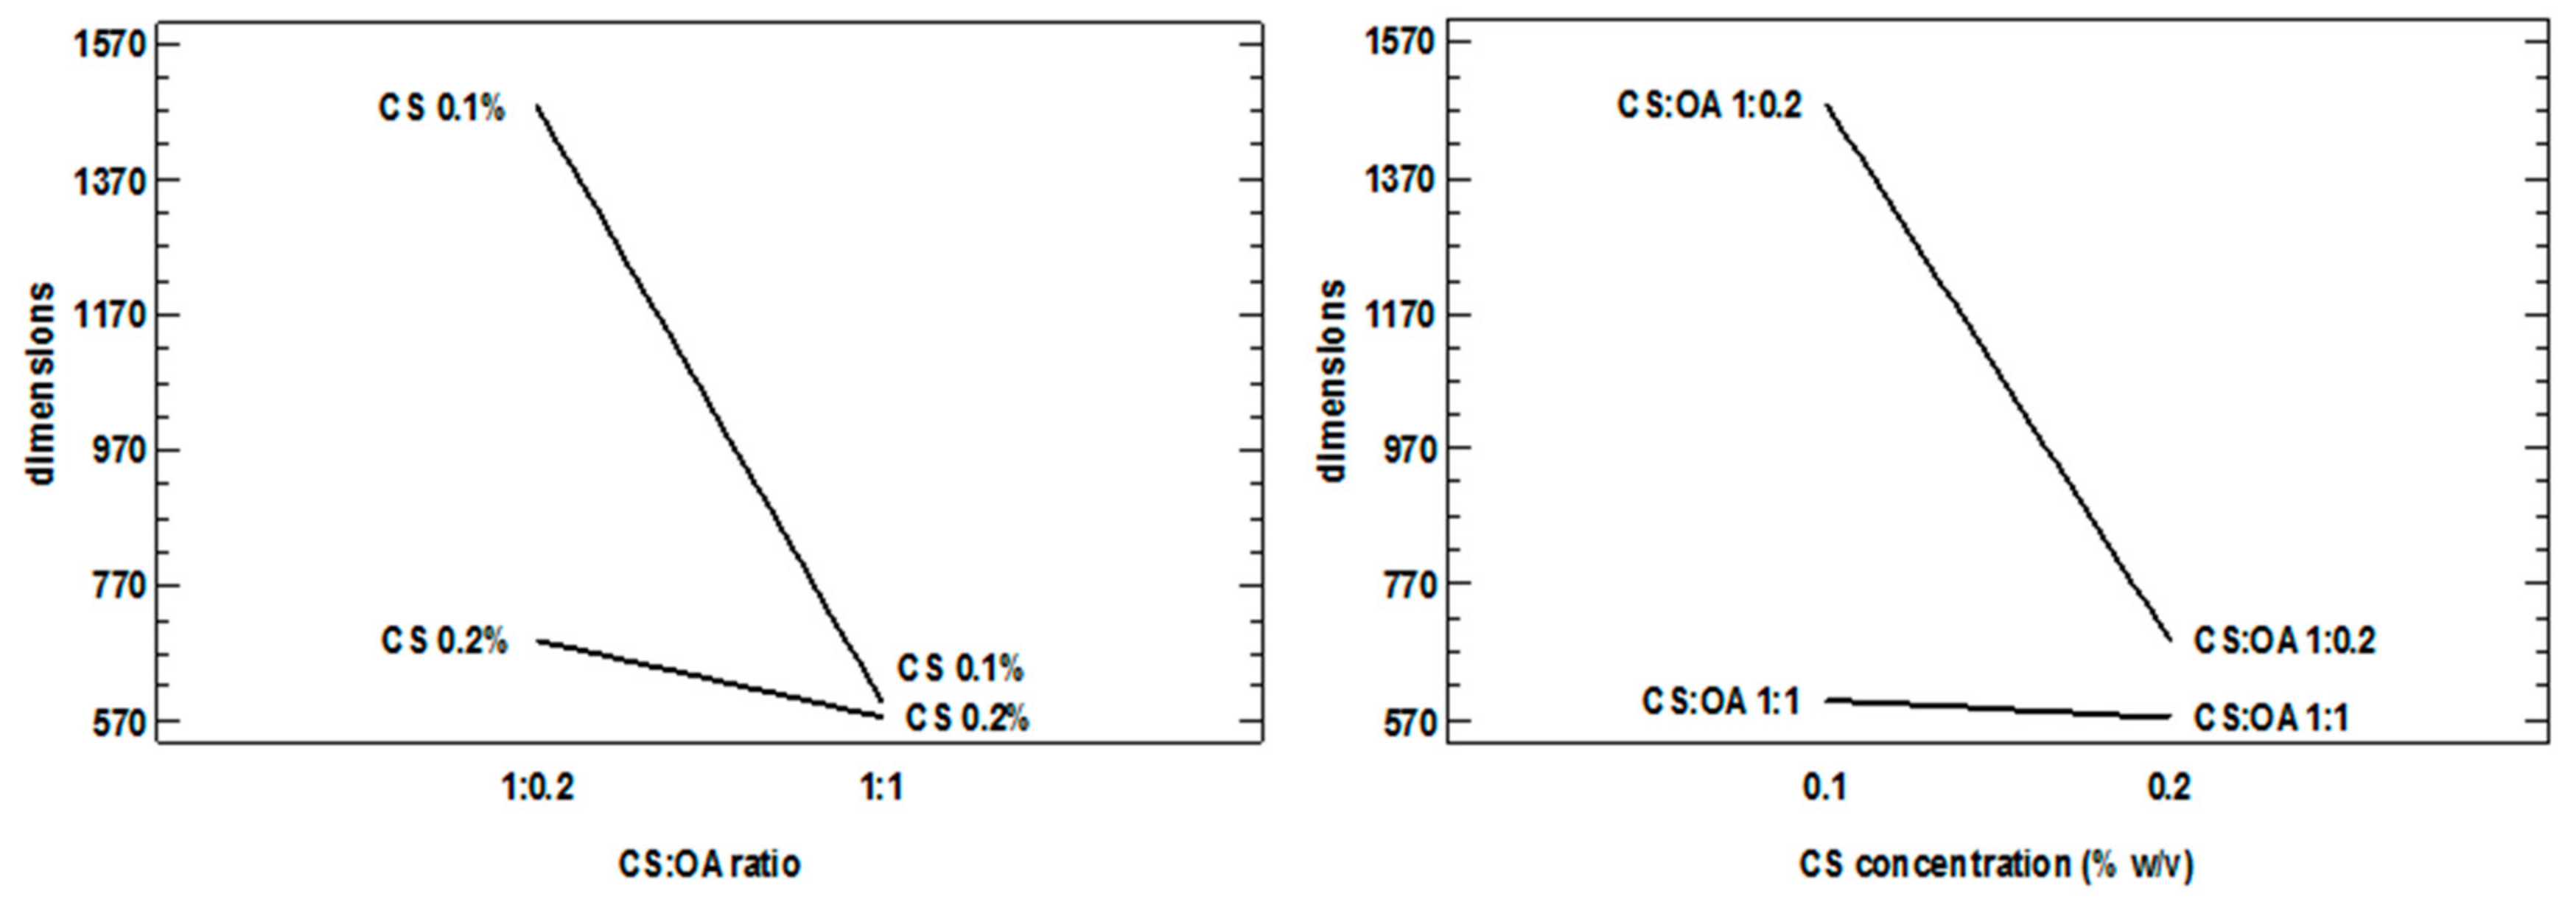
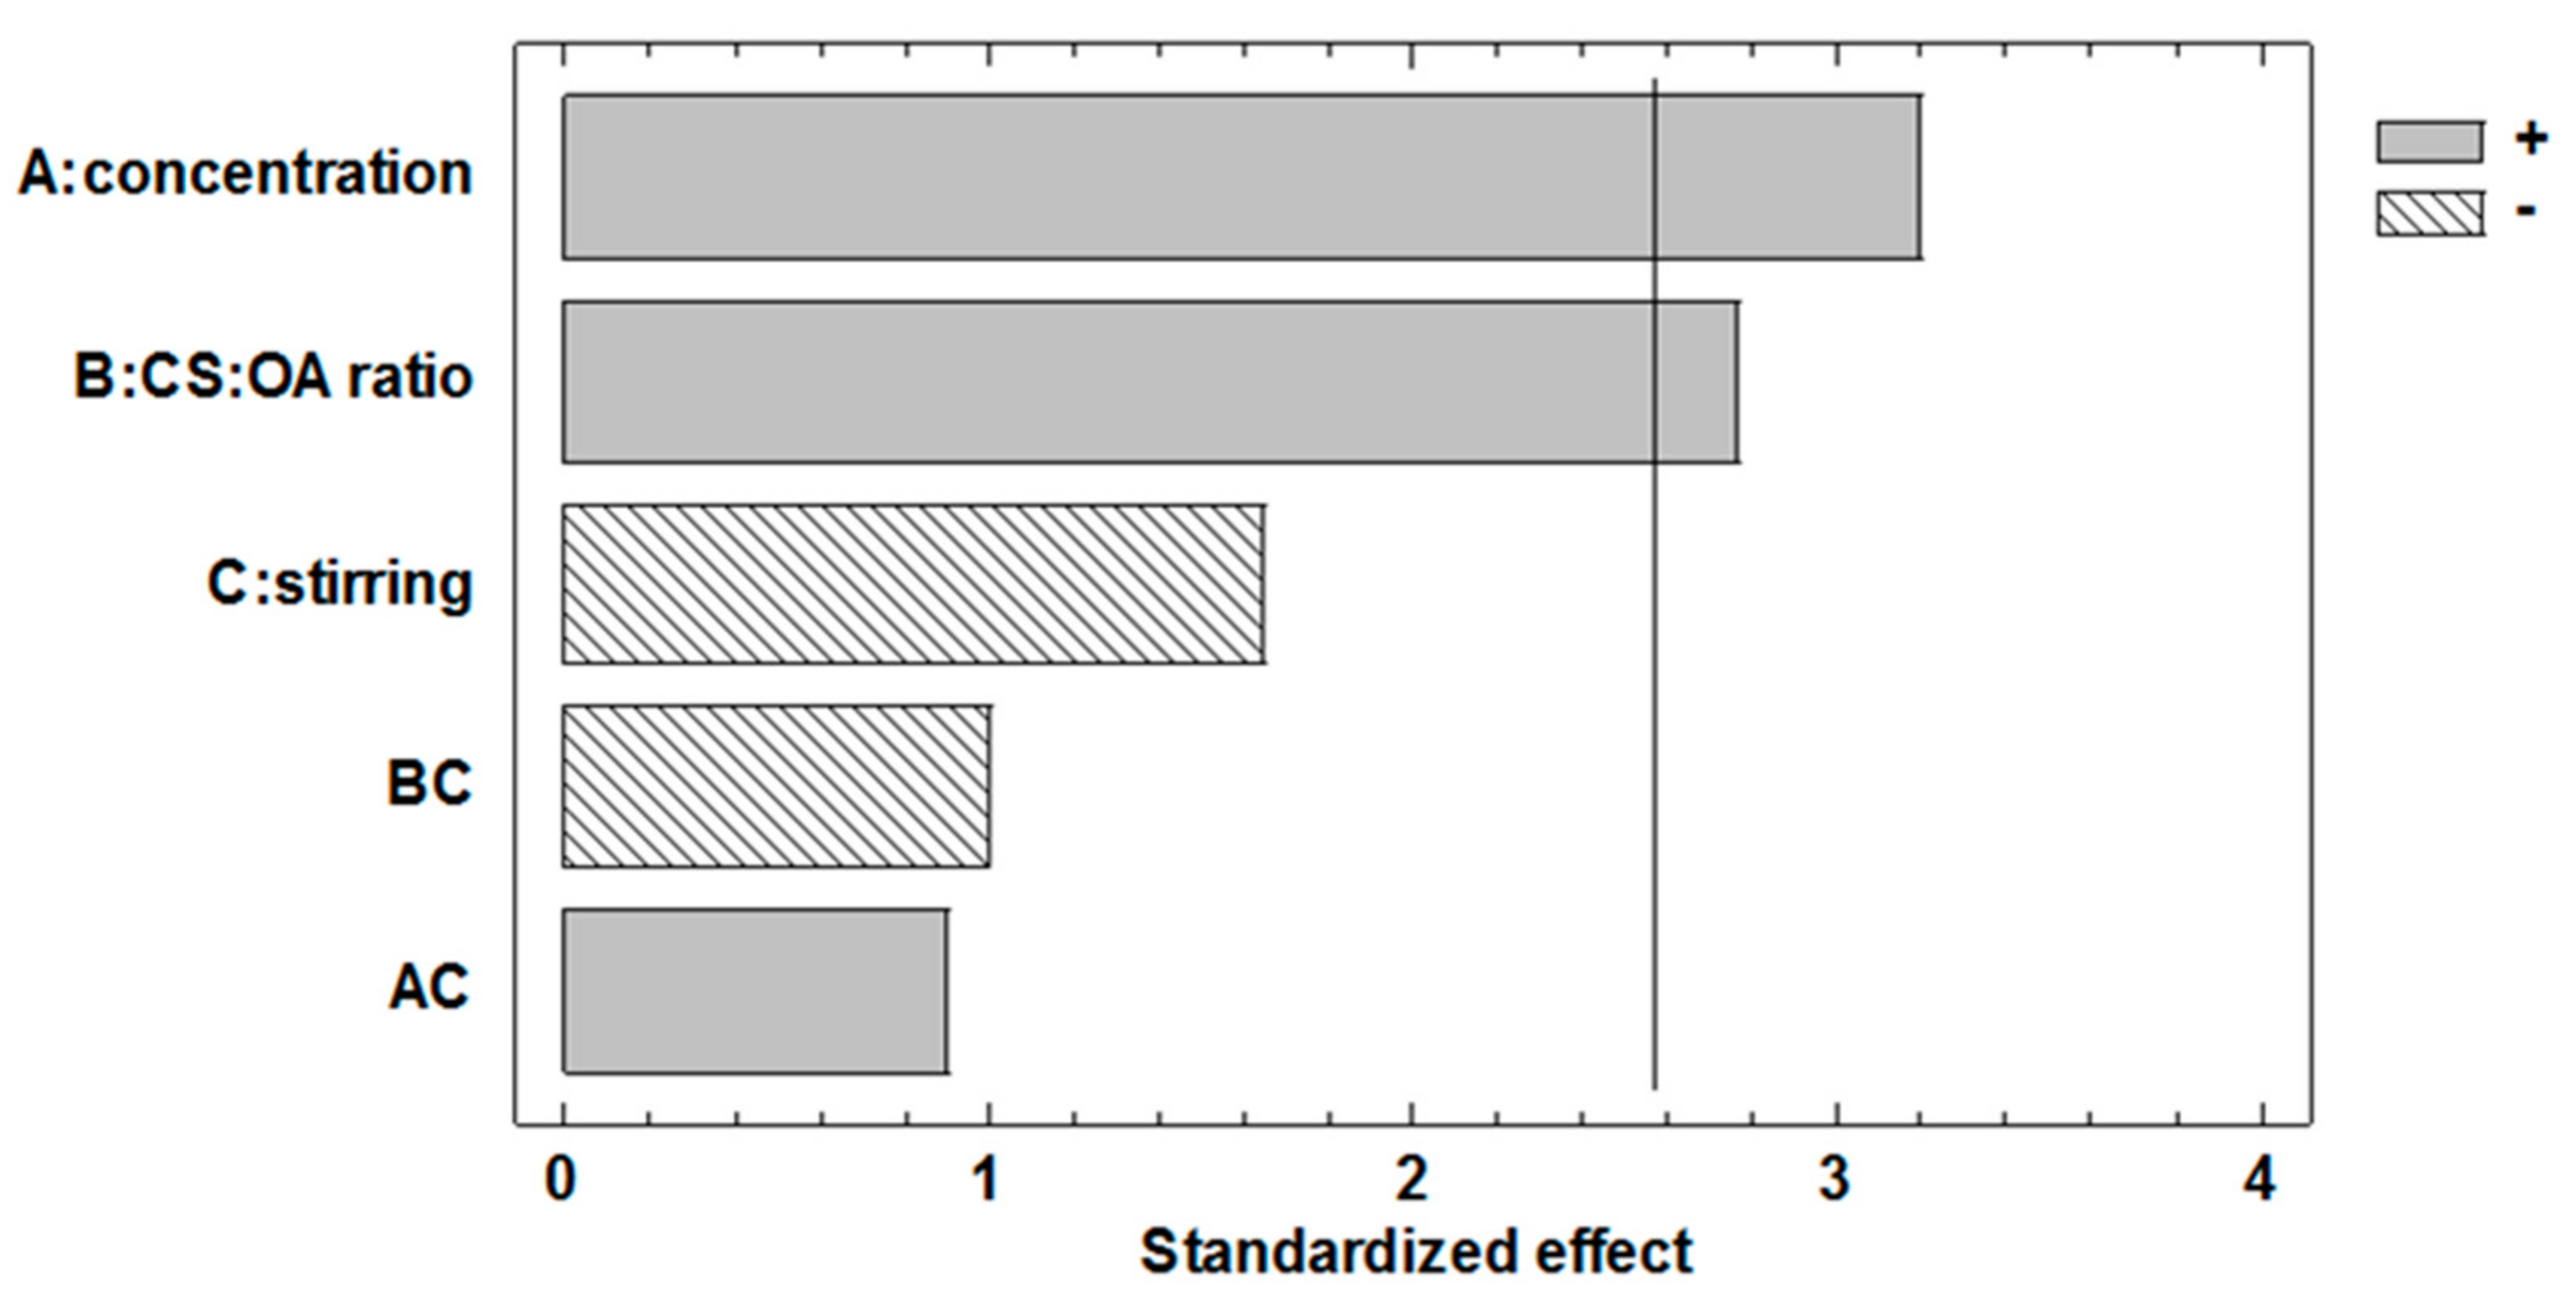
2.1. Relevance of Formulation and Preparation Parameters on Nile Red Loaded NPs through DoE Study
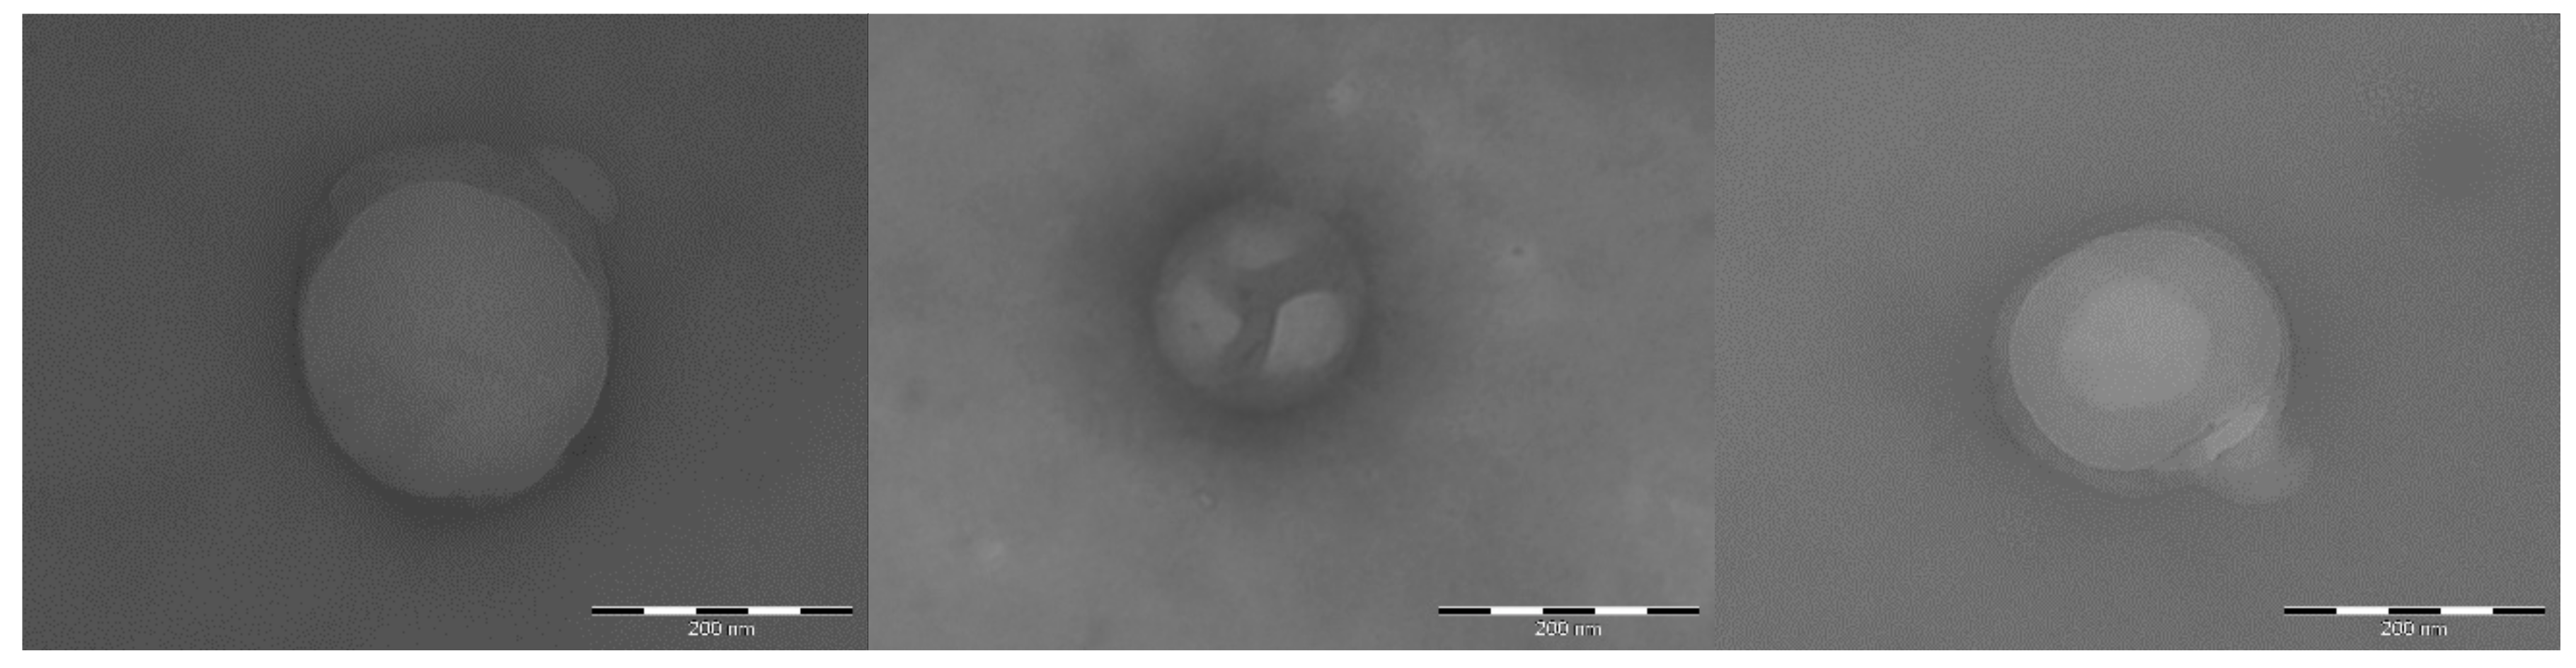
2.2. Curcumin Loaded NPs
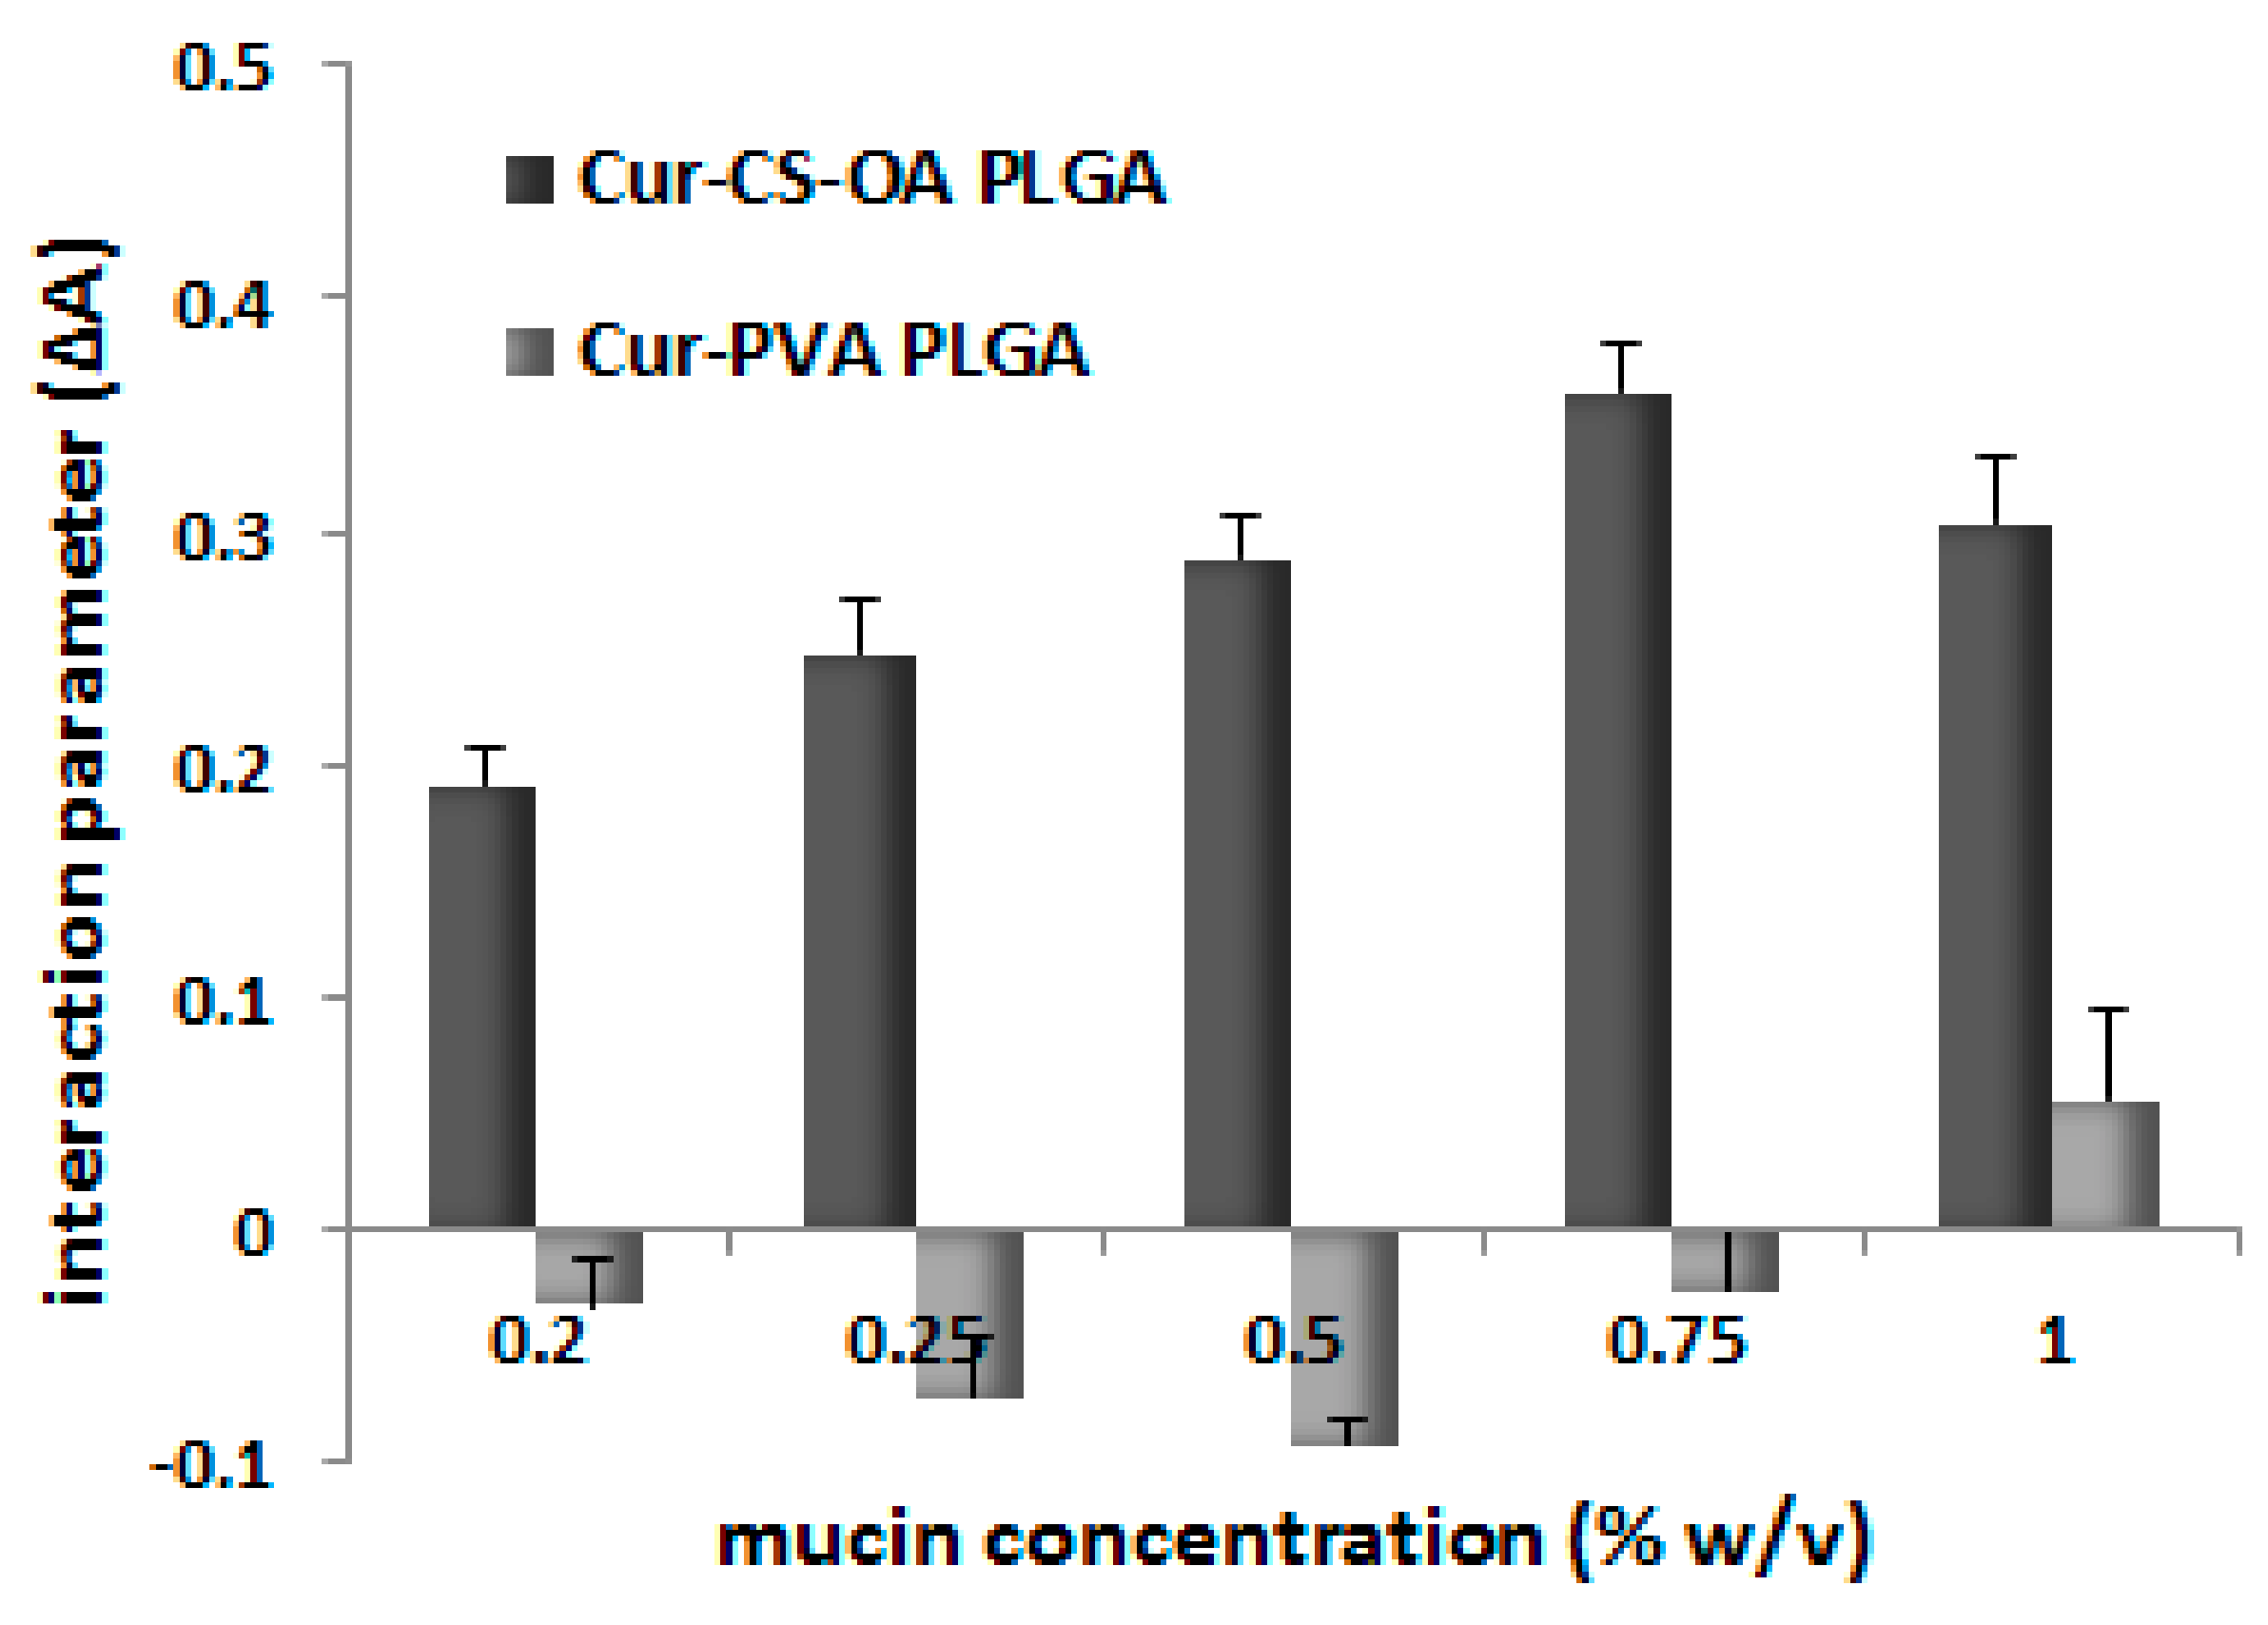
2.2.1. Curcumin Loaded NPs Mucoadhesion Behavior
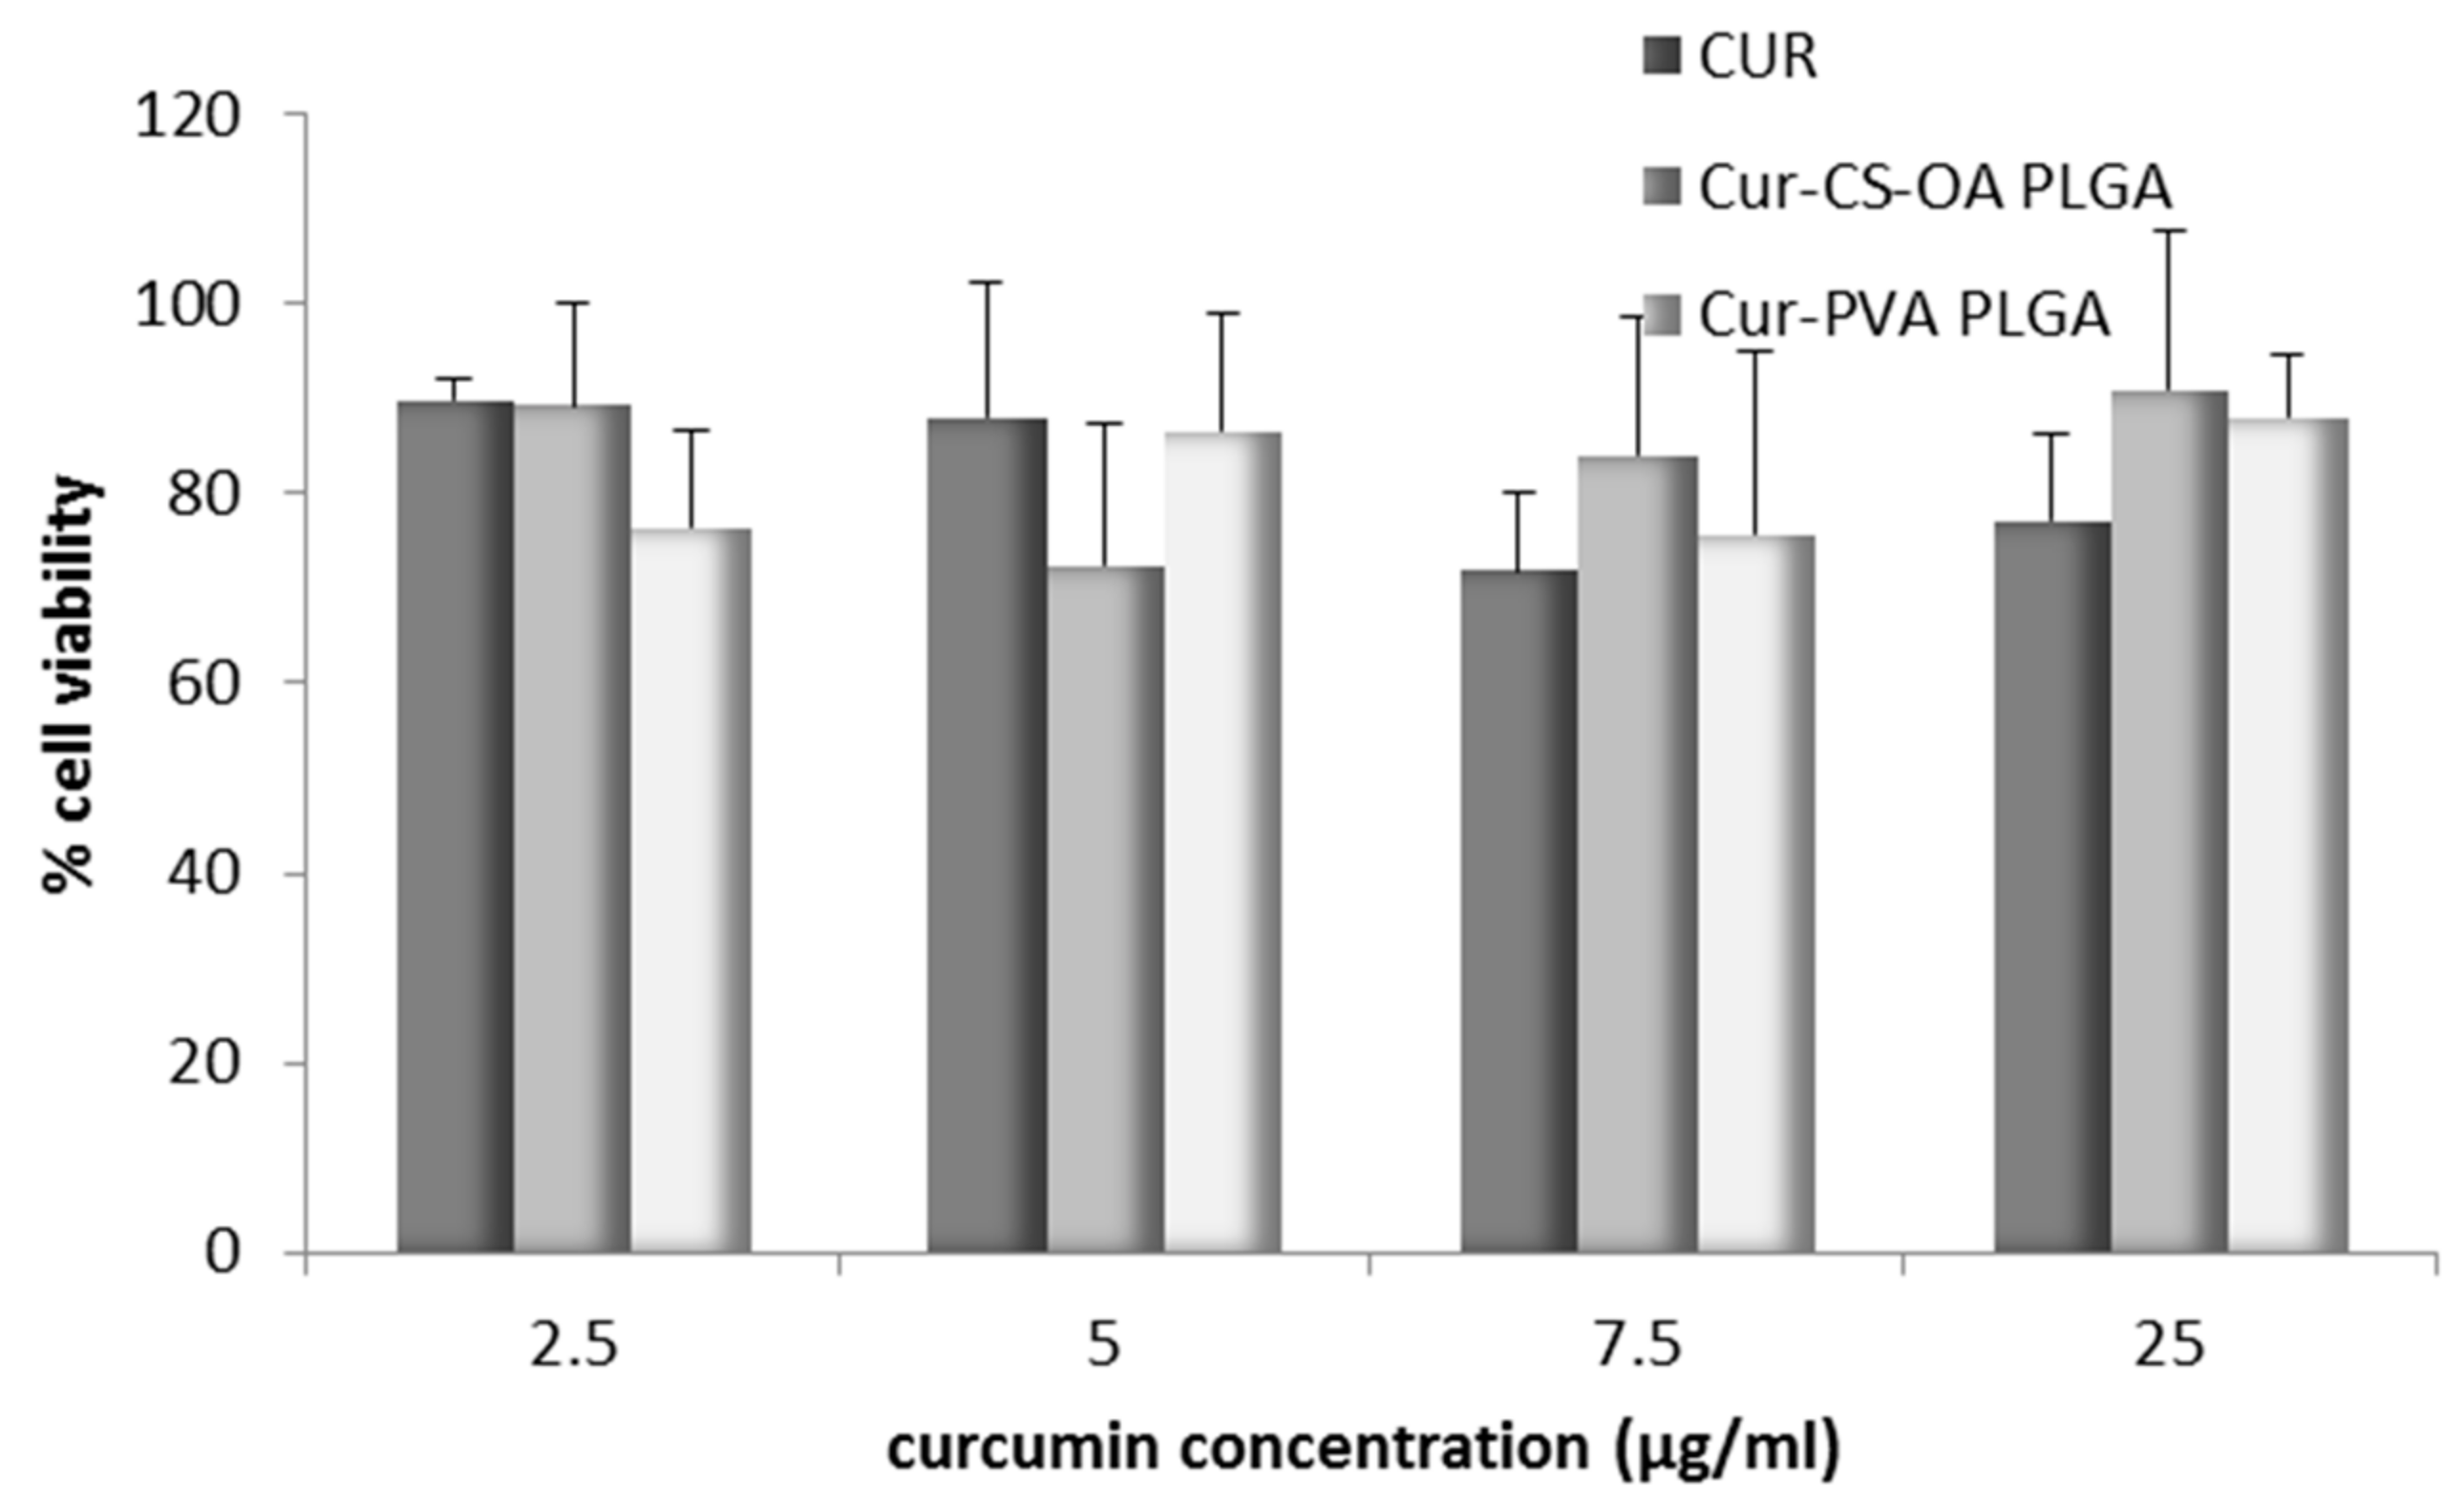
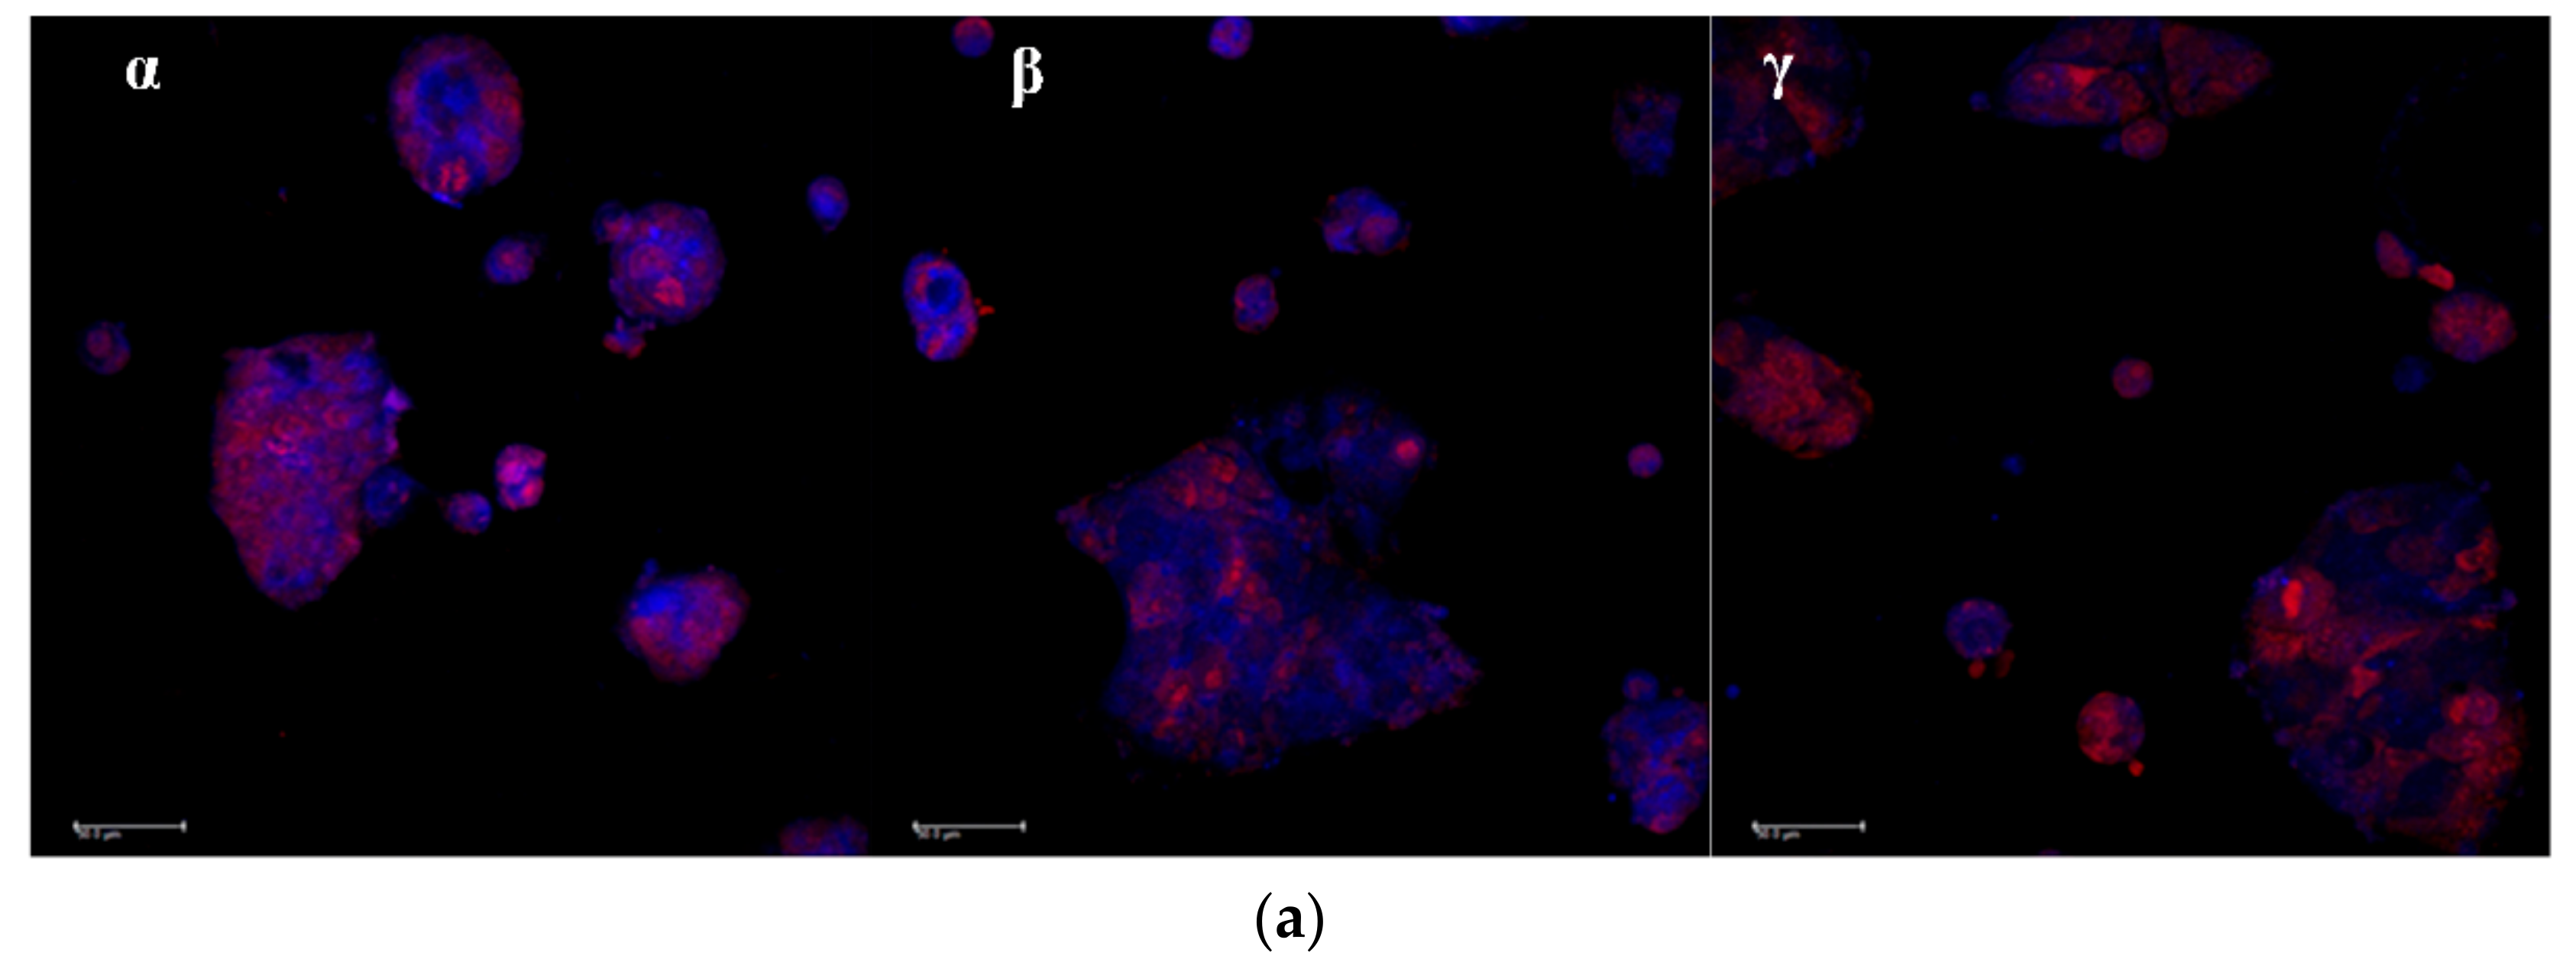
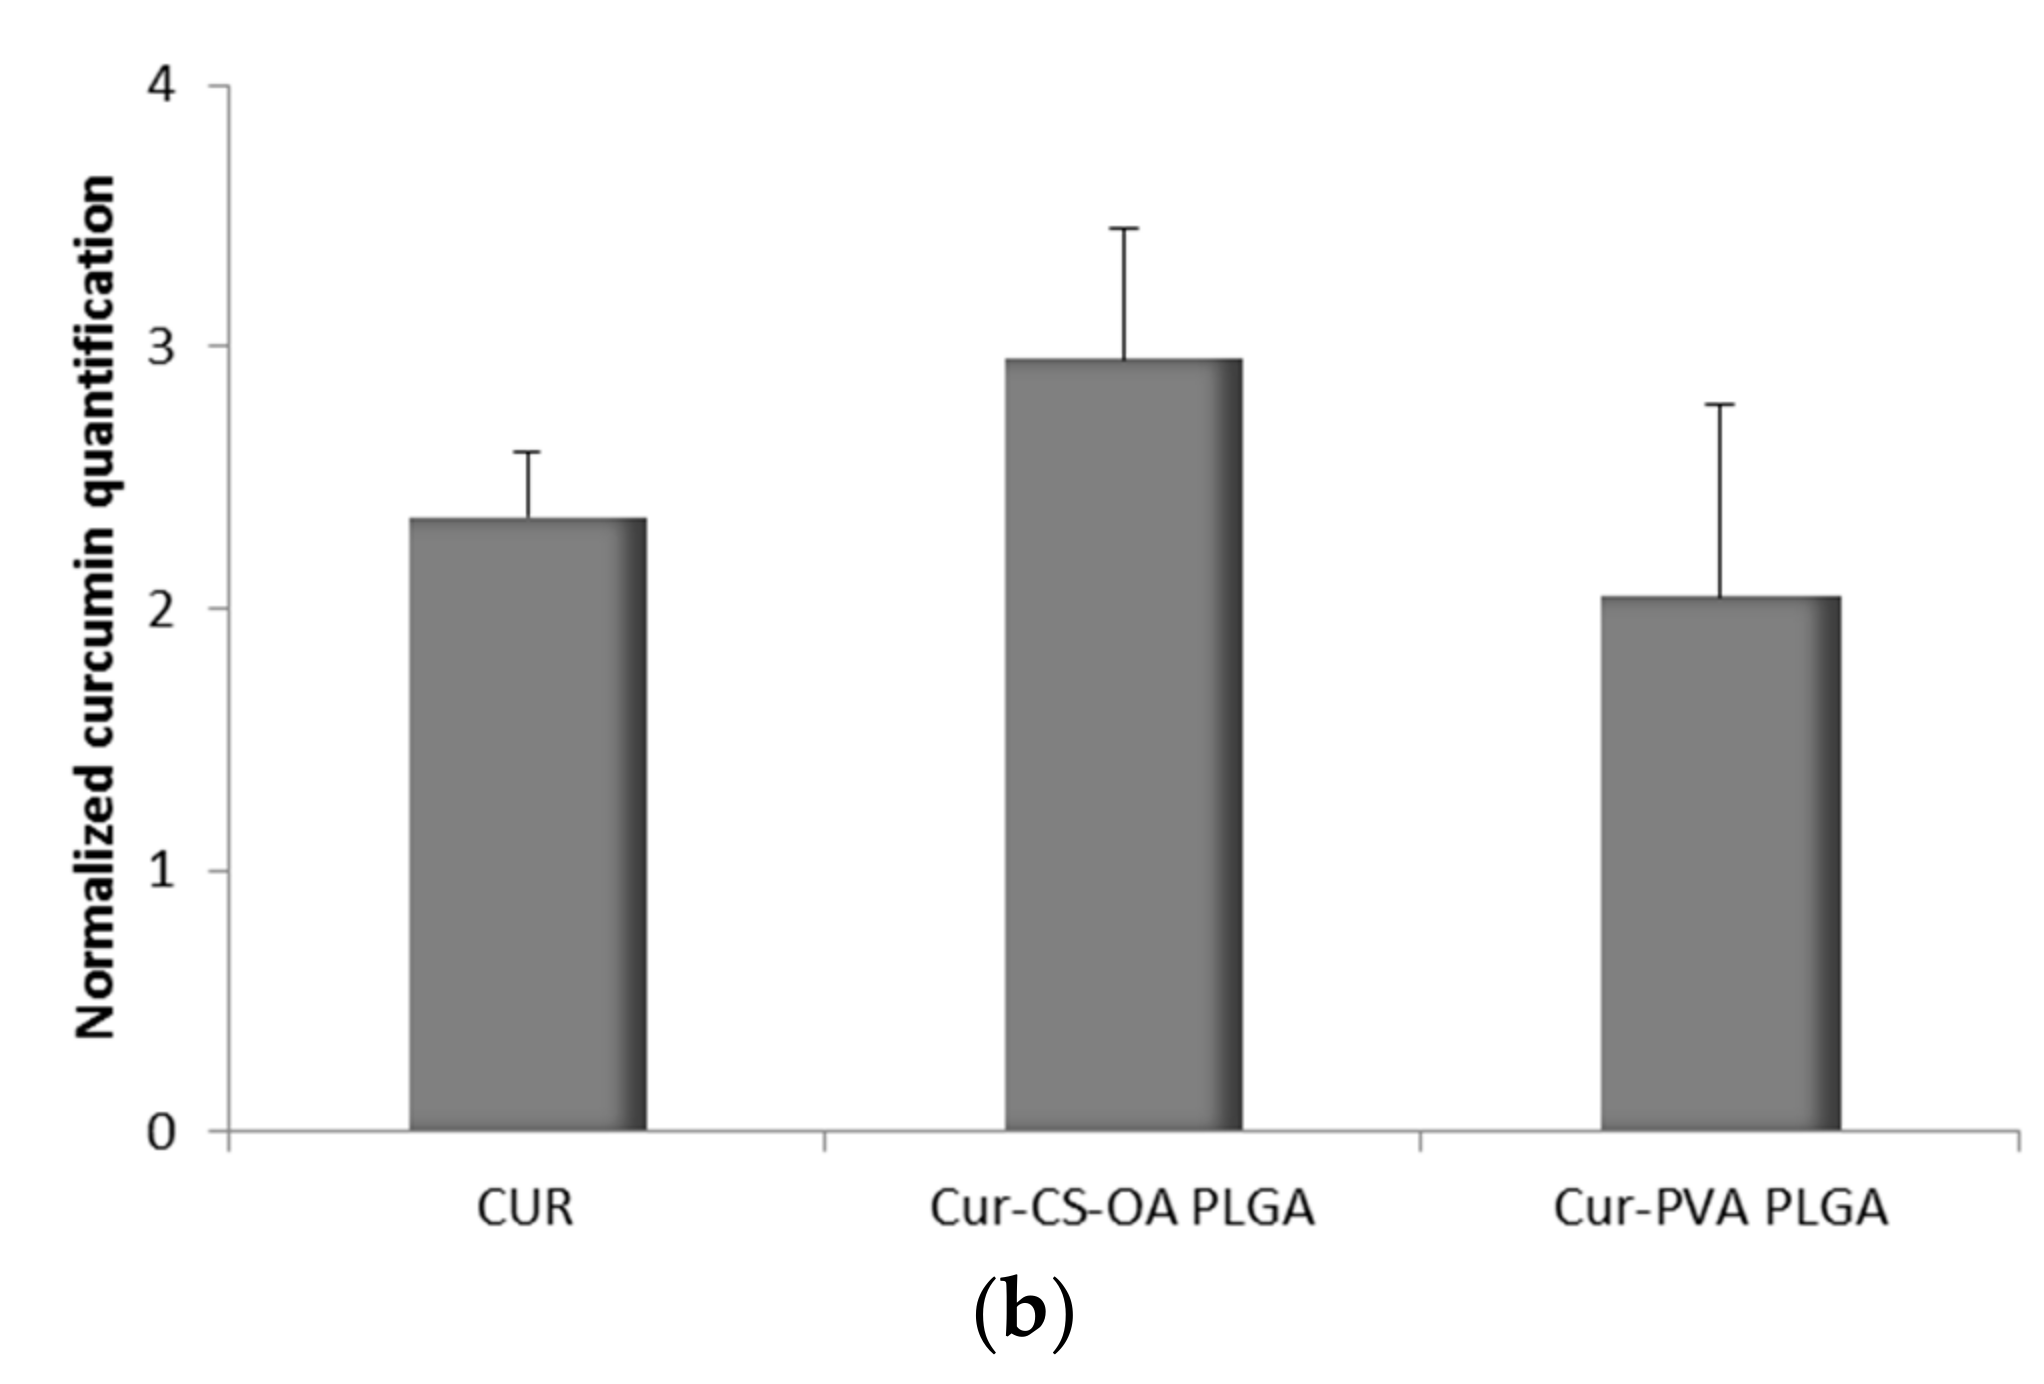
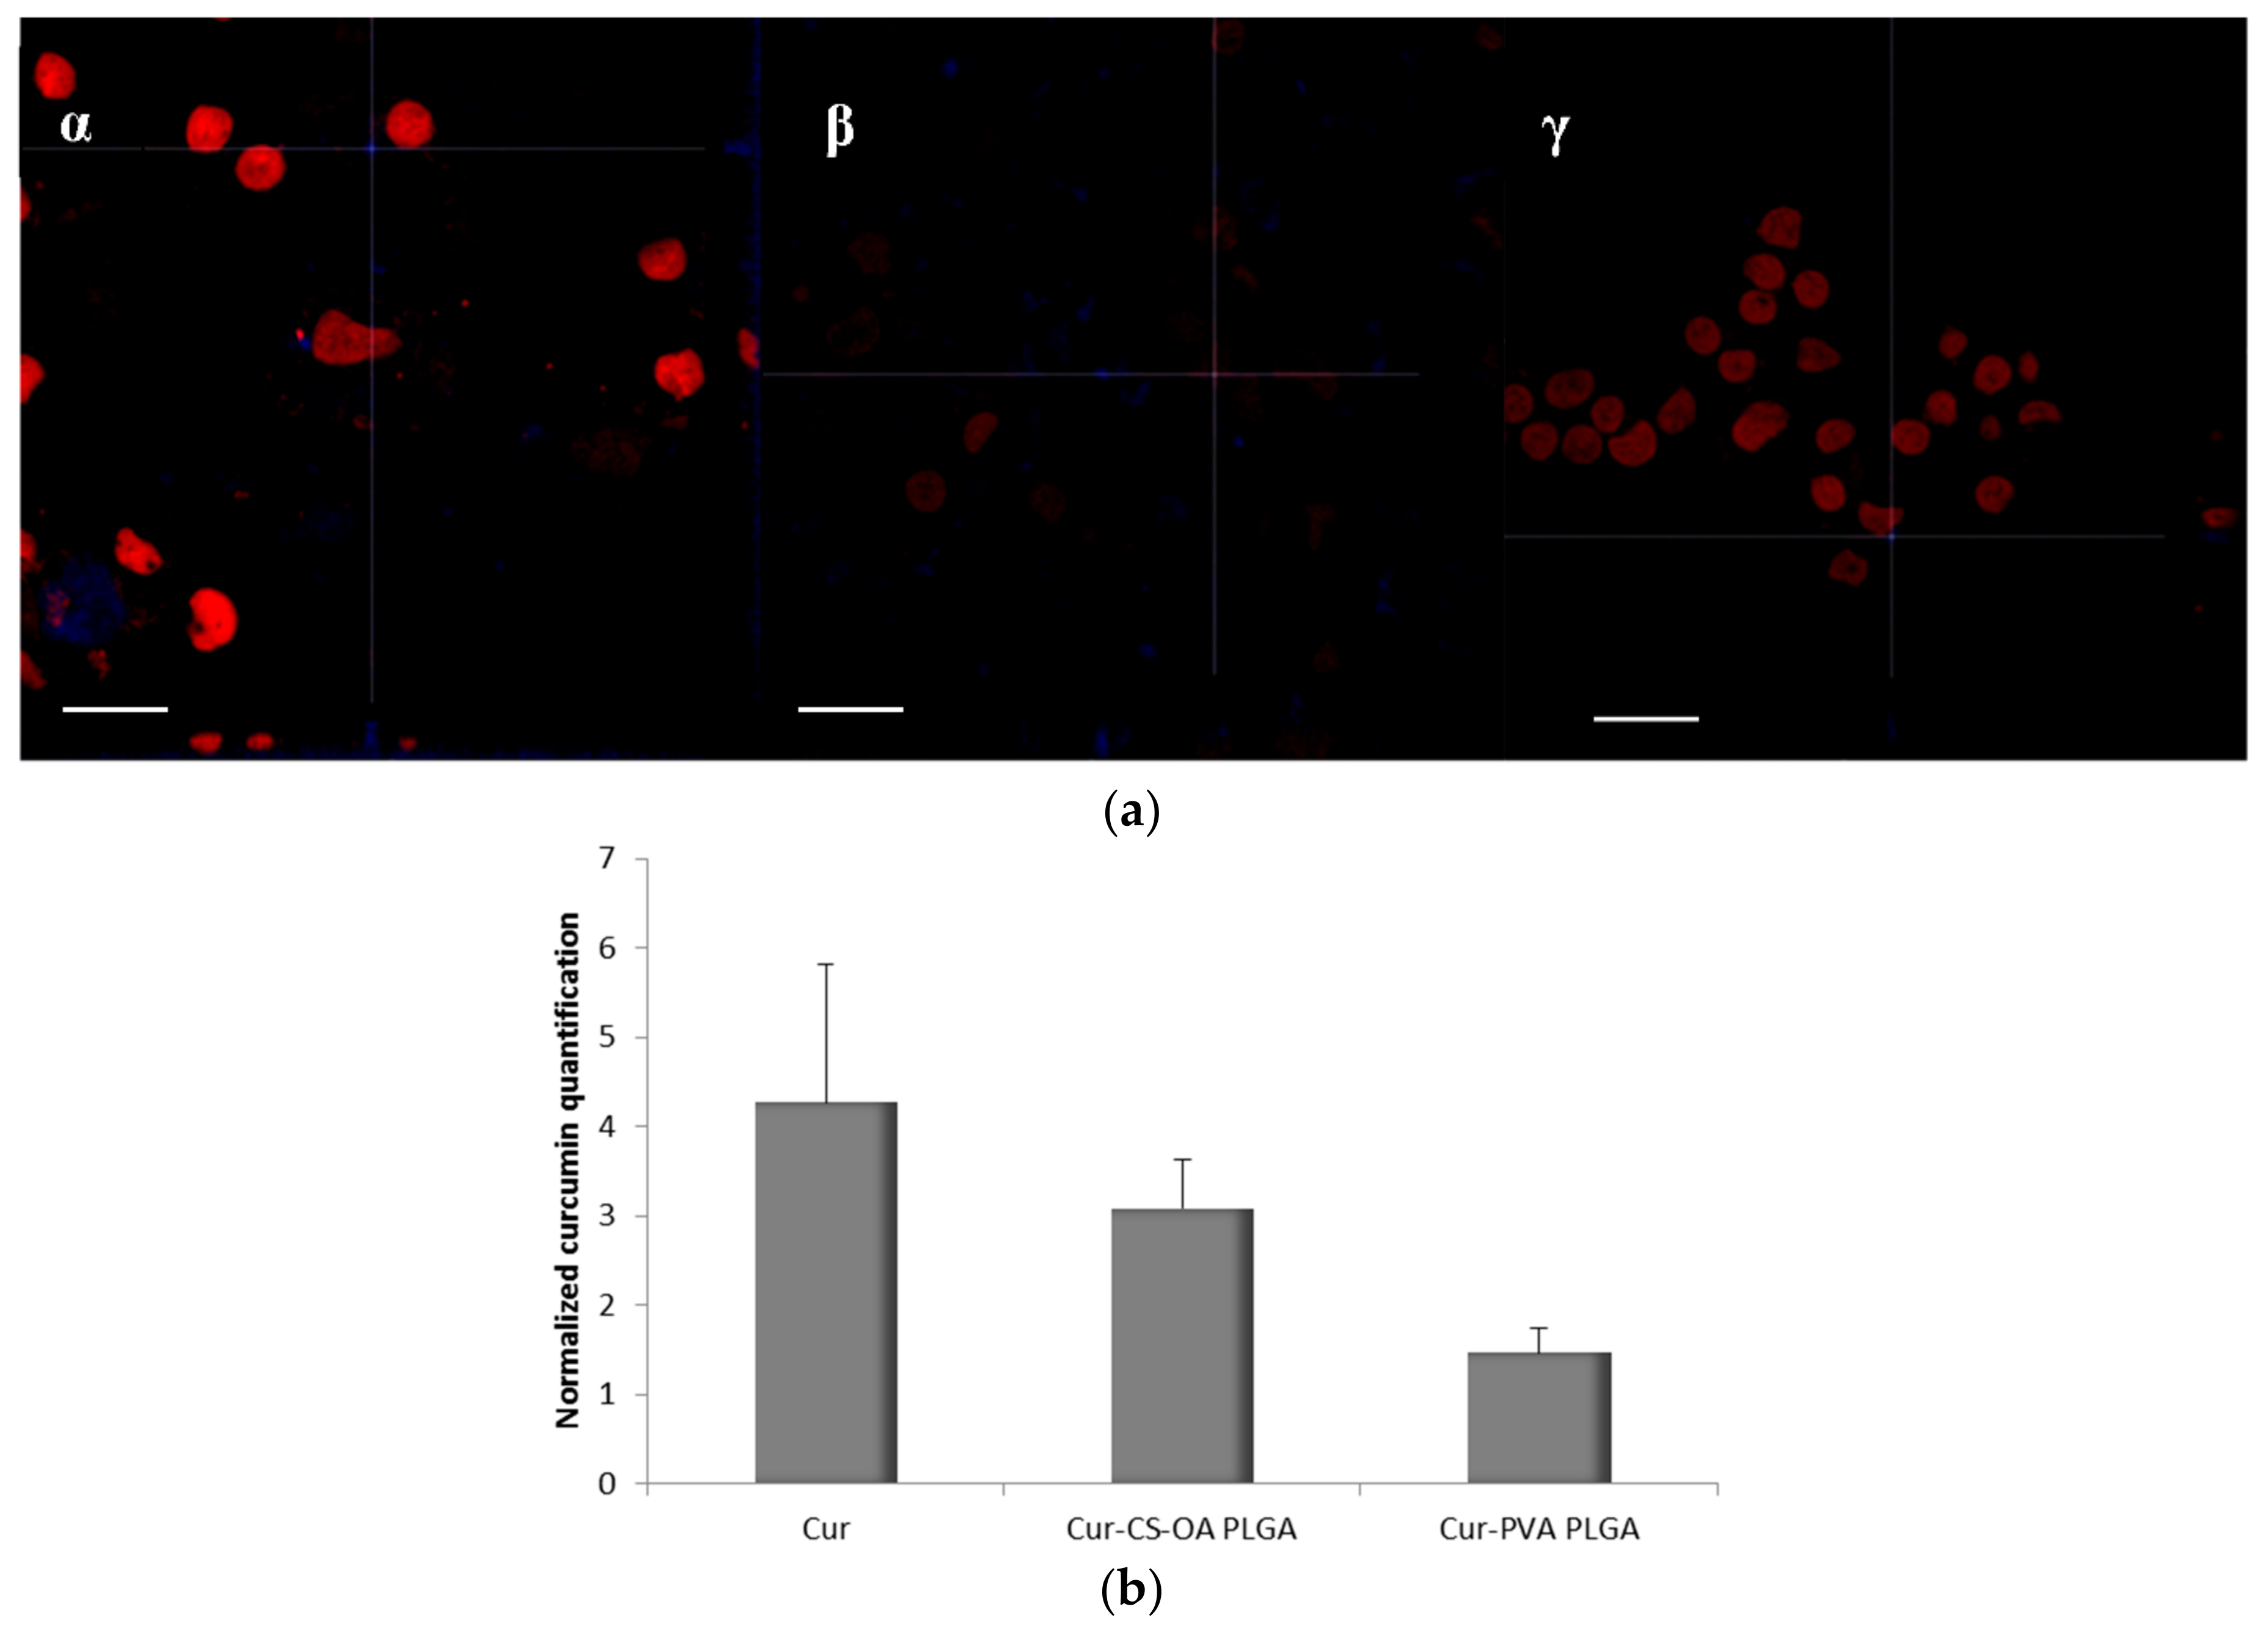
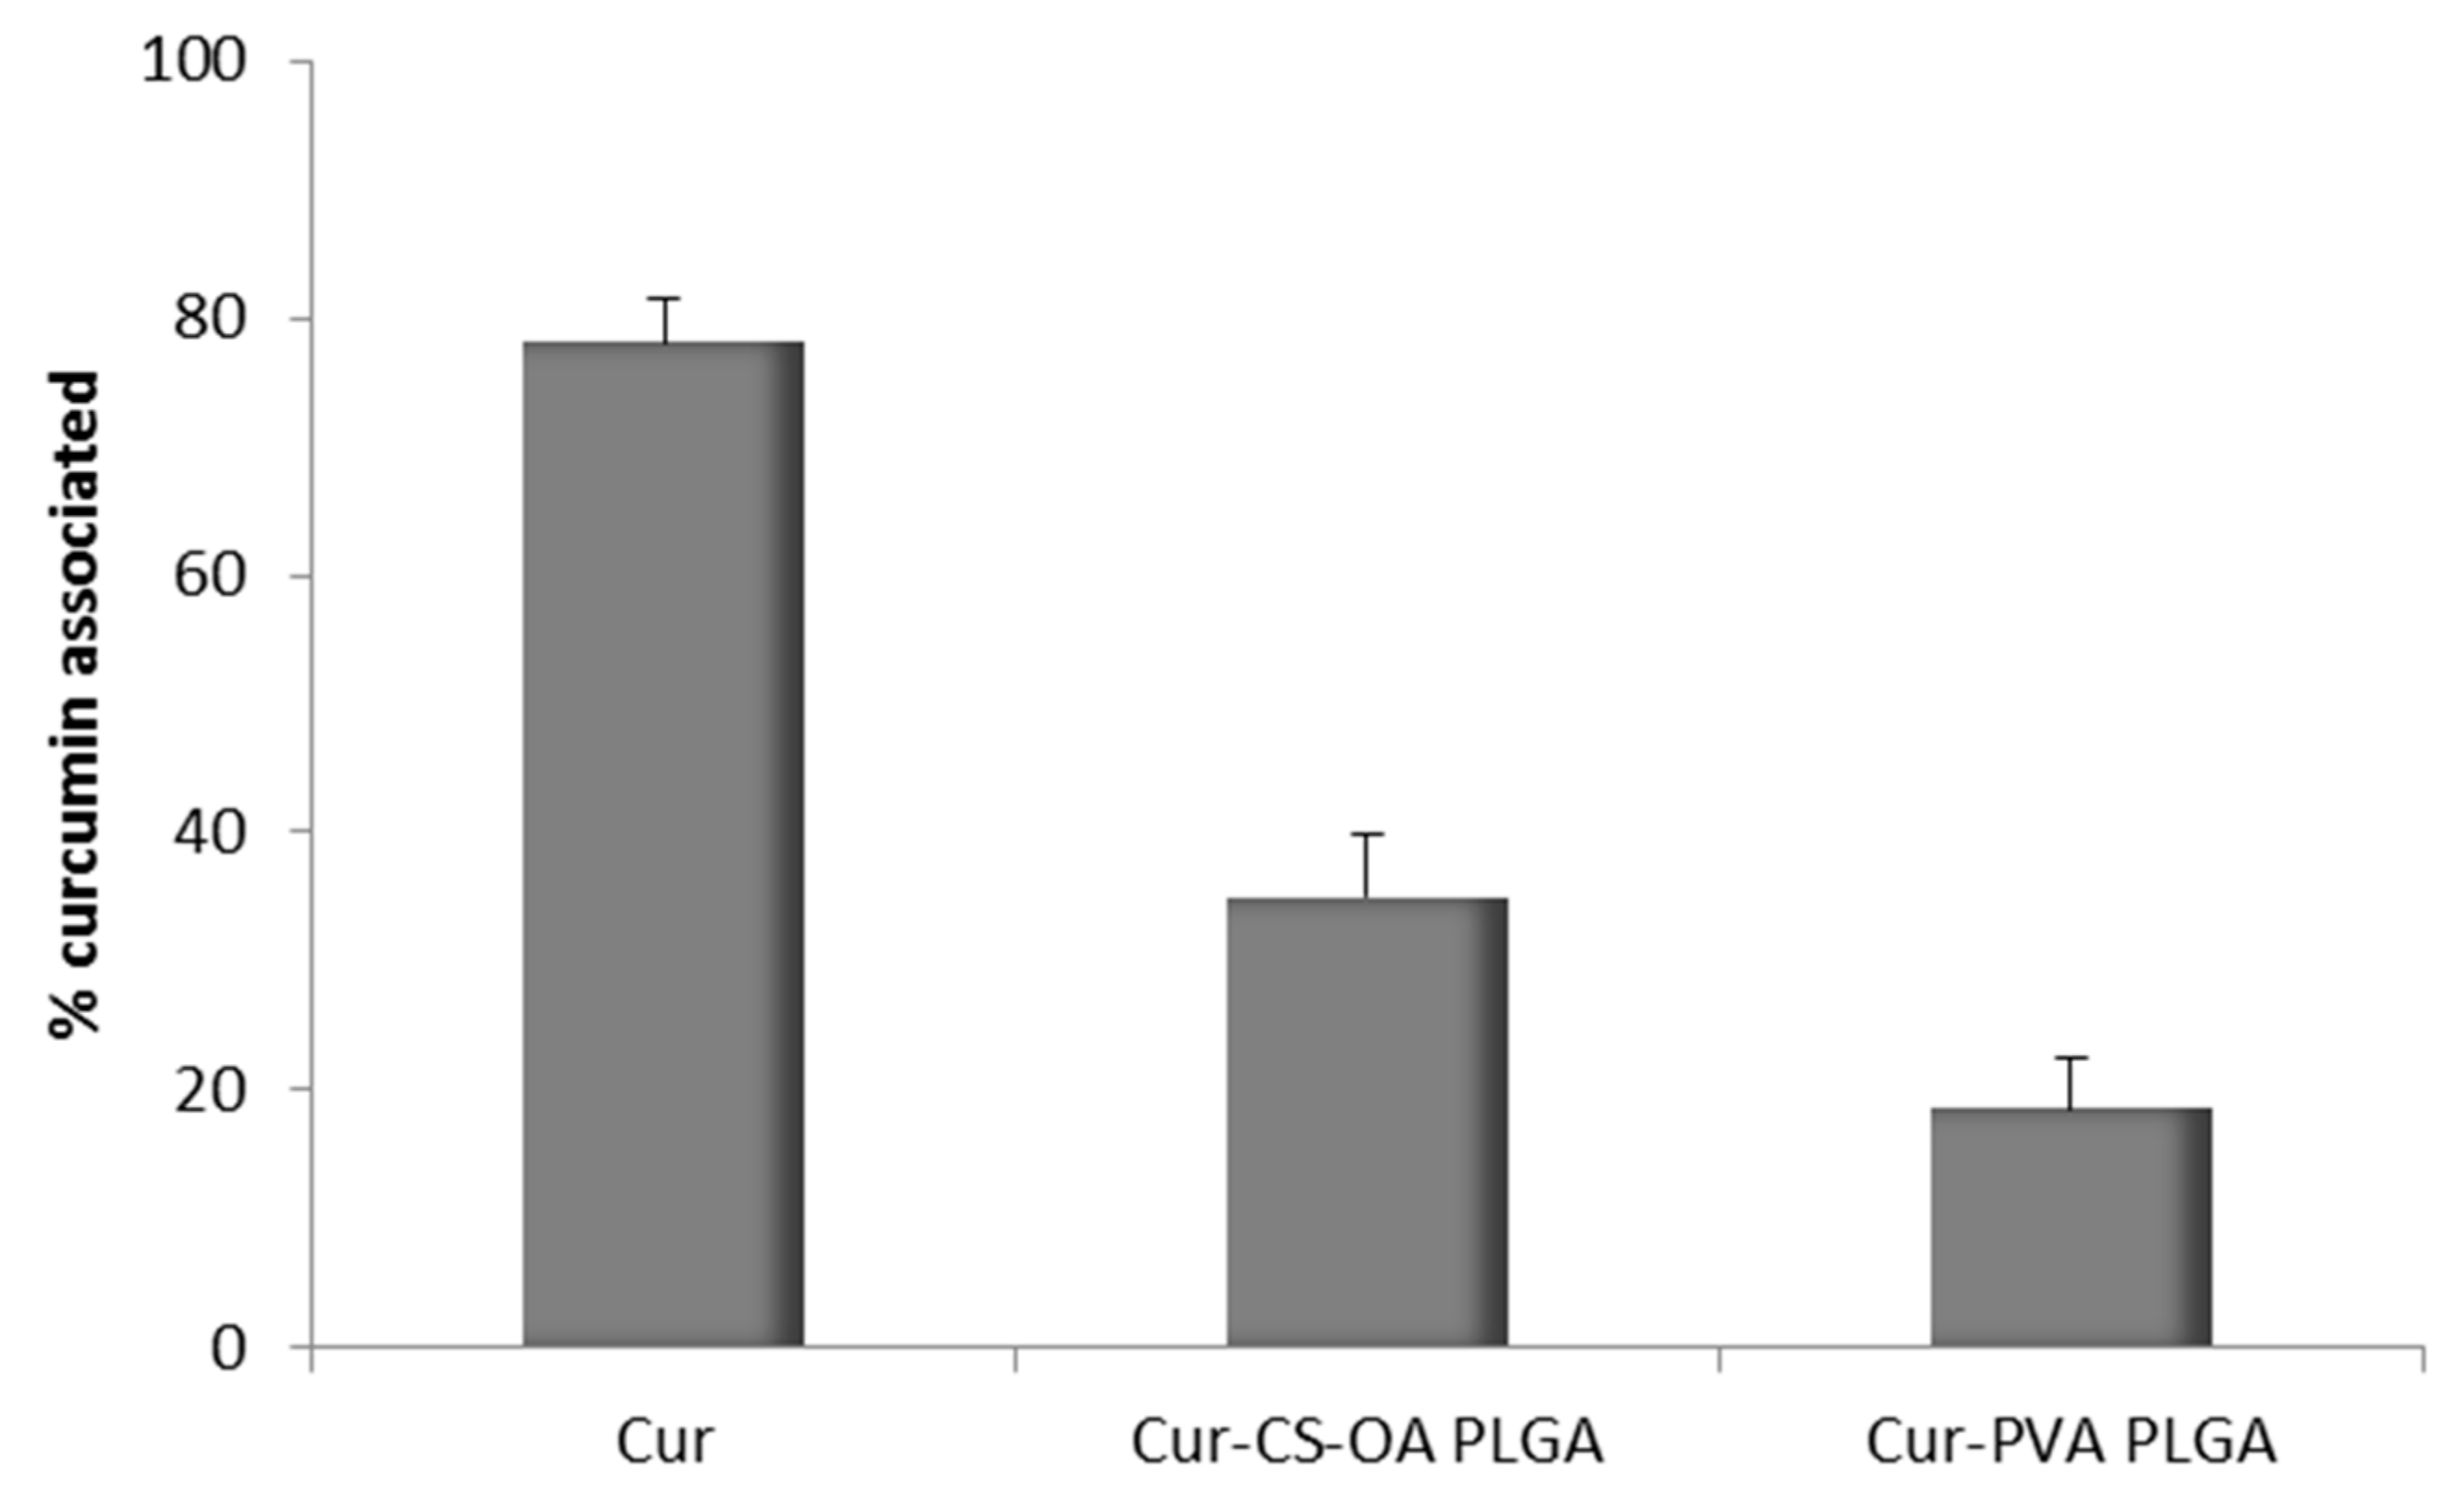
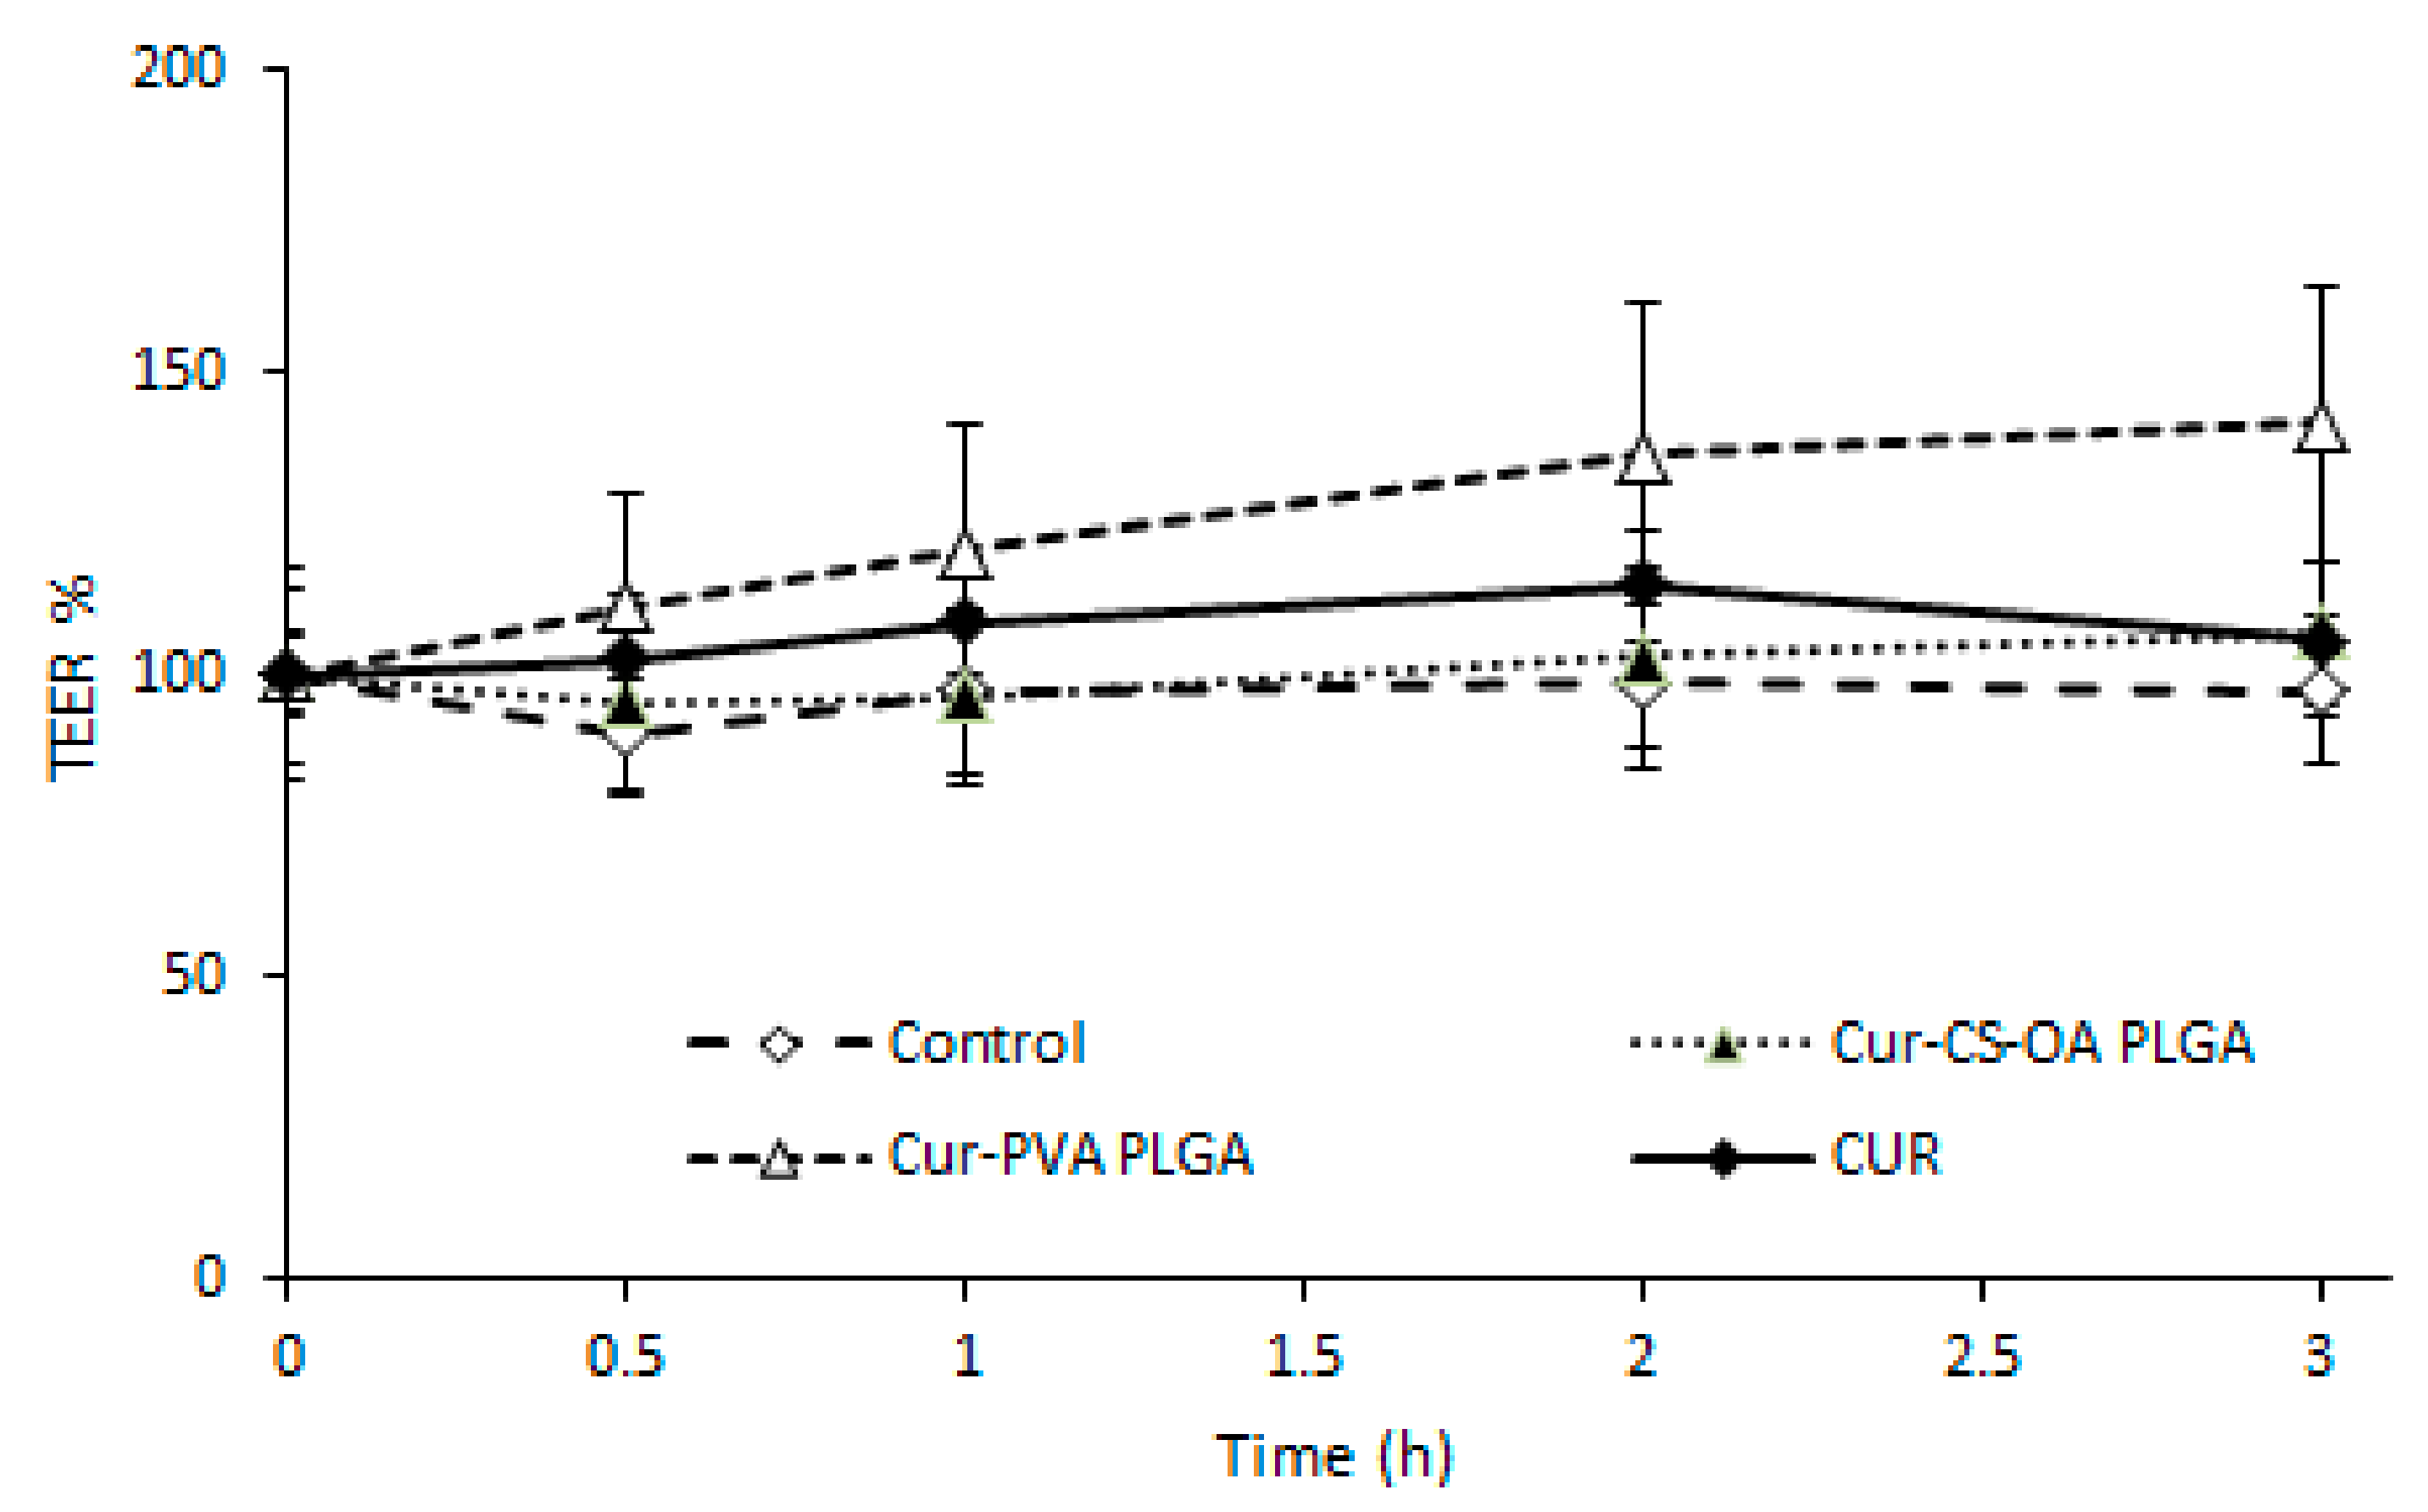
2.2.2. Curcumin Loaded NPs. Interaction with Caco-2 Cell Lines
3. Materials and Methods
3.1. Materials
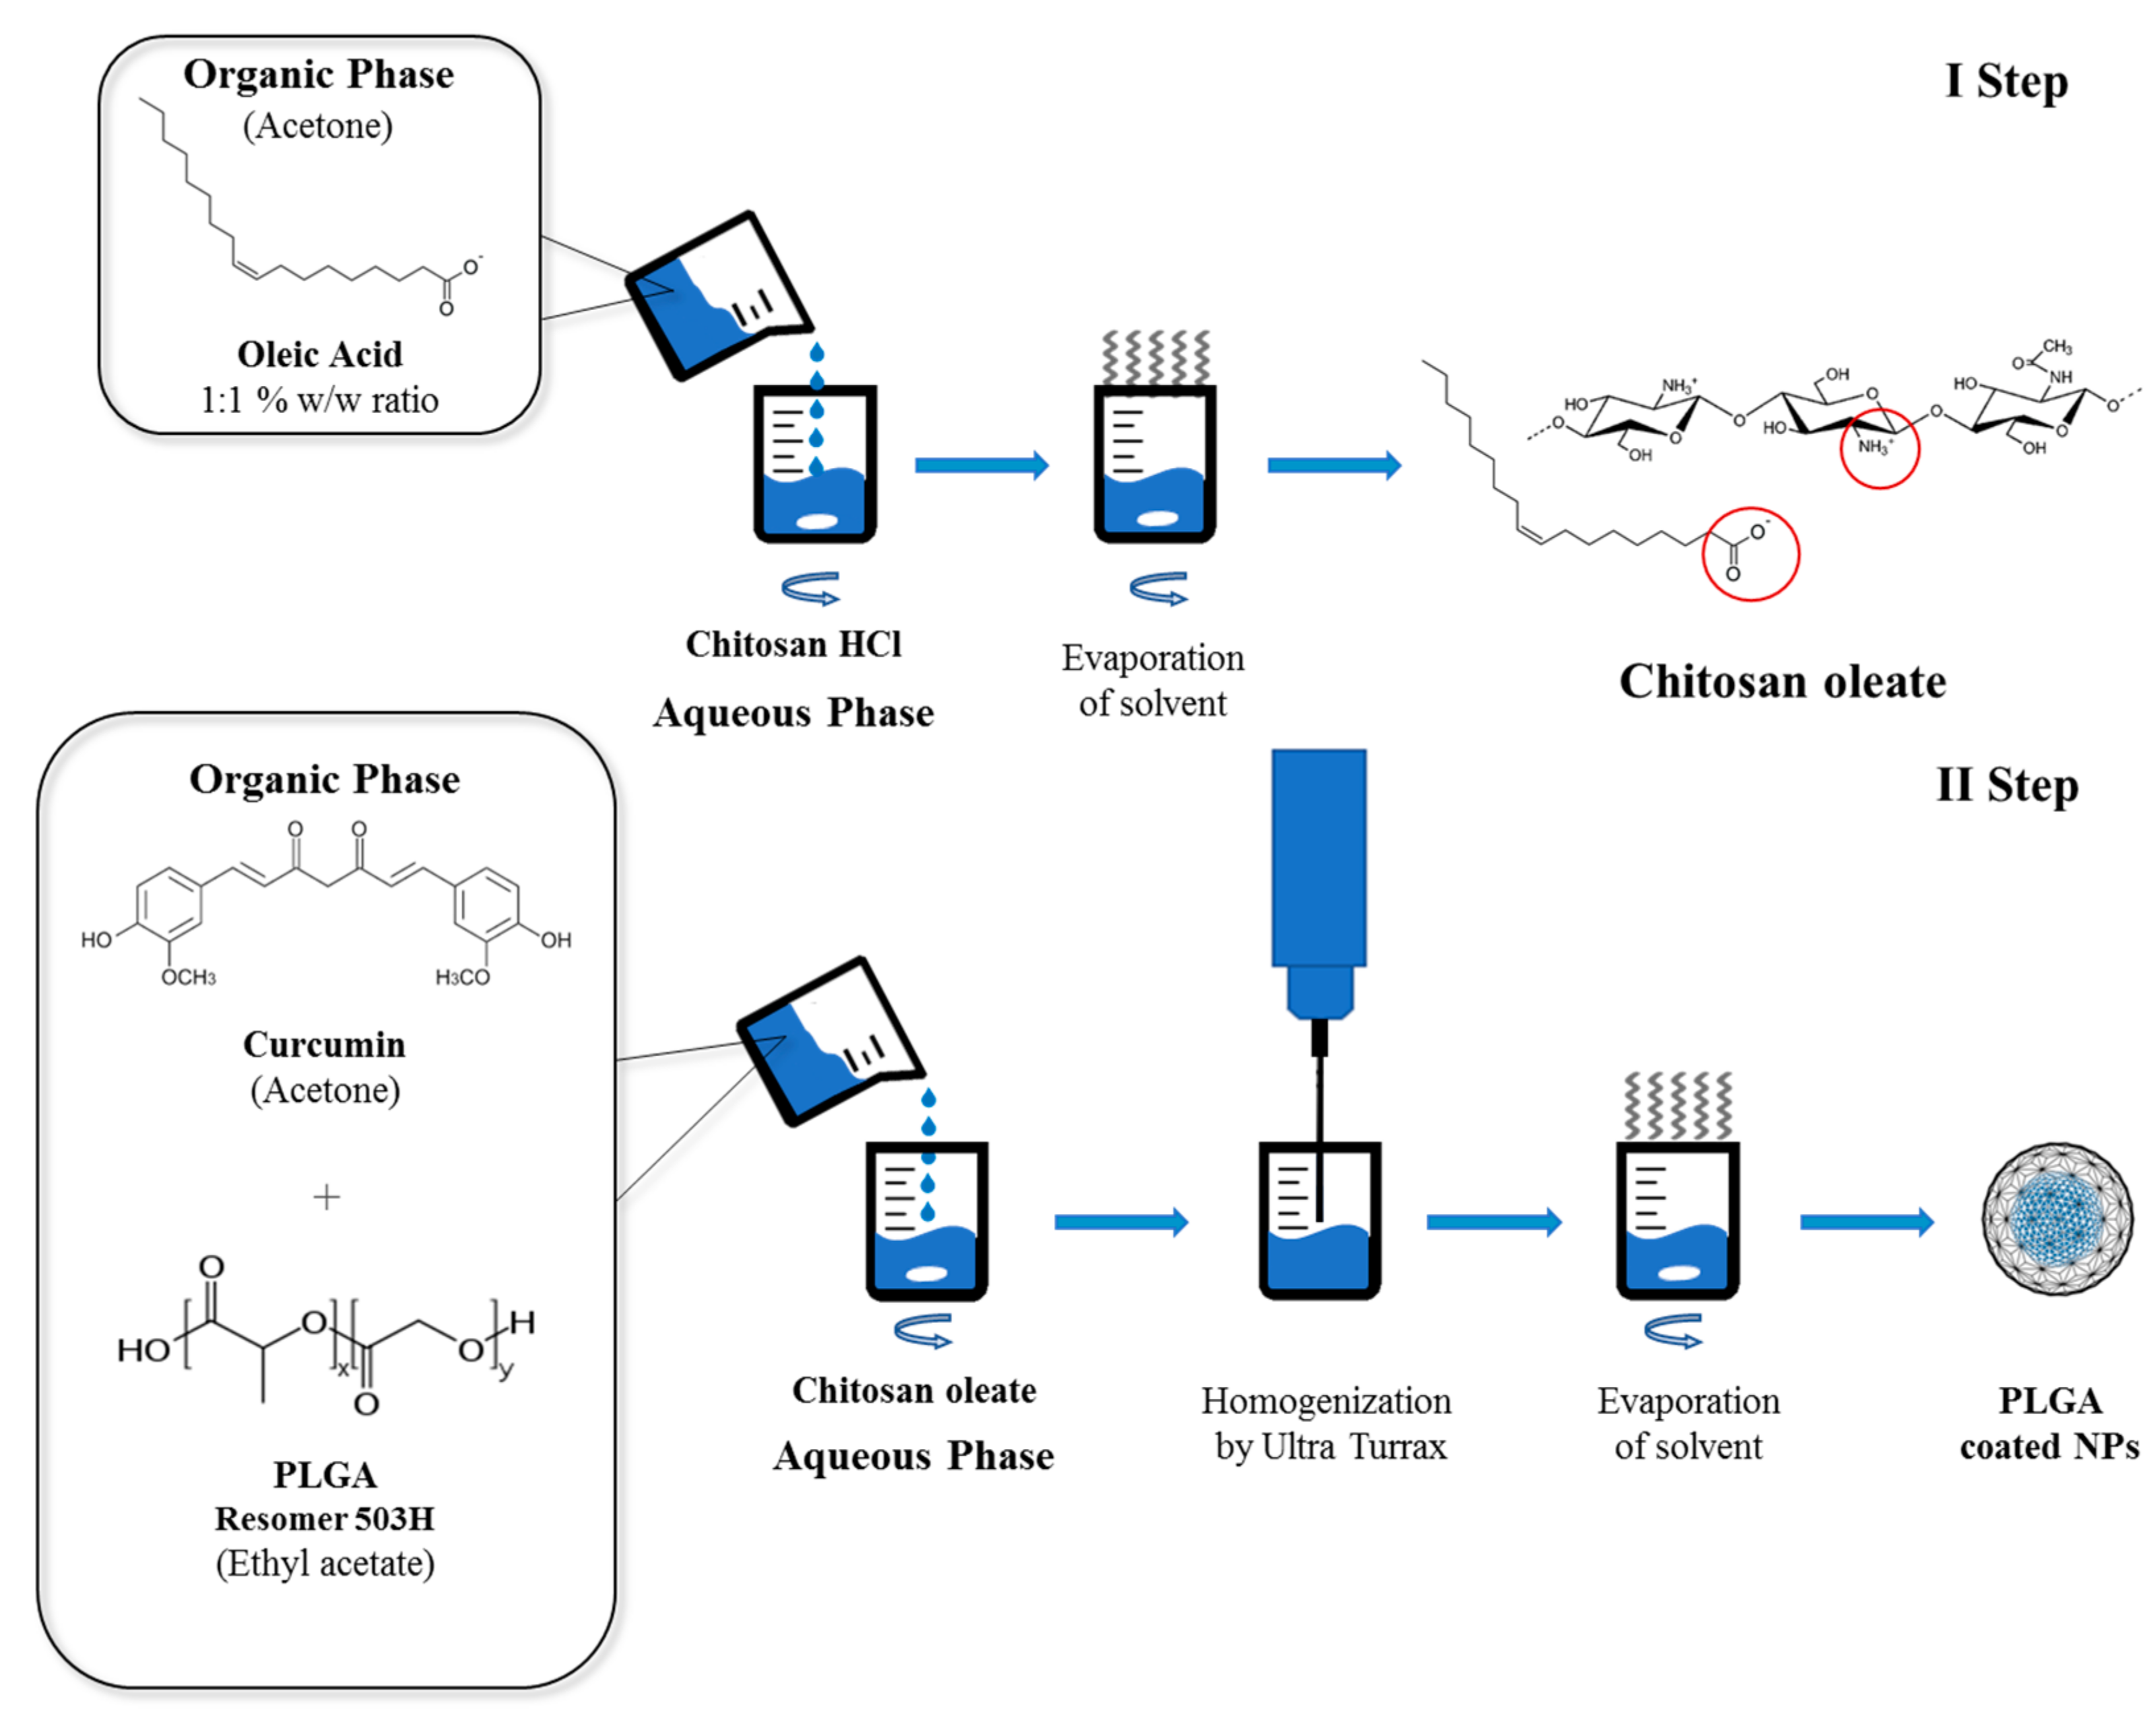
3.2. Preparation of the Chitosan Coated NPs
3.3. Dimensional and Zeta Potential Characterization of Dispersed Phase
3.4. Nile Red Loaded NPs
Nile Red Encapsulation Efficiency (EE%) Evaluation
3.5. Preparation of Curcumin Loaded NPs
Curcumin Quantification and EE% Evaluation
3.6. Mucoadhesion Evaluation
3.7. Caco-2 Biocompatibility Test
3.8. Cell Uptake Studies
3.9. Statistical Analysis
4. Conclusions
Author Contributions
Funding
Conflicts of Interest
References
- Danhier, F.; Ansorena, E.; Silva, J.M.; Coco, R.; Le Breton, A.; Preat, V. PLGA-based nanoparticles: An overview of biomedical applications. J. Control. Release 2012, 161, 505–522. [Google Scholar] [CrossRef] [PubMed]
- Mir, M.; Ahmed, N.; Rehman, A.U. Recent applications of PLGA based nanostructures in drug delivery. Colloids Surf. B Biointerfaces 2017, 159, 217–231. [Google Scholar] [CrossRef] [PubMed]
- Astete, C.E.; Sabliov, C.M. Synthesis and characterization of PLGA nanoparticles. J. Biomater. Sci. Polym. Ed. 2006, 17, 247–289. [Google Scholar] [CrossRef] [PubMed]
- Vandervoort, J.; Ludwig, A. Biocompatible stabilizers in the preparation of PLGA nanoparticles: A factorial design study. Int. J. Pharm. 2002, 238, 77–92. [Google Scholar] [CrossRef]
- Tahara, K.; Sakai, T.; Yamamoto, H.; Takeuchi, H.; Hirashima, N.; Kawashima, Y. Improved cellular uptake of chitosan-modified PLGA nanospheres by A549 cells. Int. J. Pharm. 2009, 382, 198–204. [Google Scholar] [CrossRef] [PubMed]
- Alqahtani, S.; Simon, L.; Astete, C.E.; Alayoubi, A.; Sylvester, P.W.; Nazzal, S.; Shen, Y.; Xu, Z.; Kaddoumi, A.; Sabliov, C.M. Cellular uptake, antioxidant and antiproliferative activity of entrapped a-tocopherol and c-tocotrienol in poly(lactic-co-glycolic) acid (PLGA) and chitosan covered PLGA nanoparticles (PLGA-Chi). J. Colloid Interface Sci. 2015, 445, 243–251. [Google Scholar] [CrossRef] [PubMed]
- He, C.; Hua, Y.; Yin, L.; Tang, C.; Yin, C. Effects of particle size and surface charge on cellular uptake and biodistribution of polymeric nanoparticles. Biomaterials 2010, 31, 3657–3666. [Google Scholar] [CrossRef] [PubMed]
- Yameen, B.; Choi, W.I.; Vilos, C.; Swami, A.; Shi, J.; Farokhzad, O.C. Insight into nanoparticle cellular uptake and intracellular targeting. J. Control. Release 2014, 190, 485–499. [Google Scholar] [CrossRef] [PubMed] [Green Version]
- Martínez-Pérez, B.; Quintanar-Guerrero, D.; Tapia-Tapia, M.; Cisneros-Tamayo, R.; Zambrano-Zaragoza, M.L.; Alcalá-Alcalá, S.; Mendoza-Muñoz, N.; Piñón-Segundo, E. Controlled-release biodegradable nanoparticles: From preparation to vaginal applications. Eur. J. Pharm. Sci. 2018, 115, 185–195. [Google Scholar] [CrossRef] [PubMed]
- Pawar, D.; Mangal, S.; Goswami, R.; Jaganathan, K.S. Development and characterization of surface modified PLGA nanoparticles for nasal vaccine delivery: Effect of mucoadhesive coating on antigen uptake and immune adjuvant activity. Eur. J. Pharm. Biopharm. 2013, 85, 550–559. [Google Scholar] [CrossRef] [PubMed]
- Rose, F.; Wern, J.E.; Gavins, F.; Andersen, P.; Follmann, F.; Foged, C. A strong adjuvant based on glycol-chitosan-coated lipid-polymer hybrid nanoparticles potentiates mucosal immune responses against the recombinant Chlamydia trachomatis fusion antigen CTH522. J. Control. Release 2018, 271, 88–97. [Google Scholar] [CrossRef] [PubMed]
- Nafee, N.; Taetz, S.; Schneider, M.; Schaefer, U.F.; Lehr, C. Chitosan-coated PLGA nanoparticles for DNA/RNA delivery: effect of the formulation parameters on complexation and transfection of antisense oligonucleotides. Nanomedicine 2007, 3, 173–183. [Google Scholar] [CrossRef] [PubMed]
- Jagani, H.V.; Josyula, V.R.; Palanimuthu, V.R.; Hariharapura, R.C.; Gang, S.S. Improvement of therapeutic efficacy of PLGA nanoformulation of siRNA targeting anti-apoptotic Bcl-2 through chitosan coating. Eur. J. Pharm. Sci. 2013, 48, 611–618. [Google Scholar] [CrossRef] [PubMed]
- Kumar, R.M.N.V.; Bakowsky, U.; Lehr, C.M. Preparation and characterization of cationic PLGA as DNA carriers. Biomaterials 2004, 25, 1771–1777. [Google Scholar] [CrossRef]
- Badran, M.M.; Mady, M.M.; Ghannam, M.M.; Shakeel, F. Preparation and characterization of polymeric nanoparticles surface modified with chitosan for target treatment of colorectal cancer. Int. J. Biol. Macromol. 2017, 95, 643–649. [Google Scholar] [CrossRef] [PubMed]
- Kang, B.S.; Choi, J.S.; Lee, S.E.; Lee, J.K.; Kim, T.H.; Jang, W.S.; Tunsirikongkon, A.; Kim, J.K.; Park, J.S. Enhancing the in vitro anticancer activity of albendazole incorporated into chitosan-coated PLGA nanoparticles. Carbohydr. Polym. 2017, 159, 39–47. [Google Scholar] [CrossRef] [PubMed]
- Tadros, T. Polymeric surfactants in disperse systems. Adv. Colloid Interface Sci. 2009, 147–148, 281–299. [Google Scholar] [CrossRef] [PubMed]
- Bonferoni, M.C.; Sandri, G.; Dellera, E.; Rossi, S.; Ferrari, F.; Mori, M.; Caramella, C. Ionic polymeric micelles based on chitosan and fatty acids and intended for wound healing. Comparison of linoleic and oleic acid. Eur. J. Pharm. Biopharm. 2014, 87, 101–106. [Google Scholar] [CrossRef] [PubMed]
- Bonferoni, M.C.; Sandri, G.; Rossi, S.; Usai, D.; Liakos, I.; Garzoni, A.; Fiamma, M.; Zanetti, S.; Athanassiou, A.; Caramella, C.; et al. A novel ionic amphiphilic chitosan derivative as a stabilizer of nanoemulsions: Improvement of antimicrobial activity of Cymbopogon citratus essential oil. Colloids Surf. B Biointerfaces 2017, 152, 385–392. [Google Scholar] [CrossRef] [PubMed]
- Liu, X.F.; Guan, Y.L.; Yang, D.Z.; Li, Z.; Yao, K.D. Antibacterial action of chitosan and carboxymethylated chitosan. J. Appl. Polym. Sci. 2001, 79, 1324–1335. [Google Scholar]
- Zheng, C.J.; Yoo, J.S.; Lee, T.G.; Cho, H.Y.; Kim, Y.H.; Kim, W.G. Fatty acid synthesis a target for antibacterial activity of unsaturated fatty acids. FEBS Lett. 2005, 579, 5157–5162. [Google Scholar] [CrossRef] [PubMed]
- Bonferoni, M.C.; Riva, F.; Invernizzi, A.; Dellera, E.; Sandri, G.; Rossi, S.; Marrubini, G.; Bruni, G.; Vigani, B.; Caramella, C.; et al. Alpha tocopherol loaded chitosan oleate nanoemulsions for wound healing. Evaluation on cell lines and ex vivo human biopsies, and stabilization in spray dried Trojan microparticles. Eur. J. Pharm. Biopharm. 2018, 123, 31–41. [Google Scholar] [CrossRef] [PubMed]
- Bonferoni, M.C.; Sandri, G.; Rossi, S.; Dellera, E.; Invernizzi, A.; Boselli, C.; Icaro Cornaglia, A.; Del Fante, C.; Perotti, C.; Vigani, B.; et al. Association of Alpha Tocopherol and Ag Sulfadiazine Chitosan Oleate Nanocarriers in Bioactive Dressings Supporting Platelet Lysate Application to Skin Wounds. Mar. Drugs 2018, 16, 56. [Google Scholar] [CrossRef] [PubMed]
- Pramod, K.; Tahir, M.A.; Charoo, N.A.; Ansari, S.H.; Ali, J. Pharmaceutical product development: A quality by design approach. Int. J. Pharm. Investig. 2016, 6, 129–138. [Google Scholar] [CrossRef] [PubMed]
- Bonferoni, M.C.; Rossi, S.; Ferrari, F.; Stavik, E.; Pena-Romero, A.; Caramella, C. Factorial analysis of the influence of dissolution medium on drug release from carrageenan-diltiazem complexes. AAPS PharmSciTech 2000, 1, e15. [Google Scholar] [PubMed]
- Anand, P.; Nair, H.B.; Sung, B.; Kunnumakkara, A.B.; Yadav, V.R.; Tekmal, R.R.; Aggarwal, B.B. Design of curcumin-loaded PLGA nanoparticles formulation with enhanced cellular uptake, and increased bioactivity in vitro and superior bioavailability in vivo. Biochem. Pharmacol. 2010, 79, 330–338. [Google Scholar] [CrossRef] [PubMed]
- Beloqui, A.; Coco, R.; Memvanga, P.B.; Ucakar, B.; des Rieux, A.; Preat, V. pH-sensitive nanoparticles for colonic delivery of curcumin in inflammatory bowel disease. Int. J. Pharm. 2014, 473, 203–212. [Google Scholar] [CrossRef] [PubMed]
- Chuah, L.H.; Roberts, C.J.; Billa, N.; Abdullah, S.; Rosli, R. Cellular uptake and anticancer effects of mucoadhesive curcumin-containing chitosan nanoparticles. Colloids Surf. B Biointerfaces 2014, 116, 228–236. [Google Scholar] [CrossRef] [PubMed]
- Bouchemal, K.; Briancon, S.; Perrier, E.; Fessi, H. Nanoemulsion formulation using spontaneous emulsification: Solvent, oil and surfactant optimization. Int. J. Pharm. 2004, 280, 241–251. [Google Scholar] [CrossRef] [PubMed]
- Kaminaga, Y.; Nagatsu, A.; Akiyama, T.; Sugimoto, N.; Yamazaki, T.; Maitani, T.; Mizukami, H. Production of unnatural glucosides of curcumin with drastically enhanced water solubility by cell suspension cultures of Catharanthus roseus. FEBS Lett. 2003, 555, 311–316. [Google Scholar] [CrossRef] [Green Version]
- He, P.; Davis, S.S.; Illum, L. In vitro evaluation of the mucoadhesive properties of chitosan microspheres. Int. J. Pharm. 1998, 166, 75–88. [Google Scholar] [CrossRef]
- Bonferoni, M.C.; Sandri, G.; Ferrari, F.; Rossi, S.; Larghi, V.; Zambito, Y.; Caramella, C. Comparison of different in vitro and ex vivo methods to evaluate mucoadhesion of glycol-palmitoyl chitosan micelles. J. Drug Deliery Sci. Technol. 2010, 20, 419–424. [Google Scholar] [CrossRef]
- Yallapu, M.M.; Gupta, B.K.; Jaggi, M.; Chauhan, S.C. Fabrication of curcumin encapsulated PLGA nanoparticles for improved therapeutic effects in metastatic cancer cells. J. Colloid Interface Sci. 2010, 351, 19–29. [Google Scholar] [CrossRef] [PubMed]
- Mohanty, C.; Sahoo, S.K. The in vitro stability and in vivo pharmacokinetics of curcumin prepared as an aqueous nanoparticulate formulation. Biomaterials 2010, 31, 6597–6611. [Google Scholar] [CrossRef] [PubMed]
- Nafee, N.; Schneider, M.; Schaefer, U.F.; Lehr, C.M. Relevance of the colloidal stability of chitosan/PLGA nanoparticles on their cytotoxicity profile. Int. J. Pharm. 2009, 381, 130–139. [Google Scholar] [CrossRef] [PubMed]
- Bonferoni, M.C.; Sandri, G.; Dellera, E.; Rossi, S.; Ferrari, F.; Zambito, Y.; Caramella, C. Palmitoyl Glycol Chitosan Micelles for Corneal Delivery of Cyclosporine. J. Biomed. Nanotechnol. 2016, 12, 231–240. [Google Scholar] [CrossRef] [PubMed]
- Mukerjee, A.; Vishwanatha, J.K. Formulation, characterization and evaluation of curcumin-loaded PLGA nanospheres for cancer therapy. Anticancer Res. 2009, 29, 3867–3875. [Google Scholar] [PubMed]
- Stockert, J.C.; Horobin, R.W.; Colombo, L.L.; Blazquez-Castro, A. Tetrazolium salts and formazan products in Cell Biology: Viability assessment, fluorescence imaging, and labeling perspectives. Acta Histochem. 2018, 120, 159–167. [Google Scholar] [CrossRef] [PubMed]


| Independent Variables (Factors) | Dependent Variables (Responses) | |||
|---|---|---|---|---|
| CS Conc (% w/v) | CS-OA Ratio | Stirring Rate (rpm) | Dimensions nm (±SD) | EE% (±SD) |
| −1 | −1 | −1 | 1829 (±303) | 70.83 (±1.31) |
| 1 | −1 | −1 | 610 (±47) | 80.92 (±0.06) |
| −1 | 1 | −1 | 627 (±16) | 85.42 (±1.72) |
| 1 | 1 | −1 | 591 (±26) | 89.58 (±0.09) |
| −1 | −1 | 1 | 1186 (±197) | 68.35 (±7.37) |
| 1 | −1 | 1 | 832 (±93) | 79.39 (±2.54) |
| −1 | 1 | 1 | 634 (±19) | 72.19 (±5.60) |
| 1 | 1 | 1 | 620 (±24) | 86.51 (±1.33) |
| 0 | 0 | 0 | 760 (±23) | 71.28 (±0.80) |
| 0 | 0 | 0 | 759 (±17) | 72.68 (±2.04) |
| 0 | 0 | 0 | 733 (±32) | 76.62 (±1.36) |
| Source | Sum of Squares | d.f. | Mean Square | F-Ratio | p-Value |
|---|---|---|---|---|---|
| A: CS concentration | 329,266 | 1 | 329,266 | 11.13 | 0.0290 |
| B: CS:OA ratio | 492,528 | 1 | 492,528 | 16.64 | 0.0151 |
| C: rpm | 18,528.1 | 1 | 185,28.1 | 0.63 | 0.4731 |
| AB | 289,941 | 1 | 289,941 | 9.80 | 0.0352 |
| AC | 98,346.1 | 1 | 98,346.1 | 3.32 | 0.1424 |
| BC | 26,106.1 | 1 | 26,106.1 | 0.88 | 0.4008 |
| Total error | 118,385 | 4 | 29,596.2 | ||
| Total (corr.) | 1.3731 × 10⁶ | 10 |
| Source | Sum of Squares | d.f. | Mean Square | F-Ratio | p-Value |
|---|---|---|---|---|---|
| A: CSconcentration | 195.991 | 1 | 195.991 | 10.24 | 0.0240 |
| B: CS-OA ratio | 146.308 | 1 | 146.308 | 7.64 | 0.0396 |
| C: stirring | 51.6612 | 1 | 51.6612 | 2.70 | 0.1614 |
| AC | 15.4429 | 1 | 15.4429 | 0.81 | 0.4103 |
| BC | 18.8691 | 1 | 18.8691 | 0.99 | 0.3664 |
| Total error | 95.7231 | 5 | 19.1446 | ||
| Total (corr.) | 523.996 | 10 |
| Dimensions (nm) | Poly Dispersion Index | Zeta Potential (mV) | EE (%) | Curcumin Concentration (µg/mL) | |
|---|---|---|---|---|---|
| CS-OA PLGA | 346 ± 88 | 0.32 ± 0.10 | 59.0 ± 2.34 | - | - |
| PVA PLGA | 310 ± 74 | 0.68 ± 0.15 | −26.33 ± 1.52 | - | - |
| Cur-CS-OA PLGA | 329 ± 42 | 0.501 ± 0.016 | 35.45 ± 3.35 | 68.75 ± 0.83 | 82.5 ± 0.99 |
| Cur-PVA PLGA | 274 ± 9 | 0.648 ± 0.083 | −0.09 ± 2.4 | 81.99 ± 1.58 | 98.1 ± 1.47 |
© 2018 by the authors. Licensee MDPI, Basel, Switzerland. This article is an open access article distributed under the terms and conditions of the Creative Commons Attribution (CC BY) license (http://creativecommons.org/licenses/by/4.0/).
Share and Cite
Miele, D.; Rossi, S.; Sandri, G.; Vigani, B.; Sorrenti, M.; Giunchedi, P.; Ferrari, F.; Bonferoni, M.C. Chitosan Oleate Salt as an Amphiphilic Polymer for the Surface Modification of Poly-Lactic-Glycolic Acid (PLGA) Nanoparticles. Preliminary Studies of Mucoadhesion and Cell Interaction Properties. Mar. Drugs 2018, 16, 447. https://0-doi-org.brum.beds.ac.uk/10.3390/md16110447
Miele D, Rossi S, Sandri G, Vigani B, Sorrenti M, Giunchedi P, Ferrari F, Bonferoni MC. Chitosan Oleate Salt as an Amphiphilic Polymer for the Surface Modification of Poly-Lactic-Glycolic Acid (PLGA) Nanoparticles. Preliminary Studies of Mucoadhesion and Cell Interaction Properties. Marine Drugs. 2018; 16(11):447. https://0-doi-org.brum.beds.ac.uk/10.3390/md16110447
Chicago/Turabian StyleMiele, Dalila, Silvia Rossi, Giuseppina Sandri, Barbara Vigani, Milena Sorrenti, Paolo Giunchedi, Franca Ferrari, and Maria Cristina Bonferoni. 2018. "Chitosan Oleate Salt as an Amphiphilic Polymer for the Surface Modification of Poly-Lactic-Glycolic Acid (PLGA) Nanoparticles. Preliminary Studies of Mucoadhesion and Cell Interaction Properties" Marine Drugs 16, no. 11: 447. https://0-doi-org.brum.beds.ac.uk/10.3390/md16110447