
Complete Lipooligosaccharide Structure from Pseudoalteromonas nigrifaciens Sq02-Rifr and Study of Its Immunomodulatory Activity

 , , , , and
Abstract
:1. Introduction
2. Results
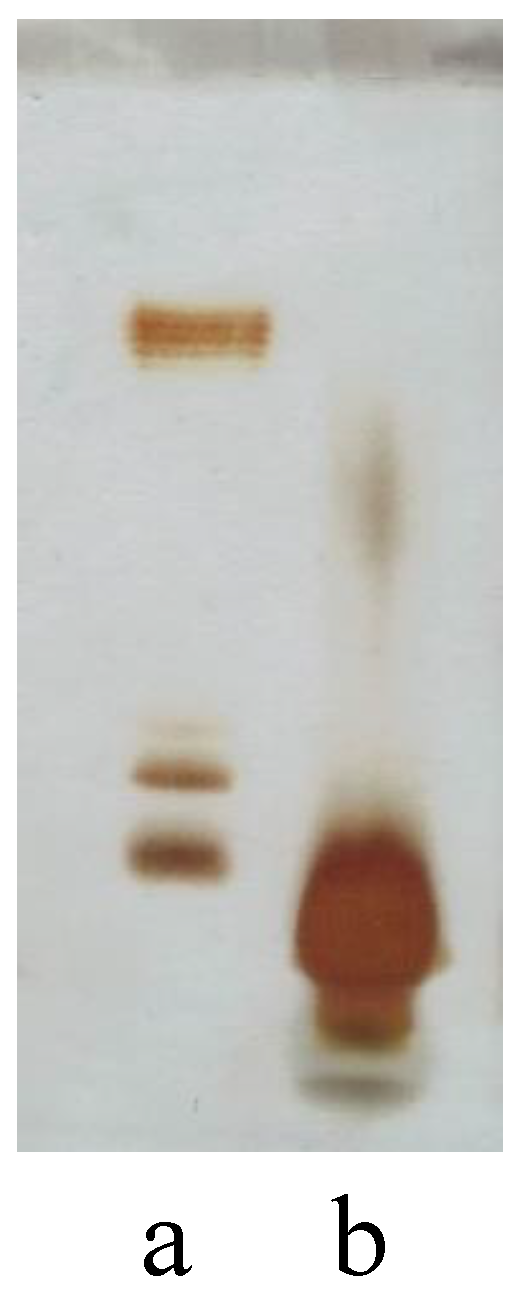
2.1. LPS Extraction
2.2. LOS Chemical Analysis
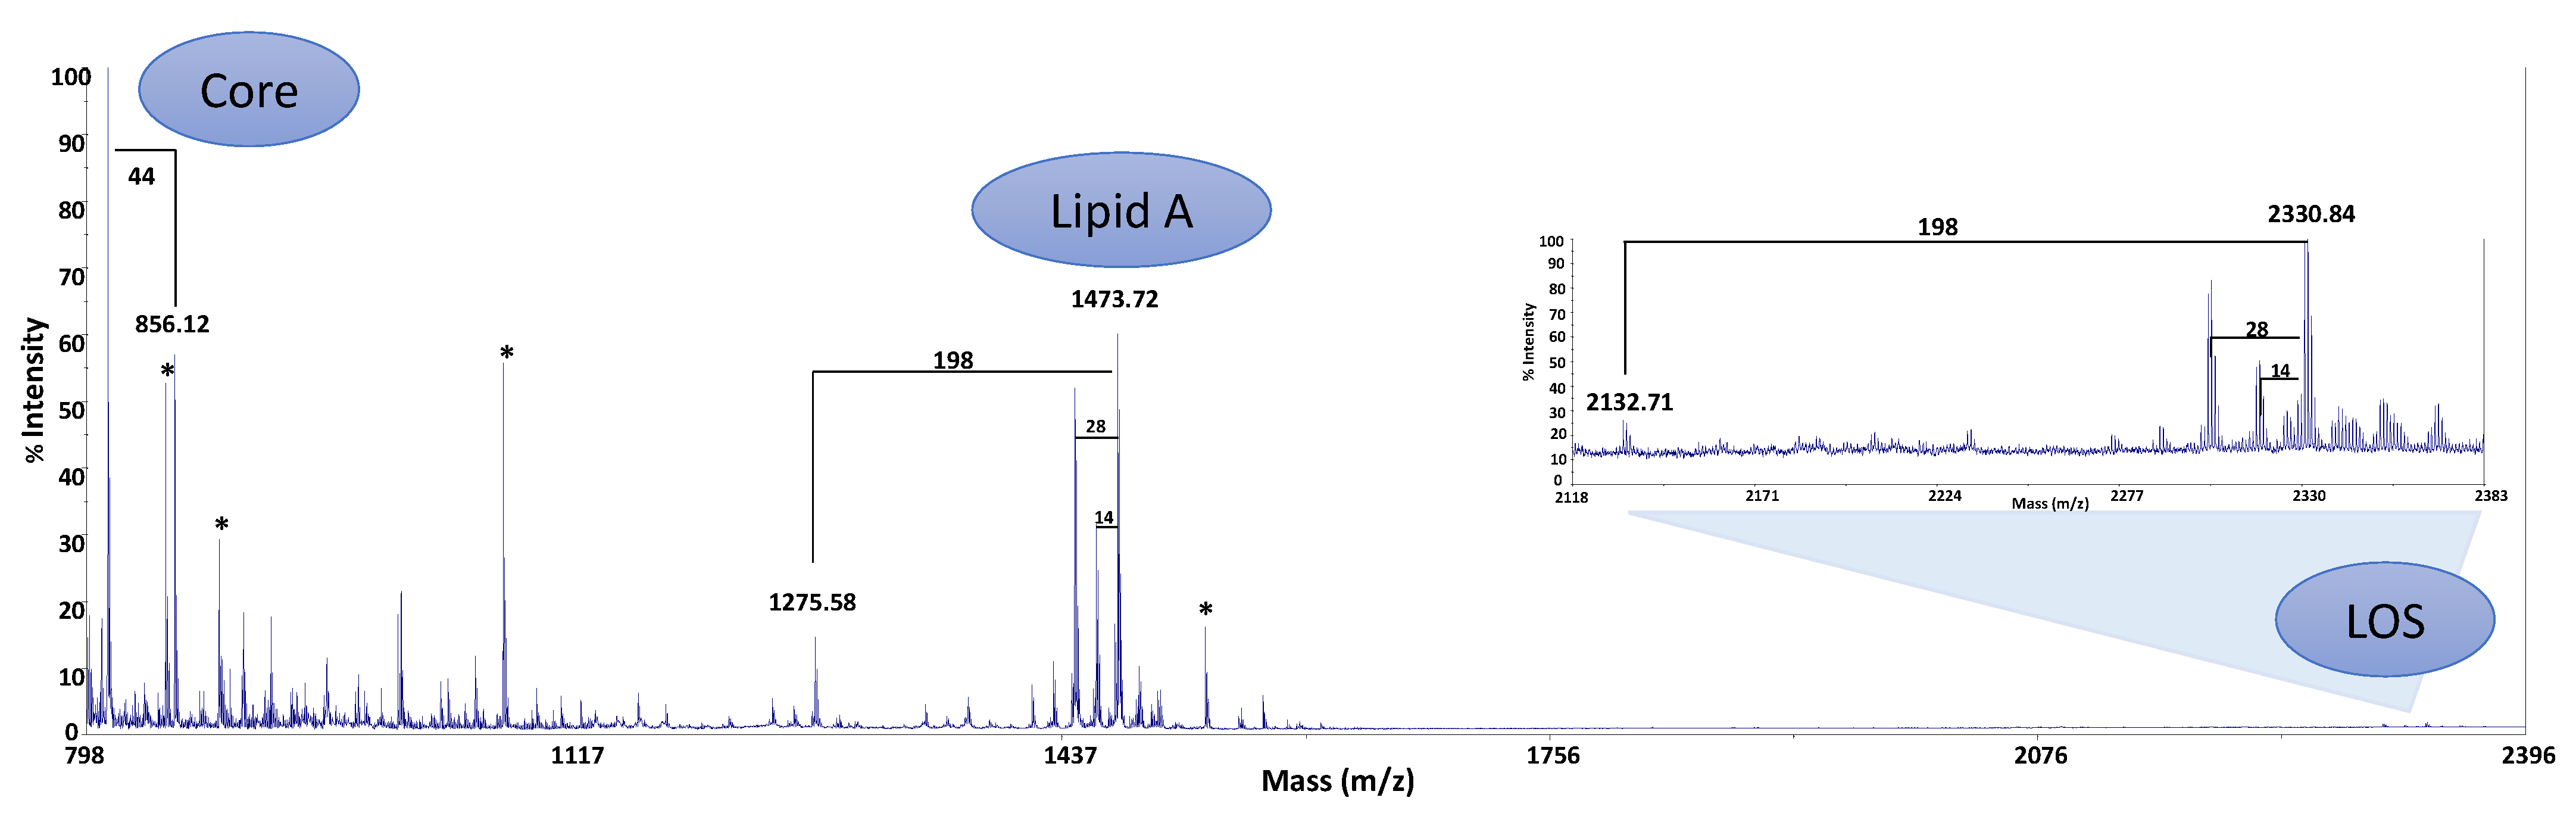
2.3. MALDI-TOF Analysis
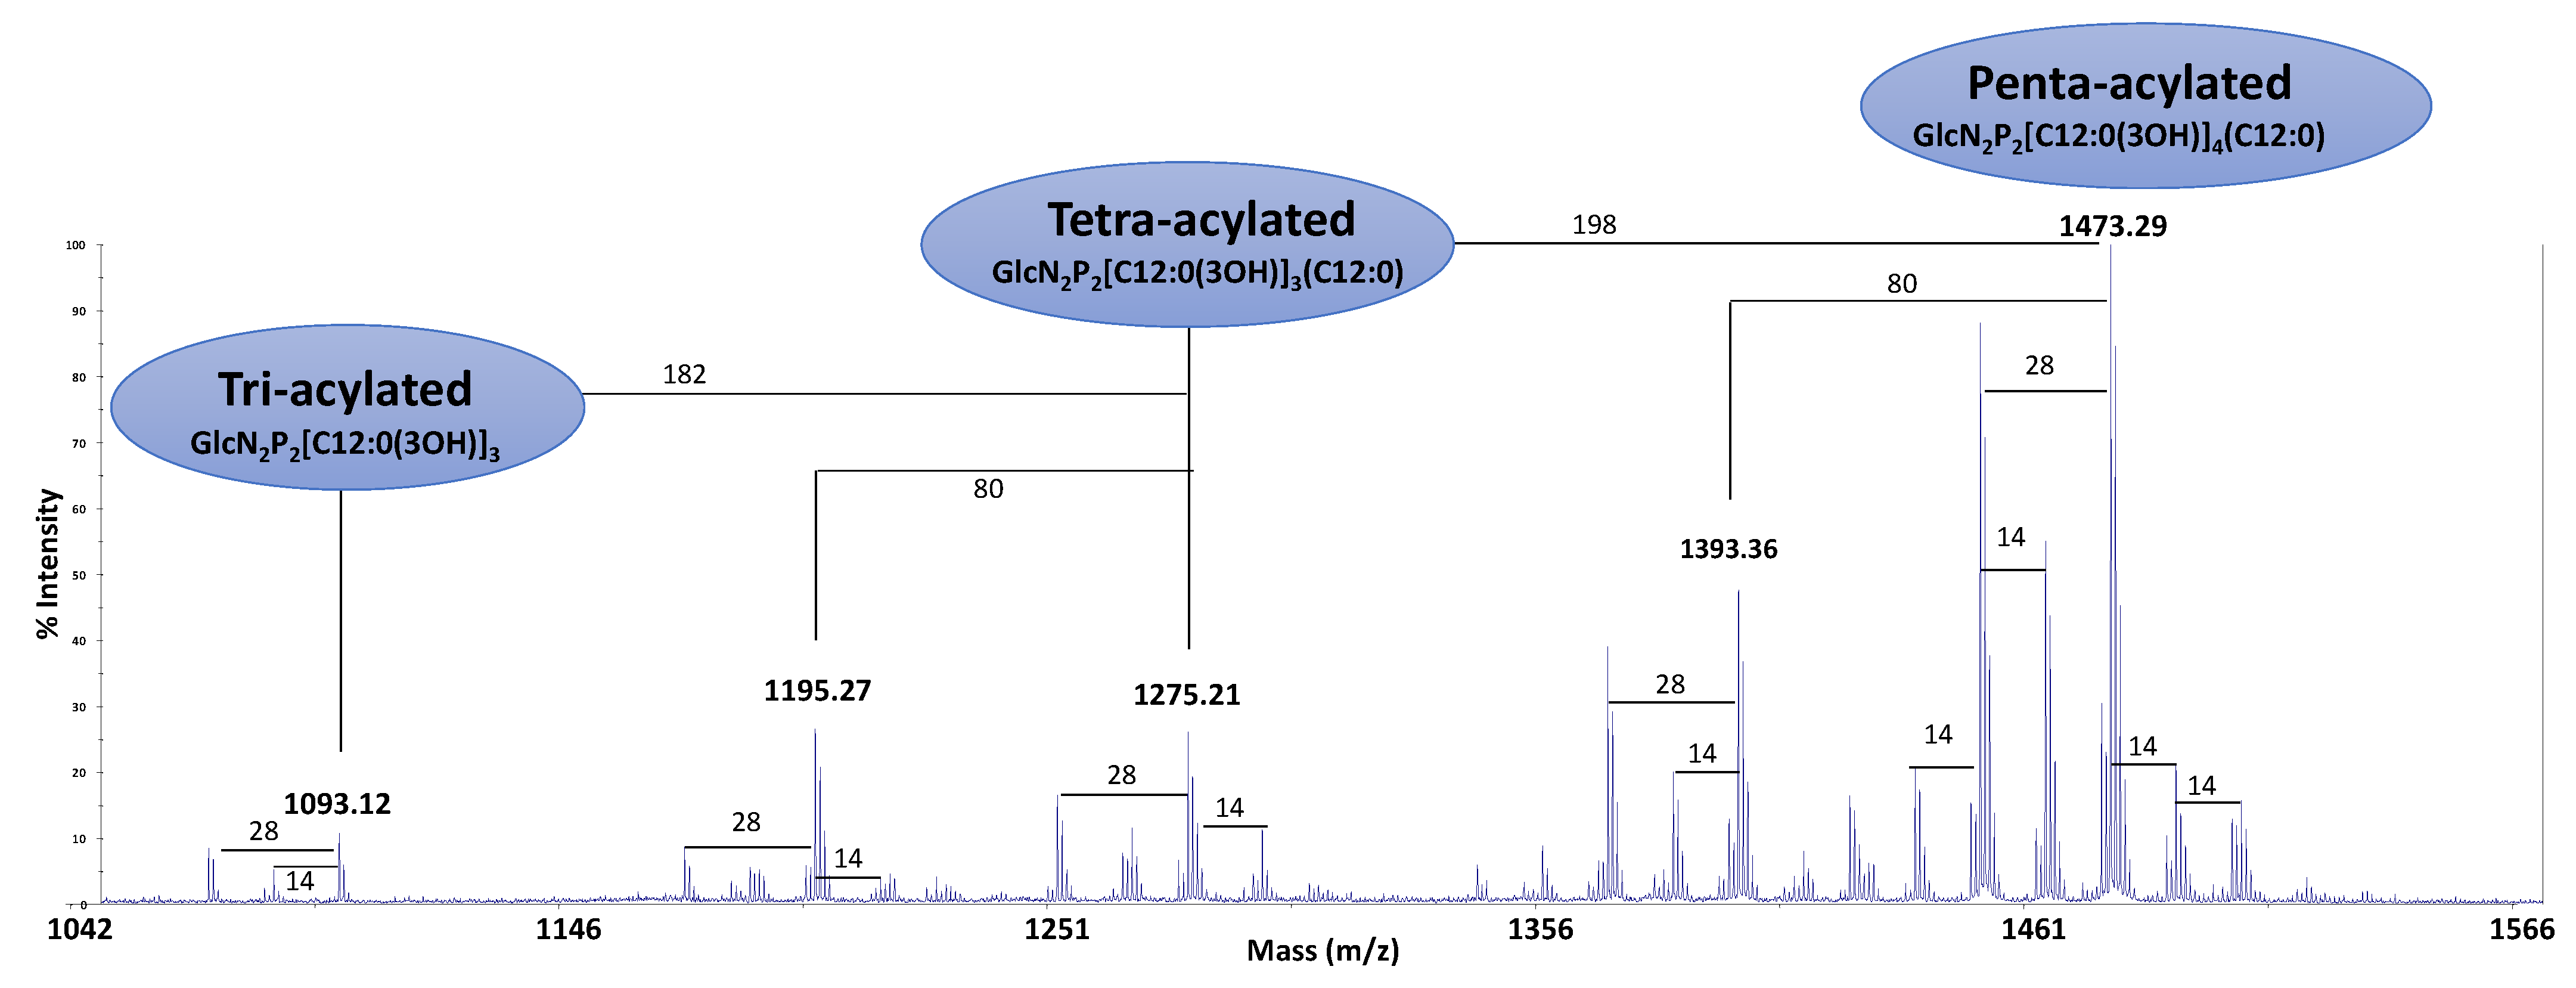
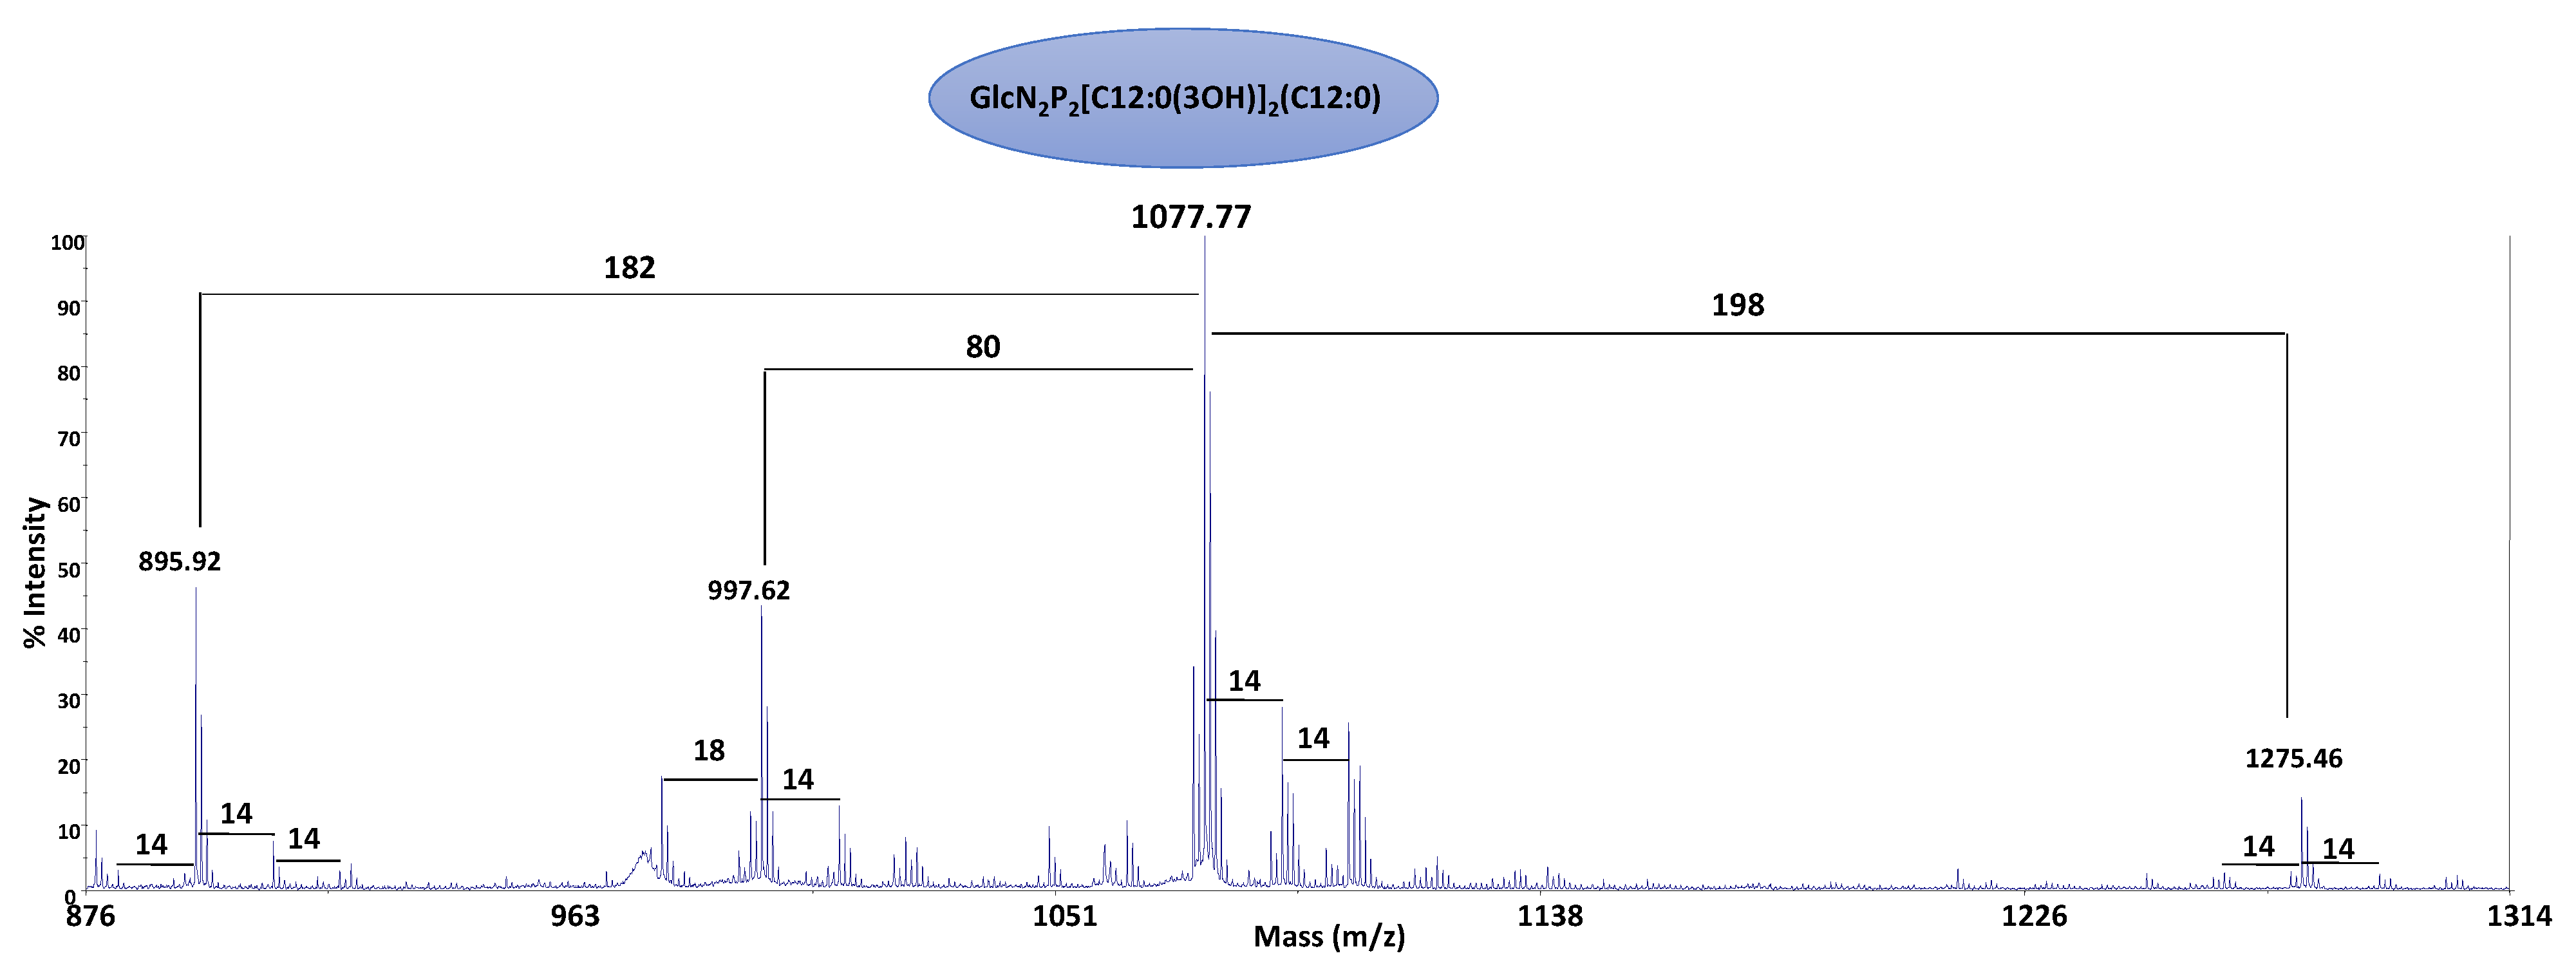
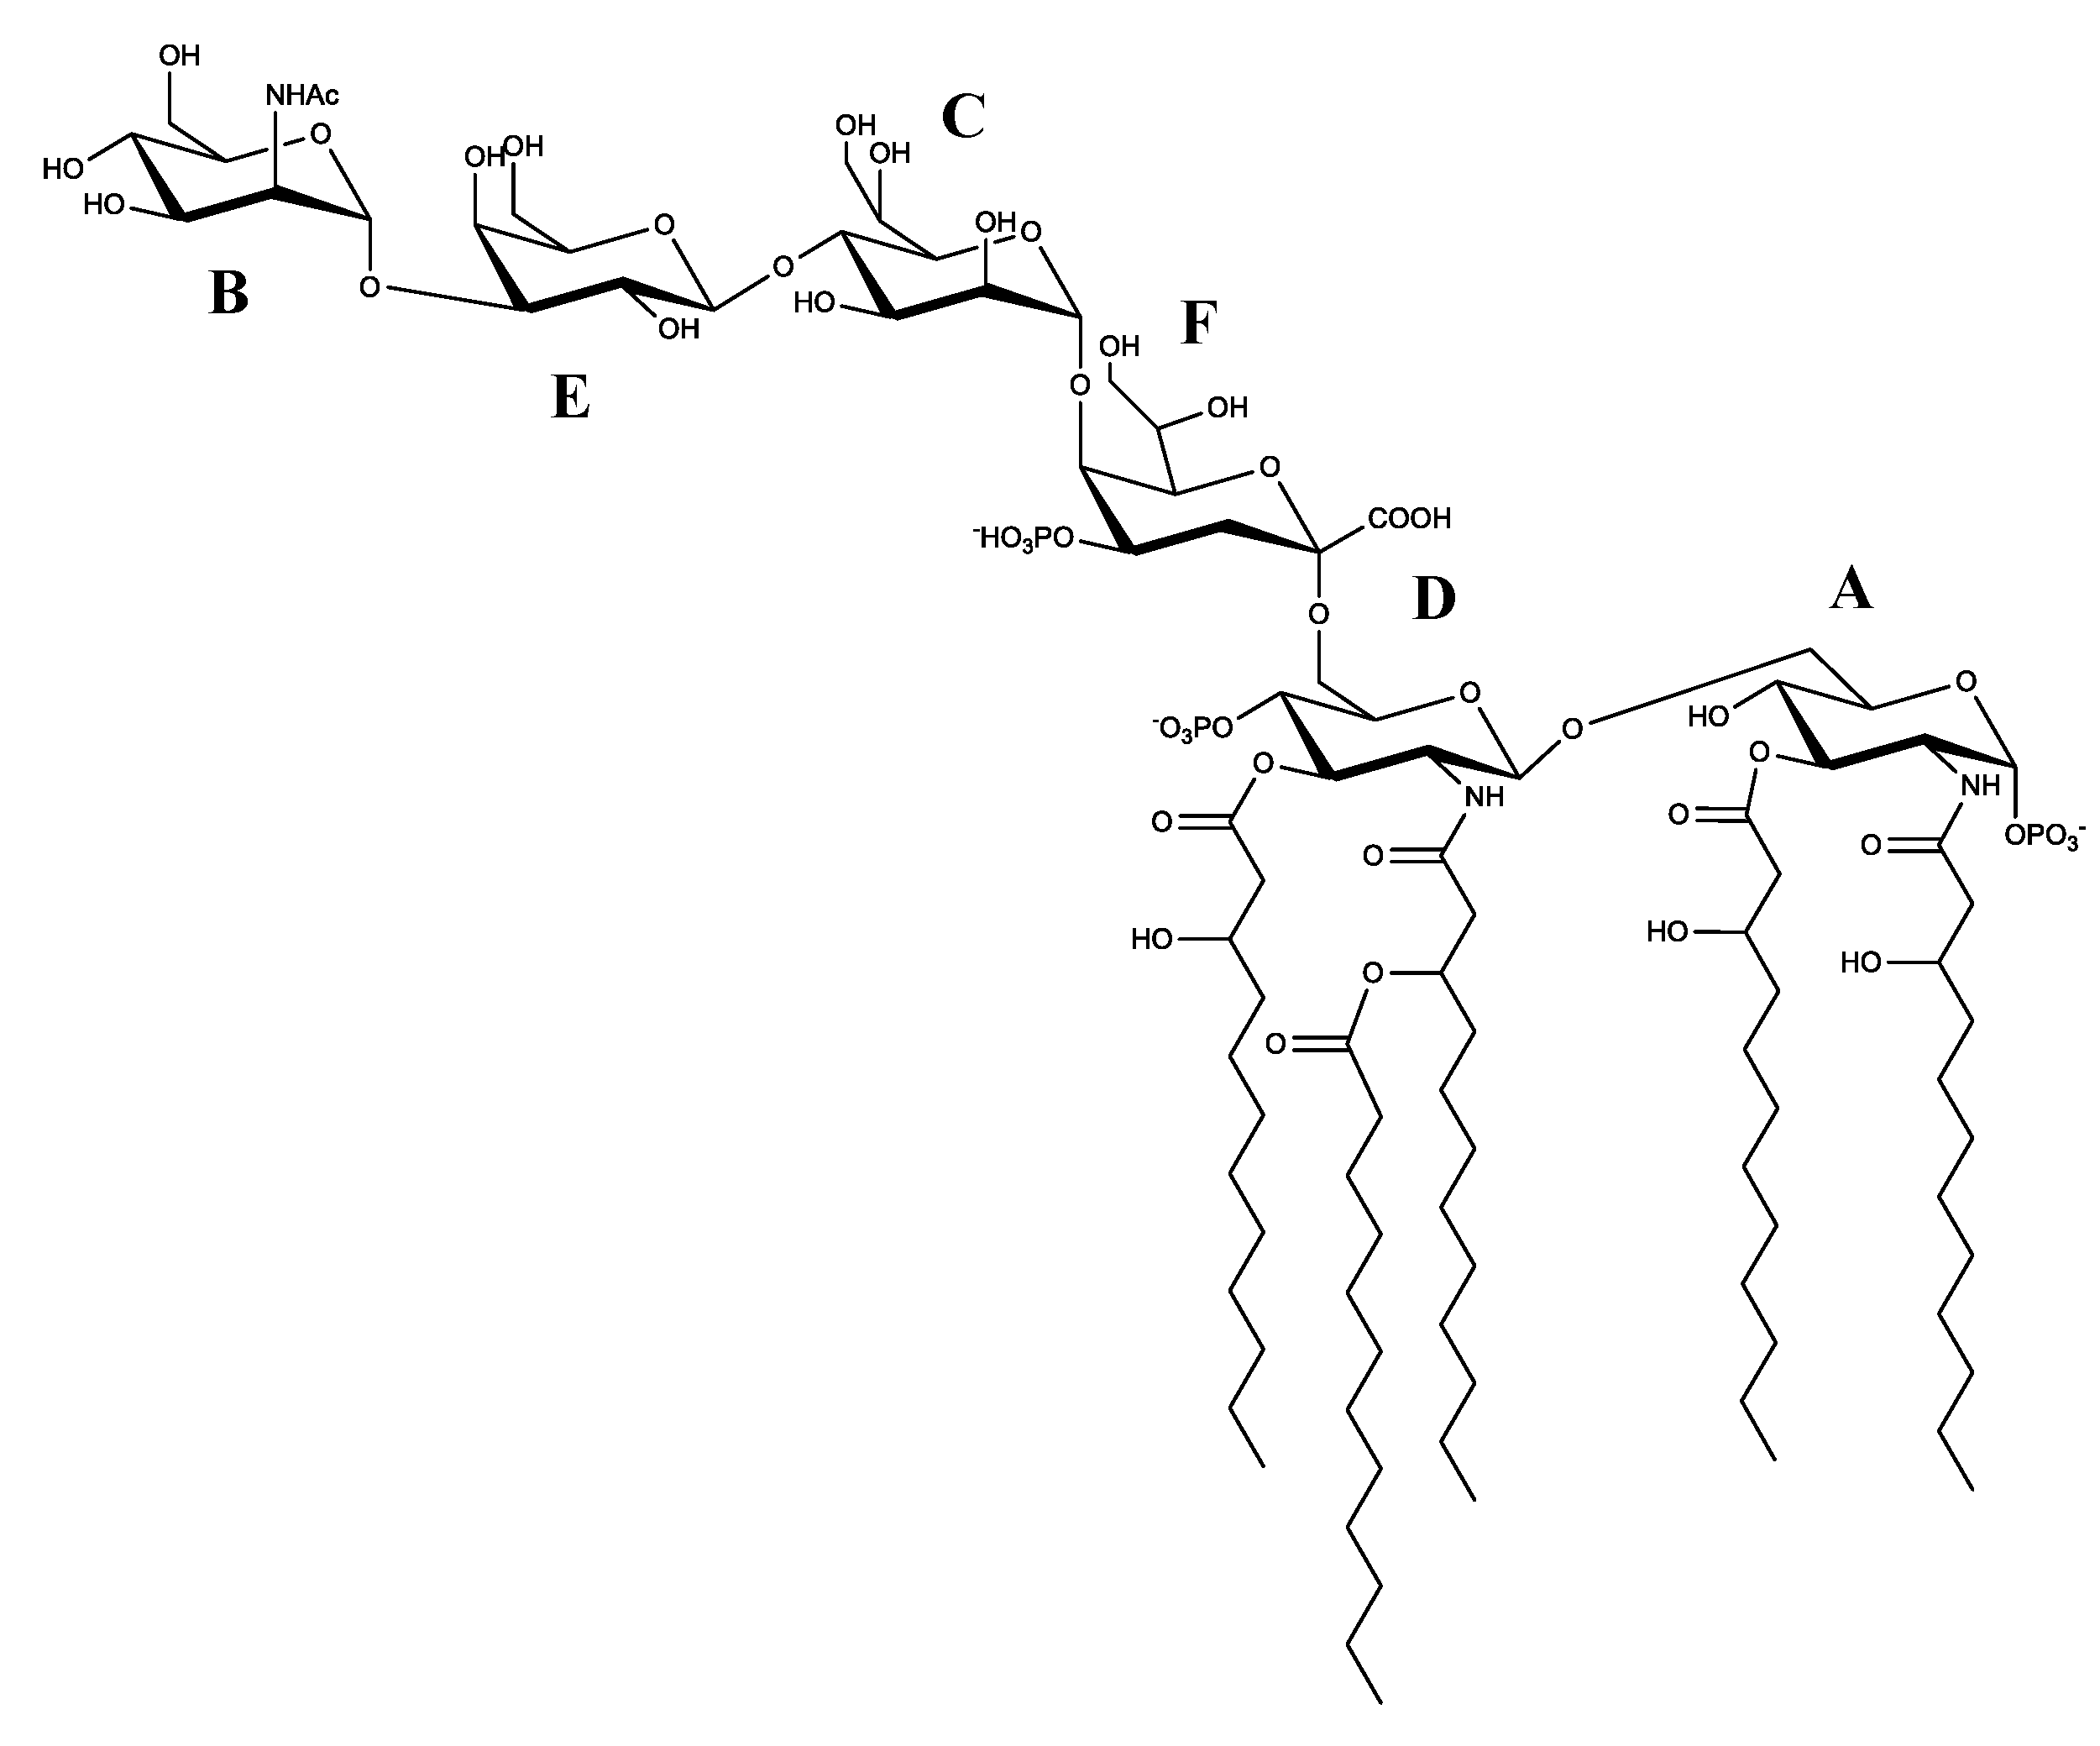
2.4. Structural Characterization of the Lipid A
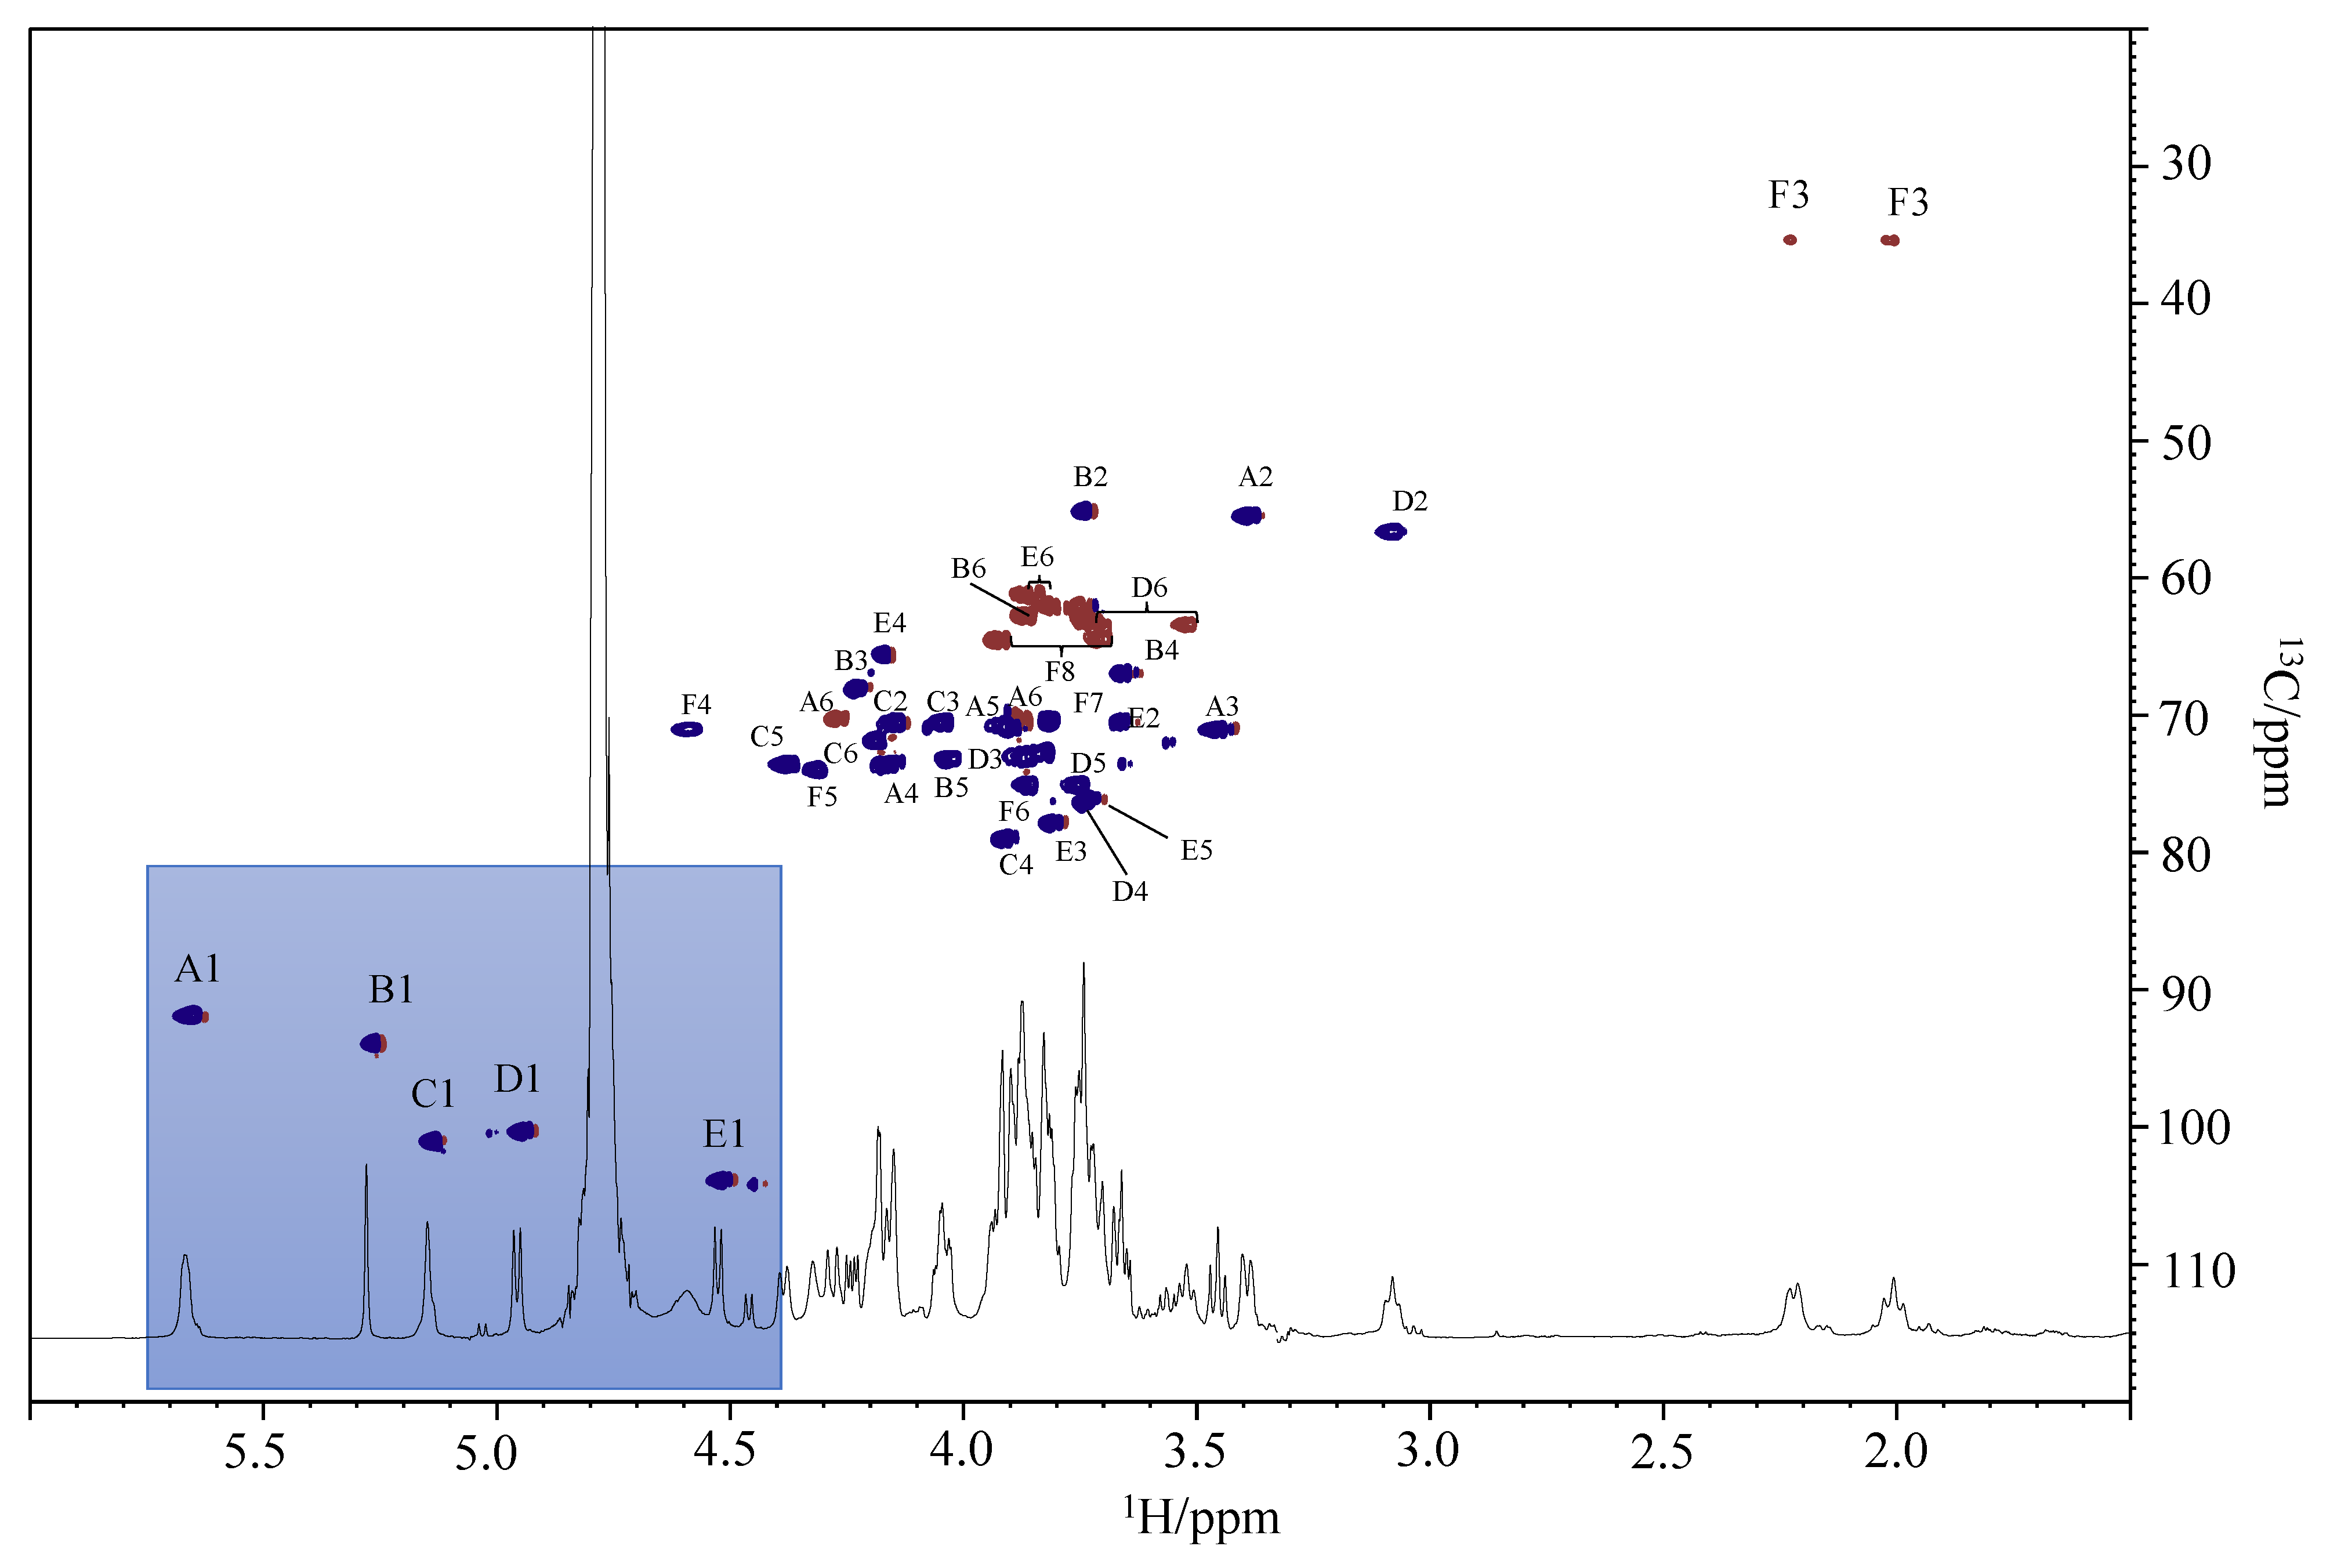
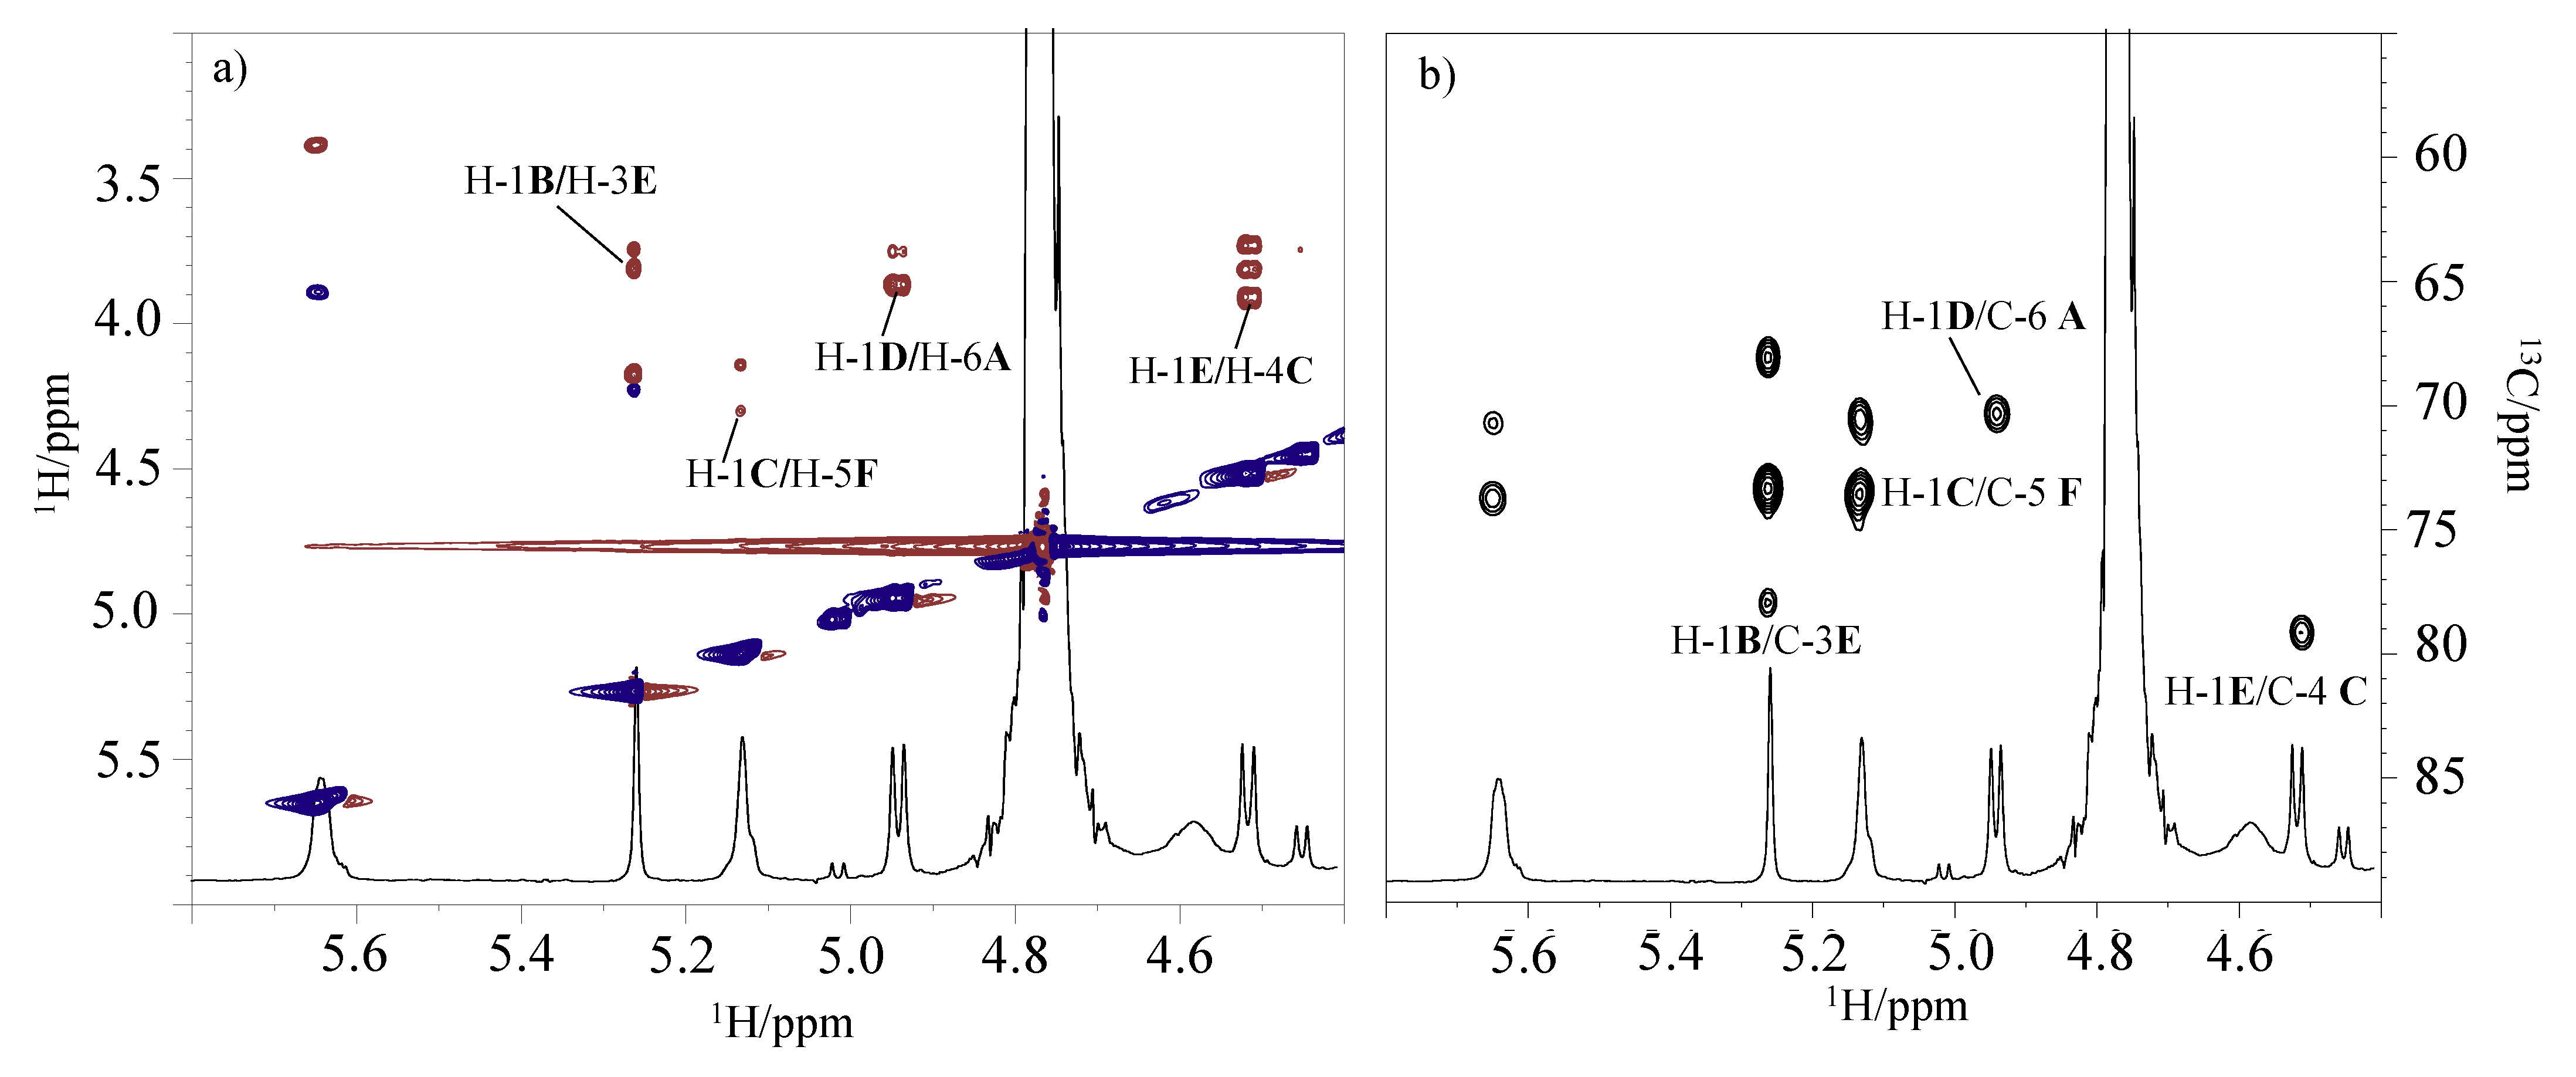
2.5. LOS De-Acylation and NMR Analysis
2.6. TLR-4 Activation and IL-6 mRNA Expression Evaluated by qRT-PCR
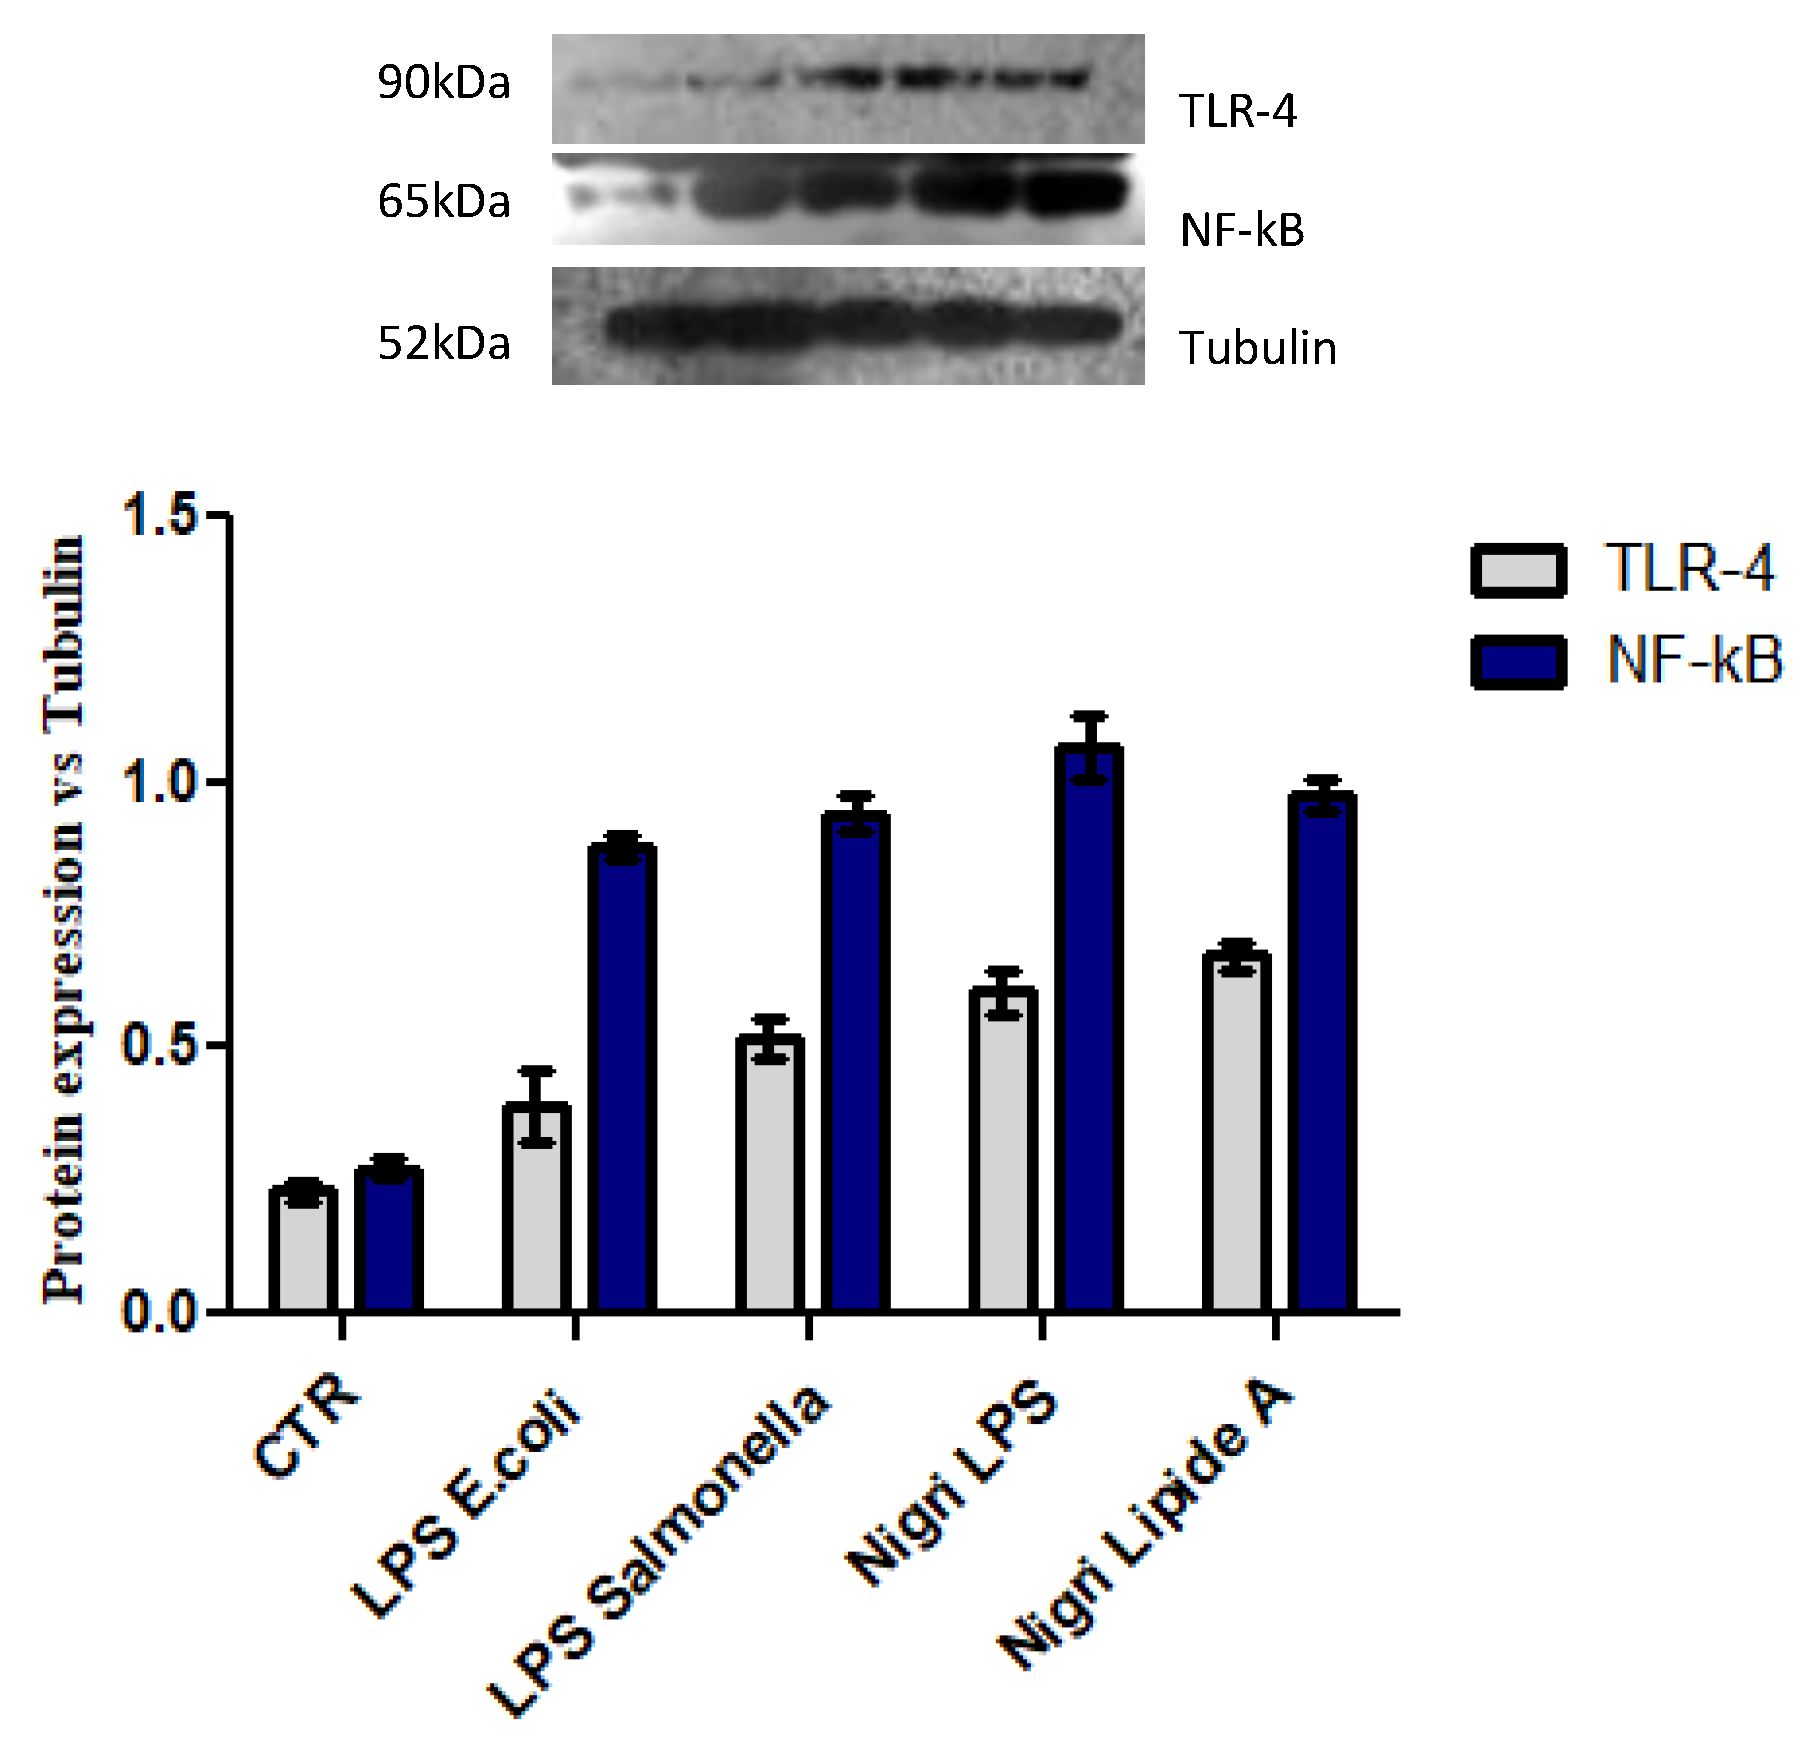
2.7. NF-κB Upregulates Protein Expression in Response to TLR-4 Activation
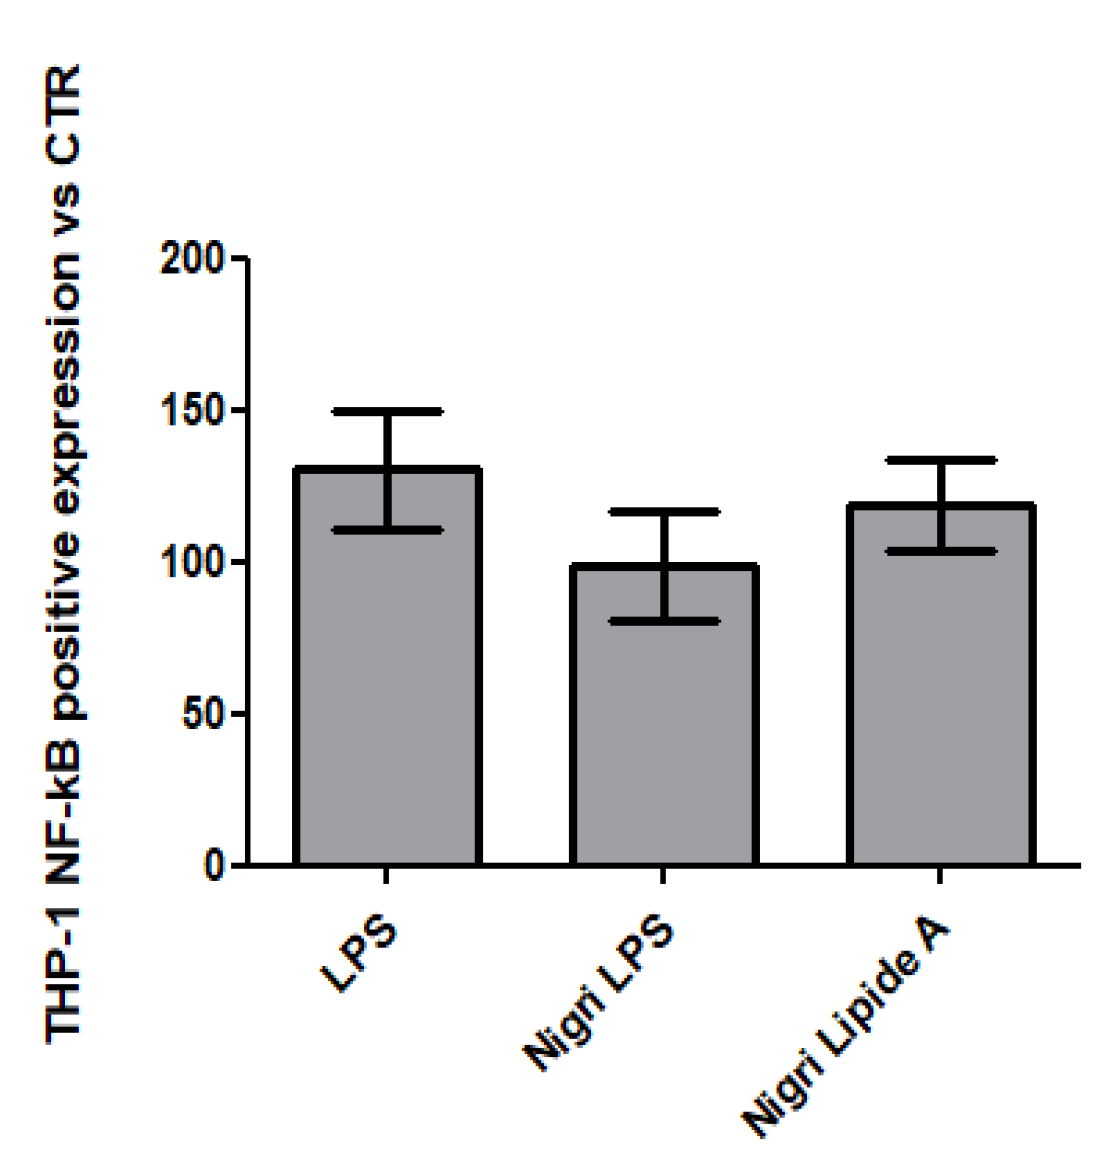
2.8. QUANTI-THP-1 Blue Assay
3. Materials and Methods
3.1. Cells Growth
3.2. LPS Isolation and Purification
3.3. DOC-PAGE Analysis
3.4. Chemical Analysis
3.5. Deacylation of LOS
3.6. De-O-Acylation of Lipid A
3.7. Mass Spectrometry Analysis
3.8. NMR Spectroscopy
3.9. Cell Culture
3.10. TLR-4 and IL-6 mRNA Analyses Using qRT-PCR Analyses
3.11. Western Blotting for TLR-4, NF-κB, and Tubulin
3.12. QUANTI-THP1-Blue Assay, Caco-2/THP-1 Co-Culture
4. Conclusions
Author Contributions
Funding
Conflicts of Interest
References
- Cavicchioli, R.; Siddiqui, K.S.; Andrews, D.; Sowers, K.R. Low-temperature extremophiles and their applications. Curr. Opin. Biotechnol. 2002, 13, 253–261. [Google Scholar] [CrossRef]
- D’Amico, S.; Collins, T.; Marx, J.C.; Feller, G.; Gerday, C. Psychrophilic microorganisms: Challenges for life. EMBO Rep. 2006, 7, 385–389. [Google Scholar] [CrossRef] [PubMed]
- De Maayer, P.; Anderson, D.; Cary, C.; Cowan, D.A. Some like it cold: Understanding the survival strategies of psychrophiles. EMBO Rep. 2014, 15, 508–517. [Google Scholar] [CrossRef] [PubMed]
- Chattopadhyay, M.K.J. Mechanism of bacterial adaptation to low temperature. J. Biosci. 2006, 31, 157–165. [Google Scholar] [CrossRef] [PubMed]
- Ummarino, S.; Corsaro, M.M.; Lanzetta, R.; Parrilli, M.; Katalinić, P. Determination of phosphorylation sites in lipooligosaccharides from Pseudoalteromonas haloplanktis TAC 125 grown at 15 degrees C and 25 degrees C by nano-electrospray ionization quadrupole time-of-flight tandem mass spectrometry. J. Rapid Commun. Mass Spectrom. 2003, 17, 2226–2232. [Google Scholar] [CrossRef]
- Casillo, A.; Parrilli, E.; Tutino, M.L.; Corsaro, M.M. The outer membrane glycolipids of bacteria from cold environments: Isolation, characterization, and biological activity. FEMS Microbiol. 2019, 95, fiz094. [Google Scholar] [CrossRef] [PubMed]
- Raetz, C.R.H.; Whitfield, C. Lipopolysaccharide endotoxins. Annu. Rev. Biochem. 2002, 71, 635–700. [Google Scholar] [CrossRef] [Green Version]
- Mayer, H.; Ramadas Bhat, U.; Masoud, H.; Radziejewska-Lebrecht, J.; Widemann, C.; Krauss, J.H. Bacterial lipopolysaccharide. Pure Appl. Chem. 1989, 61, 1271–1282. [Google Scholar] [CrossRef]
- Casillo, A.; Ziaco, M.; Lindner, B.; Parrilli, E.; Schwudke, D.; Holgado, A.; Verstrepen, L.; Sannino, F.; Beyaert, R.; Lanzetta, R.; et al. Unusual Lipid A from a Cold-Adapted Bacterium: Detailed Structural Characterization. Chembiochem 2017, 18, 1845–1854. [Google Scholar] [CrossRef]
- Caroff, M.; Karibian, D. Structure of bacterial lipopolysaccharides. Carbohydr. Res. 2003, 338, 2431–2444. [Google Scholar] [CrossRef]
- Nyati, K.K.; Masuda, K.; Zaman, M.M.; Dubey, P.K.; Millrine, D.; Chalise, J.P.; Higa, M.; Li, S.; Standley, D.M.; Saito, K.; et al. TLR4-induced NF-κB and MAPK signaling regulate the IL-6 mRNA stabilizing protein Arid5a. Nucleic Acids Res. 2017, 45, 2687–2703. [Google Scholar] [CrossRef] [PubMed]
- Corsaro, M.M.; Lanzetta, R.; Parrilli, E.; Parrilli, M.; Tutino, M.L. Structural investigation on the lipooligosaccharide fraction of psychrophilic Pseudoalteromonas haloplanktis TAC 125 bacterium. Eur. J. Biochem. 2001, 268, 5092–5097. [Google Scholar] [CrossRef] [PubMed]
- Carillo, S.; Pieretti, G.; Parrilli, E.; Tutino, M.L.; Gemma, S.; Molteni, M.; Lanzetta, R.; Parrilli, M.; Corsaro, M.M. Structural Investigation and Biological Activity of the Lipooligosaccharide from the Psychrophilic Bacterium Pseudoalteromonas haloplanktis TAB 23. Chem. Eur. J. 2011, 17, 7053–7060. [Google Scholar] [CrossRef] [PubMed]
- Calatayud, M.; Verstrepen, L.; Ghyselinck, J.; Van den Abbeele, P.; Marzorati, M.; Modica, S.; Ranjanoro, T.; Maquet, V. Chitin Glucan Shifts Luminal and Mucosal Microbial Communities, Improve Epithelial Barrier and Modulates Cytokine Production In Vitro. Nutrients. 2021, 13, 3249. [Google Scholar] [CrossRef]
- Galanos, C.; Lüderitz, O.; Westphal, O. A new method for the extraction of R lipopolysaccharides. Eur. J. Biochem. 1969, 9, 245–249. [Google Scholar] [CrossRef]
- Corsaro, M.M.; Piaz, F.D.; Lanzetta, R.; Parrilli, M. Lipid A structure of Pseudoalteromonas haloplanktis TAC 125: Use of electrospray ionization tandem mass spectrometry for the determination of fatty acid distribution. J. Mass Spectrom. 2002, 37, 481–488. [Google Scholar] [CrossRef] [PubMed]
- Krasikova, I.N.; Kapustina, N.V.; Isakov, V.V.; Gorshkova, N.M.; Solov’eva, T.F. Elucidation of structure of lipid A from the marine Gram-negative bacterium Pseudoalteromonas haloplanktis ATCC 14393T. Russ. J. Bioorgan. Chem. 2003, 30, 367–373. [Google Scholar] [CrossRef] [PubMed]
- Volk, A.S.; Krasikova, I.N.; Anastyuk, S.D.; Dmitrenok, P.S.; Solov’eva, T.F. Structure of lipid A from the marine gram-negative bacterium Pseudoalteromonas nigrifaciens IAM 13010T. Chem. Nat. Compd. 2007, 43, 519–524. [Google Scholar] [CrossRef]
- Domon, B.; Costello, C.E. A systematic nomenclature for carbohydrate fragmentations in FAB-MS/MS spectra of glycoconjugates. Glycoconj. J. 1988, 5, 397–409. [Google Scholar] [CrossRef]
- Holst, O.; Müller-Loennies, S.; Lindner, B.; Brade, H. Chemical structure of the lipid A of Escherichia coli J-5. Eur. J. Biochem. 1993, 214, 695–701. [Google Scholar] [CrossRef]
- Bock, K.; Pedersen, C. Carbon-13 Nuclear Magnetic Resonance Spectroscopy of Monosaccharides. Adv. Carbohydr. Chem. Biochem. 1983, 41, 27–66. [Google Scholar]
- Brade, H.; Rietschel, E.T. α-2→4-Interlinked 3-deoxy-D-manno-octulosonic acid disaccharide A common constituent of enterobacterial lipopolysaccharides. Eur. J. Biochem. 1984, 145, 231–236. [Google Scholar] [CrossRef]
- Müller-Loennies, S.; Lindner, B.; Brade, H. Structural analysis of deacylated lipopolysaccharide of Escherichia coli strains 2513 (R4 core-type) and F653 (R3 core-type). Eur. J. Biochem. 2002, 269, 5982–5991. [Google Scholar] [CrossRef] [PubMed]
- Agrawal, P.K.; Bush, C.A.; Qureshi, N.; Takayama, K. Structural analysis of lipid A and Re-lipopolysaccharides by NMR spectroscopic methods. Adv. Biophys. Chem. 1994, 4, 179–236. [Google Scholar]
- Arbizu, S.; Chew, B.; Mertens-Talcott, S.U.; Noratto, G. Commercial whey products promote intestinal barrier function with glycomacropeptide enhanced activity in downregulating bacterial endotoxin lipopolysaccharides (LPS)-induced inflammation in vitro. Food Funct. 2020, 11, 5842–5852. [Google Scholar] [CrossRef]
- Manning, A.J.; Kuehn, M.J. Contribution of bacterial outer membrane vesicles to innate bacterial defence. BMC Microbiol. 2011, 11, 258. [Google Scholar] [CrossRef] [PubMed] [Green Version]
- Laemmli, U.K.; Favre, M. Maturation of the head of bacteriophage T4: I. DNA packaging events. J. Mol. Biol. 1973, 80, 575–599. [Google Scholar] [CrossRef]
- Adinolfi, M.; Corsaro, M.M.; De Castro, C.; Evidente, A.; Lanzetta, R.; Lavermicocca, P.; Parrilli, M. Analysis of the polysaccharide components of the lipopolysaccharide fraction of Pseudomonas caryophylli. Carbohydr. Res. 1996, 284, 119–133. [Google Scholar] [CrossRef]
- Tsai, C.M.; Frasch, C.E. A sensitive silver stain for detecting lipopolysaccharides in polyacrylamide gels. Anal. Biochem. 1982, 119, 115–119. [Google Scholar] [CrossRef]
- Leontein, K.; Lindberg, B.; LoÈnngren, J. Assignment of absolute configuration of sugars by g.l.c. of their acetylated glycosides from chiral alcohols. Carbohydr. Res. 1978, 62, 359–362. [Google Scholar] [CrossRef]
- Holst, O. De-acylation of lipopolysaccharides and isolation of oligosaccharide phosphates. In Bacterial Toxins: Methods and Protocols; Methods in Molecular Biology; Humana Press: Totowa, NJ, USA, 2000; Volume 145, pp. 345–353. [Google Scholar]
- Silipo, A.; Lanzetta, R.; Amoresano, A.; Parrilli, M.; Molinaro, A. Ammonium hydroxide hydrolysis: A valuable support in the MALDI-TOF mass spectrometry analysis of Lipid A fatty acid distribution. J. Lipid Res. 2002, 43, 2188–2195. [Google Scholar] [CrossRef] [PubMed] [Green Version]
- Casillo, A.; Ståhle, J.; Parrilli, E.; Sannino, F.; Mitchell, D.E.; Pieretti, G.; Gibson, M.I.; Marino, G.; Lanzetta, R.; Parrilli, M.; et al. Structural characterization of an all-aminosugar-containing capsular polysaccharide from Colwellia psychrerythraea 34H. Antonie Van Leeuwenhoek 2017, 110, 1377–1387. [Google Scholar] [CrossRef] [PubMed]
- Fusco, A.; Savio, V.; Donniacuo, M.; Perfetto, B.; Donnarumma, G. Antimicrobial Peptides Human Beta-Defensin-2 and -3 Protect the Gut During Candida albicans Infections Enhancing the Intestinal Barrier Integrity: In Vitro Study. Front Cell. Infect Microbiol. 2021, 11, 666900. [Google Scholar] [CrossRef] [PubMed]
- Stellavato, A.; Abate, L.; Vassallo, V.; Donniacuo, M.; Rinaldi, B.; Schiraldi, C. An in vitro study to assess the effect of hyaluronan-based gels on muscle-derived cells: Highlighting a new perspective in regenerative medicine. PLoS ONE 2020, 15, e0236164. [Google Scholar] [CrossRef]
- Rakshit, M.; Darwitan, A.; Muktabar, A.; Das, P.; Nguyen, L.T.H.; Cao, Y.; Vizetto-Duarte, C.; Tang, J.; Wong, Y.S.; Venkatraman, S.; et al. Anti-inflammatory potential of simvastatin loaded nanoliposomes in 2D and 3D foam cell models. Nanomedicine 2021, 37, 102434. [Google Scholar] [CrossRef]
- Kaszowska, M.; Wojcik, M.; Siednienko, J.; Lugowski, C.; Lukasiewicz, J. Structure-Activity Relationship of Plesiomonas shigelloides Lipid A to the Production of TNF-α, IL-1β, and IL-6 by Human and Murine Macrophages. Front. Immunol. 2017, 8, 1741. [Google Scholar] [CrossRef] [Green Version]
- Diao, J.; Ye, H.B.; Yu, X.Q.; Fan, Y.; Xu, L.; Li, T.B.; Wang, Y.Q. Adjuvant and immunostimulatory effects of LPS and β-glucan on immune response in Japanese flounder, Paralichthys olivaceus. Vet. Immunol. Immunopathol. 2013, 156, 167–175. [Google Scholar] [CrossRef]


| 1258.38 | [M-H]−-C12:0(3-OH)-H2O |
| 1178.34 | [M-H]−-C12:0(3-OH)-H2O-P |
| 980.01 | [M-H]−-[C12:0(3-OH)]2-H2O-P |
| 818.88 | B1 |
| 654.65 | Y1 |
| Sugar Residue | H1 C1 1JC,H | H2 C2 | H3 C3 | H4 C4 | H5 C5 | H6 C6 | H7 C7 | H8 C8 |
|---|---|---|---|---|---|---|---|---|
| A α-6-d-GlcNp1P | 5.65 91.9 185 Hz | 3.39 55.5 | 3.45 71.1 | 4.16 73.6 | 3.89 70.9 | 4.26, 387 70.3 | ||
| B α-t-d-ManpN | 5.26 93.9 176 Hz | 3.74 55.2 | 4.23 68.2 | 3.65 66.9 | 4.03 73.2 | 3.86 62.8 | ||
| C α-4- L,d-Hepp | 5.12 101.1 179 Hz | 4.14 70.6 | 4.04 70.5 | 3.91 78.9 | 4.37 73.6 | 4.19 71.9 | 3.74 62.2 | |
| D β-6-d-GlcNp4P | 4.94 100.4 171 Hz | 3.08 56.7 | 3.86 72.9 | 3.74 76.5 | 3.75 75.1 | 3.52, 3.71 63.4 | ||
| E β-3-d-Galp | 4.51 103.9 165 Hz | 3.66 70.5 | 3.80 77.9 | 4.16 65.6 | 3.73 76.2 | 3.83, 3.87 61.3 | ||
| F α-5-d-Kdop4P | - 175.7 | - 100.7 | 2.23, 2.01 35.5 | 4.59 71.7 | 4.31 74.0 | 3.86 75.0 | 3.81 70.5 | 3.92, 3.71 64.6 |
| Gene Name (Symbol) | PCR Primer Sequence 5′→ 3′ | Annealing Temperature (°C) |
|---|---|---|
| Glyceraldehyde-3-phosphate dehydrogenase (GAPDH) | TGCACCACCAACTGCTTAGC GGCATGGACTGTGGTCATGAG | 55 |
| Toll like receptor 4 (TLR-4) | TCCCAggAATTggTgATAAAgTAgA CTggCATgACgCgAACAATA | 55 |
| Interleukin 6 (IL-6) | GTGGAGATTGTTGCCATCAACG CAGTGGATGCAGGGATGATGTTCTG | 55 |
Publisher’s Note: MDPI stays neutral with regard to jurisdictional claims in published maps and institutional affiliations. |
© 2021 by the authors. Licensee MDPI, Basel, Switzerland. This article is an open access article distributed under the terms and conditions of the Creative Commons Attribution (CC BY) license (https://creativecommons.org/licenses/by/4.0/).
Share and Cite
Di Guida, R.; Casillo, A.; Stellavato, A.; Di Meo, C.; Kawai, S.; Kawamoto, J.; Ogawa, T.; Kurihara, T.; Schiraldi, C.; Corsaro, M.M. Complete Lipooligosaccharide Structure from Pseudoalteromonas nigrifaciens Sq02-Rifr and Study of Its Immunomodulatory Activity. Mar. Drugs 2021, 19, 646. https://0-doi-org.brum.beds.ac.uk/10.3390/md19110646
Di Guida R, Casillo A, Stellavato A, Di Meo C, Kawai S, Kawamoto J, Ogawa T, Kurihara T, Schiraldi C, Corsaro MM. Complete Lipooligosaccharide Structure from Pseudoalteromonas nigrifaciens Sq02-Rifr and Study of Its Immunomodulatory Activity. Marine Drugs. 2021; 19(11):646. https://0-doi-org.brum.beds.ac.uk/10.3390/md19110646
Chicago/Turabian StyleDi Guida, Rossella, Angela Casillo, Antonietta Stellavato, Celeste Di Meo, Soichiro Kawai, Jun Kawamoto, Takuya Ogawa, Tatsuo Kurihara, Chiara Schiraldi, and Maria Michela Corsaro. 2021. "Complete Lipooligosaccharide Structure from Pseudoalteromonas nigrifaciens Sq02-Rifr and Study of Its Immunomodulatory Activity" Marine Drugs 19, no. 11: 646. https://0-doi-org.brum.beds.ac.uk/10.3390/md19110646