
Complementary Analytical Platforms of NMR Spectroscopy and LCMS Analysis in the Metabolite Profiling of Isochrysis galbana


 , , , and
Abstract
:1. Introduction
2. Results and Discussion
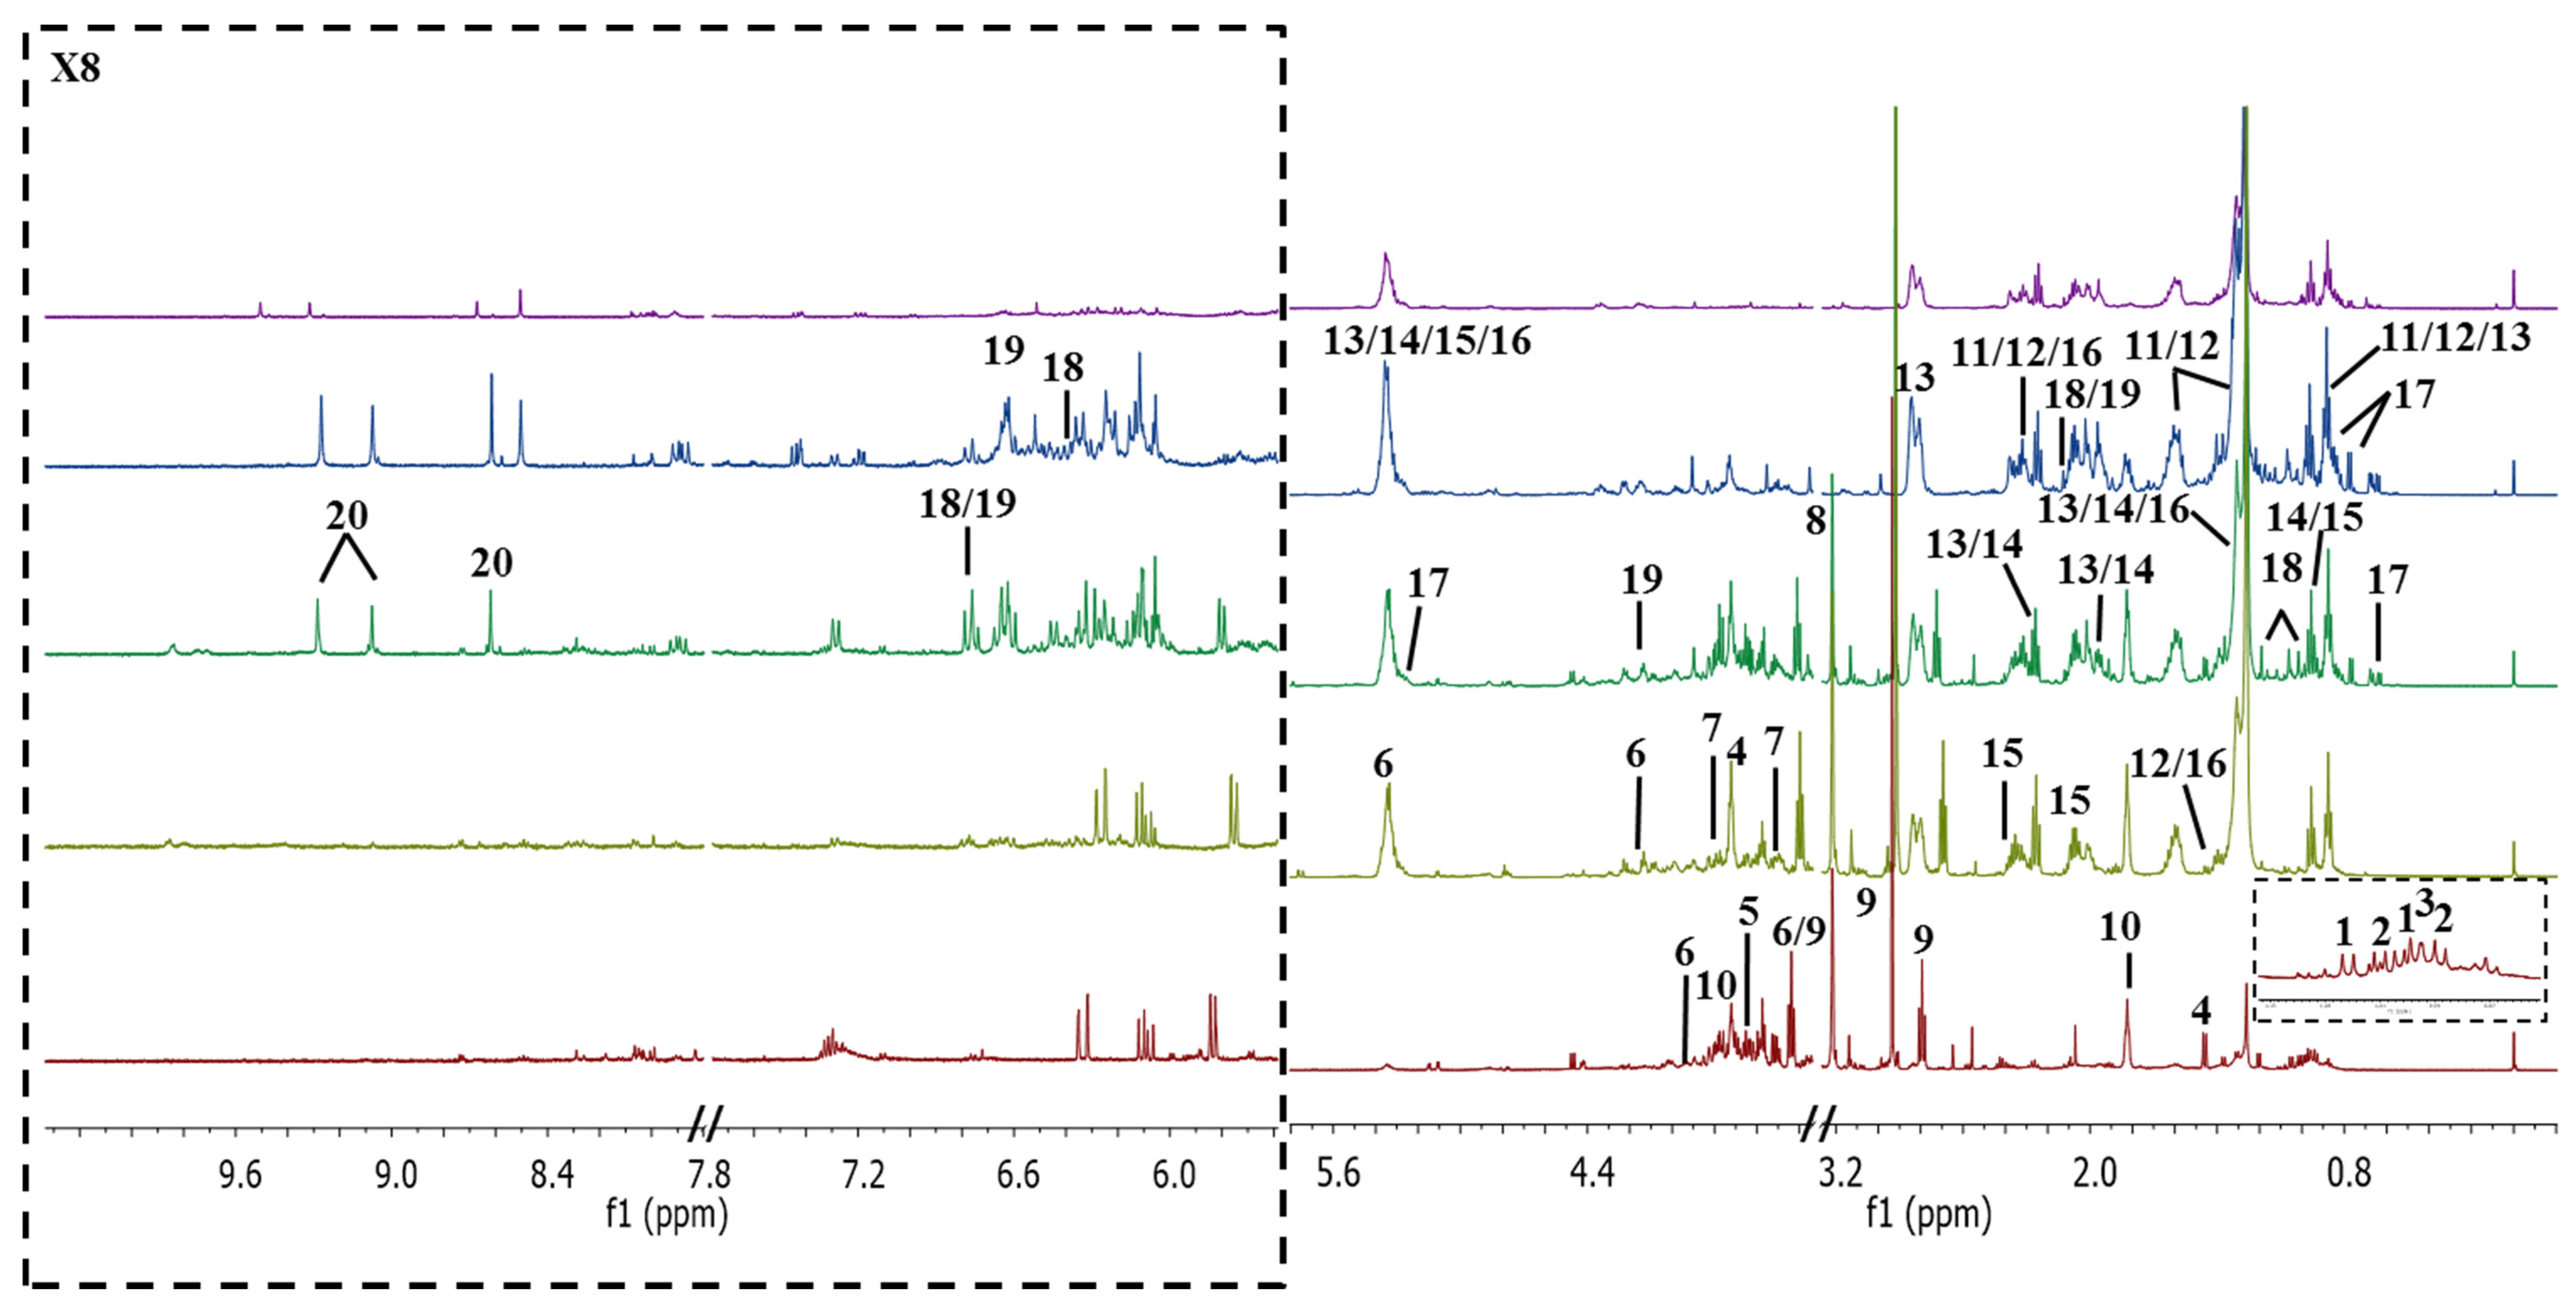
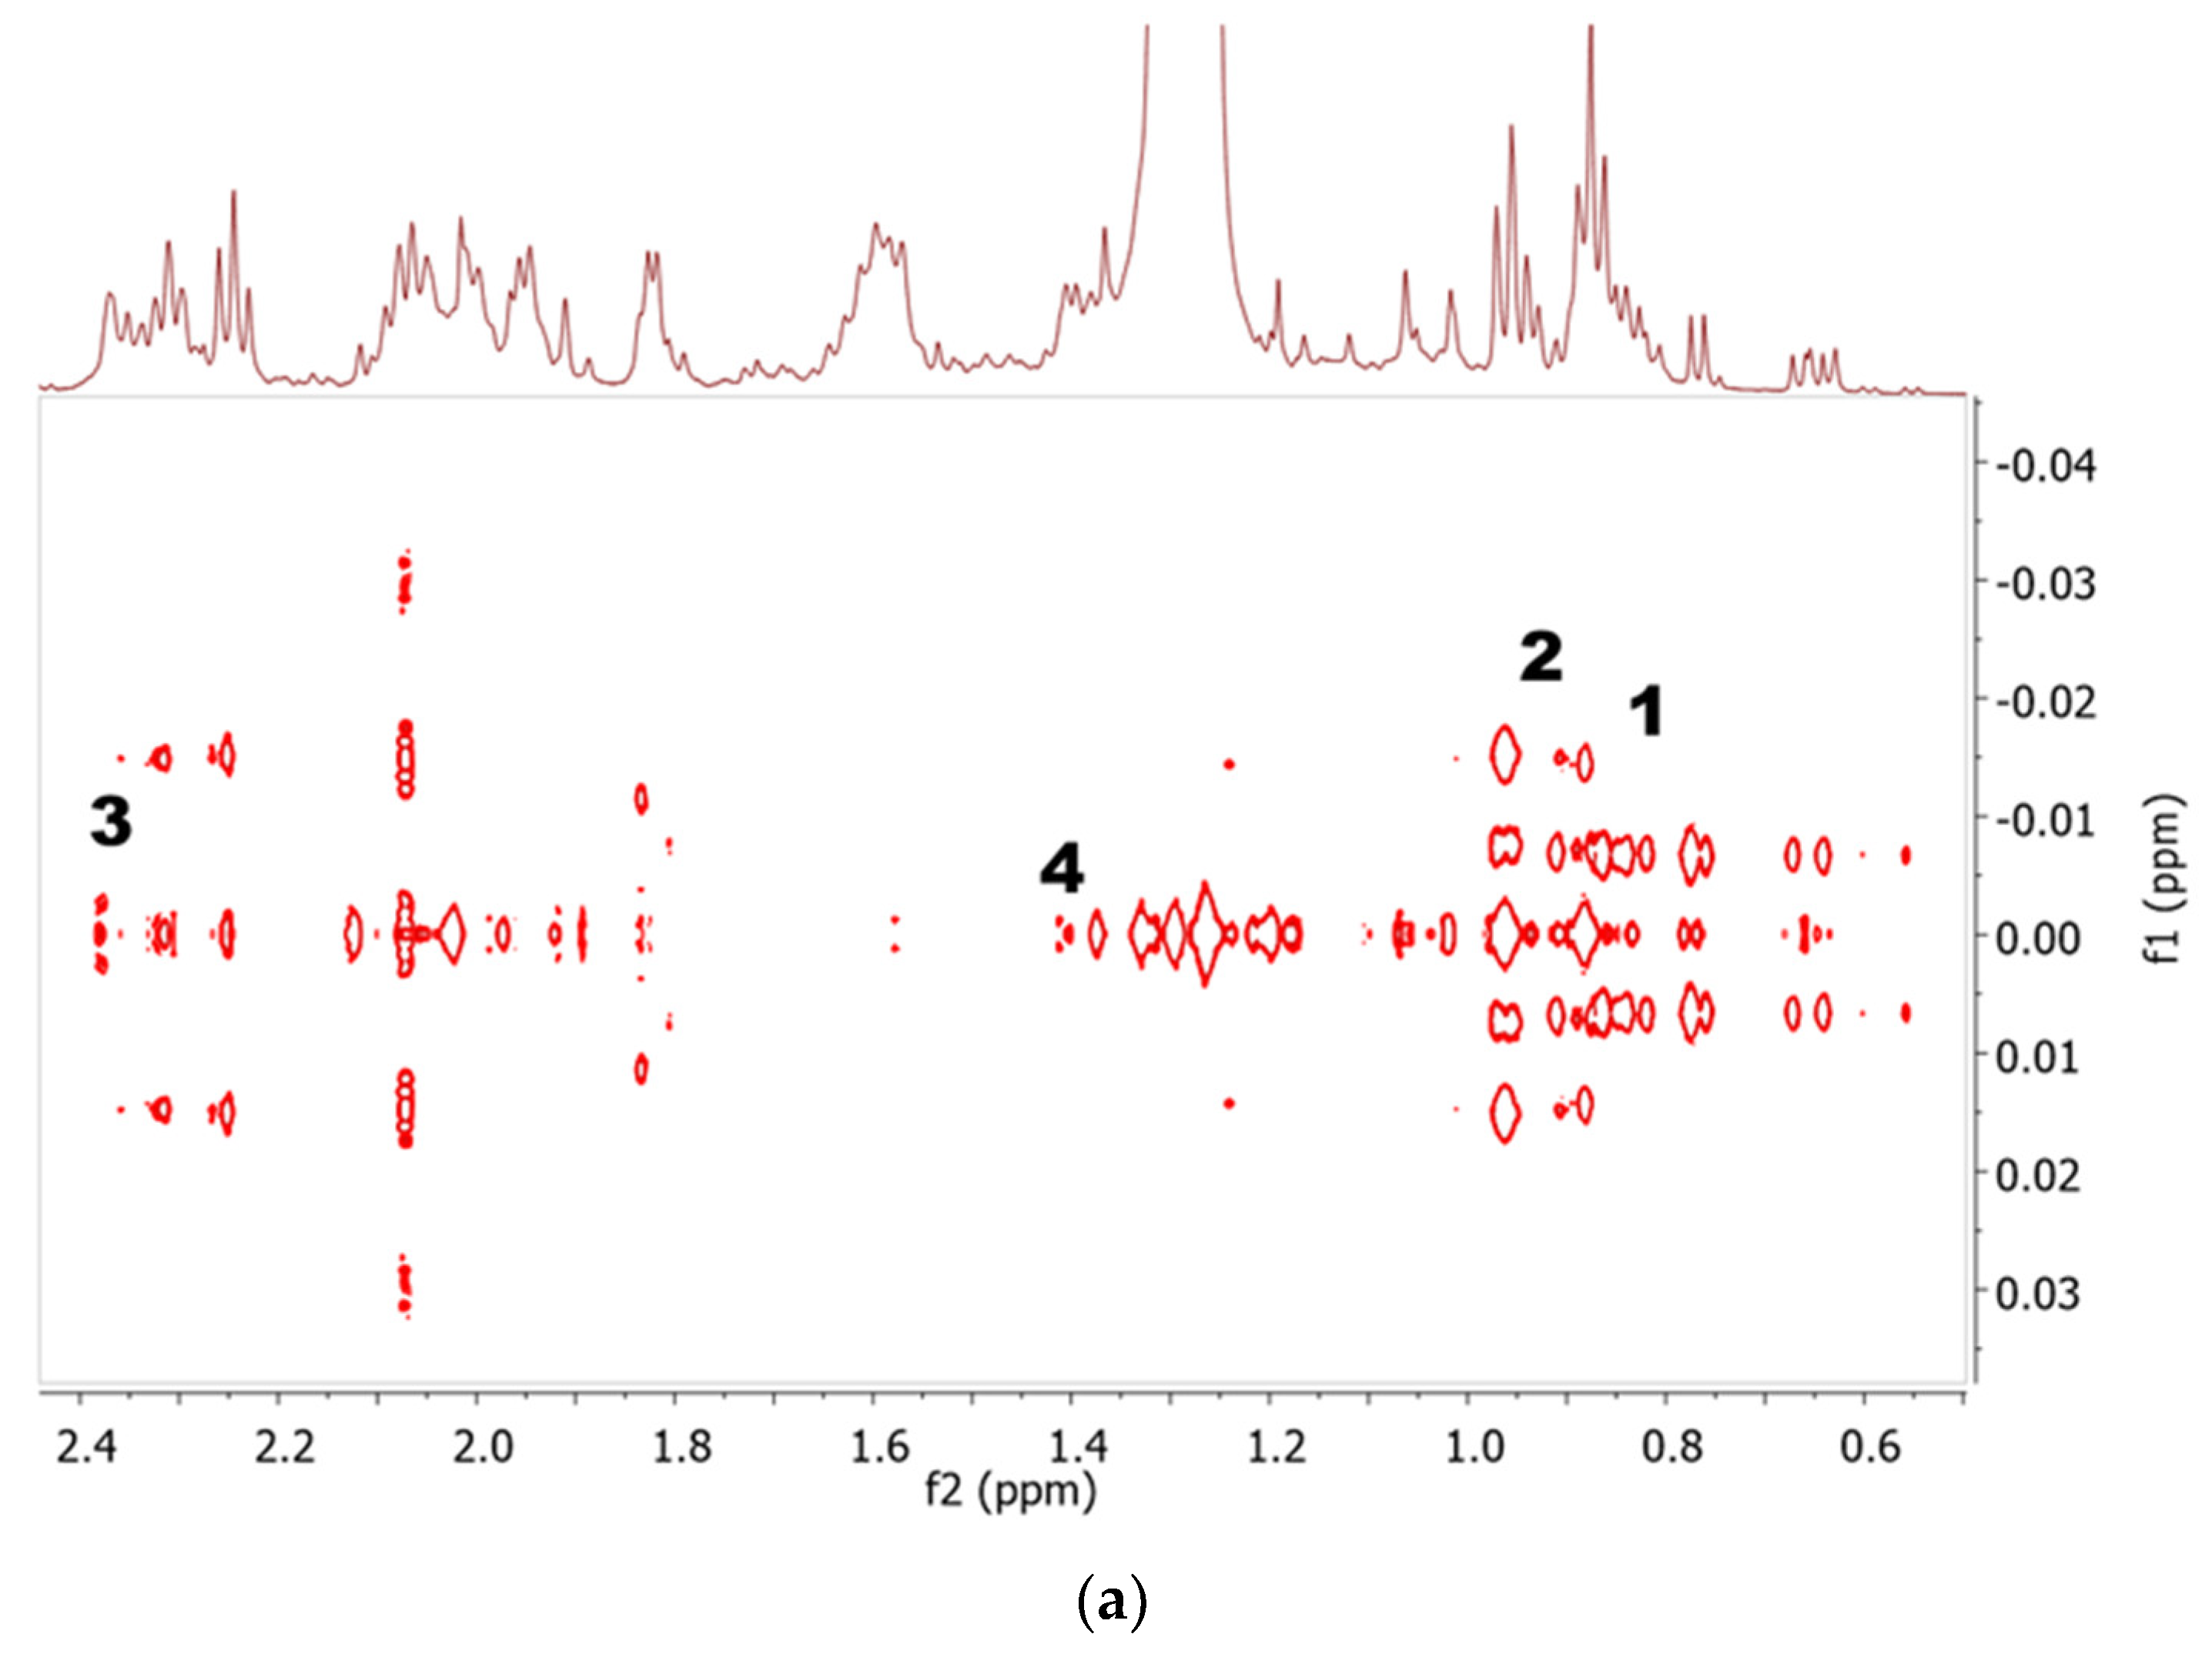
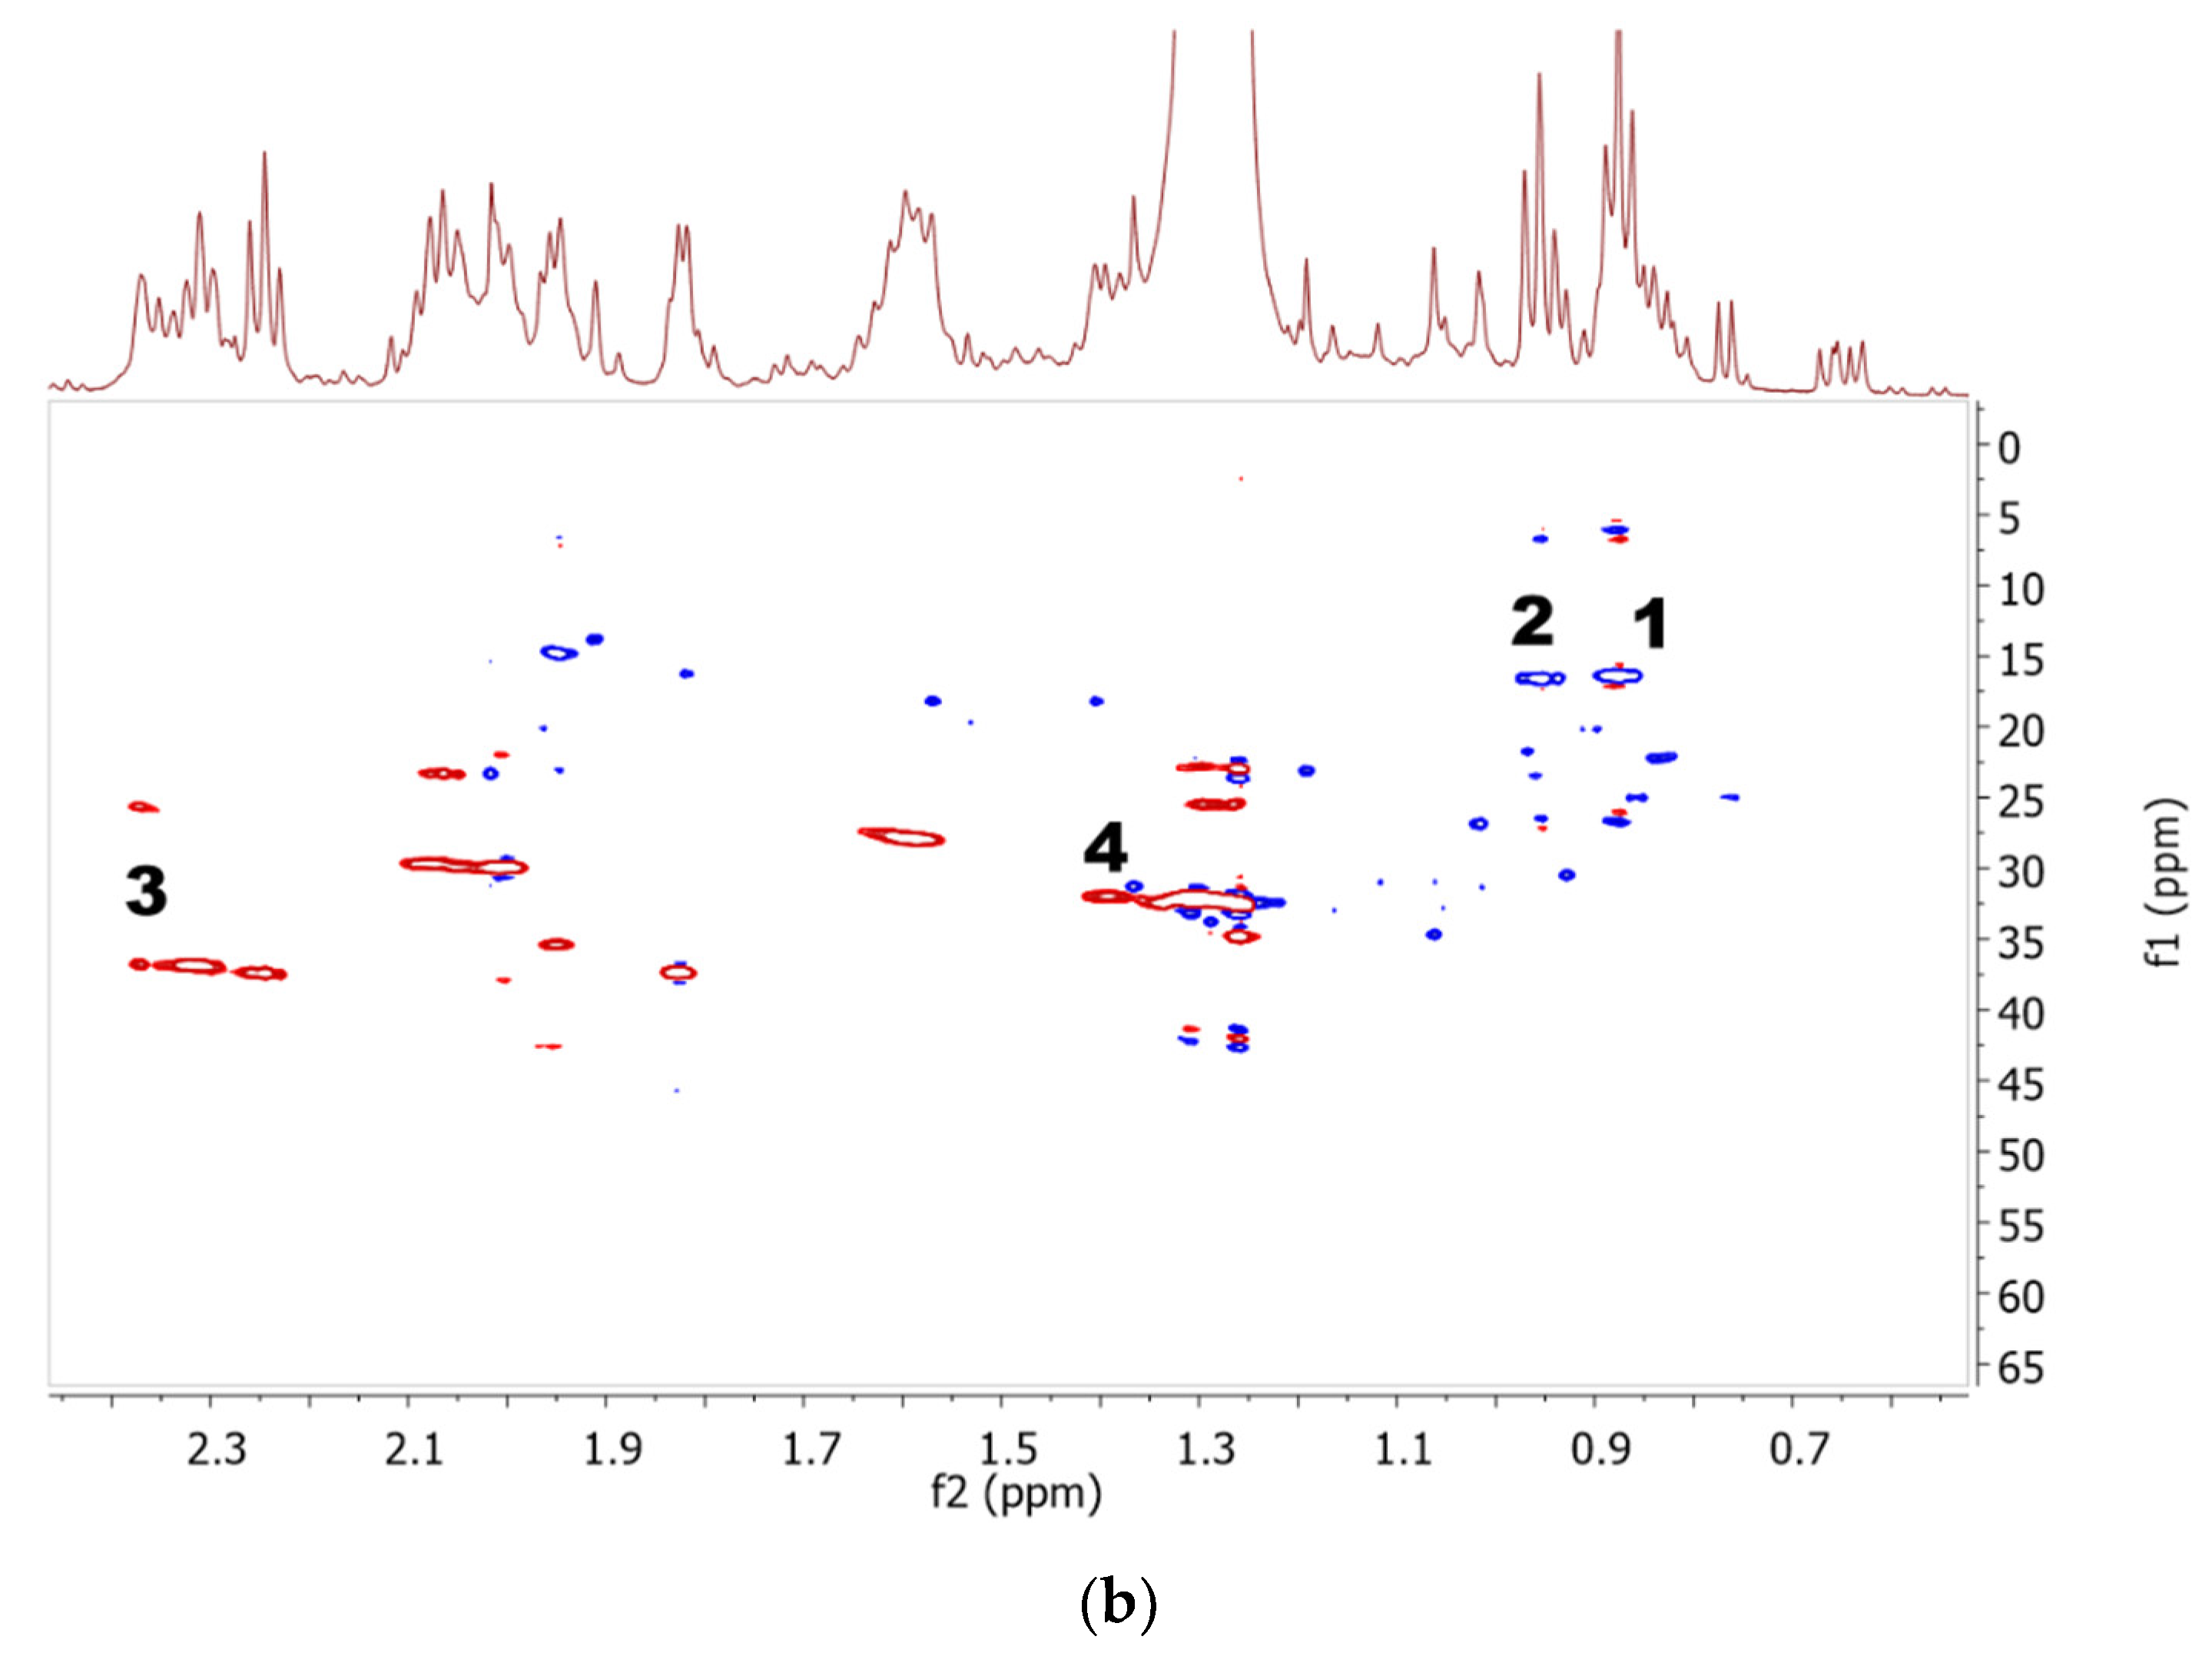
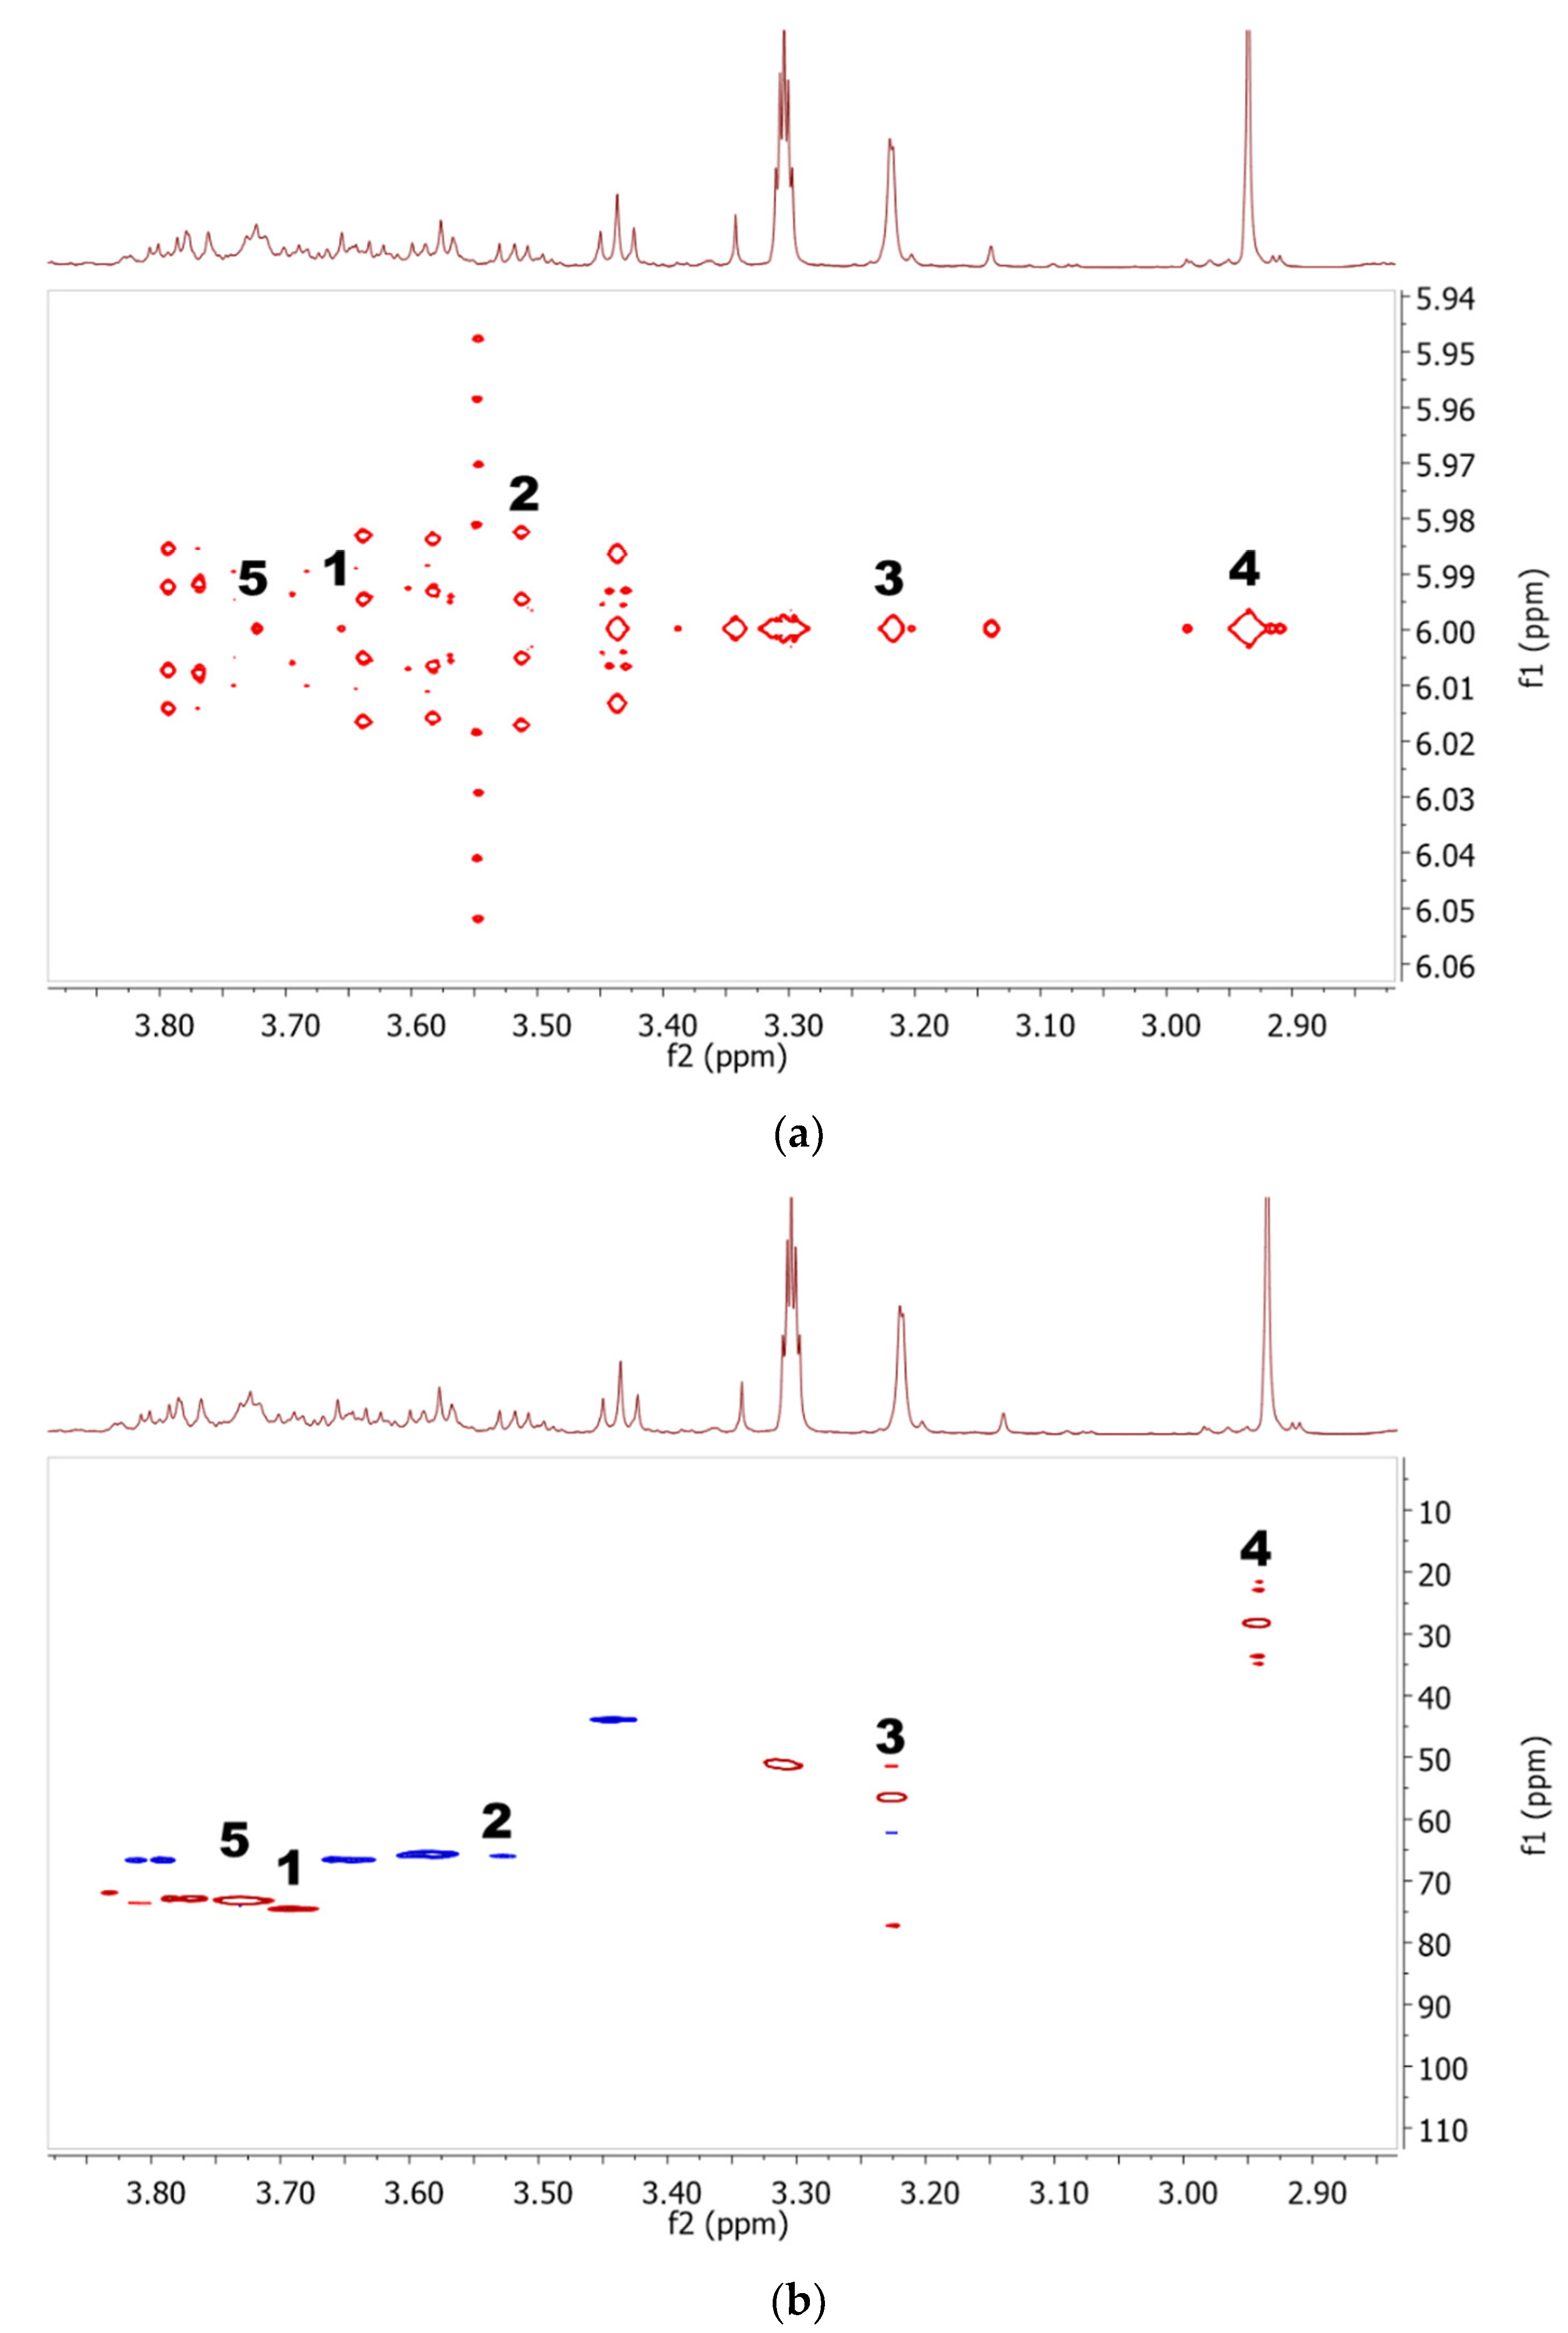
2.1. Identification of Metabolites in NMR Spectra of Different Solvent Extracts
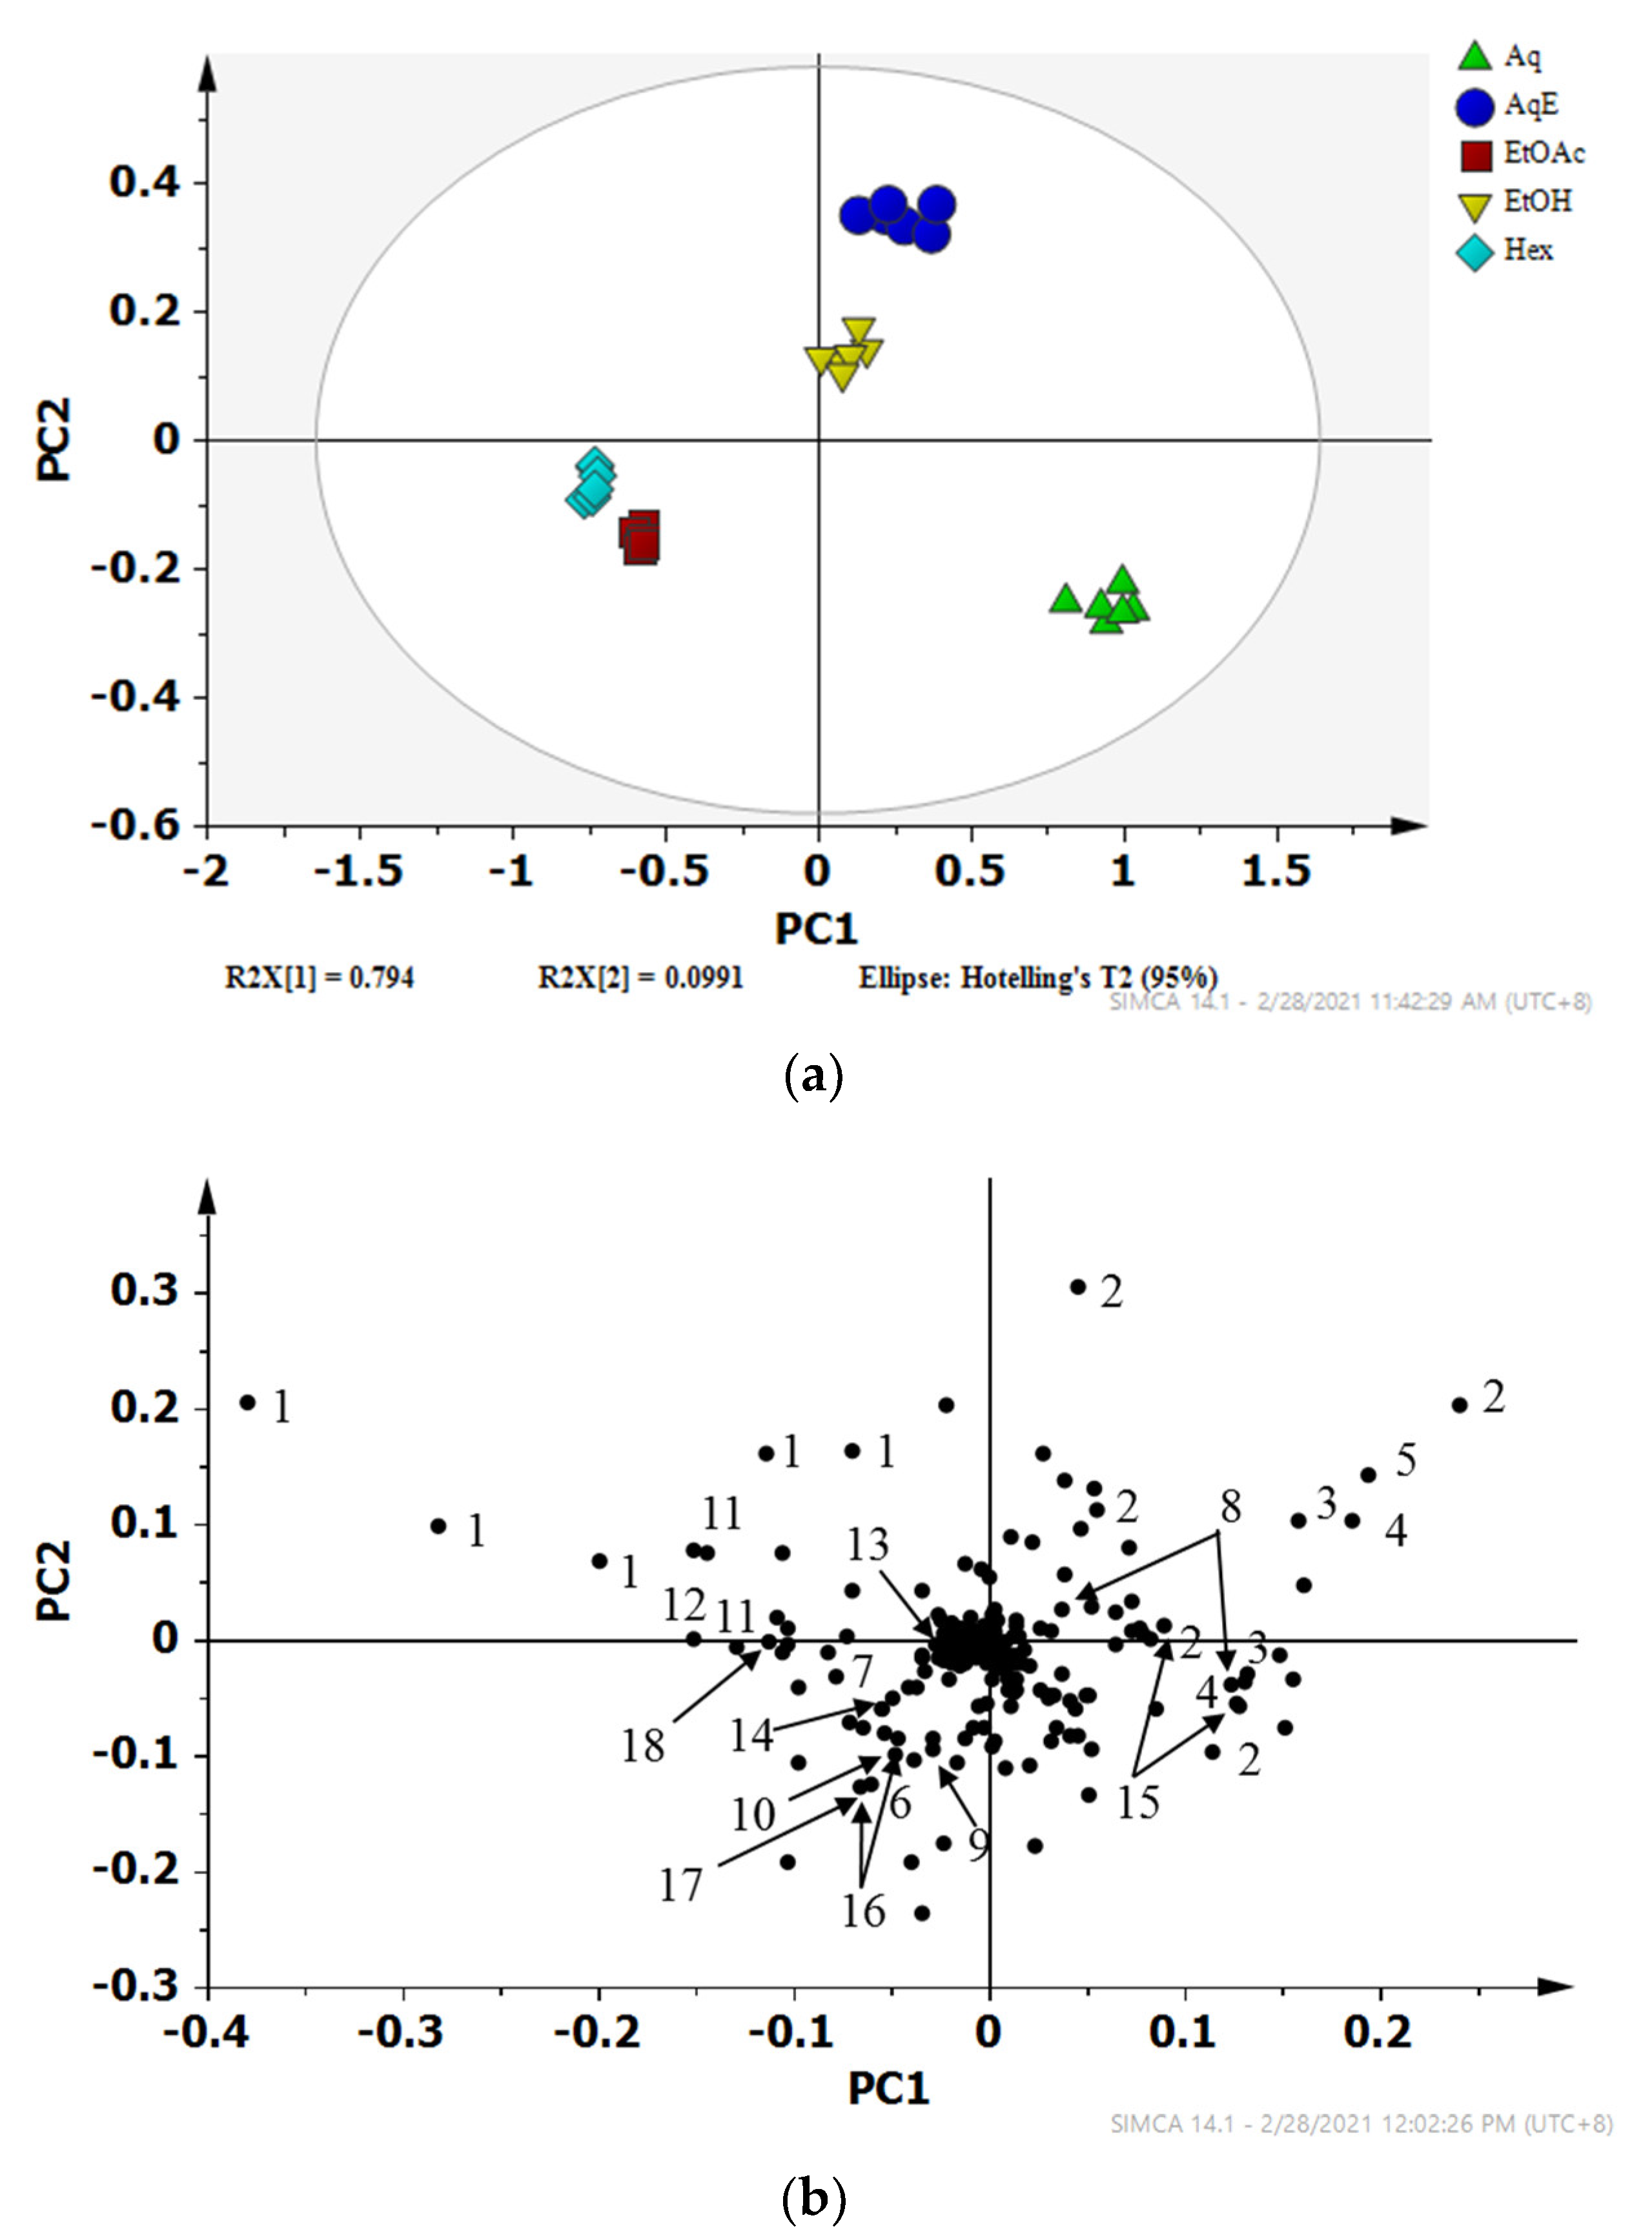
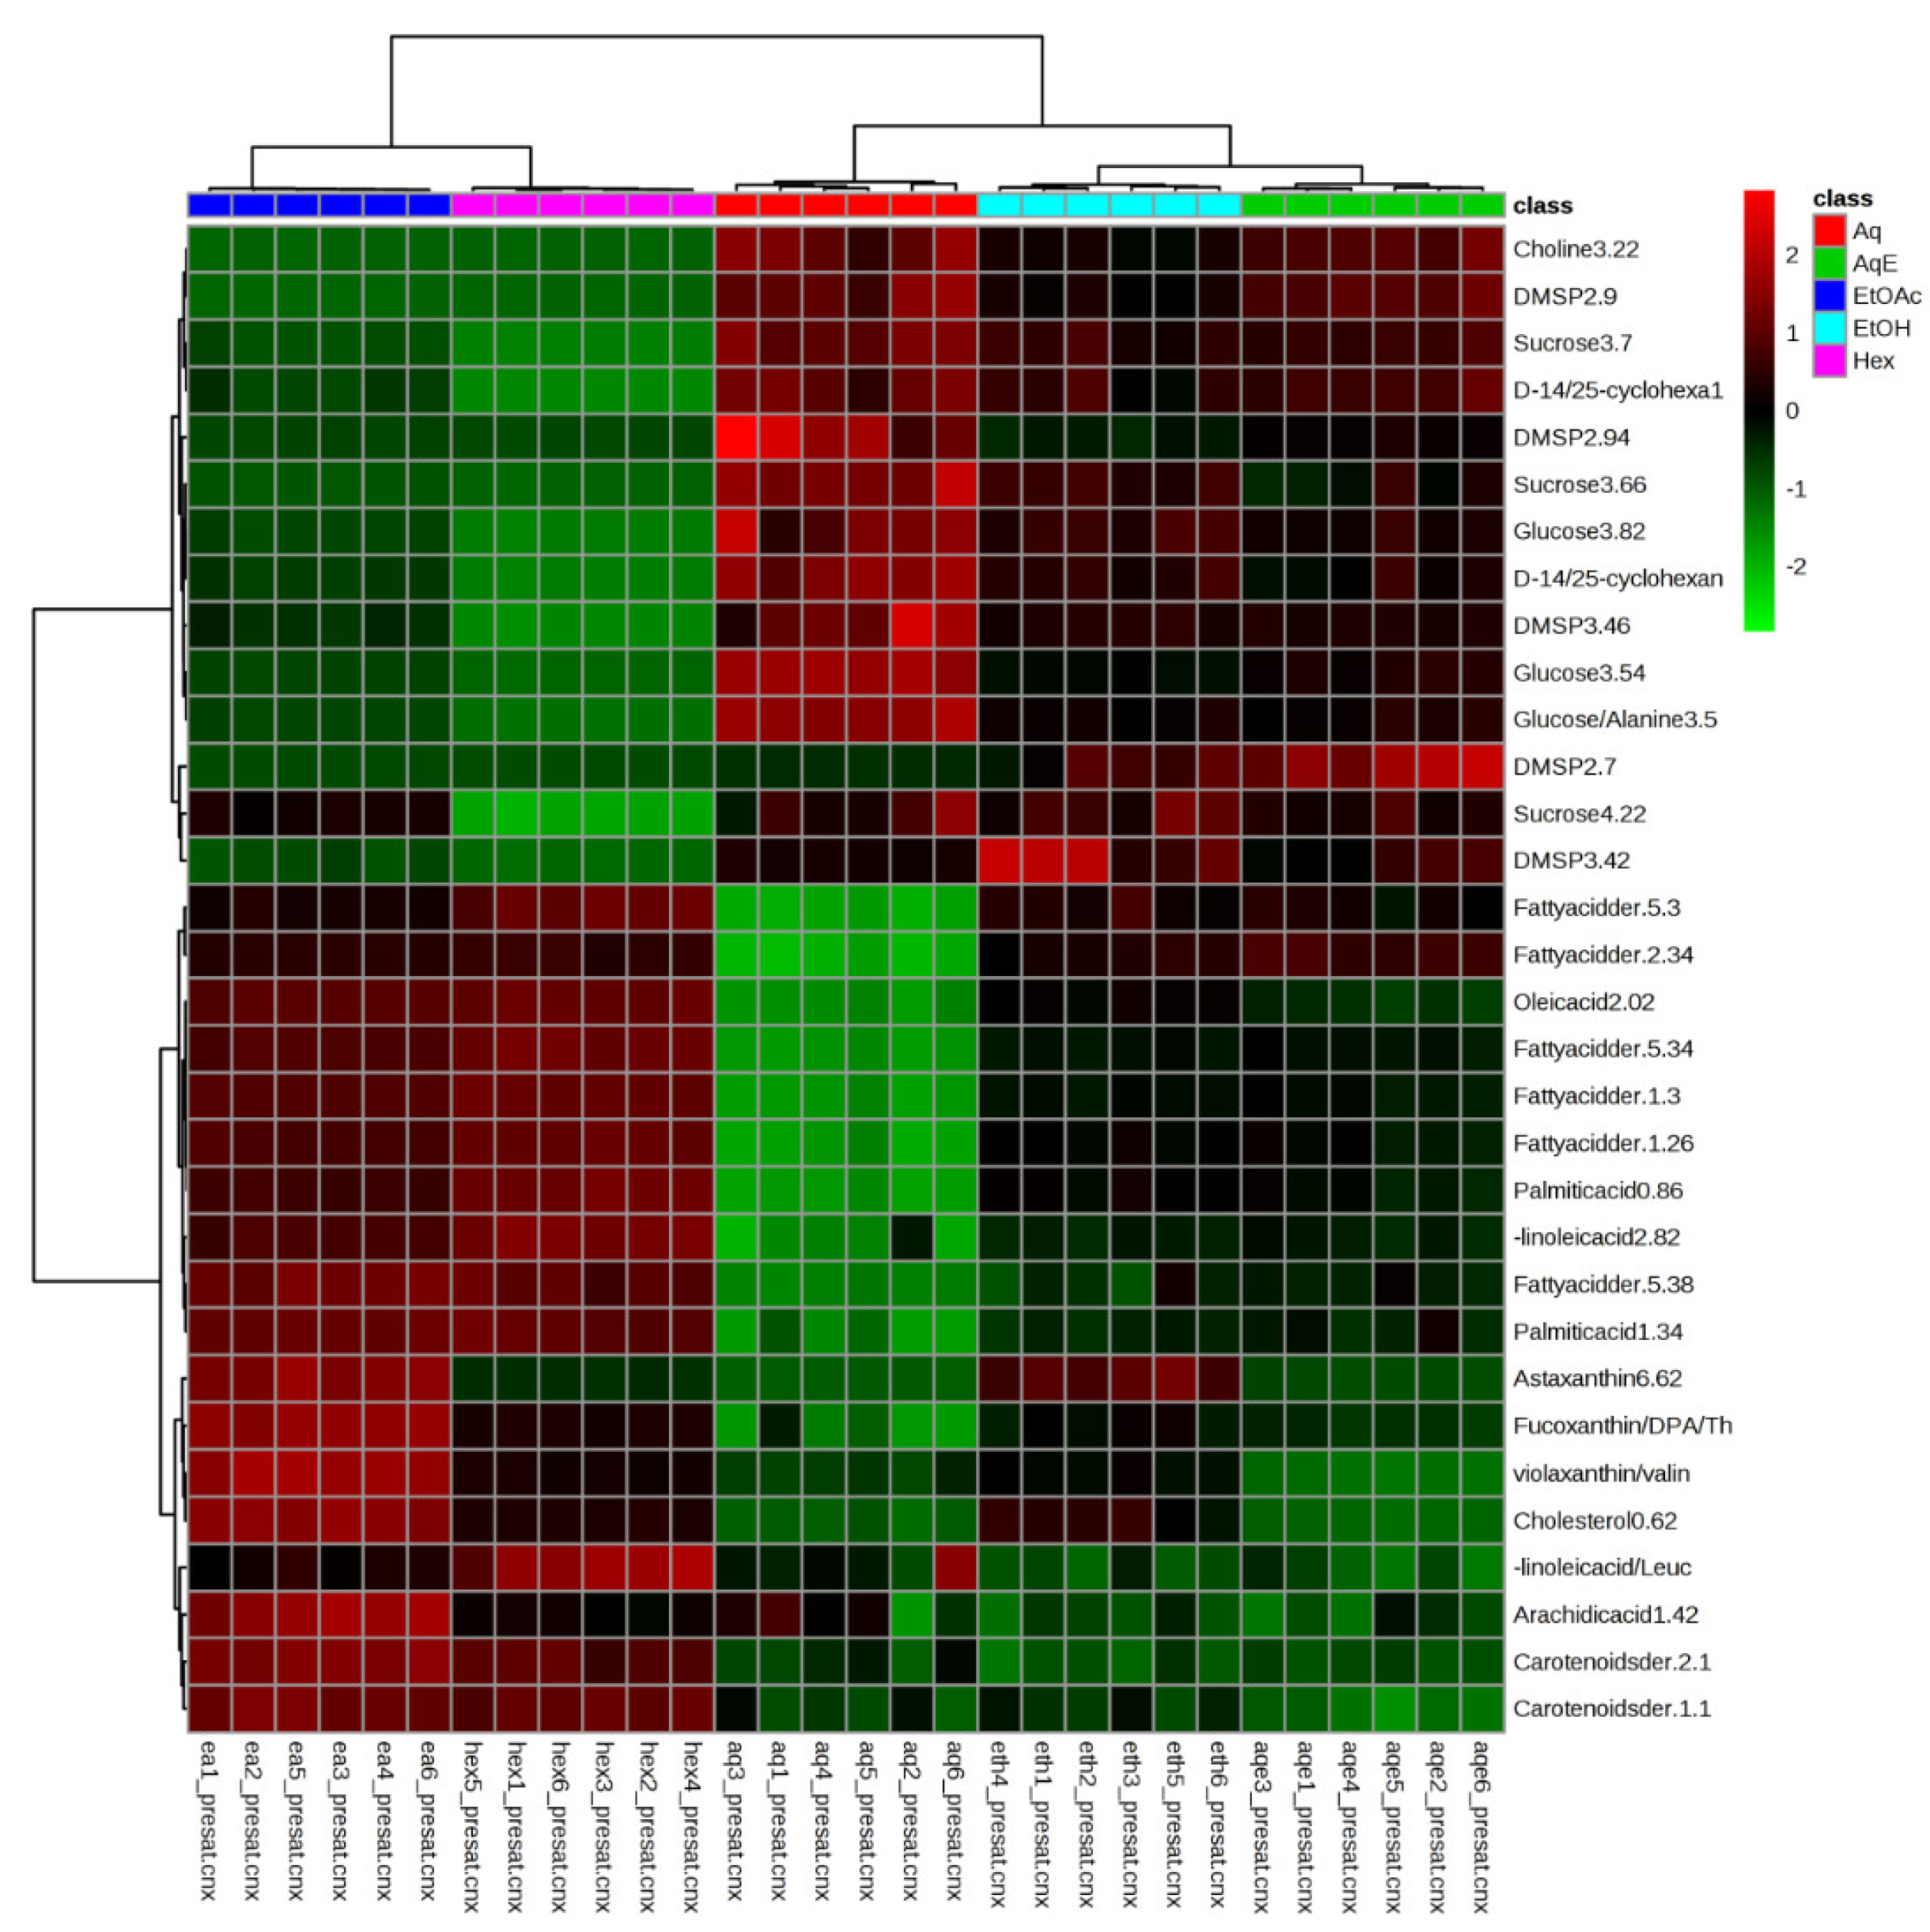
2.2. Discriminative Analysis of Solvent Extracts Based on 1H NMR Data
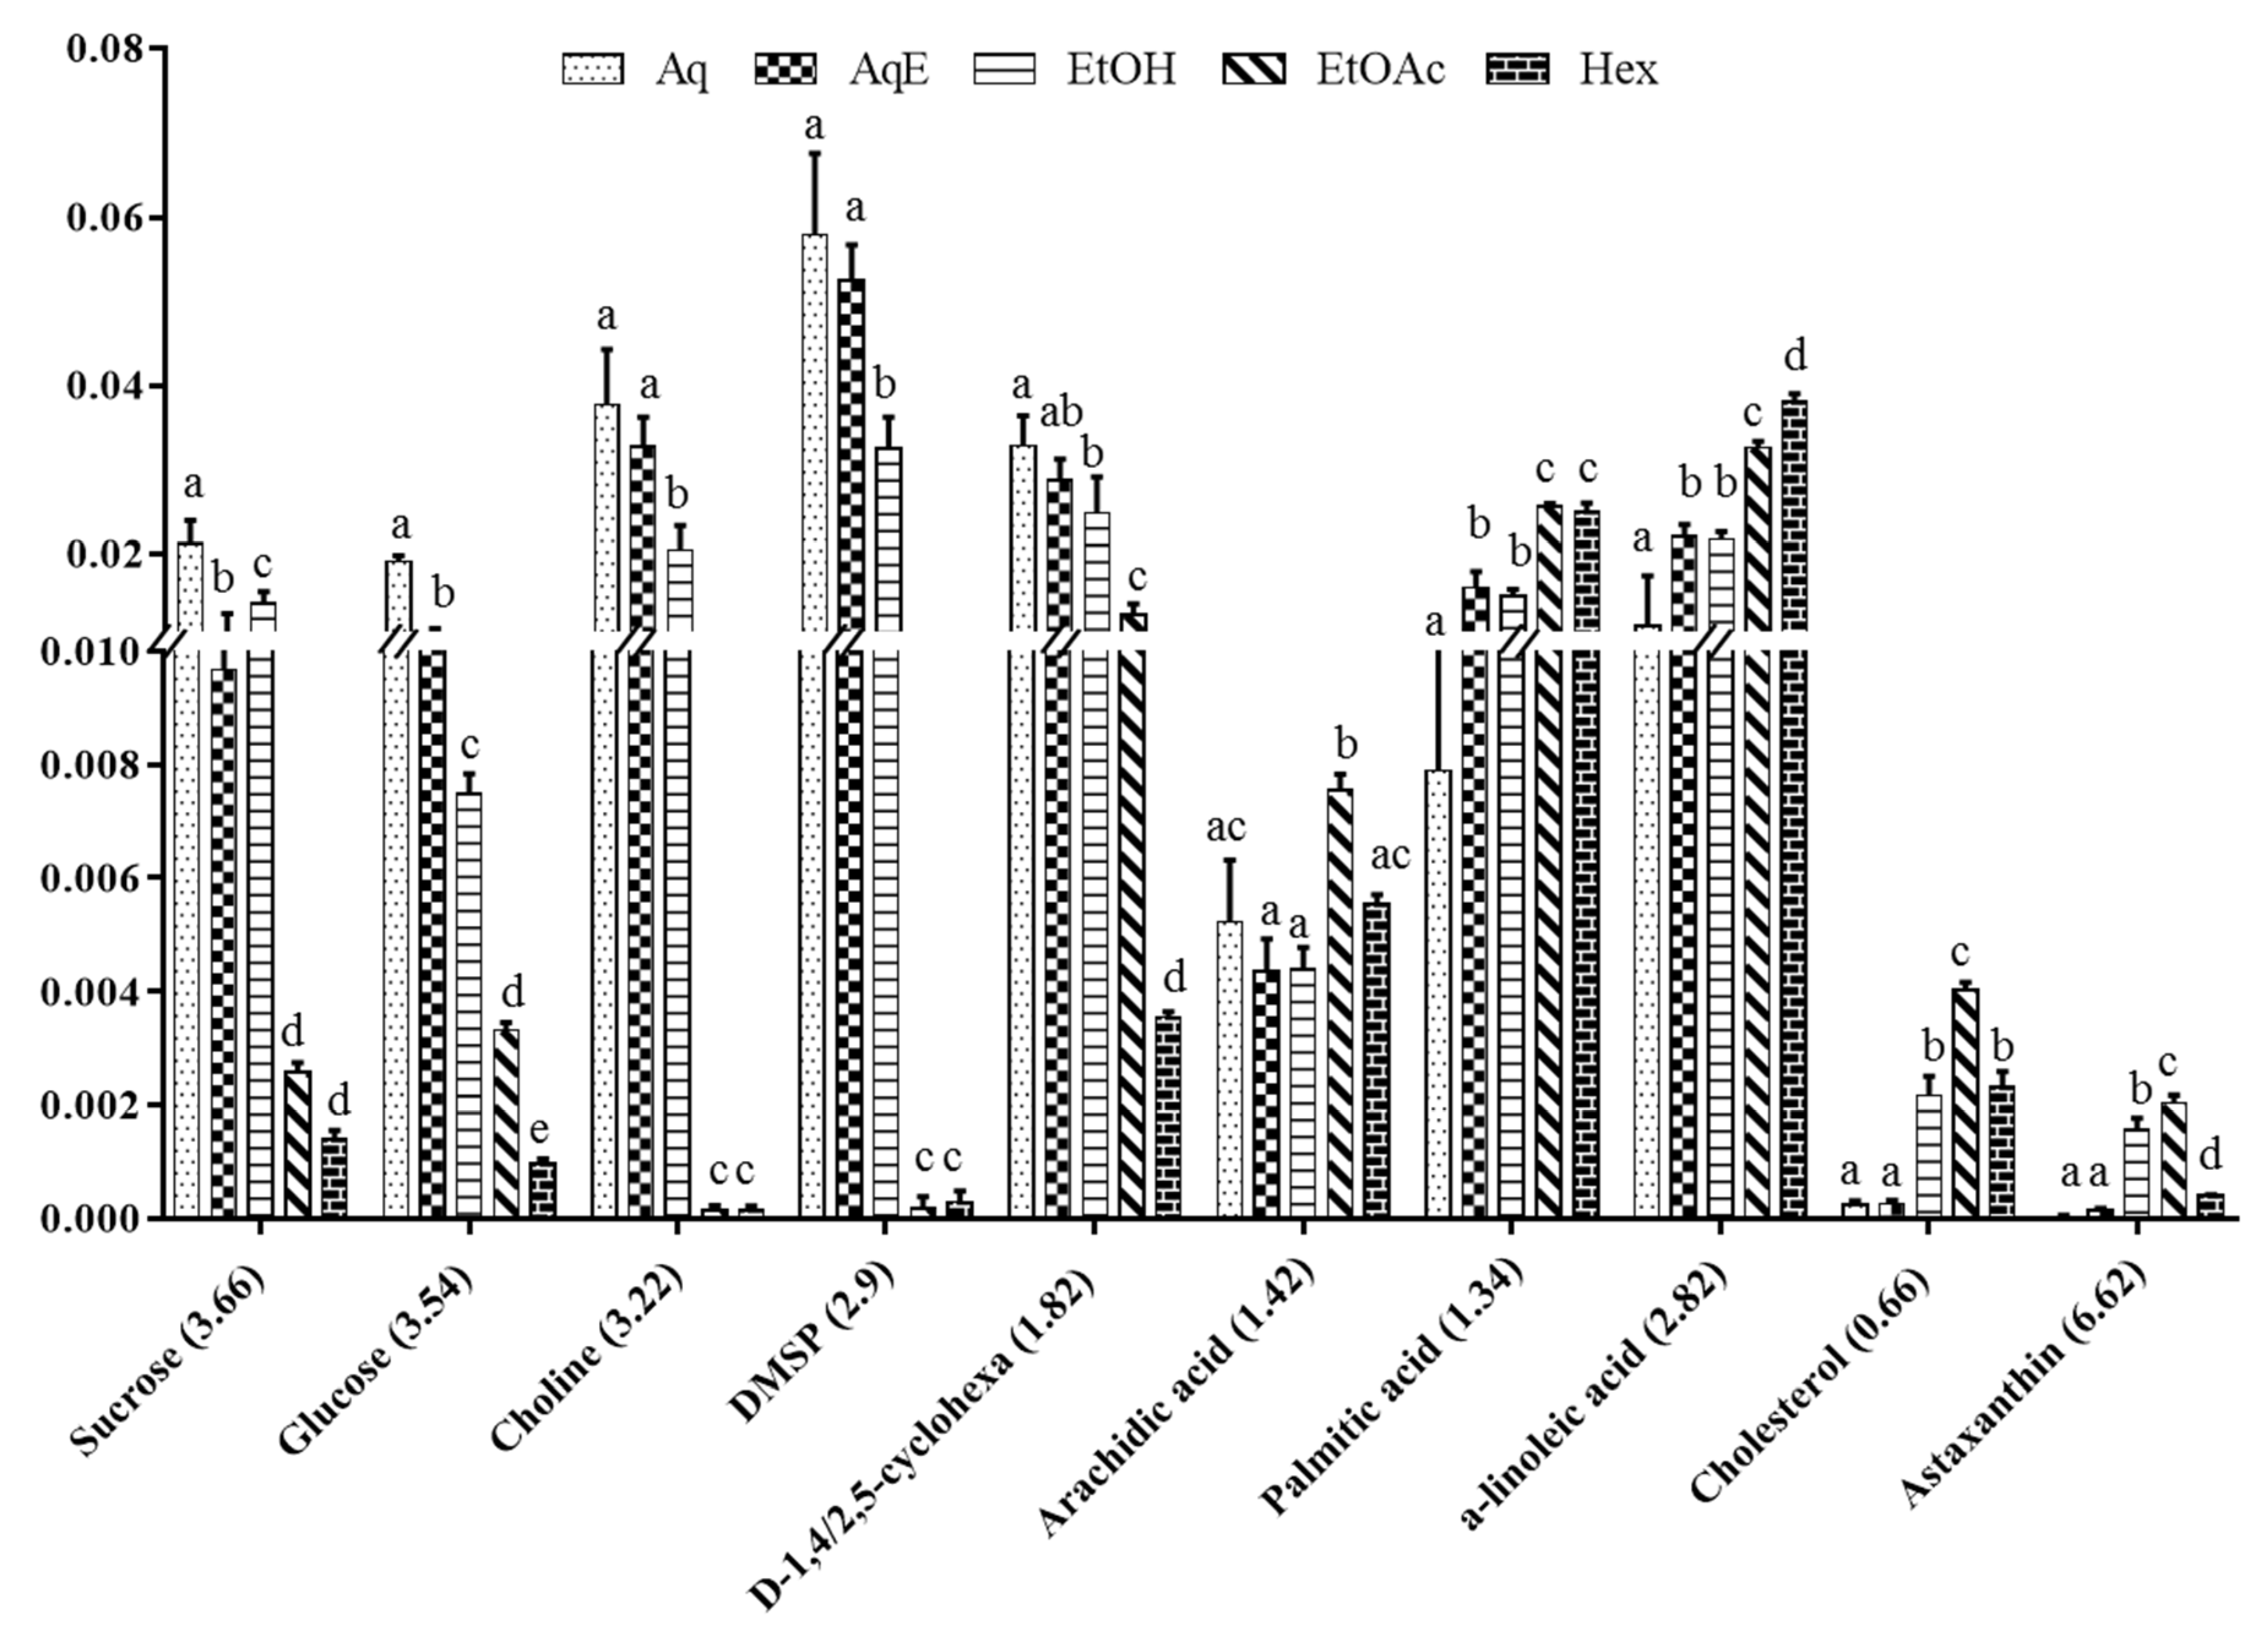
2.3. Relative Quantification
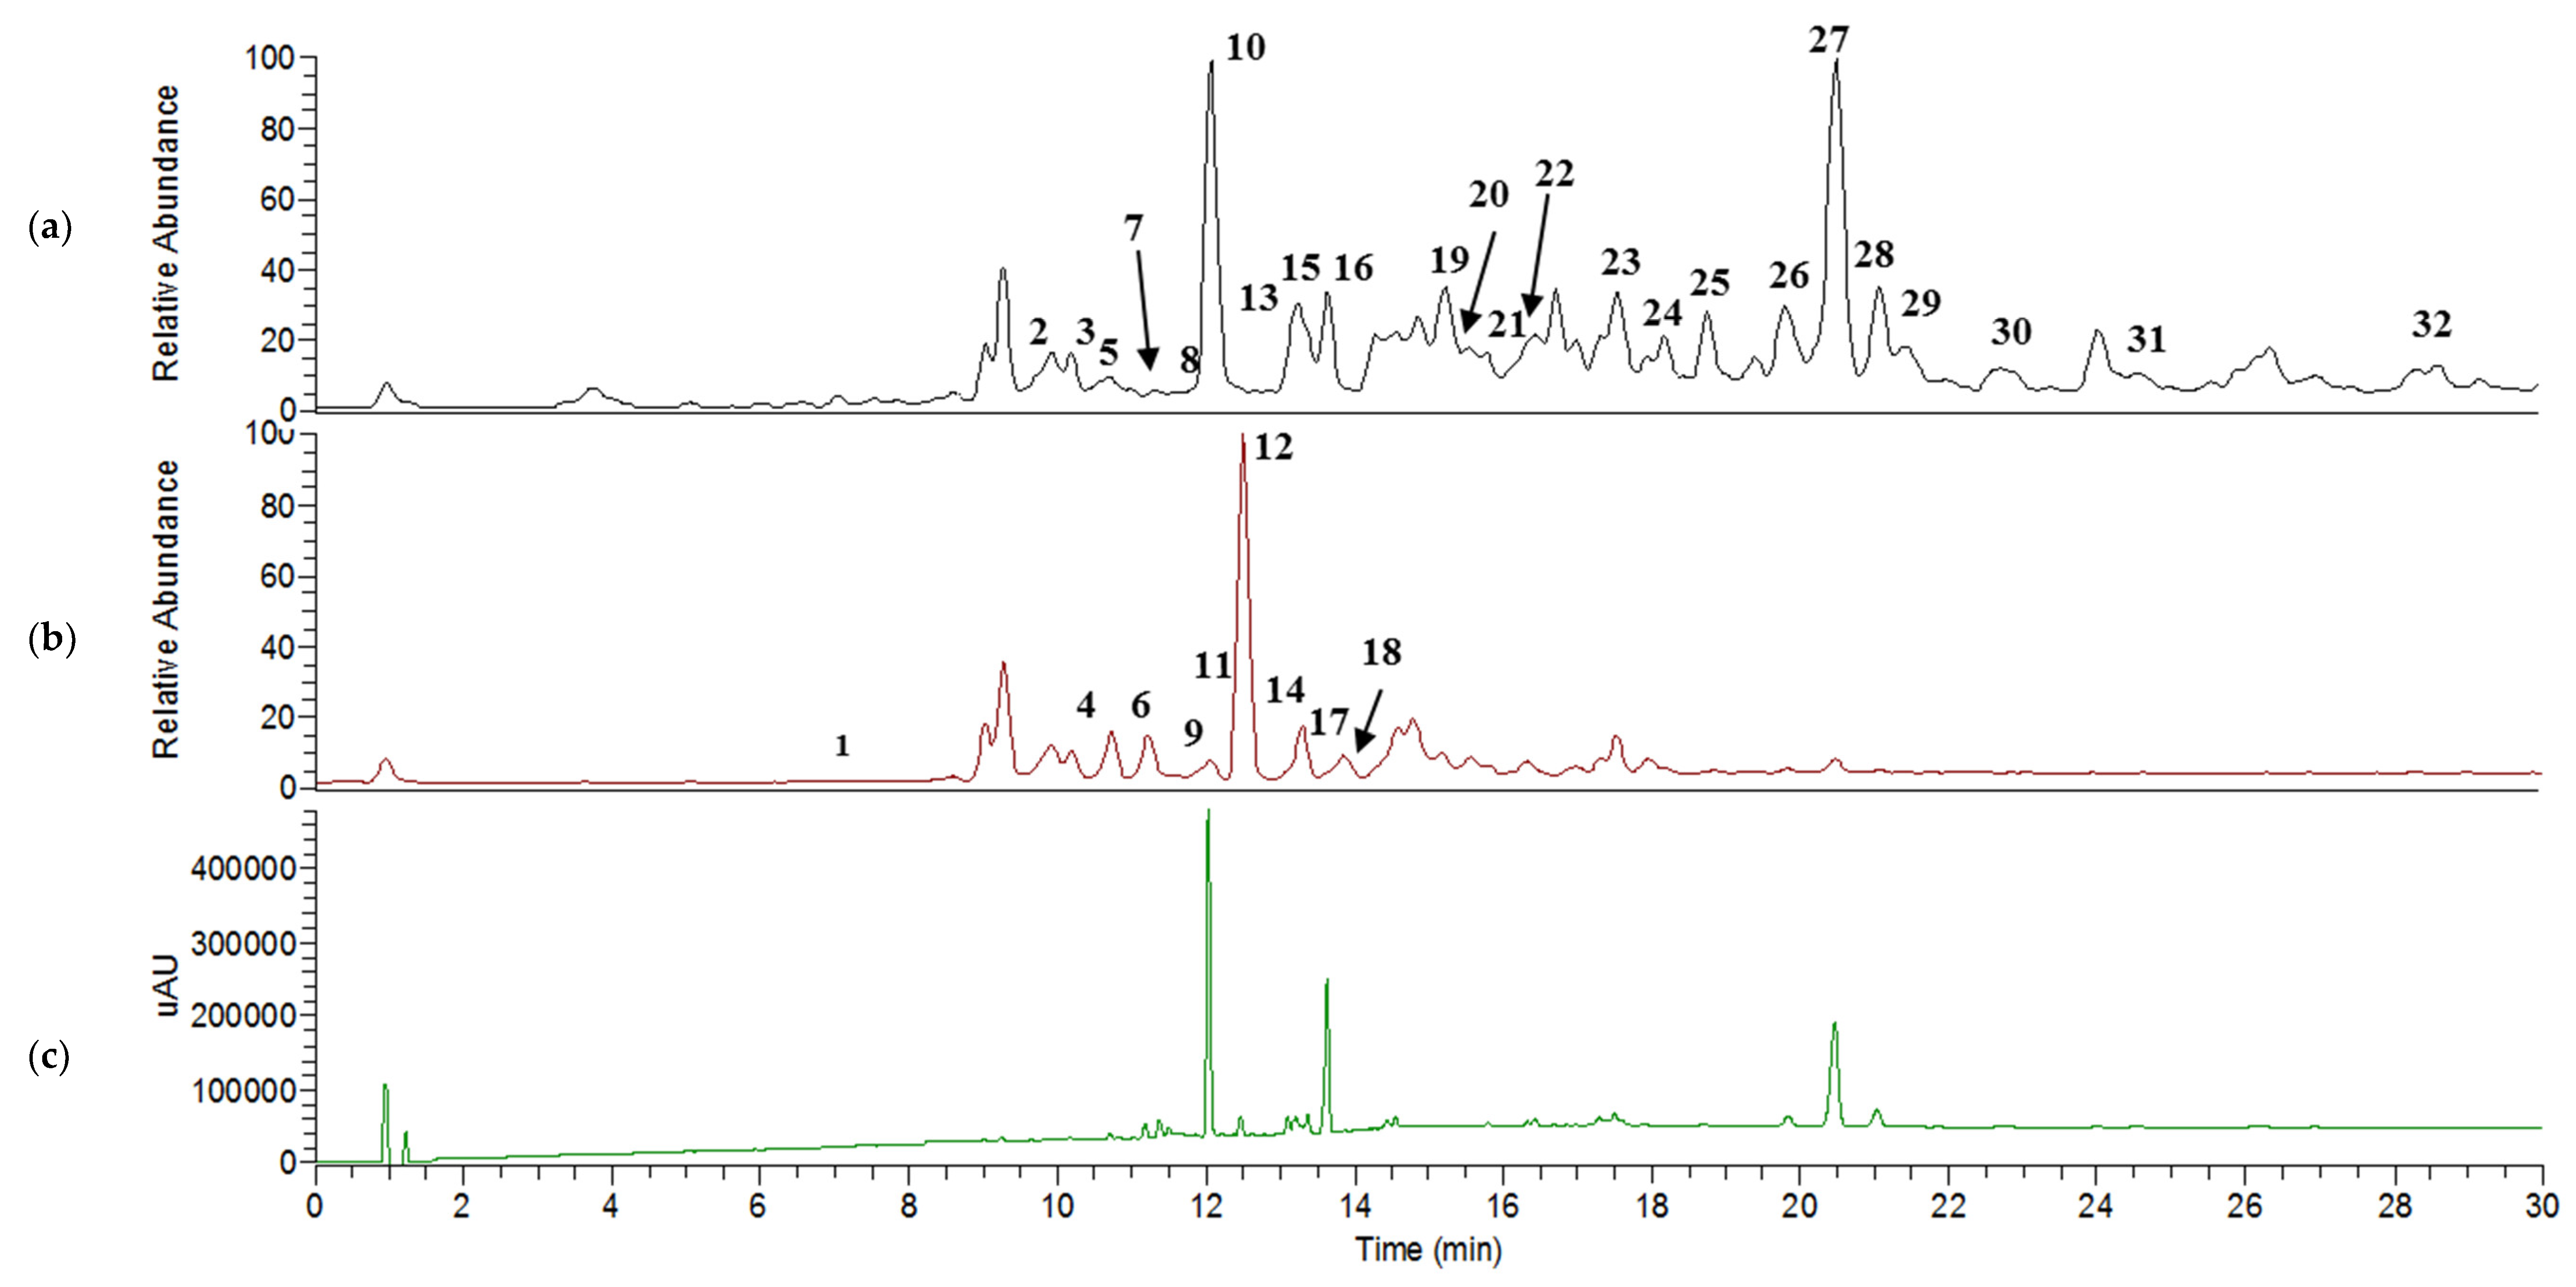
2.4. UHPLC–MS/MS Analysis
Metabolite Identification in Positive and Negative Ion Mode
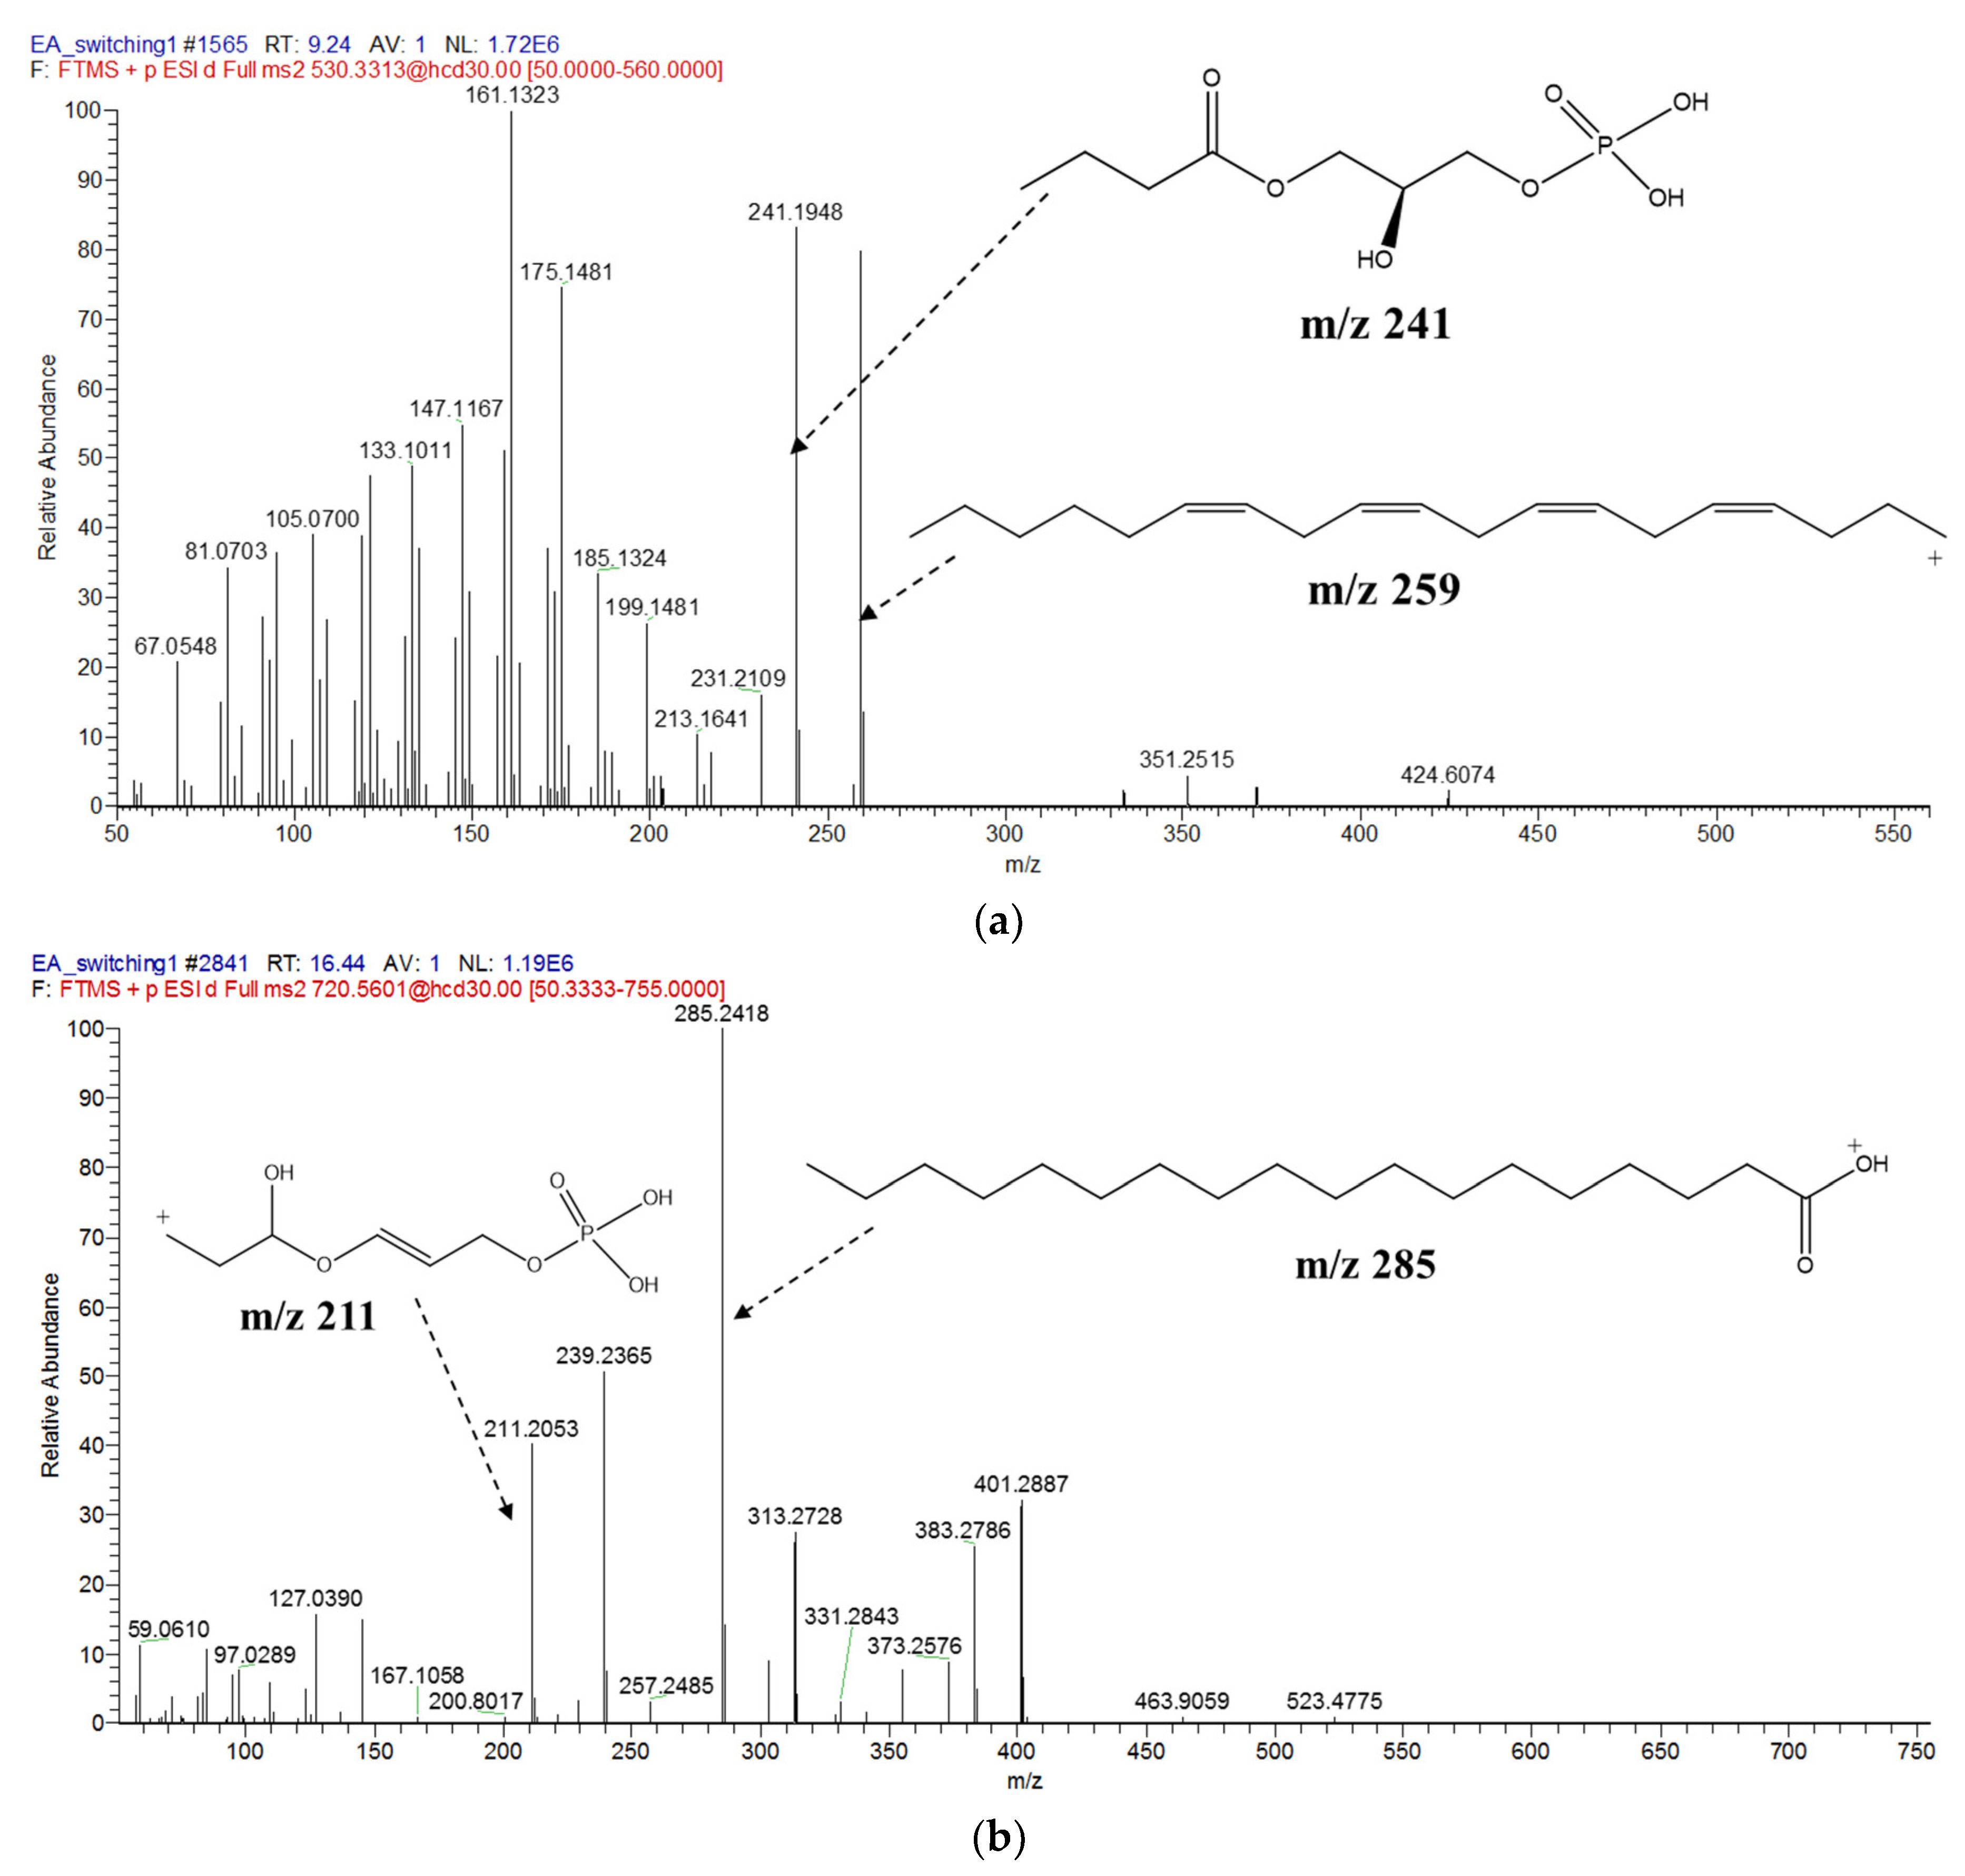
2.5. MS/MS-Based Molecular Networking
2.6. Correlation between NMR and UHPLC–MS/MS Data
3. Materials and Methods
3.1. Microalgae Culture and Harvest
3.2. Preparation of Solvent Extracts
3.3. Spectroscopic Measurements
3.3.1. 1H NMR Analysis
3.3.2. LCMS/MS Analysis
3.4. Data Processing and Multivariate Data Analysis
3.5. Molecular Networking
3.6. Statistical Analysis
4. Conclusions
Supplementary Materials
Author Contributions
Funding
Institutional Review Board Statement
Informed Consent Statement
Acknowledgments
Conflicts of Interest
References
- Thurman, H.V. Introductory Oceanography; Prentice Hall College: Upper Saddle River, NJ, USA, 1997. [Google Scholar]
- Meireles, L.; Guedes, A.; Malcata, F. Lipid class composition of the microalga Pavlova lutheri: Eicosapentaenoic and docosahexaenoic acids. J. Agric. Food Chem. 2003, 51, 2237–2241. [Google Scholar] [CrossRef] [PubMed]
- Babuskin, S.; Radhakrishnan, K. Effect of photoperiod, light intensity and carbon sources on biomass and lipid productivities of Isochrysis galbana. Biotechnol. Lett. 2014, 36, 1653–1660. [Google Scholar] [CrossRef]
- Devos, M.; Poisson, L.; Ergan, F.; Pencreac’h, G. Enzymatic hydrolysis of phospholipids from Isochrysis galbana for docosahexaenoic acid enrichment. Enzym. Microb. Technol. 2006, 39, 548–554. [Google Scholar] [CrossRef]
- Lin, Y.; Chang, F.; Tsao, C.; Leu, J.Y. Influence of growth phase and nutrient source on fatty acid composition of Isochrysis galbana CCMP 1324 in a batch photoreactor. Biochem. Eng. J. 2007, 37, 166–176. [Google Scholar] [CrossRef]
- Liu, J.; Sommerfeld, M.; Hu, Q. Screening and characterization of Isochrysis strains and optimization of culture conditions for docosahexaenoic acid production. Appl. Microbiol. Biotechnol. 2013, 97, 4785–4798. [Google Scholar] [CrossRef]
- Nuno, K.; Vilarruel-Lopez, A.; Puebla-Perez, A.M.; Romero-Velarde, E.; Puebla-Mora, A.G.; Ascencio, F. Effects of the marine microalgae Isochrysis galbana and Nannochloropsis oculata in diabetic rats. J. Funct. Foods 2013, 5, 106–115. [Google Scholar] [CrossRef]
- Benemann, J. Microalgae aquaculture feeds. J. Appl. Phycol. 1992, 4, 233–245. [Google Scholar] [CrossRef]
- Brown, M. Nutritional value and use of microalgae in aquaculture. In Proceedings of the Avances en Nutrición Acuícola VI. Memorias del VI Simposium Internacional de Nutrición Acuícola, Cancún, Mexico, 3–6 September 2002; pp. 281–292. [Google Scholar]
- Pulz, O.; Gross, W. Valuable products from biotechnology of microalgae. Appl. Microbiol. Biotechnol. 2004, 65, 635–648. [Google Scholar] [CrossRef] [PubMed]
- Utting, S.; Millican, P. Techniques for the hatchery conditioning of bivalve broodstocks and the subsequent effect on egg quality and larval viability. Aquaculture 1997, 155, 45–54. [Google Scholar] [CrossRef]
- Rico-villa, B.; Woerther, P.; Mingant, C.; Pouvreau, S.; Hamon, M.; Robert, R. A flow-through rearing system for ecophysiological studies of pacific oyster Crassostrea gigas larvae. Aquaculture 2008, 282, 54–60. [Google Scholar] [CrossRef] [Green Version]
- Ragg, N.; King, N.; Watts, E.; Morrish, J. Optimising the delivery of the key dietary diatom Chaetoceros calcitrans to intensively cultured Greenshell (TM) mussel larvae, Perna canaliculus. Aquaculture 2010, 306, 270–280. [Google Scholar] [CrossRef]
- Kwak, J.H.; Baek, S.H.; Woo, Y.; Han, J.K.; Kim, B.G.; Kim, O.Y.; Lee, J.H. Beneficial immunostimulatory effect of short-term Chlorella supplementation: Enhancement of natural killer cell activity and early inflammatory response (randomized, double- blinded placebo-controlled trial). Nutr. J. 2012, 11, 53. [Google Scholar] [CrossRef] [PubMed] [Green Version]
- Adel, M.; Yeganeh, S.; Dadar, M.; Sakai, M.; Dawood, M.A.O. Effects of dietary Spirulina platensis on growth performance, humoral and mucosal immune responses and disease resistance in juvenile great sturgeon (Huso huso Linnaeus, 1754). Fish Shellfish Immunol. 2016, 56, 436–444. [Google Scholar] [CrossRef] [PubMed]
- Fadl, S.E.; Elgohary, M.S.; Elsadany, A.Y.; Gad, D.M.; Hanaa, F.F.; El-habashi, N.M. Contribution of microalgae-enriched fodder for the Nile tilapia to growth and resistance to infection with Aeromonas hydrophila. Algal Res. 2017, 27, 82–88. [Google Scholar] [CrossRef]
- Galal, A.A.A.; Reda, R.M.; Mohamed, A.A. Influences of Chlorella vulgaris dietary supplementation on growth performance, hematology, immune response and disease resistance in Oreochromis niloticus exposed to sub-lethal concentrations of penoxsulam herbicide. Fish Shellfish Immunol. 2018, 77, 445–456. [Google Scholar] [CrossRef] [PubMed]
- Grima, E.M.; Perez, J.A.U.; Camacho, F.G.; Fernbndez, F.G.A.; Alonso, D.L.; Castillo, C.I.S. Preservation of the marine microalga, Isochrysis galbana: Influence on the fatty acid profile. Aquaculture 1994, 123, 377–385. [Google Scholar] [CrossRef]
- Cho, J.Y.; Jin, H.; Lim, H.J.; Whyte, J.N.C.; Hong, Y. Growth activation of the microalga Isochrysis galbana by the aqueous extract of the seaweed Monostroma nitidum. J. Appl. Phycol. 1999, 10, 561–567. [Google Scholar] [CrossRef]
- Valenzuela-Espinoza, E.; Millan-Nunez, R.; Nunez-Cebrero, F. Protein, carbohydrate, lipid and chlorophyll a content in Isochrysis aff. galbana (clone T-Iso) cultured with a low cost alternative to the f/2 medium. Aquac. Eng. 2002, 25, 207–216. [Google Scholar] [CrossRef]
- Goh, L.P.; Loh, S.P.; Fatimah, M.Y.; Perumal, K. Bioaccessibility of carotenoids and tocopherols in marine microalgae, Nannochloropsis sp. and Chaetoceros sp. Malays. J. Nutr. 2009, 15, 77–86. [Google Scholar]
- Mimouni, V.; Ulmann, L.; Pasquet, V.; Mathieu, M.; Picot, L.; Bougaran, G.; Cadoret, J.-P.; Morant-Manceau, A.; Schoefs, B. The potential of microalgae for the production of bioactive molecules of pharmaceutical interest. Curr. Pharm. Biotechnol. 2012, 13, 2733–2750. [Google Scholar] [CrossRef]
- Zakar, T.; Laczko-Dobos, H.; Toth, T.N.; Gombos, Z. Carotenoids assist in cyanobacterial photosystem II assembly and function. Front. Plant Sci. 2016, 7, 295. [Google Scholar] [CrossRef] [Green Version]
- Matos, J.; Cardoso, C.; Bandarra, N.M.; Afonso, C. Microalgae as a healthy ingredient for functional food: A review. Food Funct. 2017, 8, 2672–2685. [Google Scholar] [CrossRef]
- Ahmed, F.; Fanning, K.; Netzel, M.; Turner, W.; Li, Y.; Schenk, P.M. Profiling of carotenoids and antioxidant capacity of microalgae from subtropical coastal and brackish waters. Food Chem. 2014, 165, 300–306. [Google Scholar] [CrossRef] [PubMed] [Green Version]
- Batista, A.P.; Gouveia, L.; Bandarra, N.M.; Franco, J.M.; Raymundo, A. Comparison of microalgal biomass profiles as novel functional ingredient for food products. Algal Res. 2013, 2, 164–173. [Google Scholar] [CrossRef] [Green Version]
- Maadane, A.; Merghoub, N.; Ainane, T.; El Arroussi, H.; Benhima, R.; Amzazi, S.; Bakri, Y.; Wahby, I. Antioxidant activity of some Moroccan marine microalgae: Pufa profiles, carotenoids and phenolic content. J. Biotechnol. 2015, 215, 13–19. [Google Scholar] [CrossRef]
- Nedbalová, L.; Střížek, A.; Sigler, K.; Řezanka, T. Effect of salinity on the fatty acid and triacylglycerol composition of five haptophyte algae from the genera Coccolithophora, Isochrysis and Prymnesium determined by LC-MS/APCI. Phytochemistry 2016, 130, 64–76. [Google Scholar] [CrossRef] [PubMed]
- Aguilera-Sáez, L.M.; Abreu, A.C.; Camacho-Rodríguez, J.; González-López, C.V.; Del Carmen Cerón-García, M.; Fernández, I. NMR Metabolomics as an Effective Tool to Unravel the Effect of Light Intensity and Temperature on the Composition of the Marine Microalgae Isochrysis galbana. J. Agric. Food Chem. 2019, 67, 3879–3889. [Google Scholar] [CrossRef]
- Lu, W.; Su, X.; Klein, M.S.; Lewis, I.A.; Fiehn, O.; Rabinowitz, J.D. Metabolite Measurement: Pitfalls to Avoid and Practices to Follow. Annu. Rev. Biochem. 2017, 86, 277–304. [Google Scholar] [CrossRef]
- Ibanez, C.; Simo, C.; Barupal, D.; Al, E. A new metabolomic workflow for early detection of Alzheimer’s disease. J. Chromatogr. A 2013, 1302, 65–71. [Google Scholar] [CrossRef] [PubMed]
- Farag, M.; Wessjohann, L. Metabolome classification of commercial hypericum perforatum (St. John’s Wort) preparations via UPLC-qTOF-MS and chemometrics. Planta Med. 2012, 78, 488–496. [Google Scholar] [CrossRef] [PubMed]
- Ali, K.; Iqbal, M.; Yuliana, N.; Al, E. Identification of bioactive metabolites against adenosine A1 receptor using NMR-based metabolomics. Metabolomics 2013, 9, 778–785. [Google Scholar] [CrossRef]
- Schripsema, J. Application of NMR in plant metabolomics: Techniques, problems and prospects. Phytochem. Anal. 2010, 21, 14–21. [Google Scholar] [CrossRef] [PubMed]
- Kim, H.; Choi, Y.; Verpoorte, R. NMR-based plant metabolomics: Where do we stand, where do we go? Trends Biotechnol. 2011, 29, 267–275. [Google Scholar] [CrossRef]
- Pan, Z.; Raftery, D. Comparing and combining NMR spectroscopy and mass spectrometry in metabolomics. Anal. Bioanal. Chem. 2007, 387, 525–527. [Google Scholar] [CrossRef]
- Quinn, R.A.; Nothias, L.F.; Vining, O.; Meehan, M.; Esquenazi, E.; Dorrestein, P.C. Molecular networking as a drug discovery, drug metabolism and precision medicine strategy. Trends Pharmacol. Sci. 2017, 38, 143–154. [Google Scholar] [CrossRef]
- Traxler, M.F.; Kolter, R. A massively spectacular view of the chemical lives of microbes. Proc. Natl. Acad. Sci. USA 2012, 109, 10128–10129. [Google Scholar] [CrossRef] [PubMed] [Green Version]
- Watrous, J.; Roach, P.; Alexandrov, T.; Heath, B.S.; Yang, J.Y.; Kersten, R.D.; van der Voort, M.; Pogliano, K.; Gross, H.; Raaijmakers, J. Mass spectral molecular networking of living microbial colonies. Proc. Natl. Acad. Sci. USA 2012, 109, E1743–E1752. [Google Scholar] [CrossRef] [PubMed] [Green Version]
- Pantami, H.A.; Bustamam, M.S.A.; Lee, S.Y.; Ismail, I.S.; Faudzi, S.M.M.; Nakakuni, M.; Shaari, K. Comprehensive GCMS and LC-MS/MS metabolite profiling of chlorella vulgaris. Mar. Drugs 2020, 18, 367. [Google Scholar] [CrossRef]
- Lv, M.; Lo, C.; Hsu, C.C.; Wang, Y.; Chiang, Y.R.; Sun, Q.; Wu, Y.; Li, Y.; Chen, L.; Yu, C.P. Identification of enantiomeric byproducts during microalgae-mediated transformation of metoprolol by MS/MS spectrum based networking. Front. Microbiol. 2018, 9, 2115. [Google Scholar] [CrossRef] [PubMed]
- Buedenbender, L.; Astone, F.A.; Tasdemir, D. Bioactive molecular networking for mapping the antimicrobial constituents of the baltic brown alga fucus vesiculosus. Mar. Drugs 2020, 18, 311. [Google Scholar] [CrossRef]
- Wei, L.; Mediani, A.; Khaleeda, N.; Zolke, Z.; Wei, S.; Sa, I.; Shaari, K.; Abas, F. Phytochemistry Letters Phytochemical diversity of Clinacanthus nutans extracts and their bioactivity correlations elucidated by NMR based metabolomics. Phytochem. Lett. 2015, 14, 123–133. [Google Scholar]
- Chengxu, Z.; Jie, L.; Yangfang, Y.; Xiaojun, Y.; Baoning, L.; Xin, W. The metabolite profi ling of coastal coccolithophorid species Pleurochrysis carterae (Haptophyta). Chin. J. Oceanol. Limnol. 2016, 34, 749–756. [Google Scholar]
- Azizan, A.; Safwan, M.; Bustamam, A.; Maulidiani, M.; Shaari, K.; Ismail, I.S.; Nagao, N.; Abas, F. Metabolite Profiling of the Microalgal Diatom Chaetoceros Calcitrans and Correlation with Antioxidant and Nitric Oxide Inhibitory Activities via 1H NMR-Based Metabolomics. Mar. Drugs 2018, 16, 154. [Google Scholar] [CrossRef] [Green Version]
- Iglesias, M.J.; Soengas, R.; Probert, I.; Guilloud, E.; Gourvil, P.; Mehiri, M.; López, Y.; Cepas, V.; Gutiérrez-del-río, I.; Redondo-blanco, S.; et al. NMR characterization and evaluation of antibacterial and antiobiofilm activity of organic extracts from stationary phase batch cultures of five five marine microalgae (Dunaliella sp., D. salina, Chaetoceros calcitrans, C. gracilis and Tisochrysis lutea). Phytochemistry 2019, 164, 192–205. [Google Scholar] [CrossRef]
- Pariyani, R.; Ismail, S.; Azam, A.; Abas, F.; Shaari, K. Identification of the compositional changes in Orthosiphon stamineus leaves triggered by different drying techniques using 1H NMR metabolomics. J. Sci. Food Agric. 2017, 97, 4169–4179. [Google Scholar] [CrossRef] [PubMed]
- Fidalgo, J.P.; Cid, A.; Torres, E.; Sukenik, A.; Herrero, C. Effects of nitrogen source and growth phase on proximate bio- chemical composition, lipis classes and fatty acid profile of the marine microalga Isochryis galbana. Aquaculture 1998, 166, 105–116. [Google Scholar] [CrossRef] [Green Version]
- Tzovenis, I.; de Pauw, N.; Sorgeloos, P. Optimisation of T-ISO biomass production rich in essential fatty acids: I. Effect of different light regimes on growth and biomass production. Aquaculture 2003, 216, 203–222. [Google Scholar] [CrossRef]
- Adarme-Vega, T.C.; Lim, D.K.Y.; Timmins, M.; Vernen, F.; Li, Y.; Schenk, P.M. Microalgal biofactories: A promising approach towards sustainable omega-3 fatty acid production. Microb. Cell Fact. 2012, 11, 96. [Google Scholar] [CrossRef] [PubMed] [Green Version]
- Englert, G.; Bjørnland, T.; Liaaen-Jensen, S. 1D and 2D NMR study of some allenic carotenoids of the fucoxanthin series. Magn. Reson. Chem. 1990, 28, 519–528. [Google Scholar] [CrossRef]
- Abraham, R.J.; Rowan, A.E. Nuclear magnetic resonance spectroscopy of Chlorophyll. In Chlorophylls; Hugo, S., Ed.; CRC Press: Boca Raton, FL, USA, 1991; pp. 797–834. [Google Scholar]
- Nakamura, H.; Sawada, K.; Araie, H.; Suzuki, I.; Shiraiwa, Y. n-Nonacosadienes from the marine haptophytes Emiliania huxleyi and Gephyrocapsa oceanica. Phytochemistry 2015, 111, 107–113. [Google Scholar] [CrossRef] [Green Version]
- Rechka, J.A.; Maxwell, J.R. Characterisation of Alkenone Temperature Indicators in Sediments and Organisms. Org. Geochem. 1988, 13, 727–734. [Google Scholar] [CrossRef]
- Richter, N.; Longo, W.M.; George, S.; Shipunova, A.; Huang, Y.; Amaral, Z.L. Phylogenetic diversity in freshwater-dwelling Isochrysidales haptophytes with implications for alkenone production. Geobiology 2019, 17, 272–280. [Google Scholar] [CrossRef] [Green Version]
- Emwas, A.-H.M.; Salek, R.M.; Griffin, J.L.; Merzaban, J. NMR-based metabolomics in human disease diagnosis: Applications, limitations, and recommendations. Metabolomics 2013, 9, 1048–1072. [Google Scholar] [CrossRef]
- Chen, C.; Krausz, K.W.; Shah, Y.M.; Idle, J.R.; Frank, J. Gonzalez Serum Metabolomics Reveals Irreversible Inhibition of Fatty Acid β-Oxidation through the Suppression of PPARα Activation as a Contributing Mechanism of Acetaminophen-Induced Hepatotoxicity. Chem. Res. Toxicol. 2009, 22, 699–707. [Google Scholar] [CrossRef] [Green Version]
- Eriksson, L.; Johansson, E.; Kettaneh-Wold, N.; Trygg, J.; Wikstrom, C.; Wold, S. Multi- and Megavariate Data Analysis Part 1: Basic Principles and Applications; Umetrics Academy: Umeå, Sweden, 2006. [Google Scholar]
- Woo, H.M.; Kim, K.M.; Choi, M.H.; Jung, B.H.; Lee, J.; Kong, G.; Nam, S.J.; Kim, S.; Bai, S.W.; Chung, B.C. Mass spectrometry based metabolomic approaches in urinary biomarker study of women’s cancers. Clin. Chim. Acta 2009, 400, 63–69. [Google Scholar] [CrossRef] [PubMed]
- Abdul-hamid, N.A.; Abas, F.; Ismail, I.S.; Shaari, K.; Lajis, N.H. Influence of Different Drying Treatments and Extraction Solvents on the Metabolite Profile and Nitric Oxide Inhibitory Activity of Ajwa Dates. J. Food Sci. 2015, 80, 603–611. [Google Scholar] [CrossRef] [PubMed]
- Kim, S.M.; Jung, Y.; Kwon, O. A Potential Commercial Source of Fucoxanthin Extracted from the Microalga Phaeodactylum tricornutum. Appl. Biochem. Biotechnol. 2012, 166, 1843–1855. [Google Scholar] [CrossRef] [PubMed]
- Min, S.; Kang, K.S.; Donghwa, O.K.; Pan, C.C. Fucoxanthin as a major carotenoid in Isochrysis aff. galbana: Characterization of extraction for commercial application. J. Korean Soc. Appl. Biol. Chem. 2012, 55, 477–483. [Google Scholar] [CrossRef]
- Altemimi, A.; Lakhssassi, N.; Baharlouei, A.; Watson, D.G.; Lightfoot, D.A. Phytochemicals: Extraction, isolation, and identification of bioactive compounds from plant extracts. Plants 2017, 6, 42. [Google Scholar] [CrossRef]
- Bart, H.J.; Pilz, S. Industrial Scale Natural Products Extraction, 1st ed.; Wiley-VCH Verlag GmbH & Co.: Weinheim, Germany, 2011. [Google Scholar]
- Tolonen, A.; Uusitalo, J. Fast screening method for the analysis of total flavonoid content in plants and foodstuffs by high-performance liquid chromatography/electrospray ionization time-of-flight mass spectrometry with polarity switching. Rapid Commun. Mass Spectrom. 2004, 18, 3113–3122. [Google Scholar] [CrossRef]
- Cai, F.; Xu, W.; Wei, H.; Sun, L.; Gao, S.; Yang, Q.; Feng, J.; Zhang, F.; Chen, W. Simultaneous determination of active xanthone glycosides, timosaponins and alkaloids in rat plasma after oral administration of Zi-Shen Pill extract for the pharmacokinetic study by liquid chromatography-tandem mass spectrometry. J. Chromatogr. B 2010, 878, 1845–1854. [Google Scholar] [CrossRef] [PubMed]
- Farag, M.; Huhman, D.; Lei, Z.; Sumner, L. Metabolic profiling and systematic identification of flavonoids and isoflavonoids in roots and cell suspension cultures of Medicago truncatula using HPLC-UV-ESI-MS and GC-MS. Phytochemistry 2007, 68, 342–354. [Google Scholar] [CrossRef] [PubMed]
- Nordström, A.; Want, E.; Northen, T.; Lehtiö, J.; Siuzdak, G. Multiple ionization mass spectrometry strategy used to reveal the complexity of metabolomics. Anal. Chem. 2008, 80, 421–429. [Google Scholar] [CrossRef]
- Yoshida, M.; Tanabe, Y.; Yonezawa, N.; Watanabe, M.M. Energy innovation potential of oleaginous microalgae. Biofuels 2012, 3, 761–781. [Google Scholar] [CrossRef]
- Ghioni, C.; Porter, A.E.A.; Sadler, I.H.; Tocher, D.R.; Sargent, J.R. Cultured fish cells metabolize octadecapentaenoic acid (all-cis δ3,6,9,12,15–18:5) to octadecatetraenoic acid (all-cis δ6,9,12,15–18:4) via its 2-trans intermediate (trans δ2, all-cis δ6,9,12,15–18:5). Lipids 2001, 36, 145–153. [Google Scholar] [CrossRef] [PubMed] [Green Version]
- Wu, S.; Zhou, J.; Xin, Y.; Xue, S. Nutritional stress effects under different nitrogen sources on the genes in microalga Isochrysis zhangjiangensis and the assistance of Alteromonas macleodii in releasing the stress of amino acid deficiency. J. Phycol. 2015, 51, 885–895. [Google Scholar] [CrossRef]
- Di Lena, G.; Casini, I.; Lucarini, M.; Lombardi-Boccia, G. Carotenoid profiling of five microalgae species from large-scale production. Food Res. Int. 2018, 120, 810–818. [Google Scholar] [CrossRef]
- Crupi, P.; Toci, A.T.; Mangini, S.; Wrubl, F.; Rodolfi, L.; Tredici, M.R.; Coletta, A.; Antonacci, D. Determination of fucoxanthin isomers in microalgae (Isochrysis sp.) by high-performance liquid chromatography coupled with diode-array detector multistage mass spectrometry coupled with positive electrospray ionization. Rapid Commun. Mass Spectrom. 2013, 27, 1027–1035. [Google Scholar] [CrossRef]
- Frank, A.M.; Bandeira, N.; Shen, Z.; Tanner, S.; Briggs, S.P.; Smith, R.D.; Pevzner, P.A. Clustering millions of tandem mass spectra. J. Proteome Res. 2008, 7, 113–122. [Google Scholar] [CrossRef]
- Nguyen, D.D.; Wu, C.-H.; Moree, W.J.; Lamsa, A.; Medema, M.H.; Zhao, X.; Gavilan, R.G.; Aparicio, M.; Atencio, L.; Jackson, C. MS/MS networking guided analysis of molecule and gene cluster families. Proc. Natl. Acad. Sci. USA. 2013, 110, E2611–E2620. [Google Scholar] [CrossRef] [Green Version]
- Alishah Aratboni, H.; Rafiei, N.; Garcia-Granados, R.; Alemzadeh, A.; Morones-Ramírez, J.R. Biomass and lipid induction strategies in microalgae for biofuel production and other applications. Microb. Cell Fact. 2019, 18, 1–17. [Google Scholar] [CrossRef] [PubMed] [Green Version]
- Blanco, G.; Blanco, A. Chapter 5—Lipids. In Medical Biochemistry; Academic Press: Cambridge, MA, USA, 2017; pp. 99–119. [Google Scholar]
- Cañavate, J.P.; Armada, I.; Hachero-Cruzado, I. Interspecific variability in phosphorus-induced lipid remodelling among marine eukaryotic phytoplankton. New Phytol. 2017, 213, 700–713. [Google Scholar] [CrossRef] [PubMed] [Green Version]
- Allard, P.M.; Péresse, T.; Bisson, J.; Gindro, K.; Marcourt, L.; Pham, V.C.; Roussi, F.; Litaudon, M.; Wolfender, J.L. Integration of Molecular Networking and In-Silico MS/MS Fragmentation for Natural Products Dereplication. Anal. Chem. 2016, 88, 3317–3323. [Google Scholar] [CrossRef] [PubMed]
- Lindon, J.C.; Holmes, E.; Bollard, M.E.; Stanley, E.G.; Nicholson, J.K. Metabonomics technologies and their applications in physiological monitoring, drug safety assessment and disease diagnosis. Biomarkers 2004, 9, 1–31. [Google Scholar] [CrossRef]
- Wagner, S.; Scholz, K.; Donegan, M.; Burton, L.; Wingate, J.; Volkel, W. Metabonomics and Biomarker Discovery: LC−MS Metabolic Profiling and Constant Neutral Loss Scanning Combined with Multivariate Data Analysis for Mercapturic Acid Analysis. Anal. Chem. 2006, 78, 1296–1305. [Google Scholar] [CrossRef]
- Watkins, S.M.; German, J.B. Metabolomics and biochemical profiling in drug discovery and development. Curr. Opin. Mol. Ther. 2002, 4, 224–228. [Google Scholar] [PubMed]
- Waters, N.J.; Holmes, E.; Williams, A.; Waterfield, C.J.; Farrant, R.D.; Nicholson, J.K. NMR and pattern recognition studies on the time-related metabolic effects of alpha-naphthylisothiocyanate on liver, urine, and plasma in the rat: An integrative metabonomic approach. Chem. Res. Toxicol. 2001, 14, 1401–1412. [Google Scholar] [CrossRef]
- Goodacre, R.; Vaidyanathan, S.; Dunn, W.B.; Harrigan, G.G.; Kell, D.B. Metabolomics by Numbers: Acquiring and Understanding Global Metabolite Data. Trends Biotechnol. 2004, 5, 245–252. [Google Scholar] [CrossRef]
- Marshall, D.D.; Powers, R. Beyond the paradigm: Combining mass spectrometry and nuclear magnetic resonance for metabolomics. Prog. Nucl. Magn. Reson. Spectrosc. 2017, 100, 1–16. [Google Scholar] [CrossRef] [Green Version]
- Ling, Y.S.; Linag, H.J.; Chung, M.; Lin, M.; Lin, C. NMR- and MS-based metabolomics: Various organ responses following naphthalene intervention. Mol. Biosyst. 2014, 10, 1918–1931. [Google Scholar] [CrossRef]
- Marshall, D.; Lei, S.; Worley, B.; Huang, Y.; Garcia-Garcia, A.; Franco, R.; Dodds, E.; Powers, R. Combining DI-ESI-MS and NMR Datasets for Metabolic Profiling. Metabolomics 2015, 11, 391–402. [Google Scholar] [CrossRef] [Green Version]
- Bingol, K.; Brüschweiler, R. NMR/MS Translator for the Enhanced Simultaneous Analysis of Metabolomics Mixtures by NMR Spectroscopy and Mass Spectrometry: Application to Human Urine. J. Proteome Res. 2015, 14, 2642–2648. [Google Scholar] [CrossRef]
- Baker, J.; Ward, J.; Beale, M. Combined NMR and flow injection ESI-MS for Brassicaceae metabolomics. Methods Mol. Biol. 2012, 860, 177–191. [Google Scholar]
- Bingol, K.; Brüschweilerr-Li, L.; Li, D.; Zhang, B.; Xie, M.; Brüschweiler, R. Emerging new strategies for successful metabolite identification in metabolomics. Bioanalysis 2016, 8, 557–573. [Google Scholar] [CrossRef] [Green Version]
- Prichystal, J.; Schug, K.; Lemr, K.; Novak, J.; Havlicek, V. Structural Analysis of Natural Products. Anal. Chem. 2016, 88, 10338–10346. [Google Scholar] [CrossRef]
- Yang, Z. Online hyphenated liquid chromatography-nuclear magnetic resonance spectroscopy-mass spectrometry for drug metabolite and nature product analysis. J. Pharm. Biomed. Anal. 2006, 40, 516–527. [Google Scholar] [CrossRef]
- Van der Kooy, F.; Maltese, F.; Choi, Y. Quality control of herbal material and phytopharmaceuticals with MS and NMR based metabolic fingerprinting. Planta Med. 2009, 75, 763–775. [Google Scholar] [CrossRef] [Green Version]
- Windarsih, A.; Rohman, A.; Swasono, R.T. Application of H-NMR metabolite fingerprinting and chemometrics for the authentication of Curcuma longa adulterated with Curcuma manga. J. Appl. Pharm. Sci. 2018, 8, 75–81. [Google Scholar] [CrossRef]
- Bedair, M.; Sumner, L. Current and emerging mass-spectrometry technologies for metabolomics. Trends Anal. Chem. 2008, 27, 238–250. [Google Scholar] [CrossRef]
- Sumner, L.W.; Mendes, P.; Dixon, R.A. Plant metabolomics: Large-scale phytochemistry in the functional genomics era. Phytochemistry 2003, 62, 817–836. [Google Scholar] [CrossRef] [Green Version]
- Sivathanu, B.; Palaniswamy, S. Purification and characterization of carotenoids from green algae Chlorococcum humicola by HPLC-NMR and LC-MS-APCI. Biomed. Prev. Nutr. 2012, 2, 276–282. [Google Scholar] [CrossRef]
- As, S.; Costa, I.C.R.; Teixeira, C.M.L.L.; Filocomo, D.; Candido, R.; Silva, P.R.M.; Cunha, V.S.; Romeu, J. Investigation of Biodiesel Potential of Biomasses of Microalgaes Chlorella, Spirulina and Tetraselmis by NMR and GC-MS Techniques. J. Biotechnol. Biomater. 2016, 6, 1–15. [Google Scholar] [CrossRef] [Green Version]
- Tompkins, J.; DeVille, M.; Day, J.; Turner, M. Culture Collection of Algae and Protozoa: Catalogue of Strains; Titus Wilson and Son Ltd.: Kendal, UK, 1995. [Google Scholar]
- Lavens, P.; Sorgeloos, P. Manual on the production and use of live food for aquaculture. In FAO Fisheries Technical Paper No. 361; FAO: Rome, Italy, 1996. [Google Scholar]
- Kim, H.K.; Choi, Y.H.; Verpoorte, R. NMR-based metabolomic analysis of plants. Nat. Protoc. 2010, 5, 536–549. [Google Scholar] [CrossRef] [PubMed]


| Solvent | Aq | AqE | EtOH | EtOAc | Hex |
|---|---|---|---|---|---|
| Yield (g) | 0.068 ± 0.003 d | 0.042 ± 0.001 ab | 0.057 ± 0.002 c | 0.047 ± 0.001 b | 0.038 ± 0.002 a |
| No. | Putative Metabolite | δH (ppm), Multiplicity, J (Hz) | HSQC (1H-13C) | Hex | EtOAc | EtOH | AqE | Aq | Reference |
|---|---|---|---|---|---|---|---|---|---|
| Amino acids | |||||||||
| 1. | Valine | 0.99 (d, 6.2) | 25.1 | - | - | + | + | + | [29] |
| 1.05 (d, 2.8) | 21.1 | ||||||||
| 2. | Isoleucine | 1.01 (d, 3.3) | 19.5 | - | - | + | + | + | [29] |
| 0.96 (t, 7.6) | - | ||||||||
| 3. | Leucine | 0.97 (d, 5.0) | 23.8 | + | + | + | + | + | [29] |
| 4. | Alanine | 3.74 (m) | 72.8 | - | - | + | + | + | [44] |
| 1.46 (d, 7.2) | 19.1 | ||||||||
| 5. | Threonine | 3.64 (dd, 5.7, 10.9) | 66.5 | - | - | - | - | + | [44] |
| 1.37 (d, 6.9) | - | ||||||||
| Carbohydrates/Others | |||||||||
| 6. | Sucrose | 5.37 (d, 4.1) | - | - | - | + | + | + | [45] |
| 4.22 (d, 2.5) | 76.5 | ||||||||
| 3.83 (m) | - | ||||||||
| 3.68 (s) | - | ||||||||
| 3.44 (t, 6.7) | 74.5 | ||||||||
| 7. | Glucose | 3.78 (m) | 72.8 | - | - | + | + | + | [45] |
| 3.52 (dd, 4.6, 8.4) | 66.5 | ||||||||
| 8. | Choline | 3.22 (s) | 57.0 | - | - | + | + | + | [29] |
| 9. | Dimethylsulphonio-propionate (DMSP) | 3.44 (t, 6.7) | 43.9 | - | - | + | + | + | [29] |
| 2.92 (s) | 28.3 | ||||||||
| 2.70 (t, 6.7) | 33.4 | ||||||||
| 10. | d-1,4/2,5-cyclohexa-netetrol | 3.72 (m) | 73.2 | - | - | + | + | + | [29] |
| 1.83 (m) | 37.3 | ||||||||
| Saturated fatty acids | |||||||||
| 11. | Palmitic acid | 2.35 (t, 7.6) | + | + | + | + | - | [45] | |
| 1.61 (m) | 27.9 | ||||||||
| 1.33 (m) | 33.2 | ||||||||
| 0.88 (t, 6.9) | 16.4 | ||||||||
| 12. | Arachidic acid | 2.35 (t, 7.6) | + | + | + | + | - | [45] | |
| 1.60 (m) | 27.9 | ||||||||
| 1.40 (m) | 18.2 | ||||||||
| 1.29 (m) | 32.2 | ||||||||
| 0.88 (t, 6.9) | 16.4 | ||||||||
| Unsaturated fatty acids | |||||||||
| 13. | Oleic acid | 5.34 (m) | 130.3 | + | + | + | + | - | [45] |
| 2.25 (t, 7.5) | 37.4 | ||||||||
| 2.02 (m) | 23.3 | ||||||||
| 1.27 (m) | 33.2 | ||||||||
| 0.87 (t, 6.9) | 16.4 | ||||||||
| 14. | α-linoleic acid | 5.34 (m) | - | + | + | + | + | - | [45] |
| 5.32 (m) | - | ||||||||
| 2.80 (m) | 29.1 | ||||||||
| 2.25 (t, 7.5) | 37.4 | ||||||||
| 2.02 (m) | - | ||||||||
| 1.27 (m) | - | ||||||||
| 0.96 (t, 7.6) | 16.6 | ||||||||
| 15. | Docosahexaenoic fatty acid chain (DHA) | 5.30–5.38 (m) | 130.3 | + | + | + | + | - | HMDB |
| 2.38 (m) | 36.8 | ||||||||
| 2.06 (m) | 29.7 | ||||||||
| 0.96 (t, 7.6) | 16.6 | ||||||||
| 16. | Docosapentaenoic fatty acid chain (DPA) | 5.30–5.38 (m) | 131.8 | + | + | + | + | - | HMDB |
| 2.33 (m) | 36.9 | ||||||||
| 1.38 (m) | 31.3 | ||||||||
| 1.30 (m) | 33.2 | ||||||||
| 0.87 (t, 6.9) | 32.0 | ||||||||
| 17. | Cholesterol | 5.28 (dd, 8.3, 17.6) | - | + | + | + | + | - | HMDB |
| 2.31 (dd, 2.8, 6.2) | - | ||||||||
| 1.61 (m) | - | ||||||||
| 0.82 (m) | 22.2 | ||||||||
| 0.77 (d, 6.6) | 25.0 | ||||||||
| 0.65 (m) | - | ||||||||
| Carotenoids | |||||||||
| 18. | Fucoxanthin | 6.77 (dd, 4.2, 4.2) | - | - | + | + | - | - | [29], HMDB |
| 6.41 (dd, 11.1, 22.2) | - | ||||||||
| 2.59 (d, 18.5) | - | ||||||||
| 2.12 (s) | - | ||||||||
| 2.09 (s) | - | ||||||||
| 1.97 (s) | - | ||||||||
| 1.58 (dd, 7.2, 13.7) | - | ||||||||
| 1.37 (dd, 5.7, 9.7) | 31.3 | ||||||||
| 1.19 (s) | 23.1 | ||||||||
| 1.08 (s) | 34.7 | ||||||||
| 1.01 (s) | 26.9 | ||||||||
| 19. | Astaxanthin | 6.77 (m) | - | + | + | + | - | - | [45], HMDB |
| 6.61 (d, 3.8) | - | ||||||||
| 6.63 (d, 3.2) | - | ||||||||
| 4.15 (dd) | 65.2 | ||||||||
| 2.12 (s) | - | ||||||||
| 1.91 (s) | 13.8 | ||||||||
| 1.19 (s) | 23.1 | ||||||||
| Chlorophylls | |||||||||
| 20. | Pheophytin a | 9.21 (s) | 107.2 | + | + | + | - | - | [46], PubChem |
| 9.00 (s) | 99.9 | ||||||||
| 8.60 (s) | 96.2 | ||||||||
| Alkenone | |||||||||
| 21. | Polyunsaturated long-chain alkenones (PULCAs) | 2.12 (s) | - | + | + | + | - | - | [46], PubChem |
| 1.95 (m) | 35.4 | ||||||||
| Peak | tR (min) | Putative Metabolite | Exp. Mass (M + H) | Exp. Mass (M − H) | Theo. Mass (M +/− H) | Mass Error (ppm) | MS Fragments (ESI+) | UV (nm) | MAIN CLASS |
|---|---|---|---|---|---|---|---|---|---|
| 1. | 7.00 | Arachidic acid | 311.1688 | 311.3028 | −430 | 293, 267, 249, 223 | n.d | Fatty acid | |
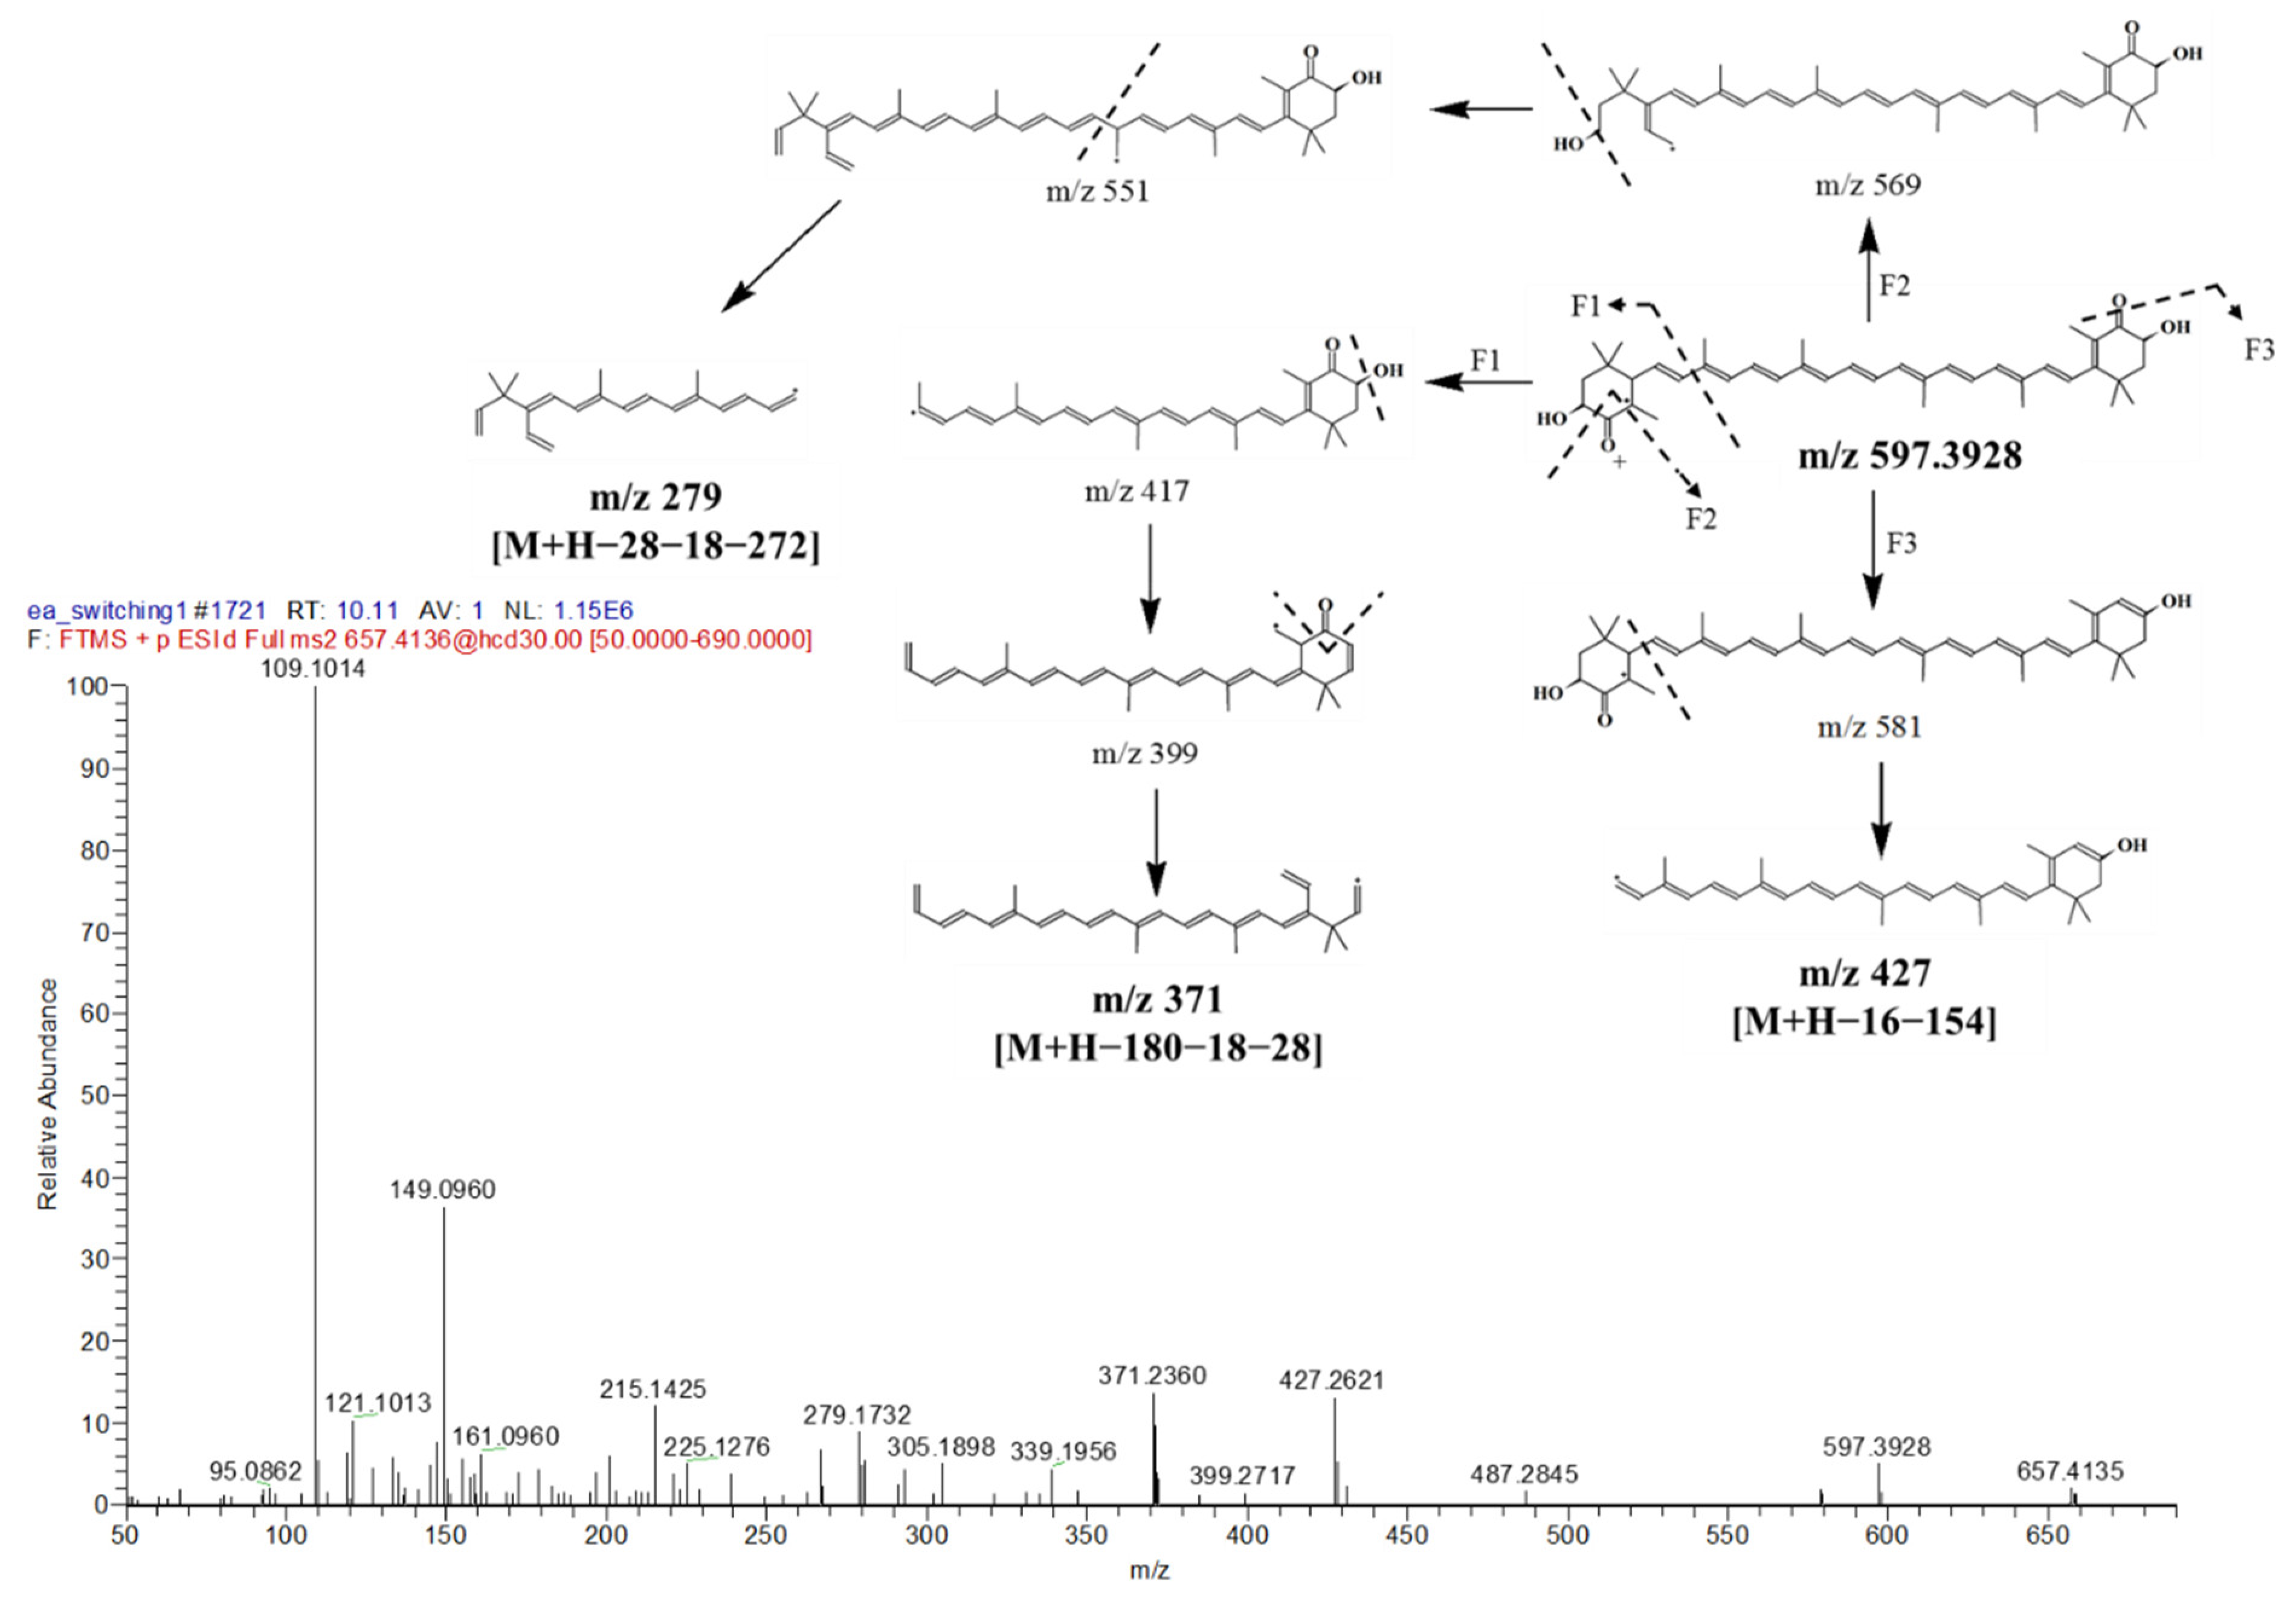
| 2. | 10.11 | Astaxanthin | 597.3928 | 597.3938 | −1.67 | 597, 579, 279, 215, 109 | 438 | Carotenoid | |
| 3. | 10.18 | Halocynthiaxanthin | 599.4077 | 599.4095 | −3.00 | 389, 233, 147, 109 | 448 | Carotenoid | |
| 4. | 10.71 | 3,6,9,12,15-Octadecapentaenoic acid | 273.1861 | 273.1860 | 0.36 | 228, 182, 133, 59 | n.d | Fatty acid | |
| 5. | 11.40 | Chlorophyll c2 | 609.1970 | 609.1983 | −2.13 | 591, 549, 532 | 450 | Chlorophyll | |
| 6. | 11.21 | Stearidonic acid | 275.2015 | 275.2017 | −0.72 | 83, 71, 59 | n.d | Fatty acid | |
| 7. | 11.52 | Chlorophyll c1 | 611.2125 | 611.2139 | −2.25 | 593, 551, 534 | 446 | Chlorophyll | |
| 8. | 11.90 | Cholesterol | 387.1795 | 387.3548 | −452 | 387, 362, 207 | n.d | Sterol | |
| 9. | 12.05 | Eicosapentaenoic acid (EPA) | 301.2173 | 301.2173 | 0 | 187, 166, 148 | n.d | Fatty acid | |
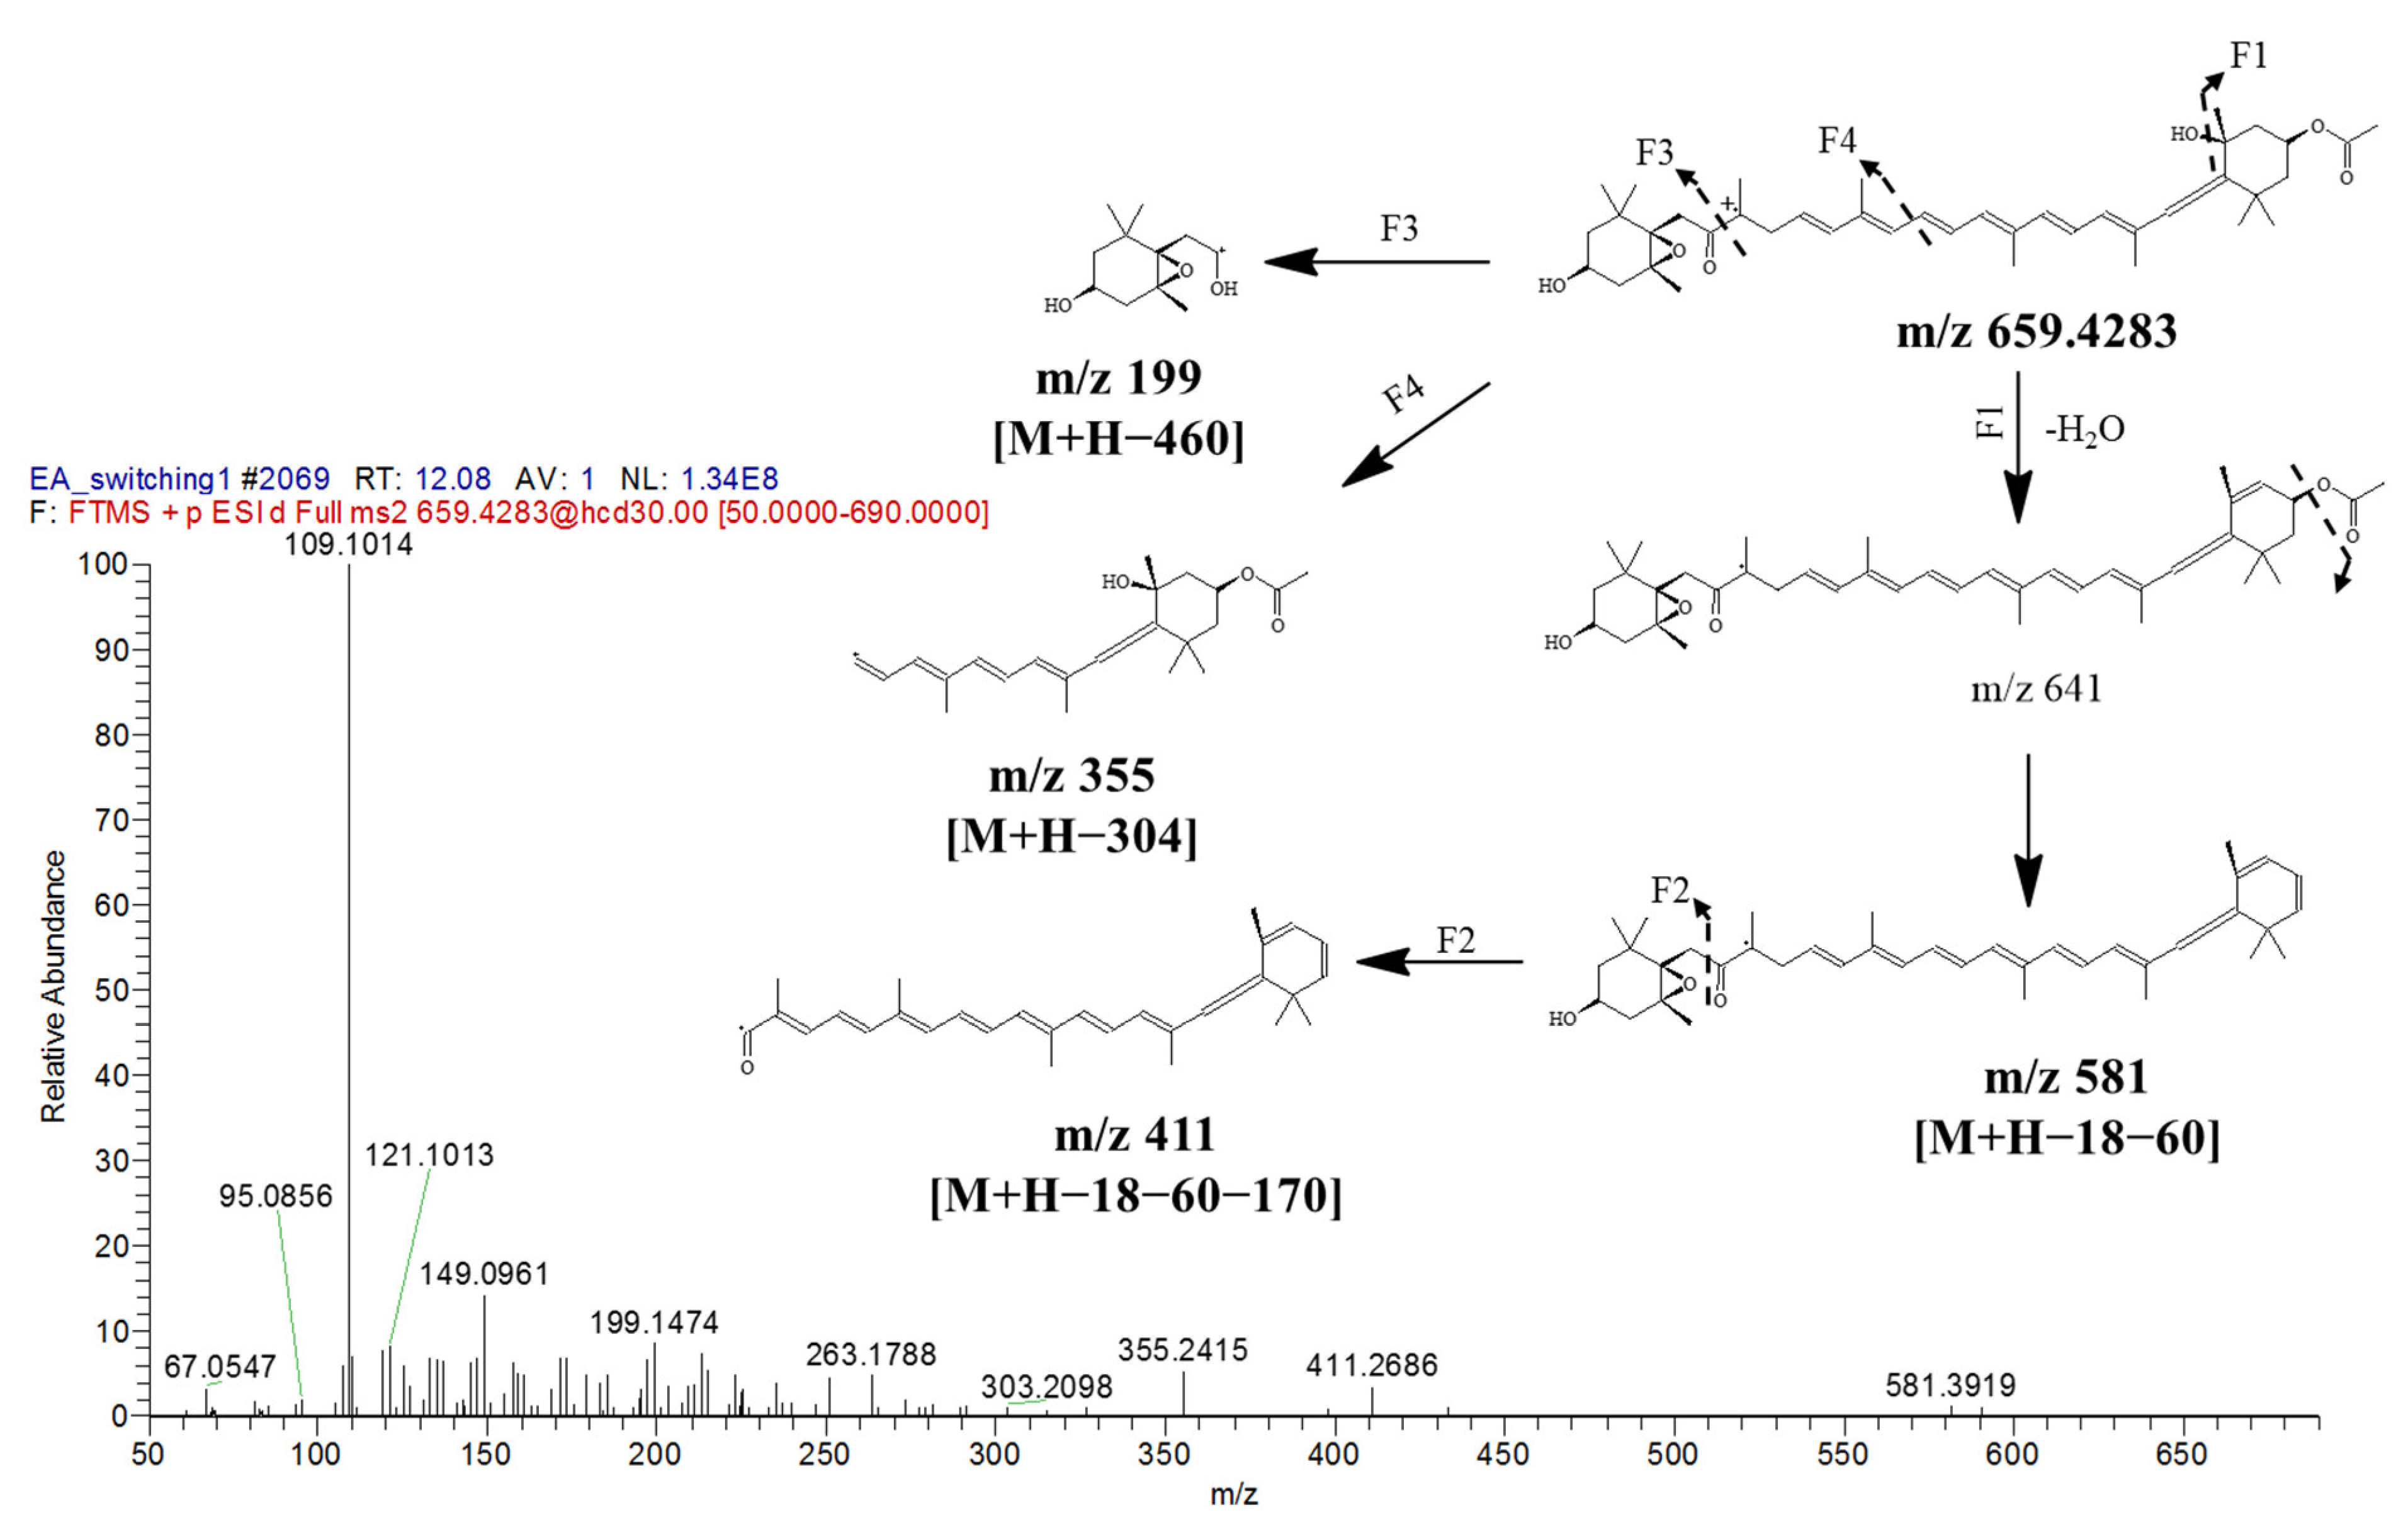
| 10. | 12.07 | Fucoxanthin | 659.4281 | 659.4306 | −3.79 | 581, 411, 355, 199, 109 | 448 | Carotenoid | |
| 11. | 12.08 | α-Linolenic acid | 277.2172 | 277.2173 | −0.36 | 194, 92, 87, 59 | n.d | Fatty acid | |
| 12. | 12.49 | Docosahexaenoic acid (DHA) | 327.2328 | 327.2330 | −0.61 | 213, 172, 135, 59 | n.d | Fatty acid | |
| 13. | 13.10 | Pheophorbide a | 593.2742 | 593.2758 | −2.69 | 593, 533, 506, 459 | 408, 536 | Chlorophyll | |
| 14. | 13.29 | Docosapentaenoic acid (DPA) | 329.2487 | 329.2486 | −0.30 | 250, 226, 85, 59 | n.d | Fatty acid | |
| 15. | 13.37 | (3S,4R,3′R)-4-Hydroxyalloxanthin | 581.3976 | 581.3989 | −2.23 | 563, 411, 251 | 438 | Carotenoid | |
| 16. | 13.60 | Phoenicoxanthin | 581.3964 | 581.3989 | −4.30 | 411, 429 | 452 | Carotenoid | |
| 17. | 13.82 | Palmitic acid | 255.2329 | 255.2330 | −0.39 | 246, 94, 81, 76 | n.d | Fatty acid | |
| 18. | 13.91 | Oleic Acid | 281.2486 | 281.2486 | 0 | 101,98, 87, 64 | n.d | Fatty acid | |
| 19. | 15.26 | Hexacosanedioic acid | 427.3771 | 427.3782 | −2.57 | 203, 139, 121, 71 | n.d | Fatty acid | |
| 20. | 15.83 | Diatoxanthin | 567.4182 | 567.4197 | −2.64 | 255, 211, 119, 109 | 460 | Carotenoid | |
| 21. | 15.92 | Canthaxanthin | 565.4023 | 565.4040 | −3.00 | 447, 255, 119 | 456 | Carotenoid | |
| 22. | 16.45 | Echinenone | 551.4232 | 551.4247 | −2.72 | 551, 502, 458, 447 | 458 | Carotenoid | |
| 23. | 17.56 | PI(16:0/22:4(7Z,10Z,13Z,16Z)) | 887.5657 | 887.5644 | 1.35 | 871, 609, 591 | n.d | Glycerophospholipids | |
| 24. | 17.90 | PC(15:1(9Z)/22:6(4Z,7Z,10Z,13Z,16Z,19Z)) | 790.5438 | 790.5381 | 7.21 | 628, 610, 356 | n.d | Glycerophospholipids | |
| 25. | 18.68 | PI-Cer(d14:0/31:0) | 936.7314 | 936.7264 | 5.33 | 919, 643, 591 | n.d | Sphingolipids | |
| 26. | 19.82 | PS(O-14:0/26:0) | 834.6580 | 834.6582 | −0.23 | 698, 589, 543 | n.d | Glycerophospholipids | |
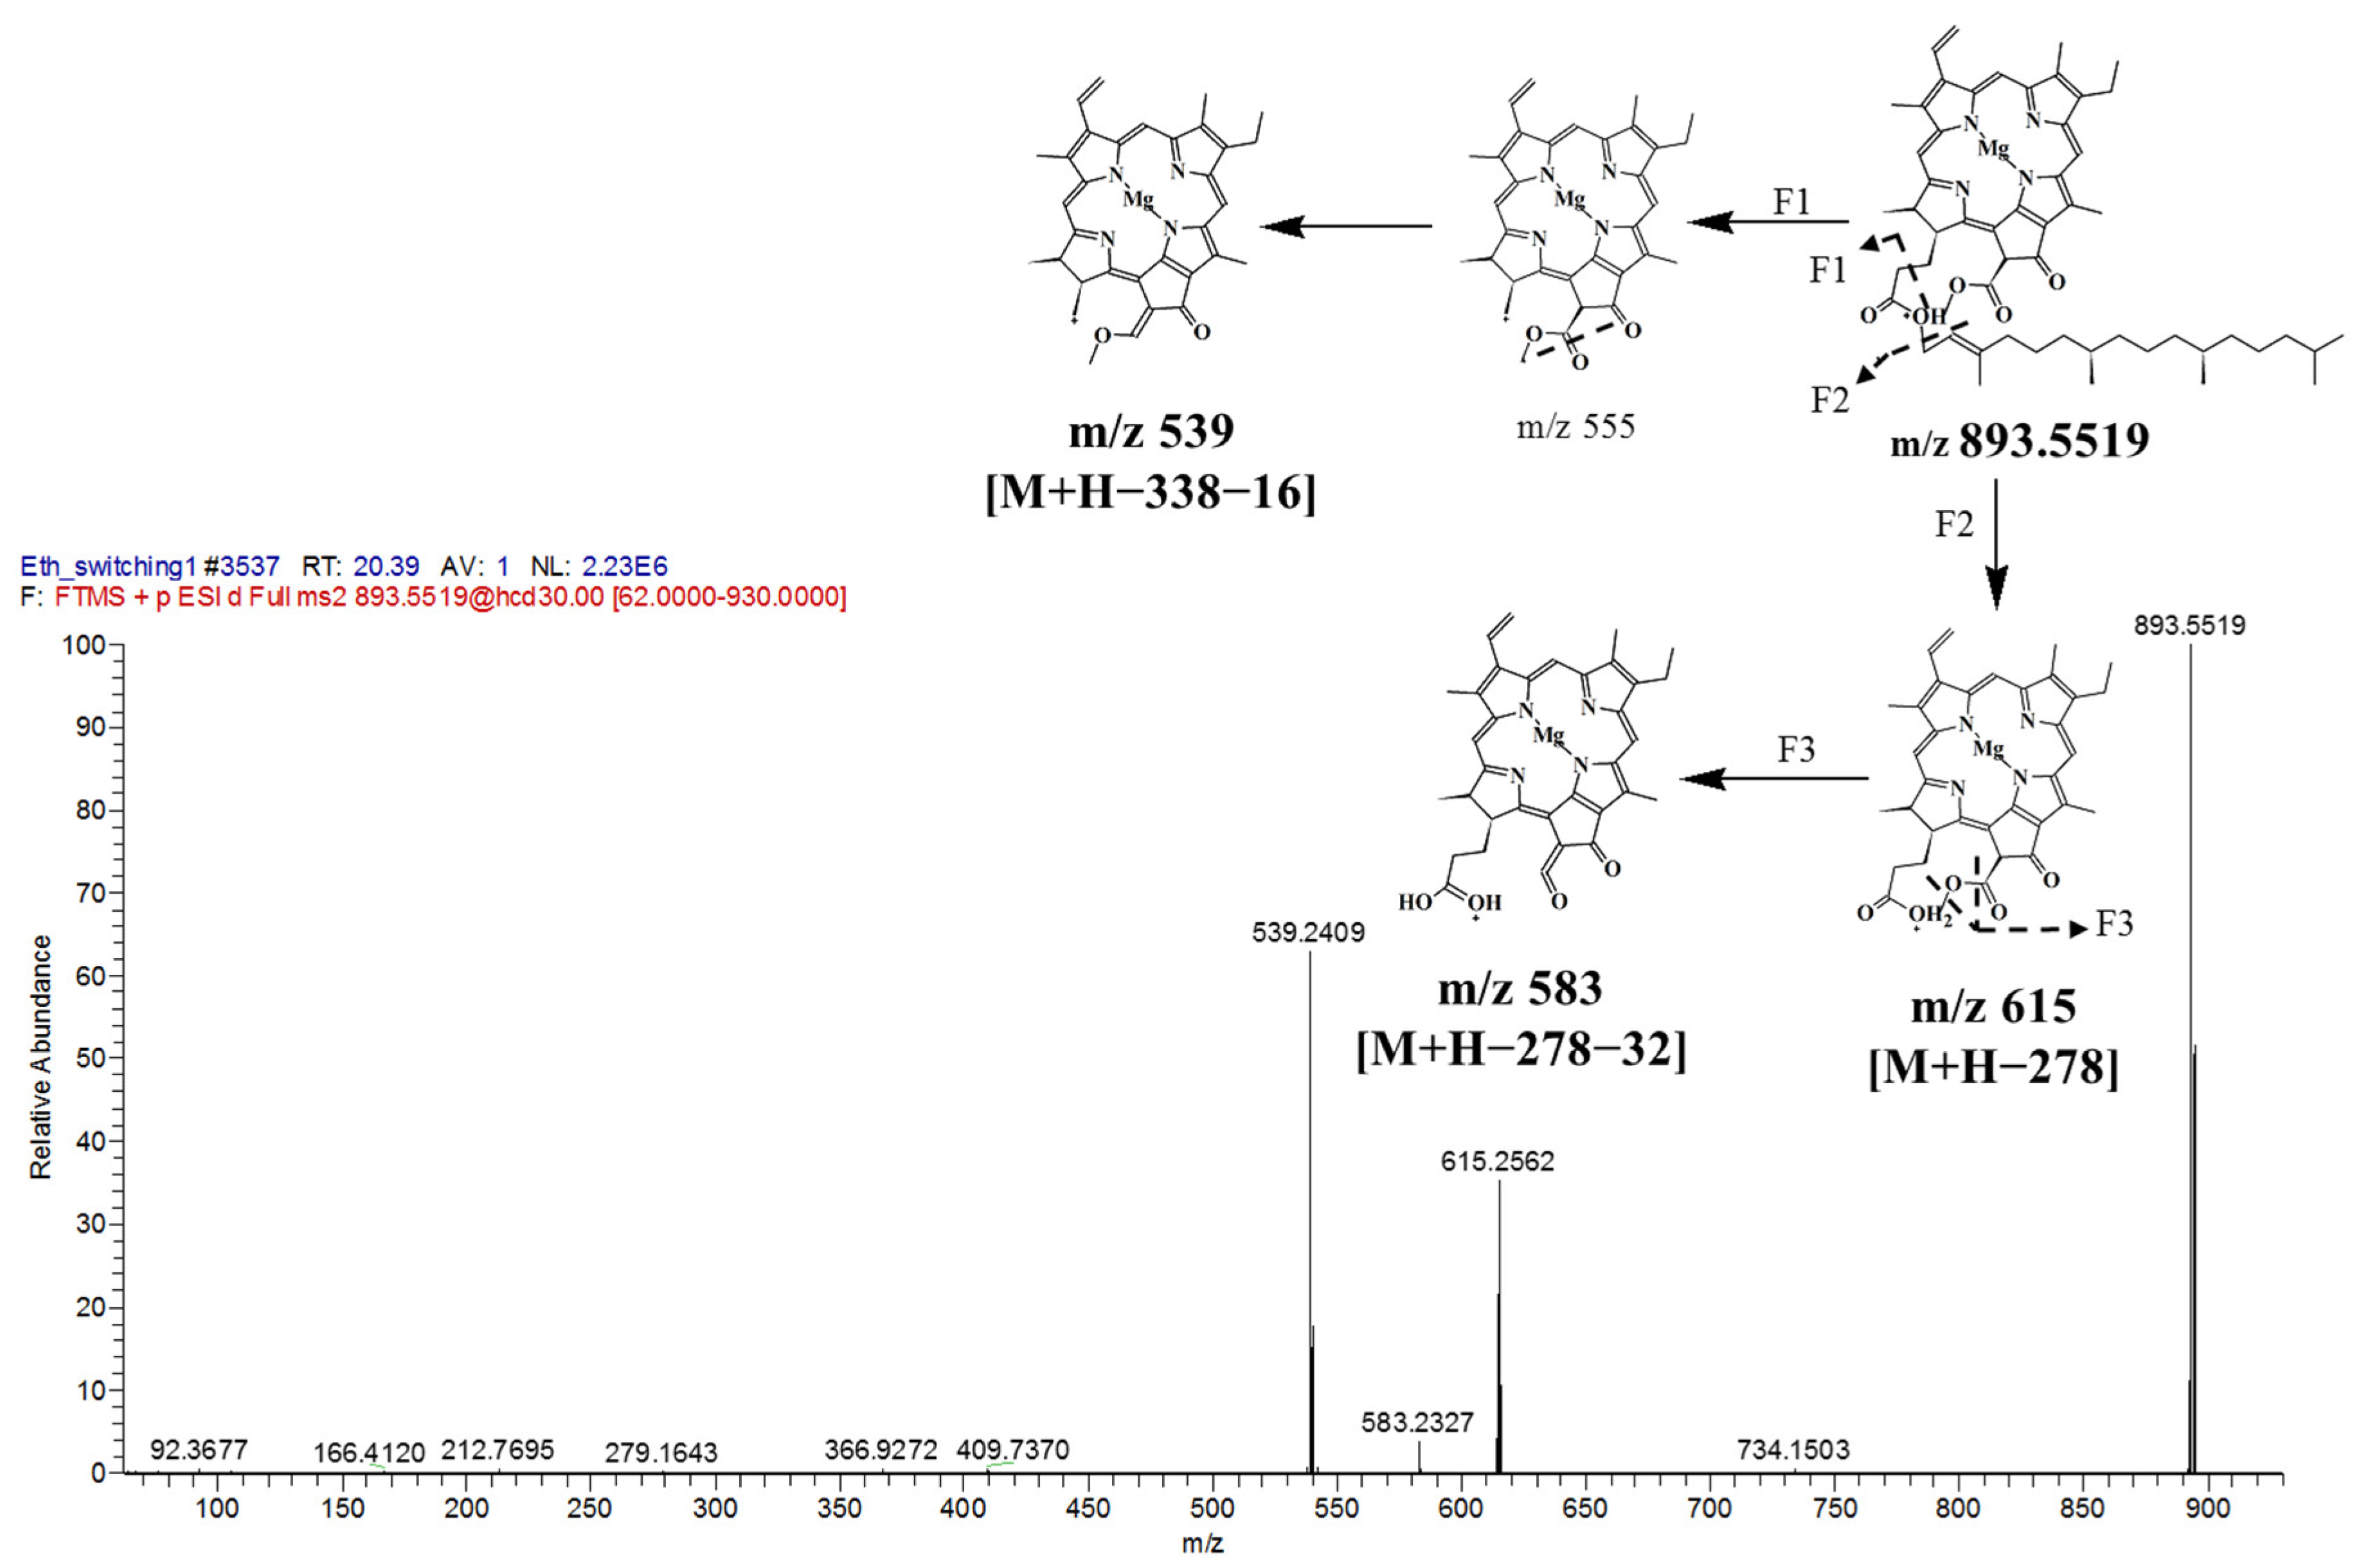
| 27. | 20.51 | Chlorophyll a | 893.5512 | 893.5426 | 9.62 | 893, 615, 539 | 408, 536 | Chlorophyll | |
| 28. | 21.06 | Pheophytin a | 871.5711 | 871.5732 | −2.41 | 871, 593, 533 | 408, 536 | Chlorophyll | |
| 29. | 21.59 | PI-Cer(d14:0/28:0) | 930.6123 | 930.6196 | −7.84 | 631, 603, 506 | Sphingolipids | ||
| 30. | 22.80 | NAPE(18:1(9Z)/16:1(9Z)/18:0) | 982.7805 | 982.7834 | −2.95 | 921, 828, 636 | Glycerophospholipids | ||
| 31. | 24.63 | PI-Cer(t18:0/16:0(2OH)) | 814.5496 | 814.5440 | 6.87 | 797, 569, 543 | Sphingolipids | ||
| 32. | 28.47 | TG(12:0/16:0/22:5(7Z,10Z,13Z,16Z,19Z)) | 825.6924 | 825.6967 | −5.21 | 698, 597, 549 | Glycerolipids |
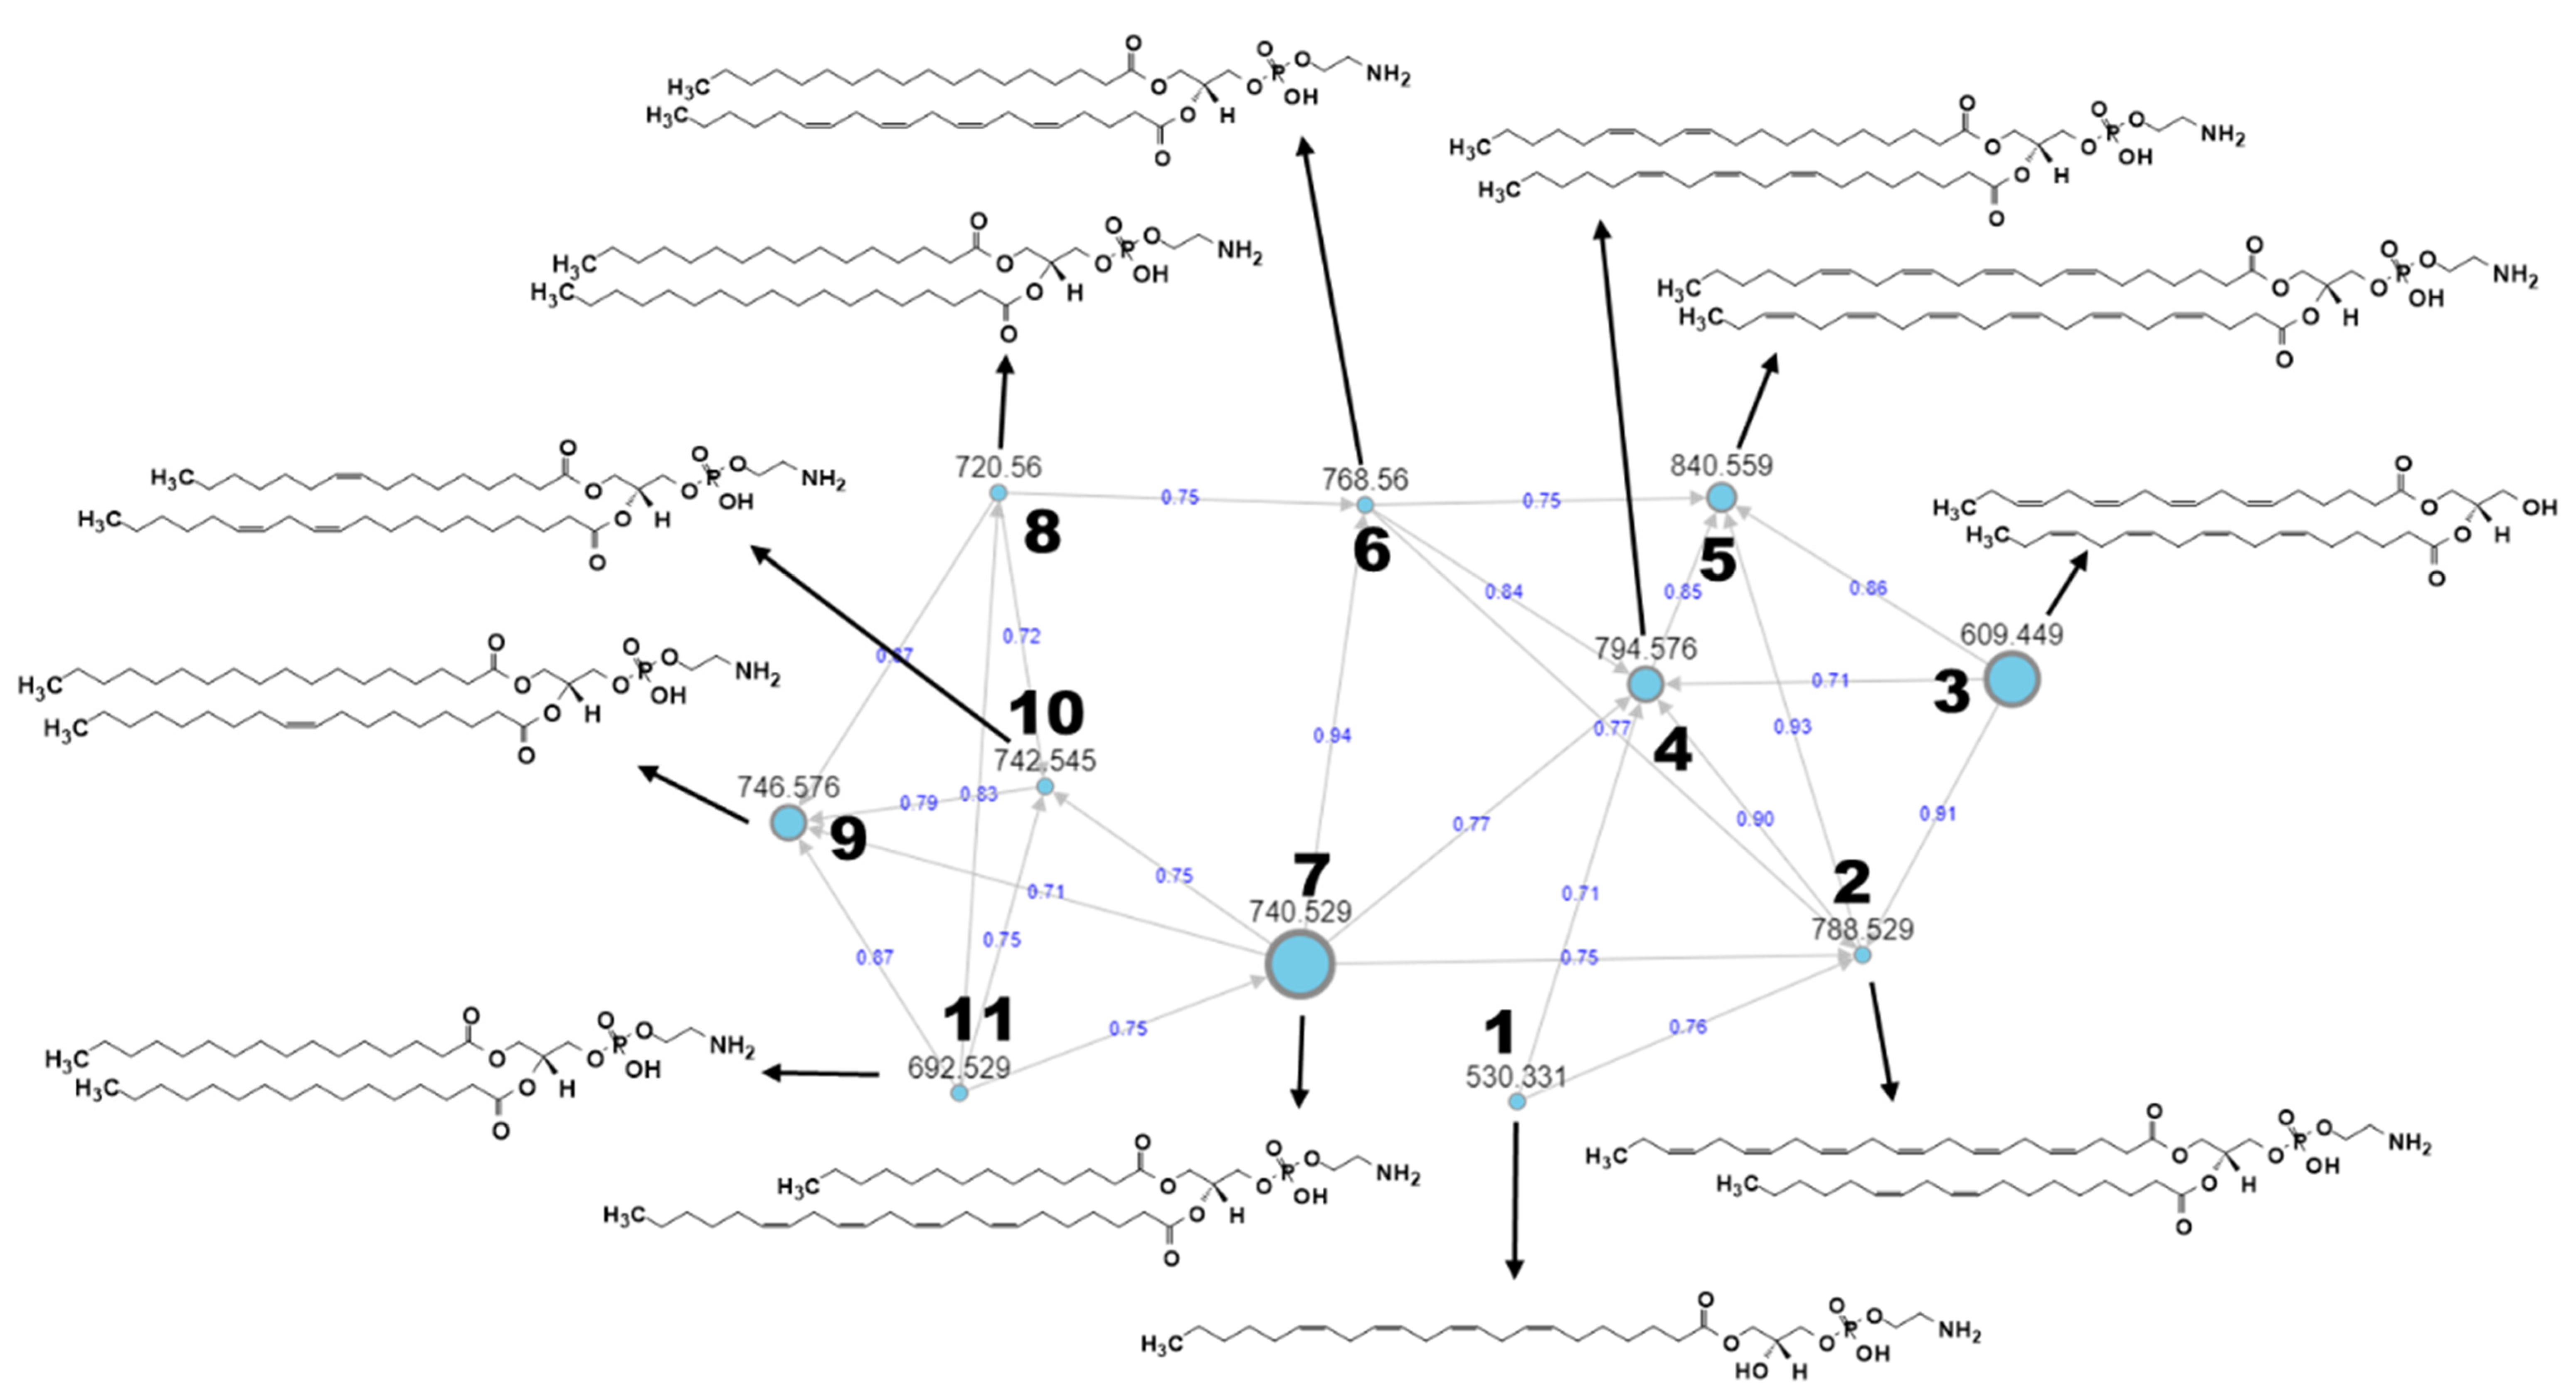
| No. | Parent Mass m/z [M + H]+ | Mass Error (ppm) | Putative Annotation | Molecular Formula | RT (min) |
|---|---|---|---|---|---|
| 1. | 530.3313 | 13.58 | LysoPE(22:4(7Z,10Z,13Z,16Z)/0:0) | C27H48NO7P | 9.24 |
| 2. | 788.5286 | 7.74 | PE(22:6(4Z,7Z,10Z,13Z,16Z,19Z)/ 18:2(9Z,12Z)) | C45H74NO8P | 14.38 |
| 3. | 609.4493 | −3.28 | DG(18:4(6Z,9Z,12Z,15Z)/18:4 (6Z,9Z,12Z,15Z)/0:0) | C39H60O5 | 15.00 |
| 4. | 794.5761 | 8.43 | PE(20:2(11Z,14Z)/20:3(8Z,11Z,14Z)) | C45H80NO8P | 15.47 |
| 5. | 840.5593 | 6.54 | PE(22:4(7Z,10Z,13Z,16Z)/22:6 (4Z,7Z,10Z,13Z,16Z,19Z)) | C49H78NO8P | 14.74 |
| 6. | 768.5600 | 8.07 | PE(18:0/20:4(5Z,8Z,11Z,14Z)) | C43H78NO8P | 15.85 |
| 7. | 740.5287 | 8.37 | PE(14:0/22:4(7Z,10Z,13Z,16Z)) | C41H74NO8P | 14.93 |
| 8. | 720.5601 | 8.74 | PE(16:0/18:0) | C39H78NO8P | 16.44 |
| 9. | 746.5757 | 8.44 | PE(18:0/18:1(9Z)) | C41H80NO8P | 16.55 |
| 10. | 742.5446 | 8.75 | PE(16:1(9Z)/20:2(11Z,14Z)) | C41H76NO8P | 15.58 |
| 11. | 692.529 | 9.39 | PE(16:0/16:0) | C37H74NO8P | 15.67 |
Publisher’s Note: MDPI stays neutral with regard to jurisdictional claims in published maps and institutional affiliations. |
© 2021 by the authors. Licensee MDPI, Basel, Switzerland. This article is an open access article distributed under the terms and conditions of the Creative Commons Attribution (CC BY) license (http://creativecommons.org/licenses/by/4.0/).
Share and Cite
Bustamam, M.S.A.; Pantami, H.A.; Azizan, A.; Shaari, K.; Min, C.C.; Abas, F.; Nagao, N.; Maulidiani, M.; Banerjee, S.; Sulaiman, F.; et al. Complementary Analytical Platforms of NMR Spectroscopy and LCMS Analysis in the Metabolite Profiling of Isochrysis galbana. Mar. Drugs 2021, 19, 139. https://0-doi-org.brum.beds.ac.uk/10.3390/md19030139
Bustamam MSA, Pantami HA, Azizan A, Shaari K, Min CC, Abas F, Nagao N, Maulidiani M, Banerjee S, Sulaiman F, et al. Complementary Analytical Platforms of NMR Spectroscopy and LCMS Analysis in the Metabolite Profiling of Isochrysis galbana. Marine Drugs. 2021; 19(3):139. https://0-doi-org.brum.beds.ac.uk/10.3390/md19030139
Chicago/Turabian StyleBustamam, Muhammad Safwan Ahamad, Hamza Ahmed Pantami, Awanis Azizan, Khozirah Shaari, Chong Chou Min, Faridah Abas, Norio Nagao, Maulidiani Maulidiani, Sanjoy Banerjee, Fadzil Sulaiman, and et al. 2021. "Complementary Analytical Platforms of NMR Spectroscopy and LCMS Analysis in the Metabolite Profiling of Isochrysis galbana" Marine Drugs 19, no. 3: 139. https://0-doi-org.brum.beds.ac.uk/10.3390/md19030139