
Phagocytosis of Astaxanthin-Loaded Microparticles Modulates TGFβ Production and Intracellular ROS Levels in J774A.1 Macrophages

 ,
,  , and
, and 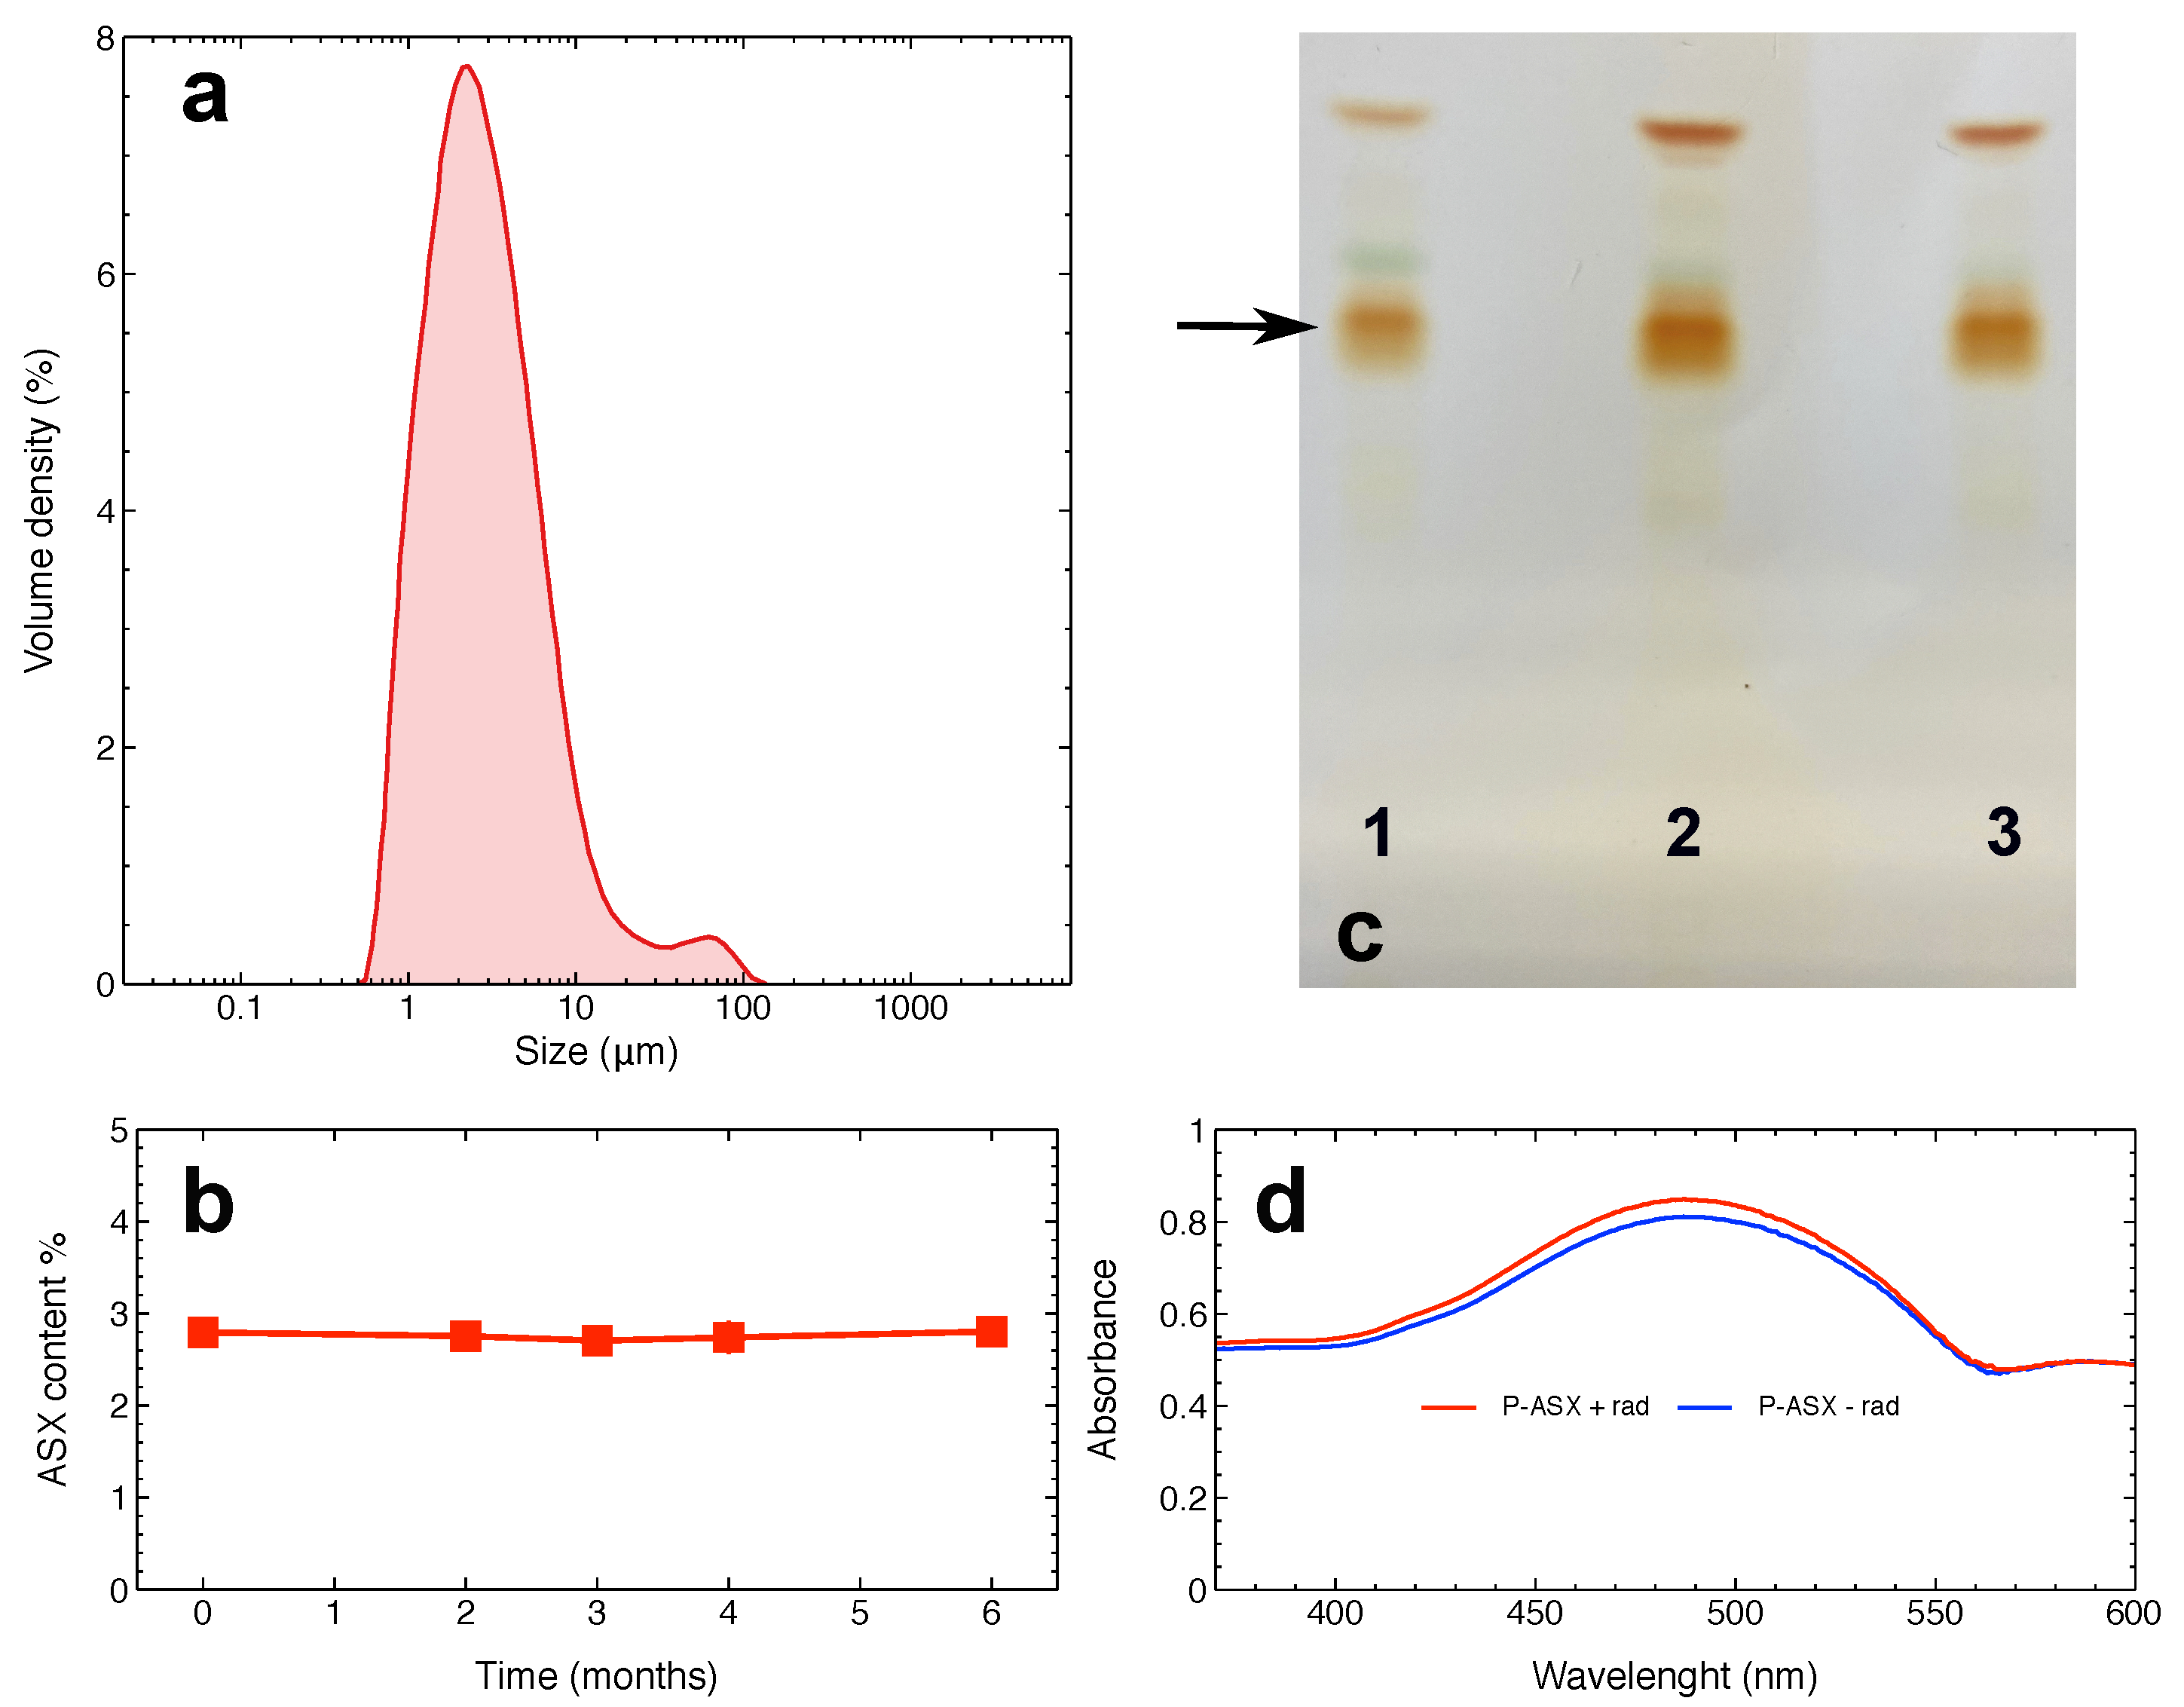
Abstract
:1. Introduction
2. Results
2.1. Characterisation of ASX-Loaded Microparticles
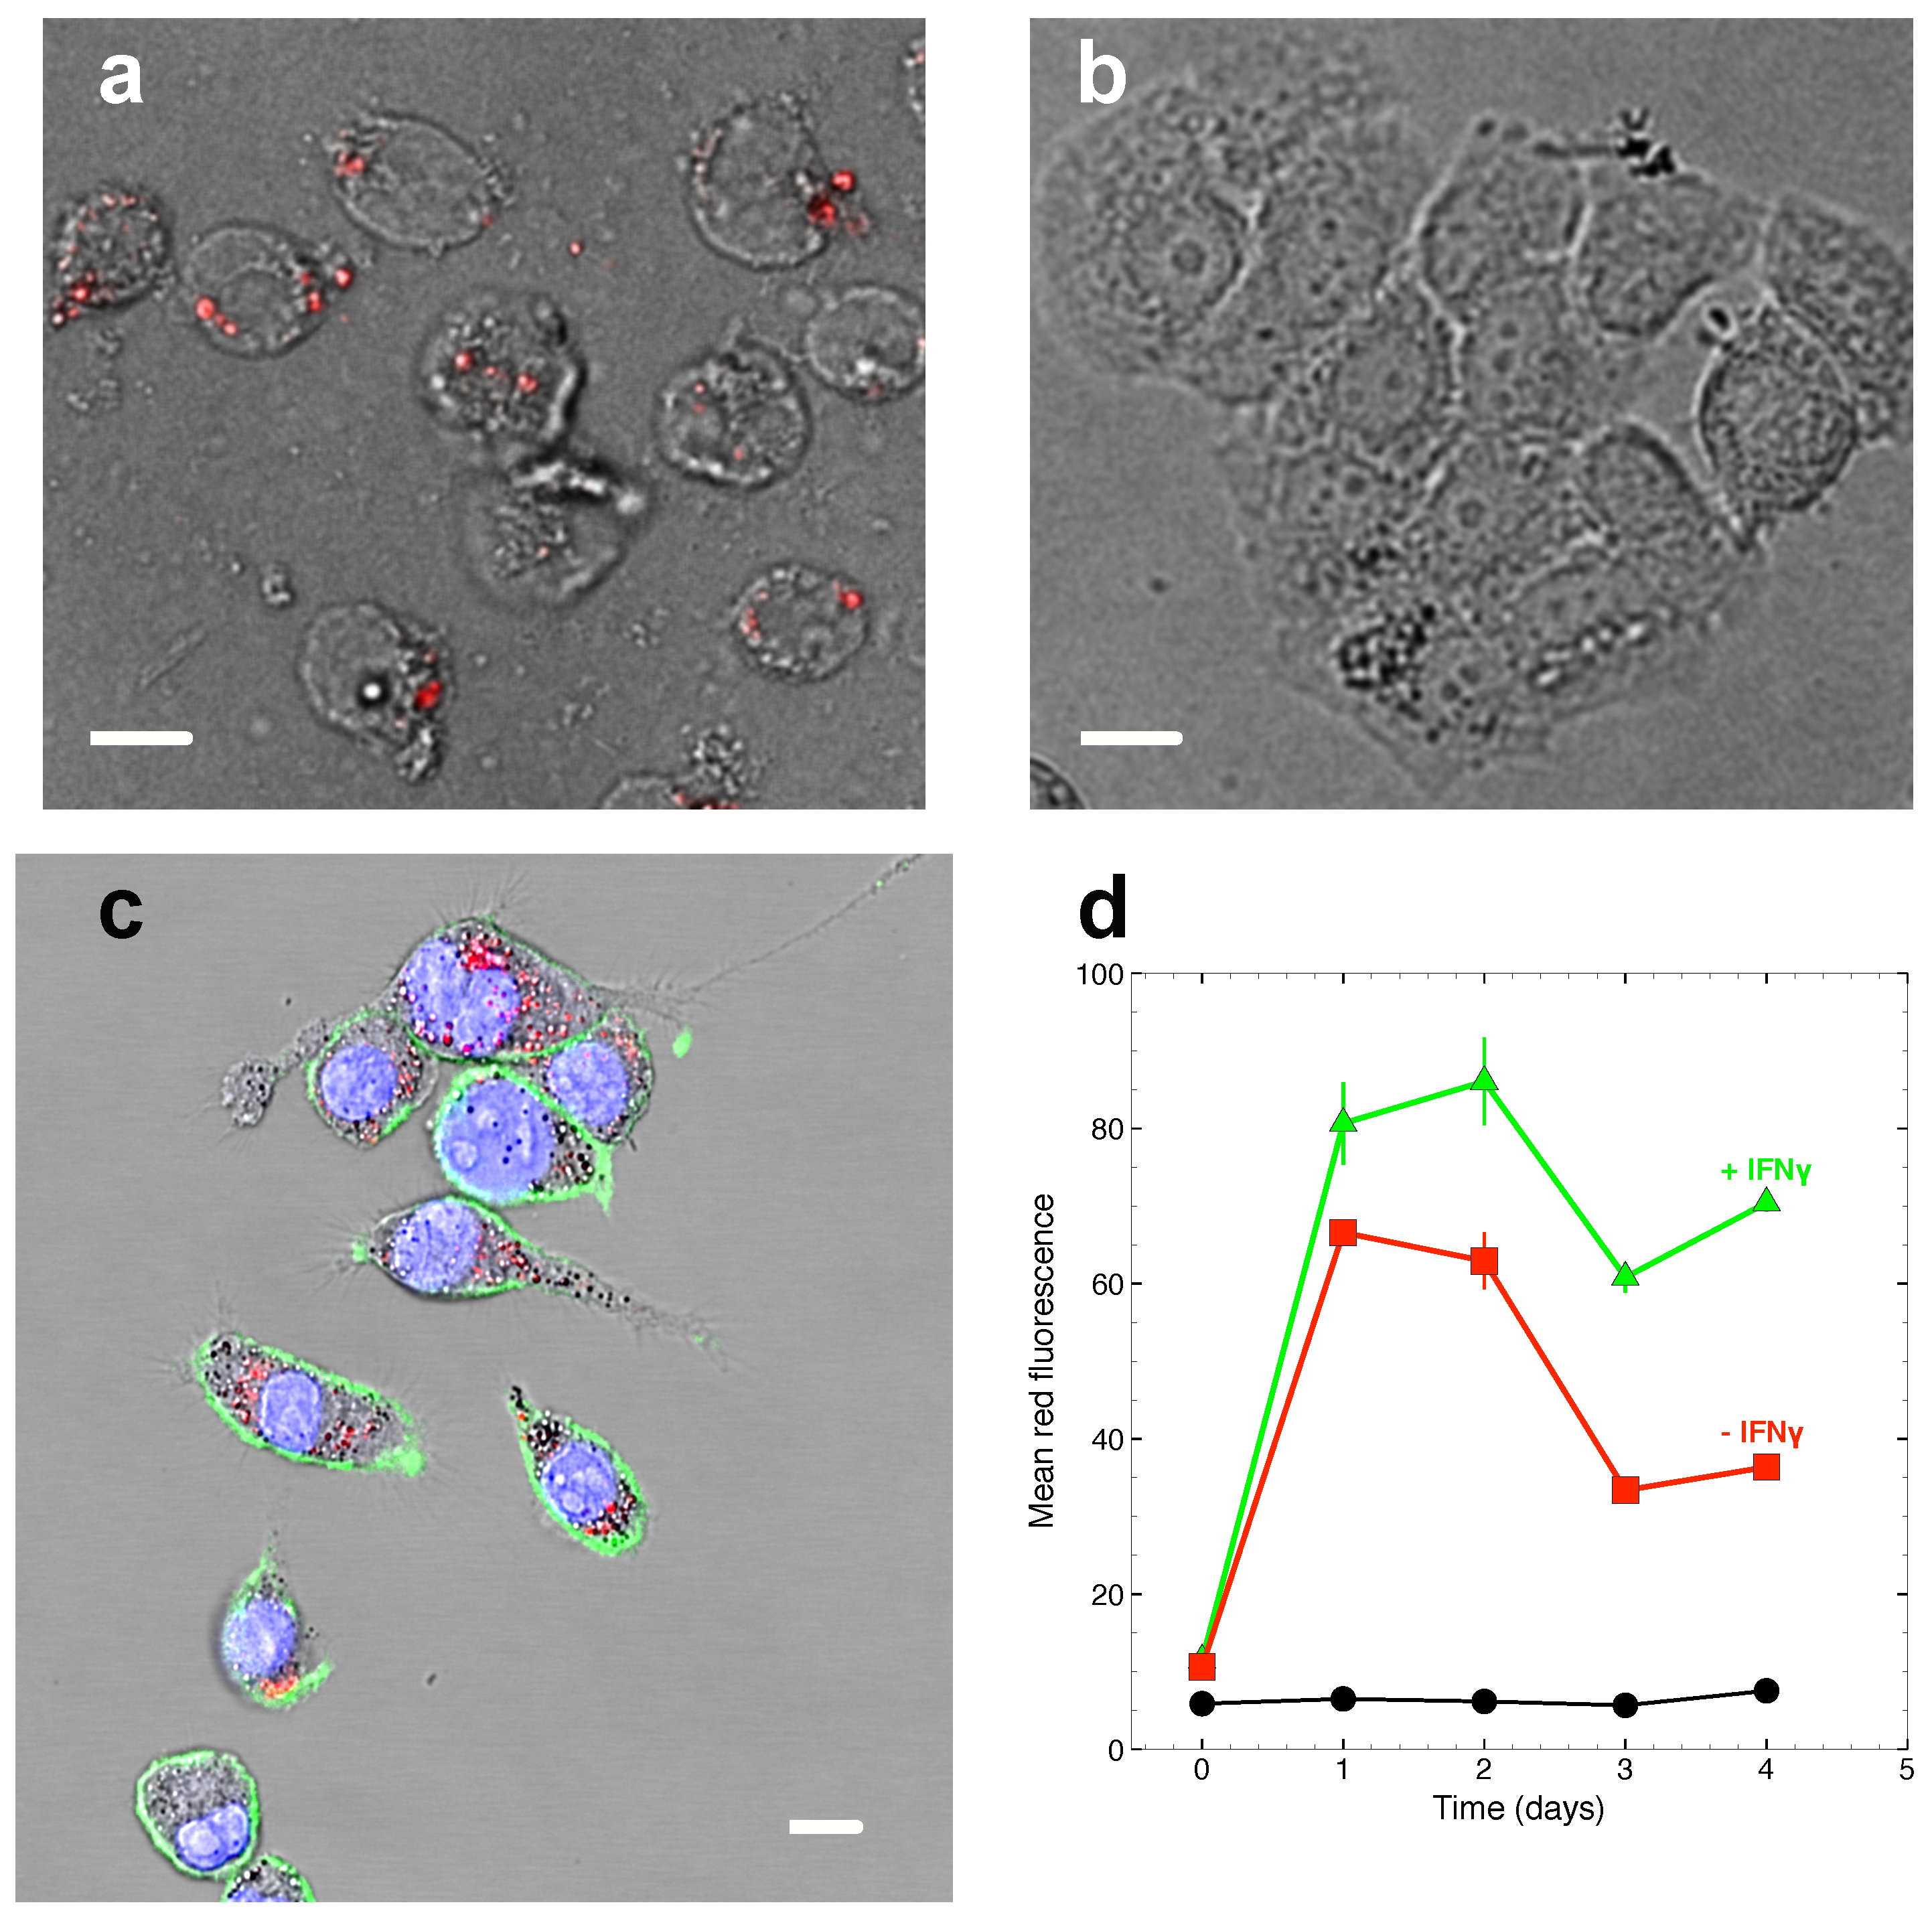
2.2. Phagocytosis of ASX-Loaded Microparticles in J774A.1 Macrophages
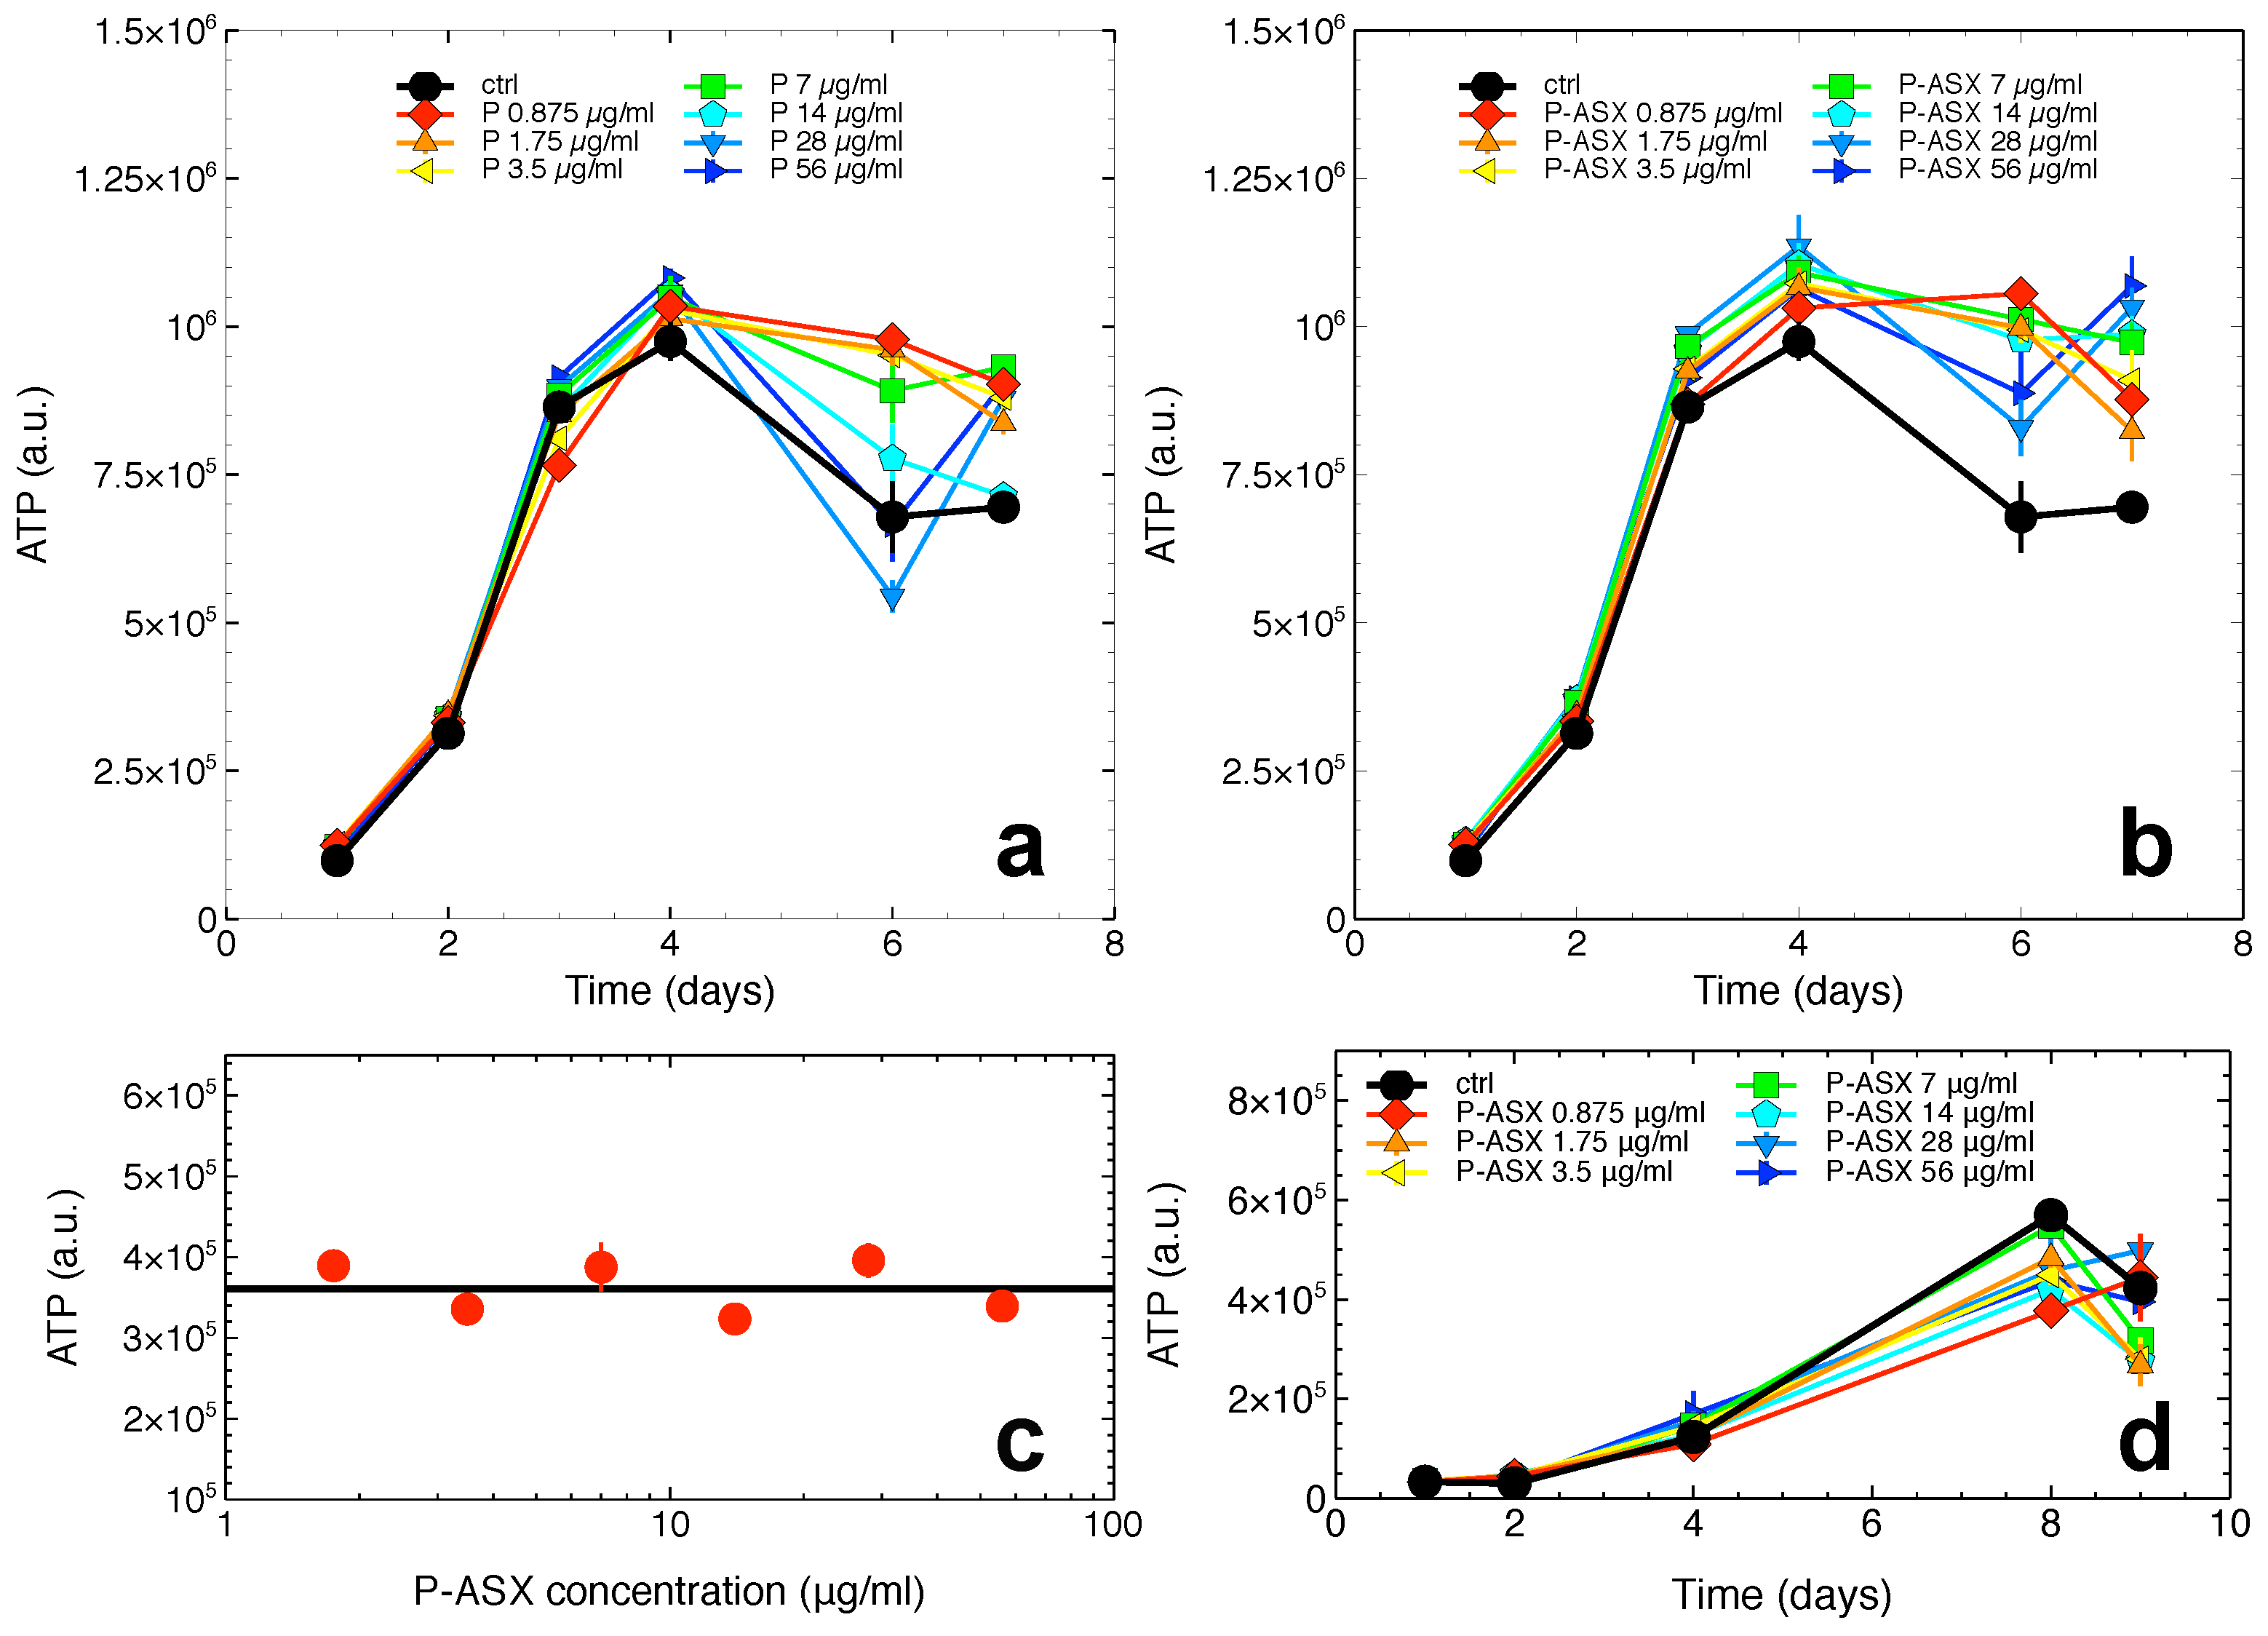
2.3. Cytotoxicity of ASX-Loaded Microparticles on J774 A.1 Cells
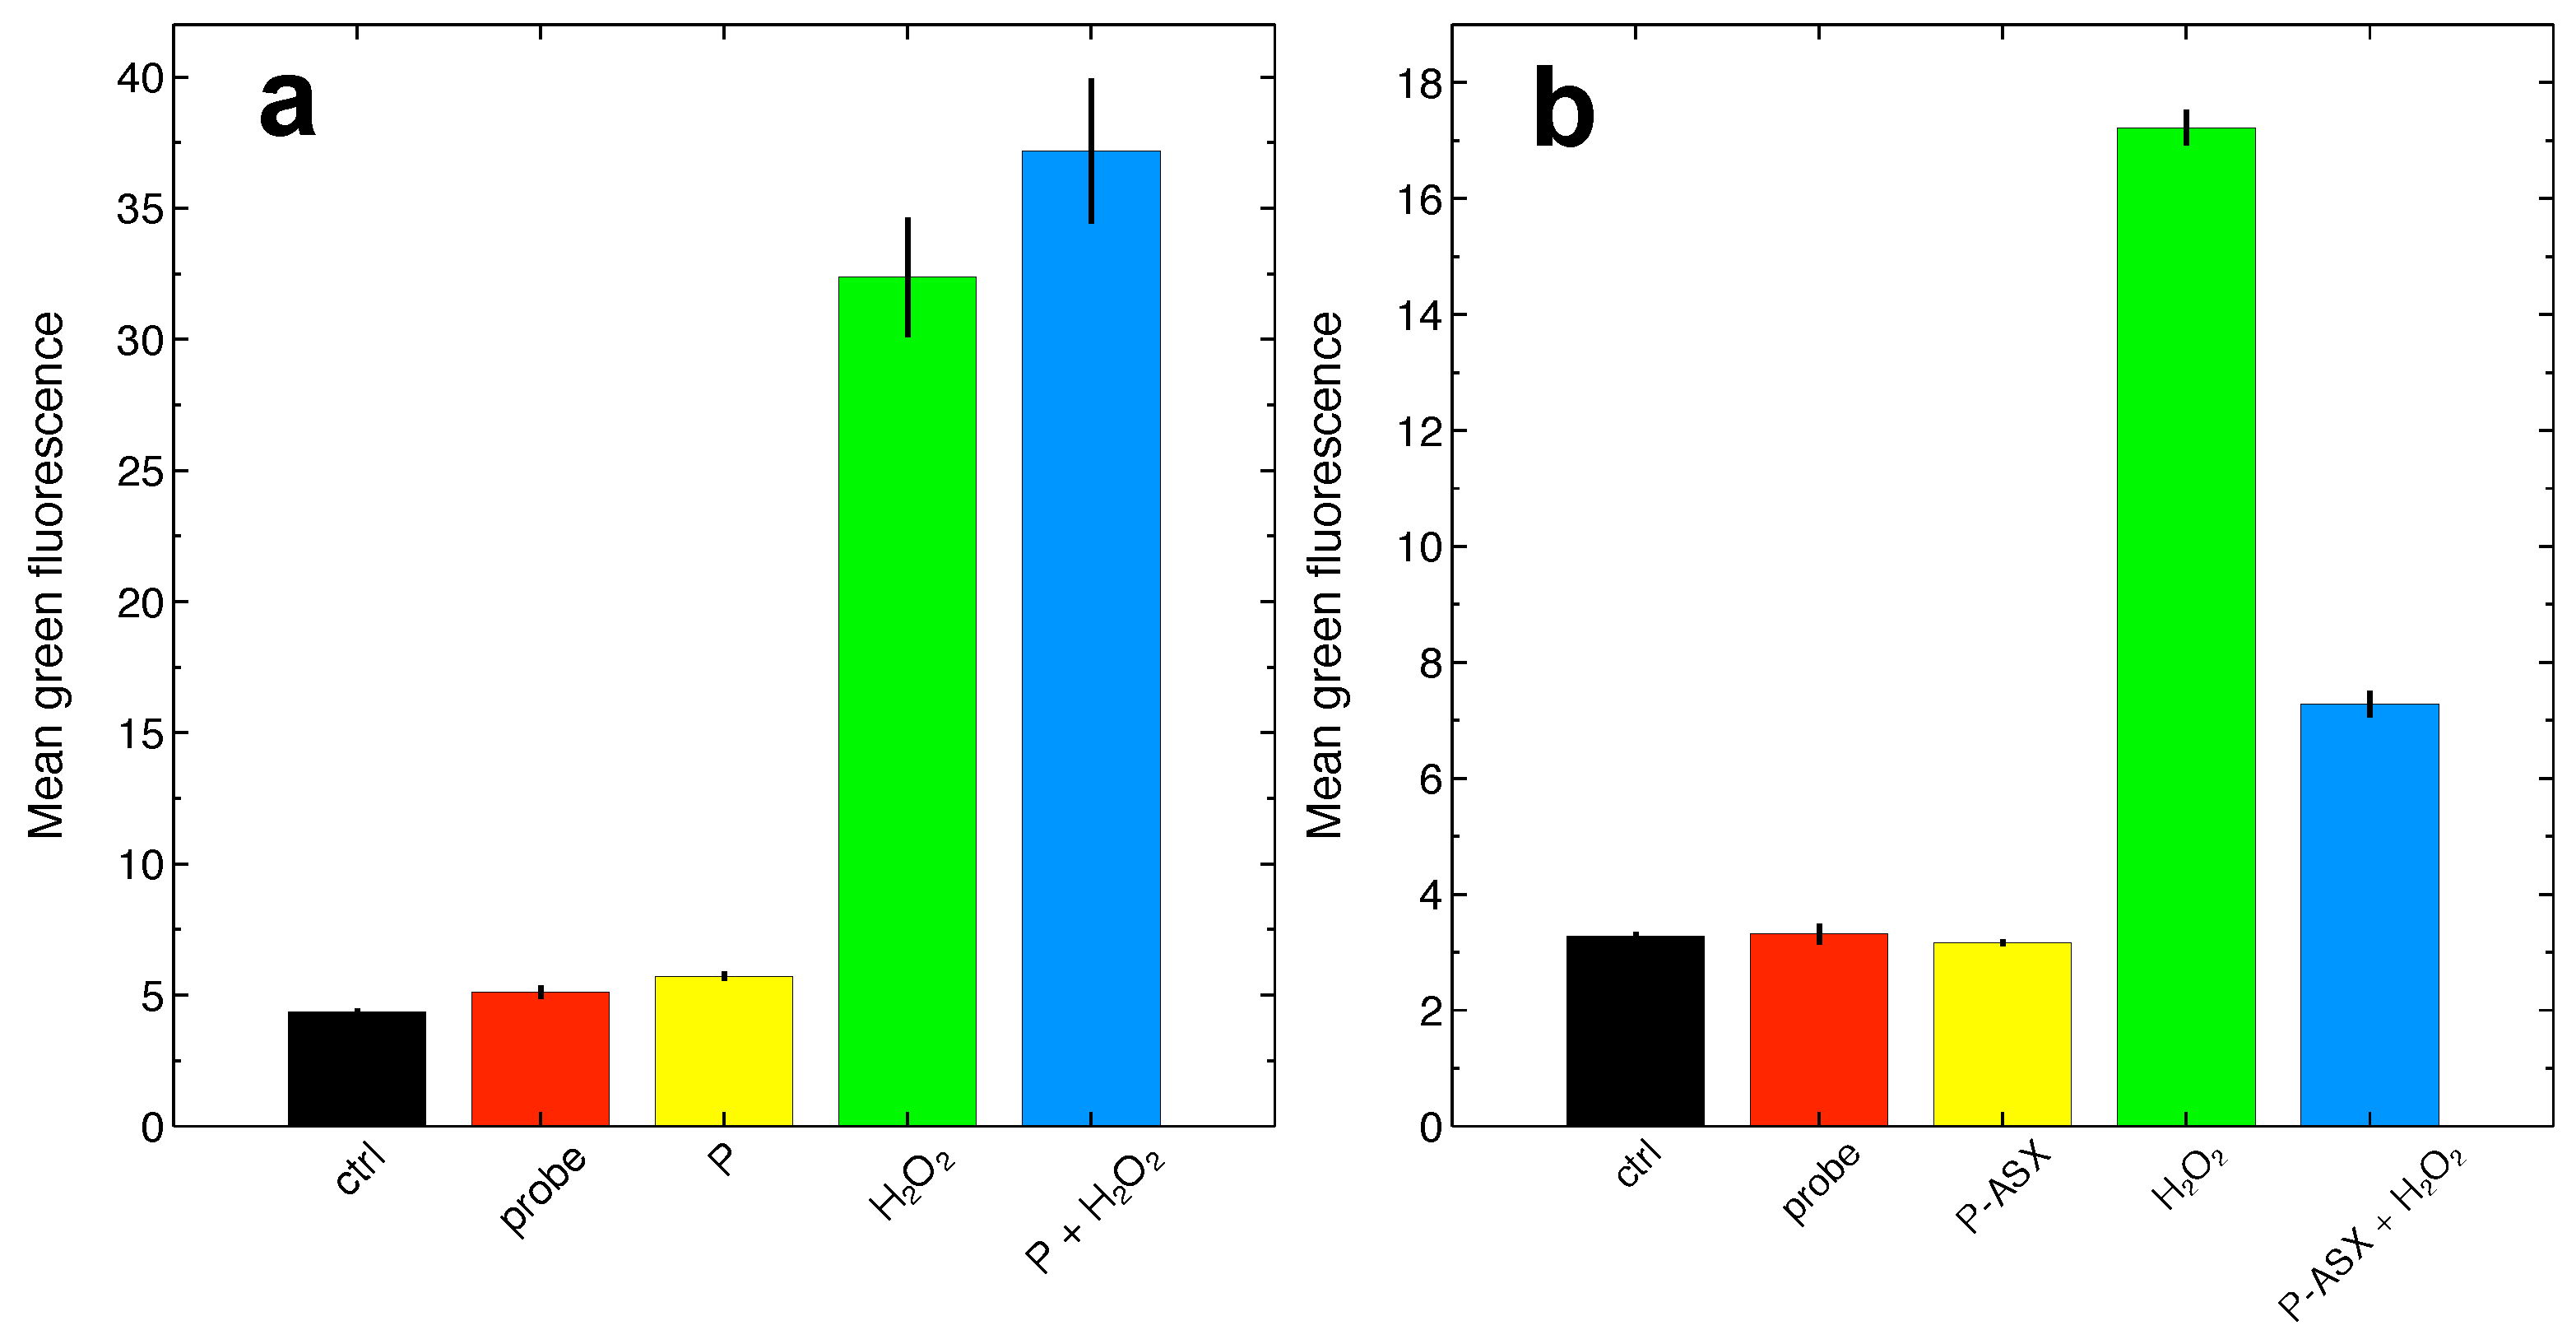
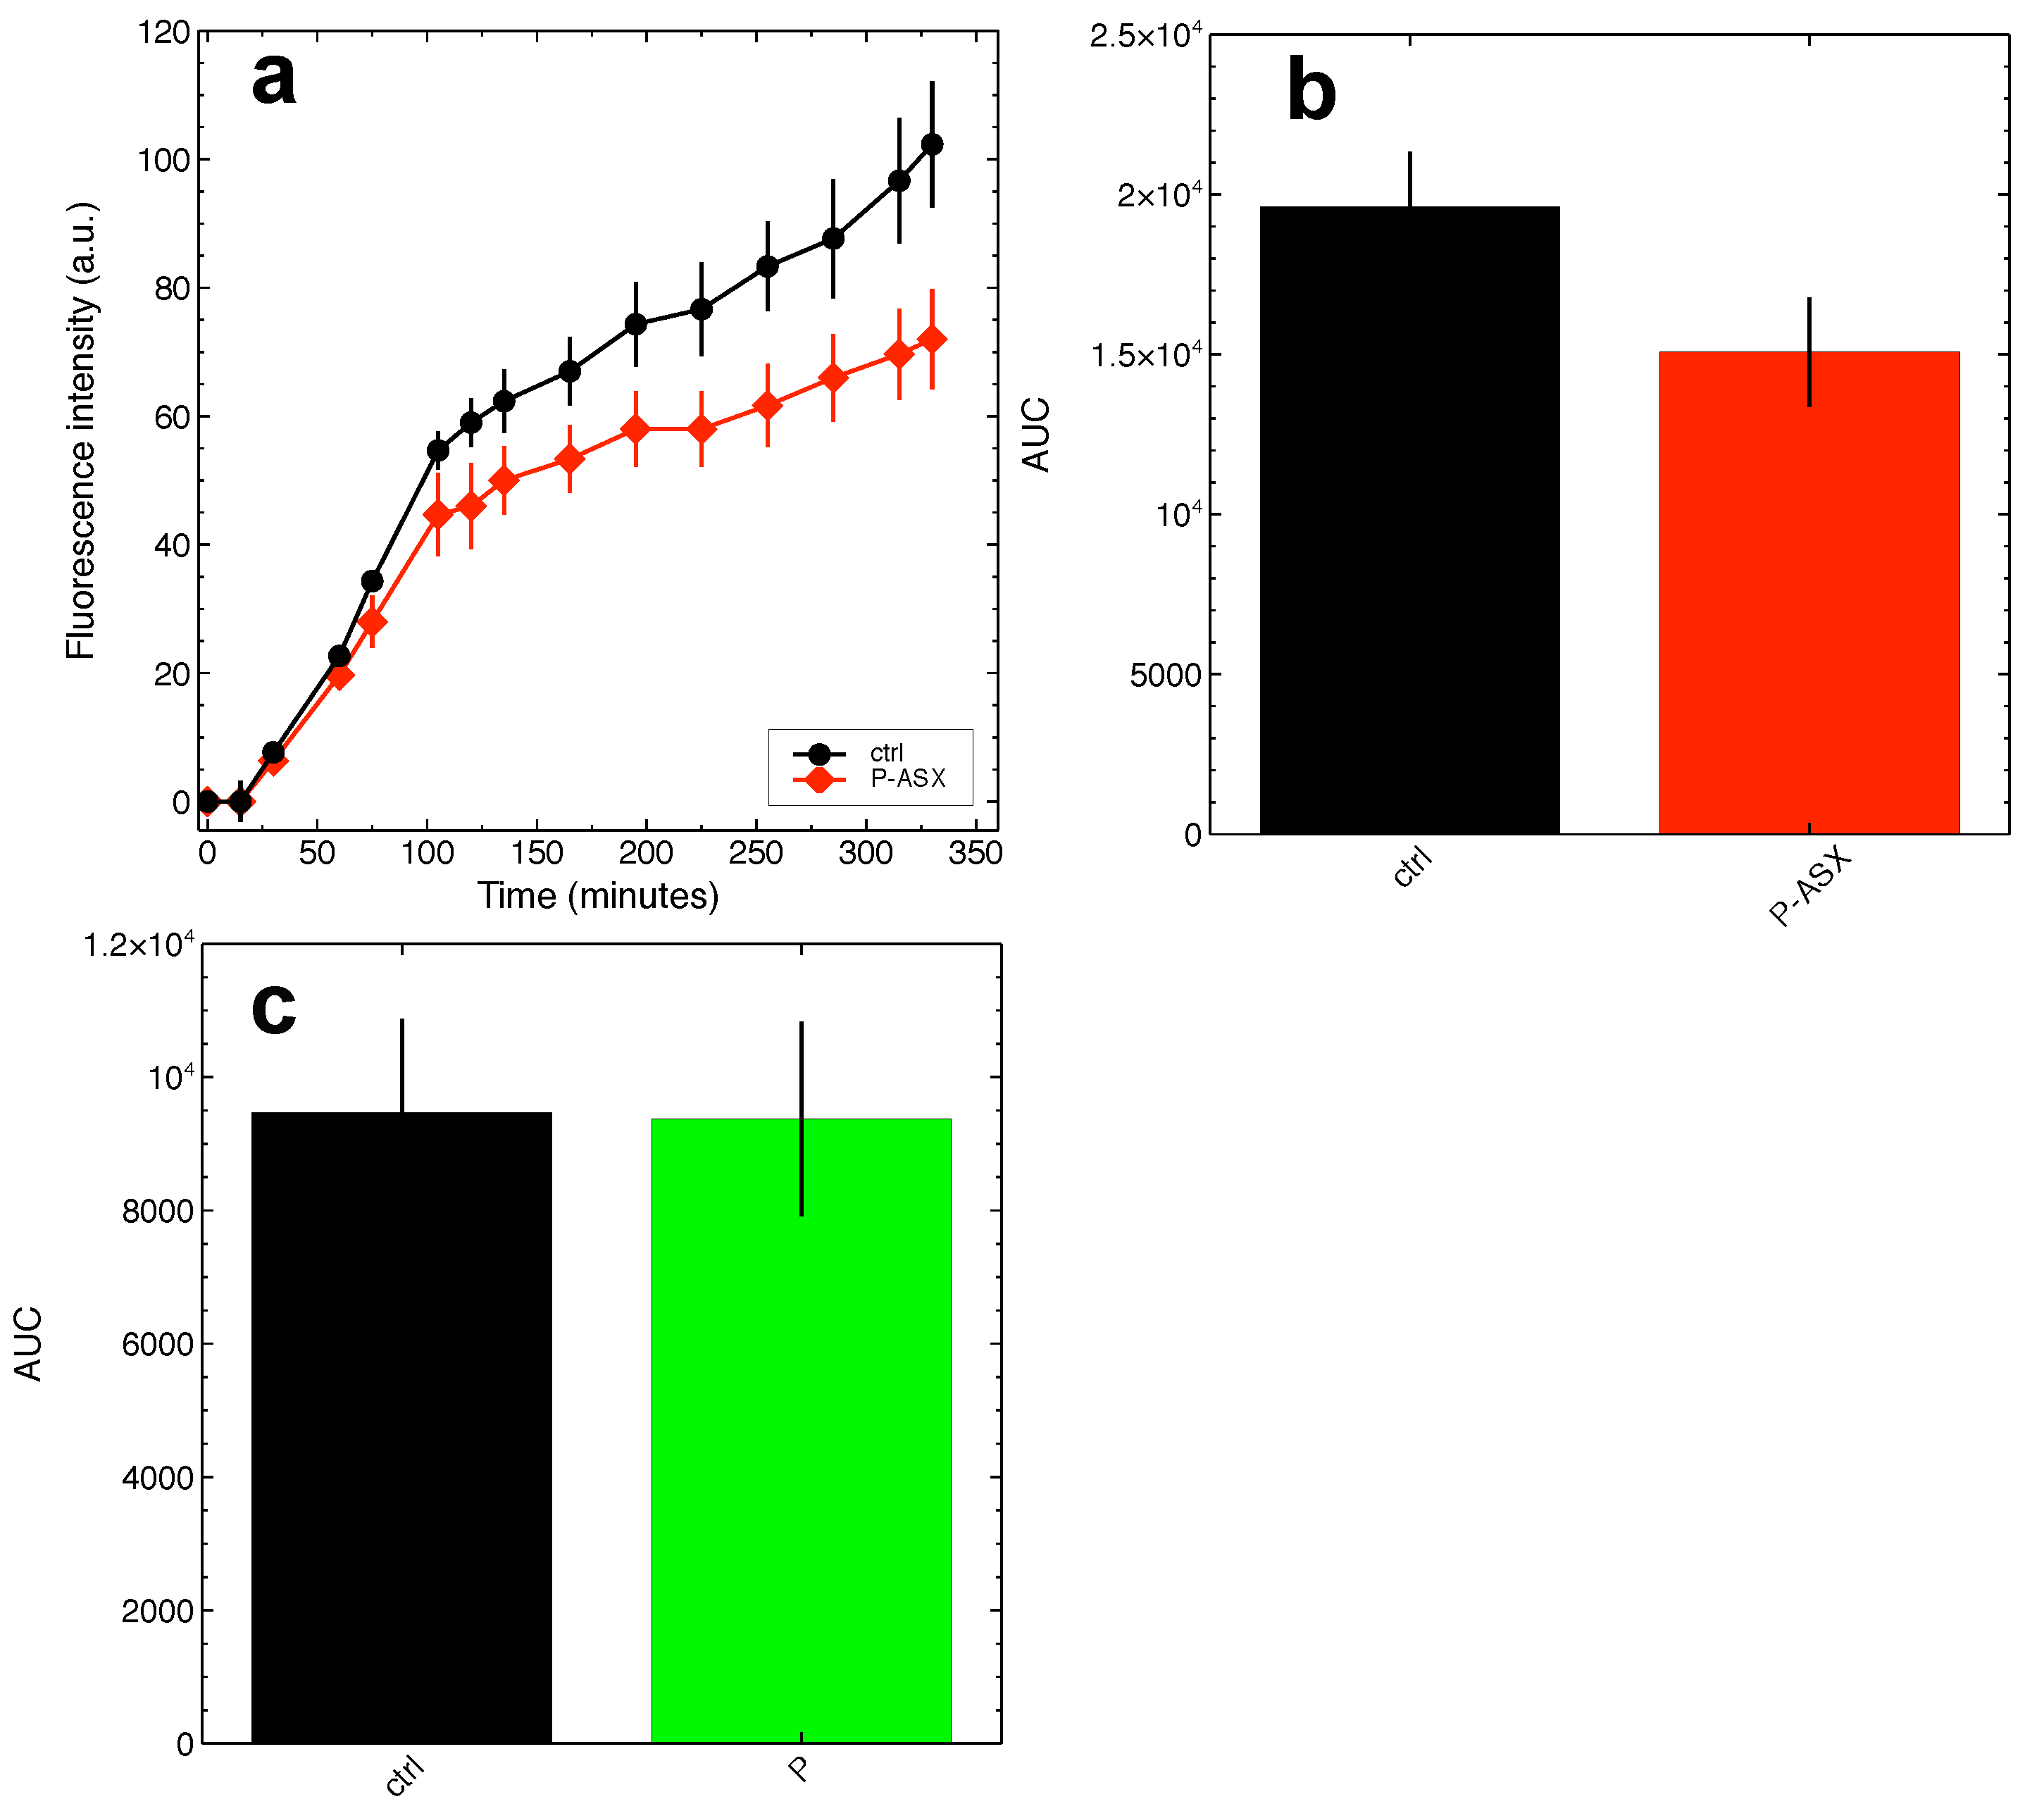
2.4. Effects of ASX-Loaded Microparticles on Intracellular ROS Levels
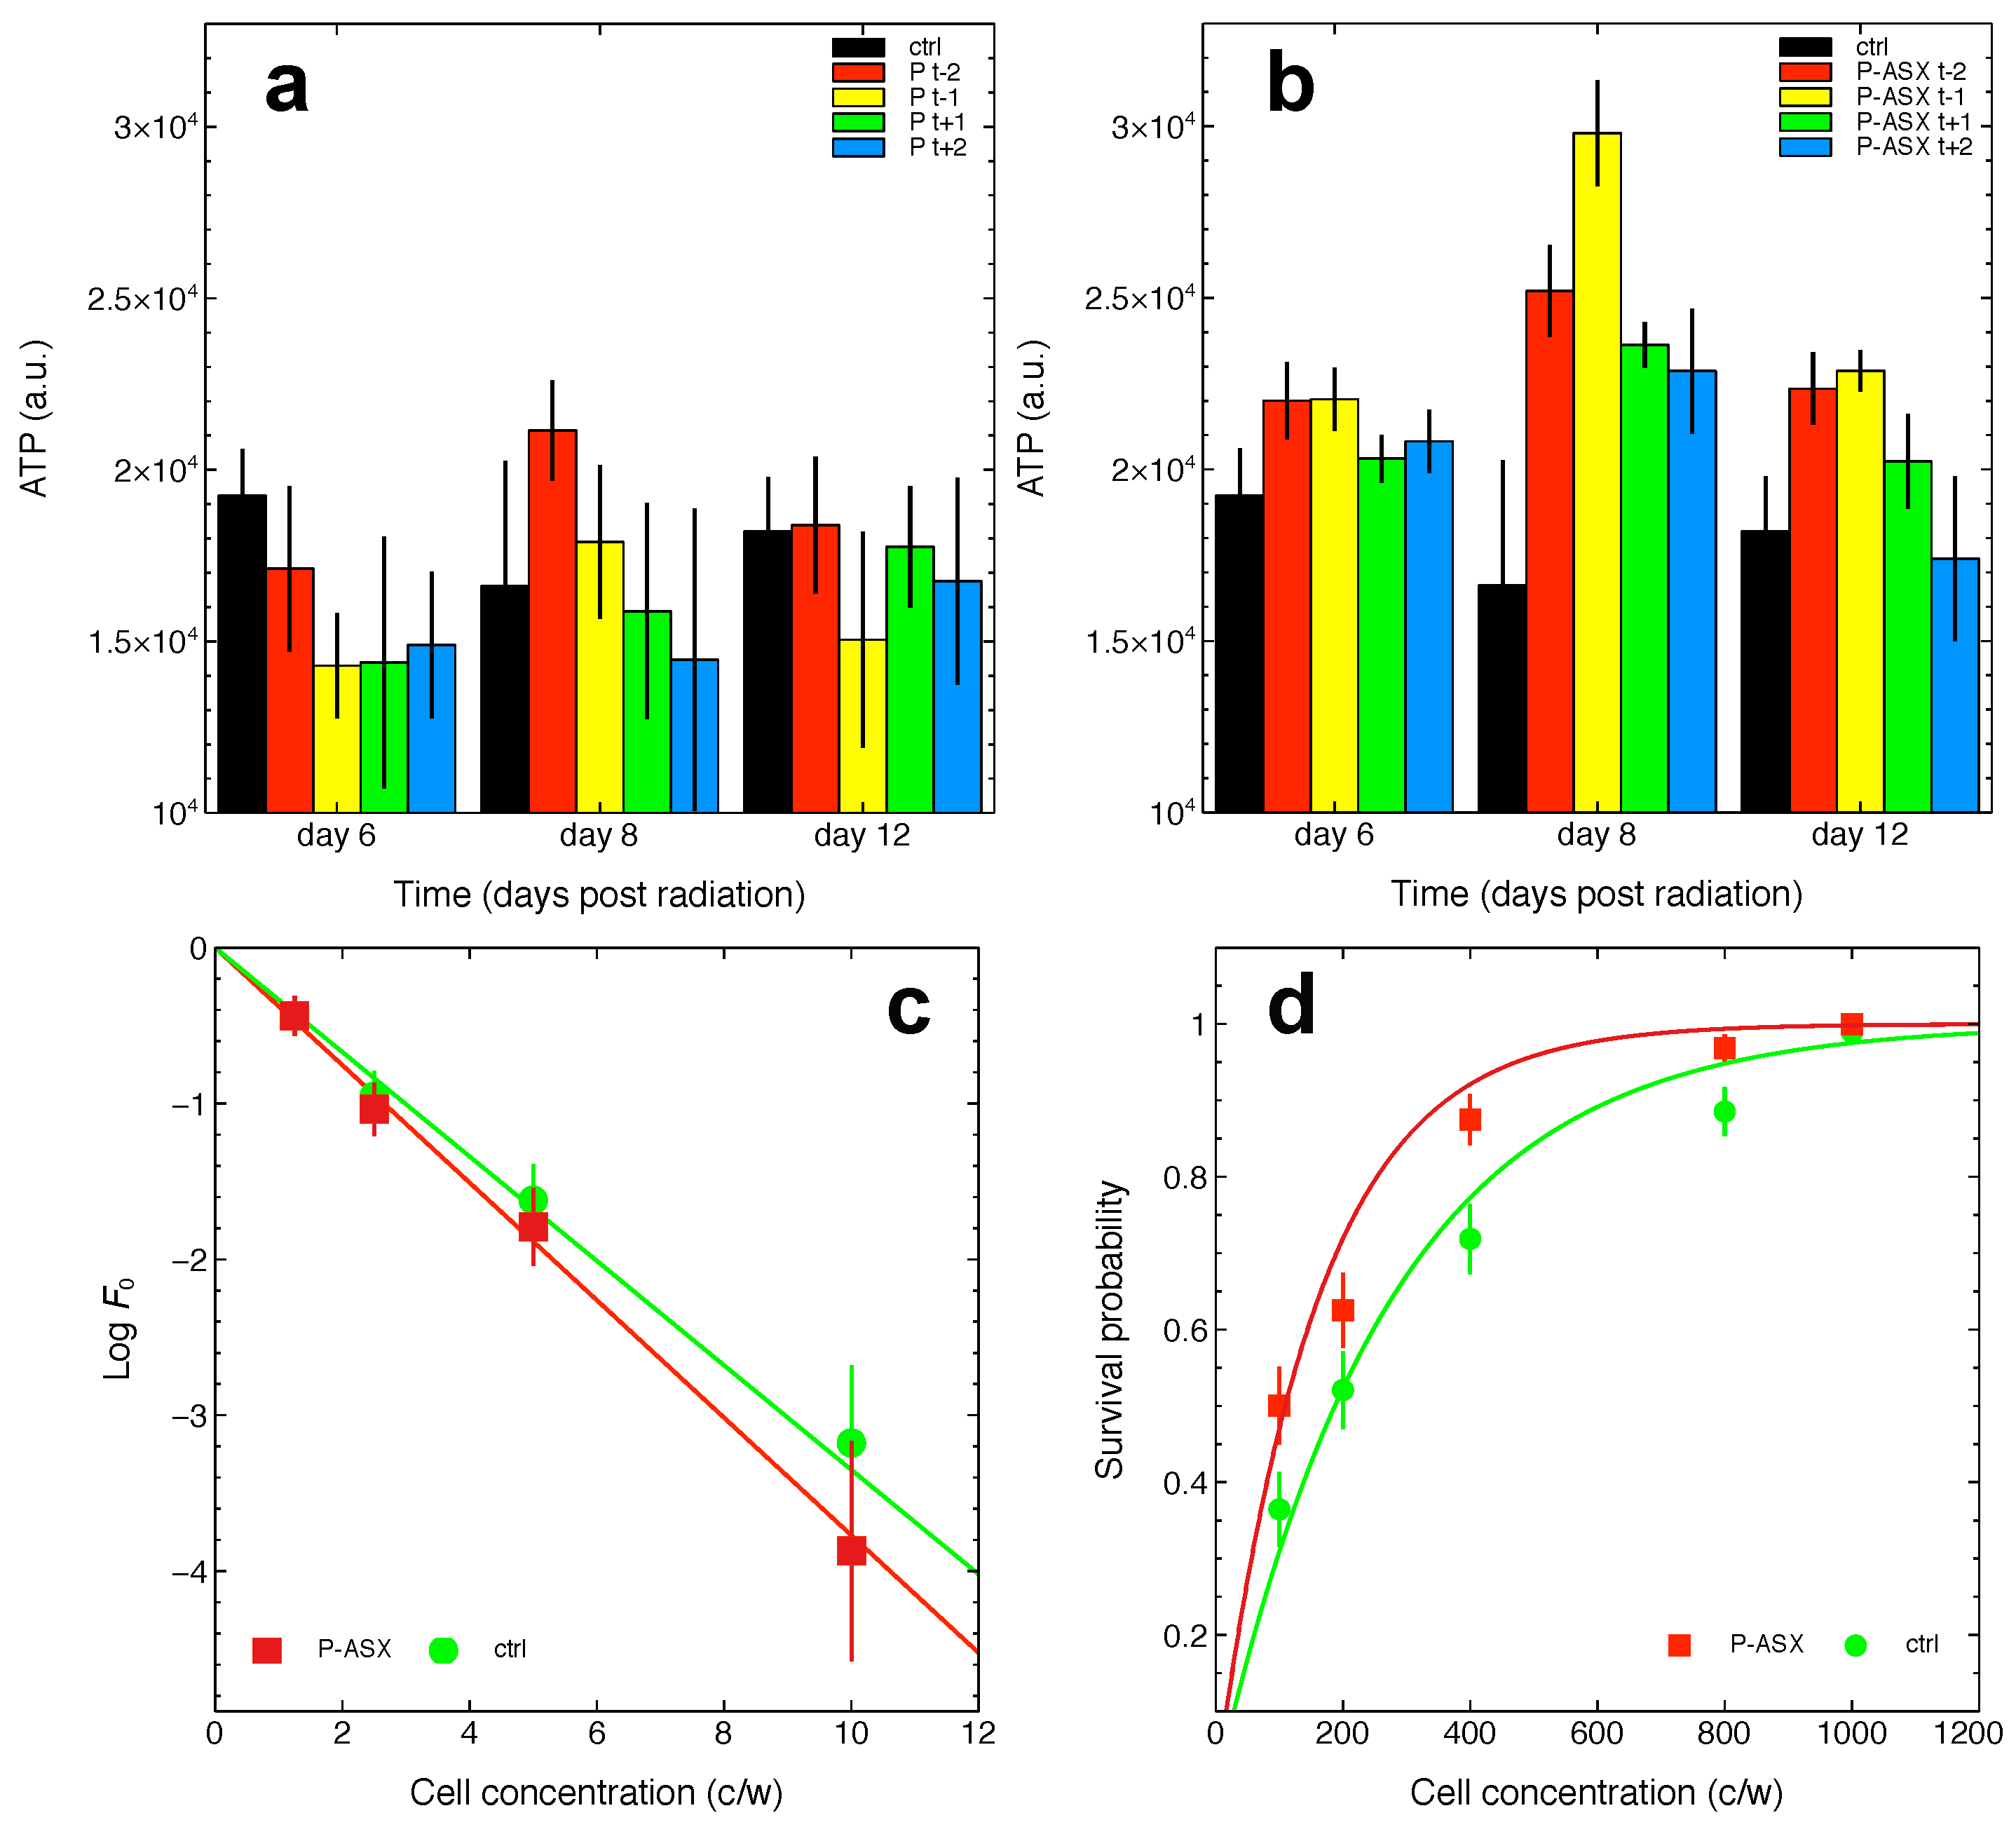
2.5. Effects of Radiation and of ASX-Loaded Microparticles Treatments on J774 A.1 Cells
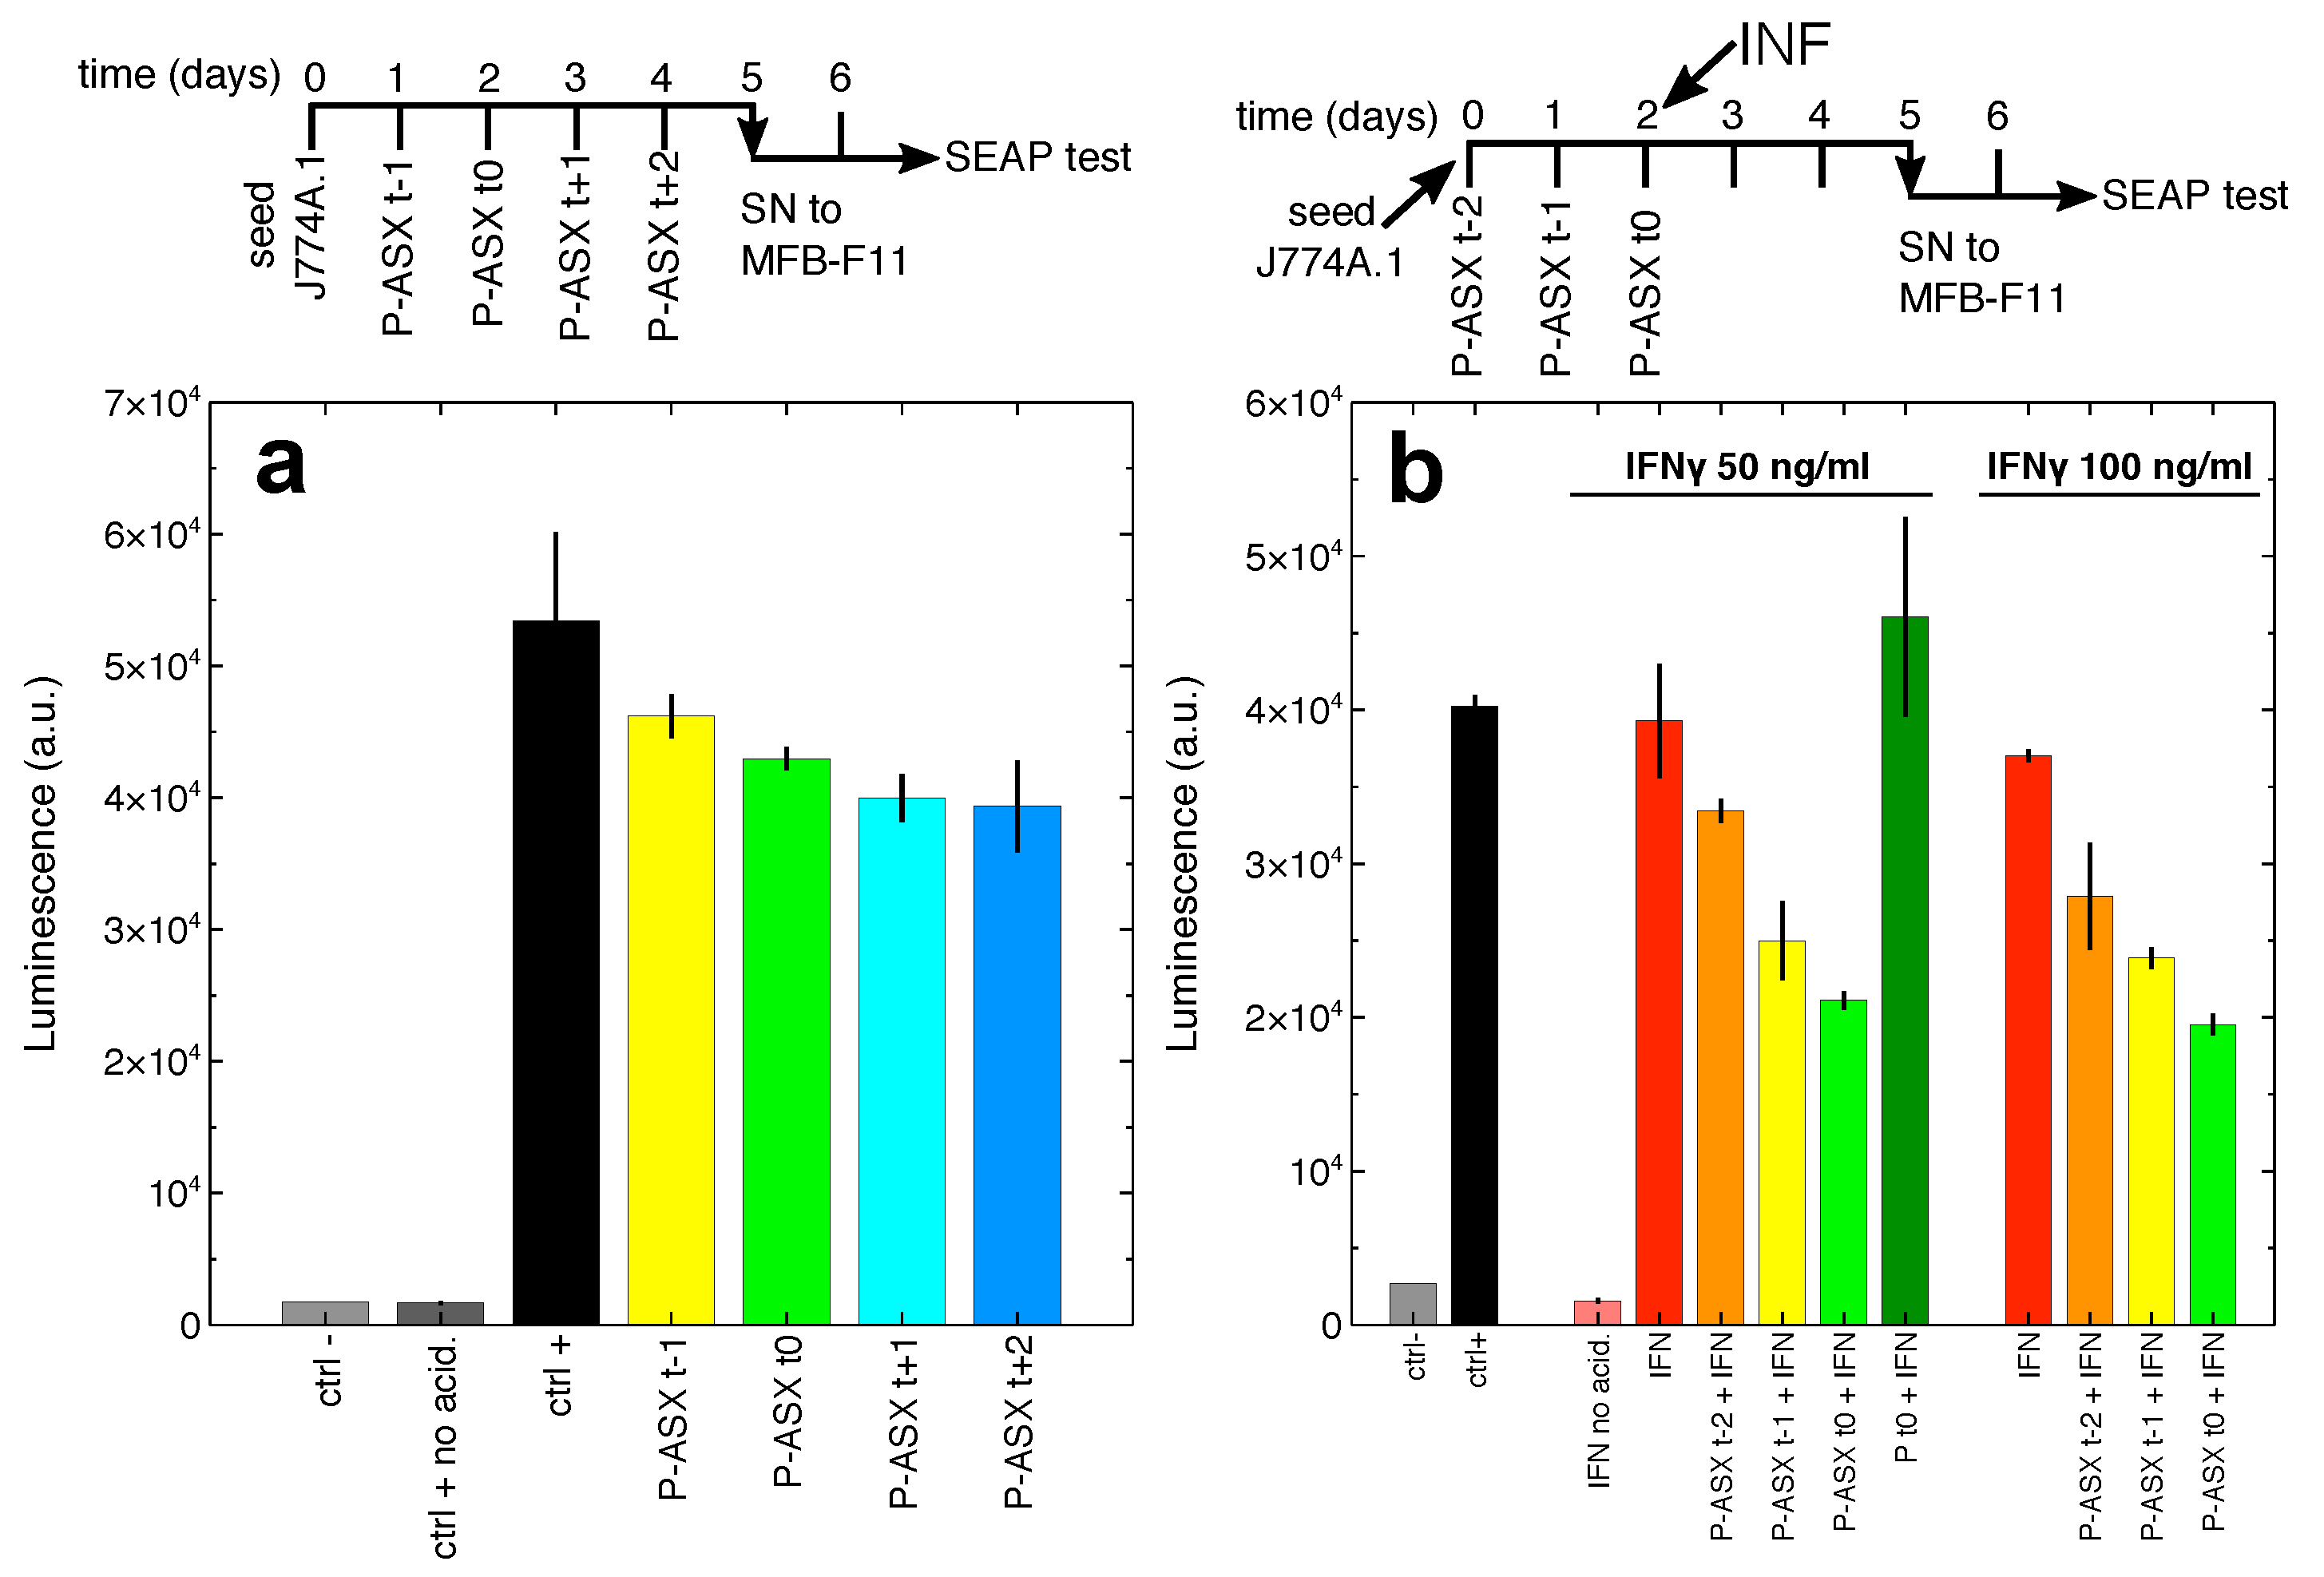
2.6. Secretion of Bioactive TGF by Macrophages Treated with ASX-Loaded Microparticles
3. Discussion
4. Materials and Methods
4.1. Astaxanthin and Microparticles
4.2. Cells and Cell Culture
4.3. Microscopy
4.4. Cytotoxicity Assays
4.5. Flow Cytometry
4.6. ROS Measurements
4.7. Irradiation
4.8. Analysis of Irradiated ASX-Loaded Microparticles by Thin Layer Chromatography
4.9. Effects of Radiation on Cells: Statistical Models and Experiments
4.10. Measuring Bioactive TGF
4.11. Convertases Activity Assay
4.12. Statistics
Author Contributions
Funding
Institutional Review Board Statement
Informed Consent Statement
Data Availability Statement
Acknowledgments
Conflicts of Interest
Abbreviations
| RIF | Radiation-induced fibrosis |
| SN | Culture supernatants |
| ASX | Astaxanthin |
| ROS | Reactive oxygen species |
| RNS | Reactive nitrogen species |
| TGF | Transforming growth factor beta |
| LAP | Latency associated peptide |
| IFN | Interferon gamma |
| SEAP | Secreted alkaline phosphatase |
| FITC | Fluorescein isothiocyanate |
| DAPI | 4,6-Diamidino-2-phenylindole |
| DCF-DA | 2,7-Dichlorofluorescein diacetate |
| SSC | Side scatter |
| FSC | Forward angle light-scatter |
References
- Fakhria, S.; Abbaszadehb, F.; Dargahic, L.; Jorjania, M. Astaxanthin: A mechanistic review on its biological activities and health benefits. Pharmacol. Res. 2018, 136, 1–20. [Google Scholar] [CrossRef]
- Sies, H.; Berndt, C.; Jones, D.P. Oxidative stress. Annu. Rev. Biochem. 2017, 86, 715–748. [Google Scholar] [CrossRef]
- Matés, J.M.; Pérez-Gómez, C.; Núñez de Castro, I. Antioxidant enzymes and human diseases. Clin. Biochem. 1999, 32, 595–603. [Google Scholar] [CrossRef]
- Litwinienko, G.; Ingold, K.U. Solvent effects on the rates and mechanisms of reaction of phenols with free radicals. Acc. Chem. Res. 2007, 40, 222–230. [Google Scholar] [CrossRef] [PubMed]
- Fedorova, G.F.; Menshov, V.A.; Trofimov, A.V.; Vasil’ev, R.F. Facile chemiluminescence assay for antioxidative properties of vegetable lipids: Fundamentals and illustrative examples. Analyst 2009, 134, 2128–2134. [Google Scholar] [CrossRef] [PubMed]
- Lee, C.Y.; Sharma, A.; Semenya, J.; Anamoah, C.; Chapman, K.N.; Barone, V. Computational study of ortho-substituent effects on antioxidant activities of phenolic dendritic antioxidants. Antioxidants 2020, 9, 189. [Google Scholar] [CrossRef] [PubMed] [Green Version]
- Litwinienko, G.; Ingold, K.U. Abnormal solvent effects on hydrogen atom abstraction. 3. Novel kinetics in sequential proton loss electron transfer chemistry. J. Org. Chem. 2005, 70, 8982–8990. [Google Scholar] [CrossRef] [PubMed] [Green Version]
- Goto, S.; Kogure, K.; Abe, K.; Kimata, Y.; Kitahama, K.; Yamashita, E.; Terada, H. Efficient radical trapping at the surface and inside the phospholipid membrane is responsible for highly potent antiperoxidative activity of the carotenoid astaxanthin. Biochim. Biophys. Acta 2001, 1512, 251–258. [Google Scholar] [CrossRef] [Green Version]
- Hirayama, D.; Iida, T.; Nakase, H. The phagocytic function of macrophage-enforcing innate immunity and tissue homeostasis. Int. J. Mol. Sci. 2017, 19, 92. [Google Scholar] [CrossRef] [Green Version]
- Turnera, M.D.; Nedjaib, B.; Hursta, T.; Penningtonc, D.J. Cytokines and chemokines: At the crossroads of cell signalling and inflammatory disease. Biochim. Biophys. Acta 2014, 1843, 2563–2582. [Google Scholar] [CrossRef] [PubMed] [Green Version]
- Bennett, J.M.; Reeves, G.; Billman, G.E.; Sturmberg, J.P. Inflammation-Nature’s way to efficiently respond to all types of challenges: Implication for understanding and managing the epidemic of chronic diseases. Front. Med. 2018, 5, 316. [Google Scholar] [CrossRef] [Green Version]
- Straub, J.M.; New, J.; Hamilton, C.D.; Lominska, C.; Shnayder, Y.; Thomas, S.M. Radiation-induced fibrosis: Mechanisms and implications for therapy. J. Cancer Res. Clin. Oncol. 2015, 141, 1985–1994. [Google Scholar] [CrossRef] [Green Version]
- Baskar, R.; Lee, K.A.; Yeo, R.; Yeoh, K.W. Cancer and radiation therapy: Current advances and future directions. Int. J. Med. Sci. 2012, 9, 193–199. [Google Scholar] [CrossRef] [PubMed] [Green Version]
- Käsmann, L.; Dietrich, A.; Staab-Weijnitz, C.A.; Manapov, F.; Behr, J.; Rimner, A.; Jeremic, B.; Senan, S.; De Ruysscher, D.; Lauber, K.; et al. Radiation-induced lung toxicity—Cellular and molecular mechanisms of pathogenesis, management, and literature review. Radiat. Oncol. 2020, 15, 214. [Google Scholar] [CrossRef] [PubMed]
- Azzam, E.; Jay Gerin, J.P.; Pain, D. Ionizing radiation-induced metabolic oxidative stress and prolonged cell injury. Cancer Lett. 2012, 327, 48–60. [Google Scholar] [CrossRef] [PubMed] [Green Version]
- Baskar, R.; Dai, J.; Wenlong, N.; Yeo, R.; Yeoh, K.W. Biological response of cancer cells to radiation treatment. Front. Mol. Biosci. 2014, 1, 24. [Google Scholar] [CrossRef] [PubMed] [Green Version]
- Liu, R.M.; Desai, L.P. Reciprocal regulation of TGF-β and reactive oxygen species: A perverse cycle for fibrosis. Redox Biol. 2015, 6, 565–577. [Google Scholar] [CrossRef] [Green Version]
- Delanian, S.; Lefaix, J.L. Current management for late normal tissue injury: Radiation-induced fibrosis and necrosis. Semin. Radiat. Oncol. 2007, 17, 99–107. [Google Scholar] [CrossRef] [PubMed]
- Zanoni, F.; Vakarelova, M.; Zoccatelli, G. Development and characterization of astaxanthin-containing whey protein-based nanoparticles. Mar. Drugs 2019, 17, 627. [Google Scholar] [CrossRef] [Green Version]
- Champion, J.A.; Walker, A.; Mitragotri, S. Role of particle size in phagocytosis of polymeric microspheres. Pharm. Res. 2008, 25, 1815–1821. [Google Scholar] [CrossRef] [Green Version]
- Takahashi, T. Routine management of microalgae using autofluorescence from chlorophyll. Molecules 2019, 24, 4441. [Google Scholar] [CrossRef] [PubMed] [Green Version]
- Schroder, K.; Hertzog, P.J.; Ravasi, T.; Hume, D.A. Interferon-γ: An overview of signals, mechanisms and functions. J. Leukoc. Biol. 2004, 75, 163–189. [Google Scholar] [CrossRef] [PubMed]
- Franken, N.A.P.; Rodermond, H.M.; Stap, J.; Haveman, J.; Van Bree, C. Clonogenic assay of cells in vitro. Nat. Protoc. 2006, 1, 2315–2319. [Google Scholar] [CrossRef] [PubMed]
- Chignola, R.; Sega, M.; Molesini, B.; Baruzzi, A.; Stella, S.; Milotti, E. Collective radioresistance of T47D breast carcinoma cells is mediated by a Syncytin-1 homologous protein. PLoS ONE 2019, 14, e0206713. [Google Scholar] [CrossRef] [PubMed] [Green Version]
- Tesseur, I.; Zou, K.; Berber, E.; Zhang, H.; Wyss-Coray, T. Highly sensitive and specific bioassay for measuring bioactive TGF-β. BMC Cell Biol. 2006, 7, 15. [Google Scholar] [CrossRef] [Green Version]
- Jakobse, S.S.; Larsen, A.; Stoltenberg, M.; Bruun, J.M.; Soballe, K. Hydroxyapatite coatings did not increase TGF-beta and BMP-2 secretion in murine J774A.1 macrophages, but induced a pro-inflammatory cytokine response. J. Biomater. Sci. Polym. Ed. 2009, 20, 455–465. [Google Scholar] [CrossRef] [PubMed]
- Dubois, C.M.; Blanchette, F.; Laprise, M.H.; Leduc, R.; Grondin, F.; Seidah, N.G. Evidence that furin is an authentic transforming growth factor-β1-converting enzyme. Am. J. Pathol. 2001, 158, 305–316. [Google Scholar] [CrossRef]
- Basak, A. Inhibitors of proprotein convertases. J. Mol. Med. 2005, 83, 844–855. [Google Scholar] [CrossRef] [PubMed]
- López Rodríguez, M.; Cerezo Padellano, L. Toxicity associated to radiotherapy treatment in lung cancer patients. Clin. Transl. Oncol. 2007, 9, 506–512. [Google Scholar] [CrossRef] [PubMed]
- Souza, C.; Mônico, D.A.; Tedesco, A.C. Implications of dichlorofluorescein photoinstability for detection of UVA-induced oxidative stress in fibroblasts and keratinocyte cells. Photochem. Photobiol. Sci. 2020, 19, 40–48. [Google Scholar] [CrossRef] [PubMed]
- Lefkovits, I.; Waldmann, H. Limiting Dilution Analysis of Cells in the Immune System, 1st ed.; Cambridge University Press: Cambridge, UK, 1979; pp. 38–82. [Google Scholar]


Publisher’s Note: MDPI stays neutral with regard to jurisdictional claims in published maps and institutional affiliations. |
© 2021 by the authors. Licensee MDPI, Basel, Switzerland. This article is an open access article distributed under the terms and conditions of the Creative Commons Attribution (CC BY) license (http://creativecommons.org/licenses/by/4.0/).
Share and Cite
Binatti, E.; Zoccatelli, G.; Zanoni, F.; Donà, G.; Mainente, F.; Chignola, R. Phagocytosis of Astaxanthin-Loaded Microparticles Modulates TGFβ Production and Intracellular ROS Levels in J774A.1 Macrophages. Mar. Drugs 2021, 19, 163. https://0-doi-org.brum.beds.ac.uk/10.3390/md19030163
Binatti E, Zoccatelli G, Zanoni F, Donà G, Mainente F, Chignola R. Phagocytosis of Astaxanthin-Loaded Microparticles Modulates TGFβ Production and Intracellular ROS Levels in J774A.1 Macrophages. Marine Drugs. 2021; 19(3):163. https://0-doi-org.brum.beds.ac.uk/10.3390/md19030163
Chicago/Turabian StyleBinatti, Eleonora, Gianni Zoccatelli, Francesca Zanoni, Giulia Donà, Federica Mainente, and Roberto Chignola. 2021. "Phagocytosis of Astaxanthin-Loaded Microparticles Modulates TGFβ Production and Intracellular ROS Levels in J774A.1 Macrophages" Marine Drugs 19, no. 3: 163. https://0-doi-org.brum.beds.ac.uk/10.3390/md19030163