Assessment of Upstream Petroleum Fiscal Regimes in Myanmar

1
Oil and Gas Planning Department, Ministry of Electricity and Energy, Building number 6, Nay Pyi Taw 15011, Myanmar
2
Economics and Marketing Academic Group, College of Business, Law and Governance, James Cook University, P. O. Box 6811, Cairns Qld 4870, Australia
*
Author to whom correspondence should be addressed.
J. Risk Financial Manag. 2018, 11(4), 85; https://0-doi-org.brum.beds.ac.uk/10.3390/jrfm11040085
Submission received: 28 October 2018
/
Revised: 25 November 2018
/
Accepted: 28 November 2018
/
Published: 1 December 2018
(This article belongs to the Special Issue Energy Finance and Sustainable Development)
Abstract
:This study aims to assess Myanmar’s upstream petroleum fiscal regimes by applying comprehensive indicators to rank the level of attractiveness of Myanmar. The indicators include government take (GT), front loading index (FLI), and composite score (CS). The decision maker’s attitude for GT and FLI were considered in CS linear weighting method in ranking the fiscal terms attractiveness. The results showed that Myanmar’s upstream petroleum fiscal regime has low attraction compared to its competing countries from the investor’s point of view, both in terms of the risk to the investor in the earlier part of the project and in terms of evaluation with or without the time value of money. Also, royalty and cost recovery were identified to have an impact on the attractiveness rank of petroleum fiscal regime in Myanmar. Therefore, Myanmar should consider improving its fiscal regimes that are not neutral—particularly, royalty, tax, profit split, and cost recovery—for a favorable investment climate.
1. Introduction
The petroleum industries in oil and gas producing nations play an important role in economic growth through revenue generation for the government (Odularu 2008). However, oil prices have been relatively low due to the increase in global petroleum supply which has outweighed demand (Sieminski 2014). The fall in oil prices may affect petroleum investors in the oil and gas sector due to the large amount of capital invested in exploration activities during the period of high oil prices (Evans-Pritchard 2015). The investors now tend to focus on the country’s fiscal regimes with regard to the valuation of oil and gas exploration and production (Nakhle 2015).
Petroleum fiscal regimes are set of laws, regulations, and agreements in a country which governs the benefits derived from petroleum exploration and production (Gudmestad et al. 2010). This links the host government as the political entity and the international oil company as the legal entity in the transaction. Also, the petroleum fiscal regime sets a standard for the production of oil and gas as well as the income allocation between these two entities (Bindemann 1999; Sunley et al. 2003; Løvås and Osmundsen 2009). The petroleum fiscal regime is important to the government because it ensures the appropriate management of the country’s natural resources (Natural Resource Governace Institute (NRGI) 2015). To the petroleum investors, petroleum fiscal regimes influence their investment decisions in any country of interest (Hvozdyk and Mercer-Blackman 2010).
Ensuring an effective and attractive petroleum fiscal regime is vital and challenging in some developing counties (Sunley et al. 2003; Cottarelli 2012). Myanmar is a resource rich developing country with an estimated proven natural gas and oil reserves of 10 trillion cubic feet and 50 million barrels respectively. Myanmar exports about 12.7 billion cubic meters (2014 estimates), making Myanmar the 17th largest natural gas exporting country in the world1. The petroleum sector is important for Myanmar’s economic growth as natural gas contributes about 25% of its foreign earnings. As a developing country, petroleum exploration in Myanmar is mainly carried out by overseas investors (Khine 2008; Asian Development Bank (ADB) 2014). Therefore, it is vital to ensure that the petroleum fiscal regime becomes attractive to petroleum investors through reforms that will lead to economic growth (McLaughlin 2012; Robinson 2012).
This study aims to analyze Myanmar’s upstream petroleum regimes, to ascertain whether its current regimes are attractive when compared to its competing countries, from the investor’s perspective. In conducting an in-depth analysis of the fiscal regimes, it is necessary to use comprehensive indicators to rank the attractiveness level of Myanmar, as different indicators are used by different investors depending on their experience, in deciding the overseas selection. The research also intends to consider the attitude of investors in real situation, especially those in Korean energy institutions. Moreover, there are potentially over 14 countries competing with Myanmar oil and gas exports. This research regarding the assessment of Myanmar upstream petroleum fiscal regimes is timely and of significance to both the Myanmar government and investors for a wide range of reasons.
Firstly, the Myanmar government needs to know the exact level of attractiveness of its oil and gas exploration and production investment climate, as the government takes measures and policy reform in various sectors for the time being. Secondly, the findings from this research can help international oil companies (IOC) in making overseas investment decisions, because the evaluation and comparison of petroleum fiscal terms have practical significance. Thirdly, this study can also contribute to basic insights into the Myanmar petroleum fiscal regimes package as it thoroughly analyses the whole fiscal package in the Myanmar petroleum industry. Fourthly, the major contribution of this research is to provide policy recommendations for a more favorable investment climate in the Myanmar petroleum Exploration & Production (E&P) industry. Finally, research focusing on the combination of decision maker’s attitudes and quantitative analysis regarding petroleum fiscal regimes are scarce. Therefore, this study intends to fill in the gap in the literature.
The rest of this study is arranged as follows. Section 2 presents the theoretical framework based on concept of economic rent. Section 3 the literature survey followed by the quantitative analysis for the analysis of upstream petroleum fiscal regimes in Section 4. The results are presented in Section 5, while Section 6 summarizes the study with some major findings and policy recommendations.
2. Theoretical Framework: Concept of Economic Rent
Economic rent is defined as “the true value of natural resource which is the difference between the revenues generated from resource extraction and the costs of extraction” (Dickson 1999; Nakhle 2007). Most IOCs use cash flow models which are based on the concept of economic rent to evaluate petroleum resource projects. This is due to the model’s simplicity as its equations can project cash flow for the whole project’s lifespan and reveal the profitability of the project. Moreover, it is also defined as “the surplus return above the value of the capital, labor and other factors of production employed to exploit the resource. It is the surplus revenue of the resource after accounting for the costs of capital and labor inputs” (Banfi et al. 2005).
Significant economic rent can be generated from the exploitation and utilization of exhaustible natural resources, especially oil and gas resources which are exhaustible resources as well as a strategic commodity with no perfect substitute. This implies that the extraction of oil and gas can earn huge economic rent. Rowland and Hann (1987) asserted that “the economic worth of a license to produce oil from a tract may be measured by the present value of the flow of the future revenues from that tract’s production less the present value of associated future costs, where the costs include monetary items such as equipment as well as non-monetary items such as exposure to risks. The difference between these two amounts, is the economic rent of that tract. It implies that the licensee enjoys more profits than those who induce the production of petroleum (pure profits)”. Similarly, Raja (1999) argued that “taxes should be aimed at taxing positive net present value because the method discounts all future cash flows and incorporates all the relevant rewards to factors of production”.
It can be argued that a positive net present value could be considered as economic rent representing the surplus over and above that which is necessary to induce investment. Therefore, in practical terms, it can be suggested that taxes should be aimed at taxing positive present values. When entering a project, IOC can calculate a return. Economic rent may thus be a bonus, a financial return not required to motivate desired economic behavior. This study agrees with simple and practical concept of economic rent by applying it in the discounted cash flow model used for the analysis to measure the attractiveness level of petroleum fiscal regimes. The major concepts of economic rent are shown in Table 1. The economic rent is used in this study due to its simplicity and practical representation of revenue allocation between the host government and the IOC. In addition, oil and gas resources can naturally maximize the economic rent of a country through petroleum fiscal regimes.
3. Literature Survey
3.1. Upstream Petroleum Fiscal Regimes
The upstream petroleum fiscal regimes in oil and gas E&P industry are royalties, various kinds of tax including profit-based tax and non-profit-based tax, bonus payments, cost recovery limits, profit split, host government participation, domestic market obligations, investment credit, etc. (Johnston 1994). However, different countries have different petroleum fiscal systems which typically include royalty and tax systems. Petroleum fiscal regimes of international contracts adjust the profit of the IOC and the host government. This determines the income allocation of all parties, which contract fiscal terms with a distinctive petroleum feature and the core of the contract (Cameron 2006; Cottarelli 2012).
Petroleum fiscal regimes depend on resource facts the IOC has to consider if they would like to enter a country. Its attractiveness has a major impact on the feasibility of the project and the project of the IOC. Hence, they are significant when judging a country’s oil and gas resource investment climate. Moreover, evaluation and comparison of fiscal terms are crucial and will provide basis for the IOC’s overseas investment decision, and contribute to the most active implementation of upstream oil and gas E&P business (Boykett et al. 2012). Due to the importance of upstream fiscal terms in investment, there are several studies regarding the upstream fiscal regimes for oil-producing countries, in OECD countries (Zhao and Dahl 2014); Indonesia (Abidin 2015); Malaysia (Manaf et al. 2014); Pakistan and Thailand (Zahidi 2010); Nigeria, Ghana, and Cameroon (Ghebremusse 2015); and Australia (Hunter 2008). However, there has still been a scarcity of studies for some developing countries including Myanmar
3.2. Quantitative Method for Petroleum Fiscal Regimes Assessment
There are different types of petroleum co-operation in different regions, depending on national petroleum legislation, international relations and the stage of oil and gas development. However, the major difference is only resource ownership transfer (Johnston et al. 2008). From the petroleum fiscal point of view, there are four steps: firstly, investment for oil and gas production; secondly, allocation of royalties or similar expenses attributable to the host government; thirdly, cost recovery, tax deduction and other compensation for IOC; and finally, profit split (Mabadi 2008; Serova 2015).
In the previous studies of Mommer (2001), Baunsgaard (2001), and Mommer (2002), the upstream fiscal regimes are analyzed based on the concept of economic rent through tax instruments such as royalties, bonuses, fixed fees, etc. Baunsgaard (2001) ascertained the equivalent fiscal regimes in different fiscal designs. For instance, the cost recovery concept in PSC is similar to the royalty of concessionary, and profit split in PSC is also similar to the initial tax rate in concessionary. It supports the concept that “fiscal regimes differences between contract types can be ignored when evaluating the attractiveness of the fiscal terms” (Luo and Yan 2010). As the number of types of fiscal contract designs is more than the number of countries (Johnston 1994), such findings for equivalent regimes has the advantage for comparative analysis of different fiscal contract types in different countries. This study agrees with those findings since the concessionary system uses only royalty and tax while PSC fiscal design uses various fiscal components.
3.3. Host Government Take (GT)
Government take (GT) is one of the most important criteria in making comparative analysis among worldwide petroleum fiscal systems and calculated in various ways in the petroleum industry (Boodoo 2012). GT puts the impacts of several fiscal regimes such as bonus, royalties, profit split, and taxation of all levels, government equity participation and other factors into one indicator. In other words, GT is defined as the proportion of the host nation’s income from investment project to the total project revenue within the valid period of the contract (Luo and Yan 2010). GT measures how much the government takes through upstream petroleum fiscal terms as analyzed in previous studies by Kaiser and Pulsipher (2004), Iledare and Kaiser (2006), Adenikinju and Oderinde (2009), Hao and Kaiser (2010), Kemp and Stephen (2011, 2012), Manaf et al. (2014), and Sen (2014). In the aforementioned studies, GT is calculated through a cash flow model based on historical data or reasonable assumptions combined with the given parameters in the fiscal system.
3.4. Non-Discounted Cash Flow Method (NDCF) and Discounted Cash Flow Method (DCF)
Without taking time value of money into consideration, cash inflows and outflows of the contract period are simulated at a certain level of oil price and output. Consequently, the appropriate deductions and allocations of the contract are made in line with the fiscal terms of the contractual system, and the proportion of the host nation’s return to the total project revenue within the whole project period is the non-discounted GT (Johnston 1994). The formulae necessary for the computation of NDCF as well as DCF cash flows in the whole project life are based on the economic rent concept. The results of cash flow model can be used by an investor to assess the profitability of a project and establish how much GT for the host country.
According to Wenrui et al. (1999), the discounted cash flow (DCF) method for the consideration of time value of money is considered for the calculation of GT, as the project life cycle of the oil and gas E&P projects lasts generally more than 20 years. The best way to calculate GT requires detailed economic modelling using cash flow analysis (Johnston 2008).
The DCF method is calculated for the discounted host nation take based on a certain discounted rate. Cash inflow/outflow time of the host nation during the project life is simulated at a certain level of oil price and output. Moreover, the present value of the host nation’s income during the entire life of the oil and gas project is calculated as per a certain discount rate (Luo and Yan 2010). DCF can be used to show how the tax take is calculated (Nakhle 2004). Furthermore, DCF method has been mostly applied in previous studies and is currently used by IOCs (Emhjellen and Alaouze 2001). According to Siew (2001), it has been found that 99% of IOCs used this DCF technique. In addition, the most common technique widely used for project evaluation in energy industry has been the DCF for several decades (Laughton et al. 2000).
Wenrui et al. (1999) measured the profitability of upstream oil and gas projects by two systems measures: NPV2 and IRR3 through a cash flow model. However, building a cash flow model takes some time and needs several data inputs. Moreover, a constantly discounted factor in DCF can overestimate the project profitability. Kaiser and Pulsipher (2004) developed an analysis of upstream fiscal regime by the real options theory to overcome the weakness of DCF. However, since this research considers the combination effect with the opinions of decision makers for the evaluation method, it is necessary to use the most commonly applied method. Thus, about 99% of DCF is widely used by IOCs and was applied in this study.
3.5. Prompt and Intuitive Method
The prompt and intuitive method is the easiest and fastest way for an investor to make a decision as soon as they know some fiscal regimes of the specific country (Luo and Yan 2010). As a matter of fact, forecasting the cash flow requires large amount of data, complex calculations, and multidisciplinary collaborations. In addition, cash flow calculation is difficult to complete in a short time. Therefore, a fast estimation method or the fast and intuitive method is recommended.
In the fast estimation method, the total income of the project is assumed as 100%, and the calculation is made in accordance with the order and proportion of the contractual system. Its strength is that the IOCs can evaluate the attractiveness of the fiscal terms of the resource country in a simple way. If IOCs are not aware of the detailed fiscal regimes of a specific country, it can also be used. However, the assumption of 100% total income for the entire project life cannot provide further insights.
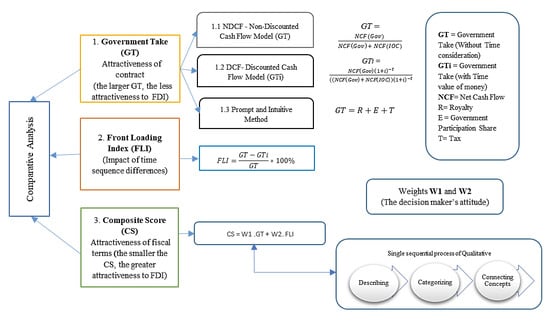
According to Jiuliang and Fenglan (2001), there is no widely-accepted method for evaluating and comparing different types of petroleum fiscal regimes used in the upstream oil and gas contracts worldwide. Therefore, it is difficult to choose the indicators that can reflect the combined effects of different fiscal systems. This research develops the evaluation method applied by Luo and Yan (2010). Different indicators—namely, government take (GT), front loading index (FLI), and composite score (CS)—are included in this evaluation method. Luo and Yan (2010) ascertained that these indicators are selected based on qualifications such as comprehensiveness, reflection of income allocation ratio between the IOC and resource-based country under the combined effects of fiscal regimes, considering the impact of the allocation order due to time value of money and time sequence of allocation obtained by different parties. Hence, the method using these indicators can affect the final benefit of the IOC.
3.6. Front Loading Index (FLI)
The FLI of IOCs are applied in this study to reflect the impact of time sequence differences of the host nation on the project and IOC’s profit, with the intention of making up the weakness of the gap between GT and GTi indicators. FLI can reflect the combination level of a contract’s fiscal term. In the international oil and gas E&P industry, the time sequence of incomes gained by the host country is a crucial issue that an IOC should consider. This is because the IOC can recover costs as soon as possible for a higher return for an E&P project by delaying payment to the host country. Consider a case where the host resource country maximizes its government take (GT) based on the profit gained by the IOC. There would be no front-loading for the IOC and discounted GTi, while non-discounted GT would be the same.
However, most of the host nations do not receive income, depending on profit from the project. There are some factors contributing to the difference of host nation’s proportion with discounted GTi and non-discounted GT. The fiscal regimes in the early project life are signature bonus and production bonus. In addition to these early fiscal terms, other fiscal regimes4 in the construction period and regimes in the production phase5 may cause revenue of the host government to grow faster than the projected profit. This can cause front-loading to the IOC. The definition of FLI of an IOC is the ratio of the difference between non-discounted GT and the discounted GTi to GT. The interpretation by Luo and Yan (2010) for the FLI relating to attractiveness is that the smaller the FLI is, the less risk the IOC will face in the earlier stage of the project life. Also, the less risk in the earlier phase of the project, the more attractive the petroleum fiscal regimes used in the E&P project.
3.7. Composite Score (CS)
Composite score (CS) is selected because it is a comprehensive evaluation indicator to evaluate the fiscal regimes of oil and gas projects. The linear weighting method is used to evaluate the indicators of GT and FLI. Thus, the linear weighting function of the composite score is built as CS = W1 × GT + W2 × FLI, where W1 and W2 reflect the attitude of the investor relating to the contribution of GT and FLI to the attractiveness of the fiscal regimes. This is determined by the decision-maker in accordance with their own experience. As the composite score is a comprehensive indicator that reflects the attractiveness of fiscal regimes, the interpretation for the CS is that the smaller the CS, the greater the attractiveness of the fiscal terms in the petroleum contract. The DCF and ROT could show the impact of fiscal terms and identify fiscal regimes of oil production countries.
Moreover, it is the most common method used by the IOC (Siew 2001). However, it does not consider the impact of different time sequences on the attractiveness of the fiscal terms. The model which combines DCF, NDCF, FLI, and CS by Luo and Yan (2010) overcame this weakness and reflected the combination level of the contract’s fiscal terms more comprehensively. This is due to the consideration of time different impact. However, the attitudes of the decision-maker were assumed for the linear weighting method in the Luo and Yan (2010) study. Hence, it can limit the insight into the attractiveness level of fiscal terms. With the intention of filling the gap in the literature, this study develops a comprehensive model of DCF, NDCF, FLI, and CS. The model considers the attitudes of decision-makers in the Korean energy industry for the combined effects of fiscal terms to impact more realistically.
4. Quantitative Analysis for the Assessment of Upstream Petroleum Fiscal Regimes
4.1. Method
In the oil and gas E&P industry, international investors use a wide range of methods and evaluation techniques. Various methods have different results and limitations. Currently, there is no widely accepted method to evaluate and compare different types of petroleum fiscal regimes used in the upstream oil and gas contracts worldwide. Therefore, it is difficult to choose the indicators that can reflect the combined effects of different fiscal systems. This research develops the evaluation method by Luo and Yan (2010). Different indicators—namely, government take (GT), front loading index (FLI), and composite score (CS)—are included in this evaluation method. These indicators have been selected due to its comprehensiveness, reflection of the income allocation ratio between IOCs and resource-based country under the combined effects of the fiscal regimes. It takes into account the impact of allocation order due to the time value of money and the time sequence of allocation obtained by different parties. The indicators used in this method can affect the final benefit of the IOCs.
4.1.1. Modelling Framework
4.1.2. Host Government Take (GT)
Government take (GT) is the fundamental indicator of this study because other indicators are calculated based on the results of GT. Hence, GT is calculated in various ways used in the petroleum industry. As discussed in the literature review, GT puts the impacts of several fiscal regimes into one indicator. GT is defined as the proportion of the host nation’s income to the total project revenue within the valid period of the contract. According to Bindemann (1999), the equation of GT is
where, NCF (Gov) is the net cash flow of the host government and NCF (IOC) is that of the international oil company.
GT = (NCF(Gov))/(NCF(Gov) + NCF(IOC)) × 100%
The interpretation of GT indicator relating to the attractiveness of fiscal regime is that “the larger GT is, the less attractive the fiscal regimes of the contract is to the IOC”. In this research, GT is calculated in two ways; the first way is the fast and intuitive method and the second is the non-discounted cash flow model (NDCF).
Prompt and Intuitive Method
In the fast estimation method, the total income (I) is assumed as 100%, and calculation is made in accord with the order and the proportion of the contractual system. The calculation is conducted as follows: first, the host nation receives royalties (R), with a proportion of the royalties (Rt). Second, IOC recovers costs, with cost recovery limit (Rr). Third, after the deduction of the first and second steps, the remainder is the portion of the profit split of oil/gas (profit-sharing oil), from which the host nation take (Er) %, while IOCs gets the remaining percentage. Fourth, IOC has to pay income tax (T) to the host nation at tax rate (Tr). Taxable income is the income IOC get from oil/split profit. The host nation’s income mainly includes three parts: R, E and T. Therefore, GT is calculated as
where, R = I × Rt, I = 100%, E = (I − R) (I − Rr) Er and T = (I − R) (I − Rr) (I − Er) Tr.
GT = R + E + T
Non-Discounted Cash Flow Method (NDCF)
Without taking into consideration the time value of money, cash inflows/outflows of the contract period are simulated at a certain level of oil price and output. Then, the appropriate deductions and allocations of the contract are made in line with the fiscal terms of the contractual system. Also, the proportion of the host nation’s income to total project revenue in the whole project period is the non-discounted GT.
In the cash flow simulation, the equations will be varied in terms of the contractual policy used in different countries. In this research, Myanmar, Cambodia, Indonesia, and Vietnam adopt a production sharing contract (PSC) policy, while the U.S., Canada, Australia, and Mozambique practice the concessionary system. The differences between these two systems are discussed in Chapter 3. The calculations in detail are mainly based on the sample production sharing contract cash flow projection and sample concessionary system cash flow projection (Johnston 1994). The equations used in the PSC cash flow are
Gross revenue = Oil/Gas production × Revenue
Royalty = Gross revenue × Rate of royalty
Cost recovery or cost of oil/gas = intangible capital expenditure + operating expense + DD&A if gross revenue is greater than zero: up to a maximum rate (cost recovery limit) of gross revenue
Total profit oil/gas = gross revenue − Cost recovery
Contractor (IOC) profit oil = total profit oil × profit split
Income Tax = Contractor (IOC) profit oil × Tax rate
Contractor (IOC) After Net Cash Flow = Gross Revenue − Intangible cost − Tangible Capital Costs − Operating Expenses − Total profit oil + Contractor Profit Oil − Income Tax
Consequently, the government take (GT) is calculated according to Equation (1) as mentioned in Section 4.1.2. The cash flow simulations of Myanmar, Cambodia, Indonesia, and Vietnam obtained by using these equations are attached in from Tables S1–S8 in Supplementary Material. In regards to the equations for cash flow simulation for U.S., Canada, Australia, and Mozambique adopting the concessionary system, the gross revenue and royalty are calculated through Equations (3) and (4) respectively. The remaining equations necessary for the concessionary system are
Net revenue = Gross Revenue − Royalty
Total Applied Deductions = If Intangible capital expenditure + Operating expense + DD&A is greater than or equal to Net revenue, then Net revenue, Otherwise Intangible Capital expenditure + Operating expense + DD&A
Taxable income = Net revenue − Intangible capital expenditure − Operating expense − DD&A
Income tax = If Taxable income is positive, Tax rate × Taxable income, otherwise (0)
After Net Cash Flow = Gross Revenue − Royalty − Intangible capital expenditure − Tangible Capital expenditure − Operating expense − Income Tax
NCF (Gov) = Royalty + Income Tax + Resource Rent Tax
NCF (IOC) = After Net Cash Flow − Royalty − Income Tax − Resource Rent Tax
Finally, GT is calculated in accordance with Equation (1) for the PSC cash flow. Likewise, the cash flow simulations of the U.S., Canada, Australia, and Mozambique obtained by using these equations are attached. Since the concepts of GT by the fast and intuitive method and those of GT by NDCF are similar due to lack of consideration of the time value of money, the average assumption of these two results are represented as GT.
4.1.3. Government Take (GTi) through Discounted Cash Flow Method (DCF)
In addition to the two methods for GT mentioned above, this study also takes into account, the DCF for the consideration of time value of money due to long project life. The DCF method, which calculates the discounted host national take, is based on a certain discounted rate. The cash inflow/outflow of the host nation during the project life is simulated at a certain level of oil price and output. Moreover, the present value of the host nation’s income during the entire life of the oil/gas project is calculated as per a certain discount rate. The formula is
where i refers to the discount rate, t means time and GTi is the host government take at i discount rate.
GTi = NCF(Gov) (1 + i)−t/((NCF(Gov) + NCF(IOC)) (1 + i)−t × 100%
The DCF cash flow spreadsheets of each country’s GTi are attached from Tables S1–S17 in Supplementary Material. GT is calculated by the fast-intuitive method and NDCF. The GTi which is calculated by the DCF can reflect the attractiveness of upstream oil and gas fiscal regimes in different contracts to some extent. However, these methods have a significant flaw in the comparison by different fiscal terms combinations. The method can only reflect the total amount of the host nation’s income without considering the influence of different time sequences of income acquisition by the host nation on the benefit of IOC and the attractiveness of the contact. Therefore, it can be established that there is a huge gap result between the GT and the GTi. This gap shows that the time sequence differences of income acquisition by host nations will affect the benefit of the host nation and IOCs, as well as impact on the attractiveness sequences of the oil and gas fiscal terms.
4.1.4. Front Loading Index (FLI)
The definition of FLI by Luo and Yan (2010) is the ratio of the difference between non-discounted GT and the discounted GTi to GT. FLI can be calculated as
FLI = (GT − GTi)/(GT) × 100%
Luo and Yan’s interpretation of the FLI relating to attractiveness is that the smaller the FLI, the less risk the IOC will face in the earlier stage of the project life. Consequently, the lower the risk of the earlier phase, the more attractive the petroleum fiscal regimes used in the E&P project.
4.1.5. Composite Score (CS)
Composite score (CS) is selected because it comprehensively evaluates the fiscal regimes of oil and gas projects. The linear weighting method is used to consider the indicators of GT and FLI. Thus, the linear weighting function of the composite score is built as
where W1 and W2 reflect the attitude of the investor relating to the contribution of GT and FLI to the attractiveness of the fiscal regimes. This is determined by the decision-makers in accordance with their own experience. The CS is a comprehensive indicator that reflects the attractiveness of fiscal regimes. The interpretation for the CS is that the smaller the CS, the greater the attractiveness of the fiscal terms in the petroleum contract.
CS = W1 × GT + W2 × FLI,
4.2. Data
If the fiscal regimes such as royalties, profit split, and cost recovery are in a sliding scale system, the average values of parameters in the whole project life are considered in the calculation6. The data for fiscal regimes of Myanmar, Cambodia, Indonesia, and Vietnam are collected from the paper presented by the international consultant at a research and training meeting at the Ministry of Energy, Myanmar. The main fiscal parameters for the remaining countries: the U.S., Canada, Australia, and Mozambique are from the Global Oil and Tax Guide (Ernst & Young 2015). The data for each indicator used in the evaluation techniques are collected from primary sources (survey questionnaire), secondary sources (government documents) and assumptions from previous studies.
Table 2 presents the sources of data and the assumptions based on previous studies. All the upstream petroleum fiscal regime packages for the four countries which applies the PSC system are presented in Table 3. The main fiscal parameters—royalty, tax, profit split, cost recovery limits, host government participations—of Myanmar, Cambodia, Indonesia, and Cambodia for the calculation of PSC system are shown in Table 4. Moreover, the main fiscal parameters for the U.S., Canada, Australia, and Mozambique for the calculation of the concessionary system are presented in Supplementary Material 9. A summary of the main fiscal parameters for all countries is depicted in Table 5, while a summary of concessionary and PSC are presented in Table 6.
Oil production data for the cash flow model are retrieved from Kaiser (2007), since the study deals with the effects of fiscal parameters for a favorable investment climate regardless of the project scale7. Similarly, since it is difficult to retrieve capital cost, operating cost, tangible cost, an intangible cost for every project in eight different countries, costs are also assumed in the same source as for other studies. Current Brent oil price ($/bbl) was retrieved from the U.S. Energy Information Administration (United States Energy Information Administration (EIA) 2014) as most of the countries in the comparative analysis in this study use the Brent crude oil price. Depletion, depreciation, and amortization (DD & A) and tax losses are taken from the Global Oil and Gas Tax Guide (Ernst & Young 2015). Nakhle (2004) also asserted that an assumption of oil price and relevant taxes is sufficient to calculate expected cash flows to determine the investor’s return and government take (GT).
The discount rate for the discounted cash model is assumed as 10% in real terms, as it was applied in most published studies to mirror the industry’s discount rate. The weights for the CS linear weighting method are collected from experts of Korean energy companies through survey technique8. Scores and Weightings are determined using techniques such as Delphin or peer review or a questionnaire (Henriksen and Traynor 1999). Moreover, the countries that should be compared with Myanmar for their petroleum fiscal regimes are also based on the respondents’ choice through a survey questionnaire9.
5. Results
The results of the indicators GT, GTi, and FLI are presented in Table 7. The table shows that different indicators have different results for ranking the attractiveness of the fiscal terms. According to the GT, without considering the time value of money, the attractiveness of the eight countries’ fiscal terms is ranked in descending order as Cambodia, Australia, Indonesia, Mozambique, Vietnam, Canada, Myanmar, and U.S. However, in terms of GTi, which is calculated with consideration of the time value of money, the attractiveness of the fiscal regimes of eight countries is ranked in descending order as Australia, Mozambique, Cambodia, Canada, Myanmar, Indonesia, Vietnam, and U.S. If sorted by FLI, the attractiveness of eight countries’ fiscal terms is ranked in descending order as Indonesia, Cambodia, Vietnam, U.S., Myanmar, Mozambique, Australia, and Canada.
In accordance with the results in Table 7, it can be found that calculating with different indicators makes the ranks different. Hence, the comprehensive indicator (composite score—CS) is used to fully reflect the level of attractiveness. In order to compare the attractiveness rank of the eight countries, GT and FLI are considered comprehensively in the calculation of CS10. According to the data collected through survey technique in a previous study (Swe and Emodi forthcoming), the decision makers determine weights of GT and FLI as 42% and 58%, respectively. Based on the weights of decisions makers, CS is calculated by the Equation (19)11. The result of CS value is provided in Table 8. The attractiveness rank of eight countries’ fiscal regimes in descending order is Cambodia, Indonesia, Australia, Vietnam, Mozambique, Myanmar, Canada, and U.S.
5.1. Analysis of Results in GT and GTi
In terms of the definition of GT and GTi, the attractiveness ranks of eight countries are depicted in Figure 2 and Figure 3, respectively. According to the attractiveness rank of GT without time consideration (Figure 2) and GTi considering (Figure 3) the time value of money, almost all countries have different ranks except the U.S. which has an obvious disadvantage in terms of fiscal regime. Concerning four countries’ (Australia, Canada, Mozambique, U.S.) concessionary fiscal regimes12, the combination of royalty 20% and tax 35% of U.S., 55%, is the highest rate. Thus, the highest rate (55%) of royalty and tax makes the attractiveness rank of the U.S. low both in GT and GTi.
Unsurprisingly, tax and royalty affect the attractiveness level of the fiscal regimes. The host government attempts to capture as much rent as possible through taxes and royalties according to the nature of economic rent (Johnston 1994). Likewise, in GTi, since the combination of royalty 6% and tax 55% of Vietnam, 61%, is the highest rate in PSC countries, Vietnam holds the second lowest attractiveness rank after the U.S. and conversely, the lowest combination rate 36.25% of Australia gets the highest attractiveness rank. Hence, the high royalty can make the attractiveness rank low in GTi.
In GT, the pattern of the ranks of countries in the concessionary system is the same as in GTi, in line with royalty and tax regimes (Figure 2). As with GTi, the higher the royalty/tax, the lower the attractiveness rank in GT. Royalty and tax affect the fiscal regime attractiveness rank both in GT and GTi for the concessionary system. However, regarding the countries adopting the PSC system, the pattern of the attractiveness ranks of countries in the PSC system (Cambodia, Indonesia, Myanmar, and Vietnam) in GT is not the same as in GTi13. In particular, the third lowest rank of Indonesia in GTi jumps to the third highest rank in GT due to its 100% cost recovery incentive and conversely, the attractiveness rank of Myanmar decreases from the fifth rank in GTi to the seventh attractiveness rank in GT (Figure 2 and Figure 3) due to its low-cost recovery limit of 60%. Similarly, since the cost recovery of Vietnam (70%) is higher than cost recovery of Myanmar (50%), the ranking of Vietnam is higher than that of Myanmar in GT, opposing to the rank in GTi. Therefore, in GT, cost recovery also affects the attractiveness level of the fiscal terms for the countries practicing the PSC system.
Normally, the PSC system and the Concessionary system can be distinguished by cost recovery, and its range is typically 30% to 60%. Moreover, Johnston (2008) pointed out that cost recovery can make a difference in cash flow calculations. As such, the finding in this study shows that the highest cost recovery (100%) in Indonesia makes an obvious difference between cash flows by DCF and NDCF so that the attractiveness levels of Indonesia in DCF and NDCF vary dramatically. Moreover, Cambodia’s attractiveness rank increases from the third rank in the calculation of DCF14 to the first attractiveness rank in the calculation of NDCF15 due to its high incentive cost recovery (90%).
5.2. Analysis of Results in FLI
Luo and Yan (2010) applied FLI for a more realistic combination of fiscal regimes from the investor’s point of view. Moreover, the impact of time sequence differences of the host country on the project, and profit of the investor are also reflected by FLI. According to Figure 4, Indonesia, Cambodia, and Vietnam, which adopt the PSC system, have the most attractive ranking of fiscal terms. Whereas Canada, Australia, and Mozambique, practicing the concessionary system, have the least attractive rankings in terms of the IOC’s risk in the earlier stage. The combination level of fiscal components in the PSC system are more attractive than those of the concessionary system.
Although the U.S. possesses the lowest rank in GT and GTi (Figure 2 and Figure 3), it is in the middle rank (fourth) in FLI (Figure 4), because16 the ratio of the difference between GT and GTi to GT is neither small nor large compared to other countries. Thus, the risk the IOC will face in the earlier stage of the project in the U.S. is neither high nor low, although the U.S. is the least attractive one in terms of GT and GTi17. Myanmar is in the fifth rank of attractiveness in FLI after the U.S. (Figure 4) and the attractiveness rank is low from the investor point of view. The risk which the IOC will face in the earlier stage of the project in Myanmar is higher than in the U.S., Vietnam, Cambodia, and Indonesia.
5.3. Analysis of Results in CS
In terms of CS, the rank of the fiscal term attractiveness is depicted in Table 8 and calculated based on the decision maker’s attitude to the contribution of the two indicators, GT and FLI18. According to the findings of the decision maker’s attitude through the survey questionnaire, the weight for FLI is greater than GT. From the investor’s point of view, Cambodia’s petroleum fiscal regime is the most attractive one in the PSC system, while Australia’s petroleum fiscal regime is the most attractive in the Concessionary system. Myanmar falls in the position of sixth rank out of eight competing countries.
6. Summary, Policy Recommendations, and Further Studies
6.1. Summary
Based on the assessment of upstream petroleum fiscal regimes, the findings in CS will be useful to the IOCs when making decisions for overseas selection phase in fiscal terms. Cambodia, Indonesia, and Australia are the most attractive for international investors in terms of CS. The findings that Indonesia ranks below Cambodia conforms to the results of Putrohari et al. (2007) who stated that Indonesia PSC provides a better project value compared to other countries. This is because the Indonesian government strives to maximize wealth through its natural resources by revising the fiscal terms over time, though Indonesia had the toughest fiscal regimes in the past.
From the result for FLI, the highest ranks belong to the countries practicing the PSC system such as Indonesia, Cambodia, and Vietnam. The lowest ranks belong to the countries adopting a concessionary system such as Canada, Australia, and Mozambique. This implies that PSC fiscal policy is more attractive than the concessionary policy. This supports previous finding from Kyari (2013) and Iledare (2004) where the PSC system was more favorable than other systems. Due to differences between PSC and concessionary, it is better to separately analyze the effects of each fiscal regime in the PSC system and those in a concessionary system.
The main findings of GT and GTi suggests that there are three main issues in this study. Firstly, royalty and tax affect the attractiveness rank of fiscal regimes in the evaluation of petroleum resource development projects, with or without consideration of the time value of money, especially for countries which use a concessionary policy. Secondly, in the PSC system, royalty and tax also affect the attractiveness rank of a fiscal regime, but only in an evaluation that considers the time value of money. Thirdly, cost recovery19 affects the attractiveness of fiscal regimes in the evaluation of projects without consideration of the time value of money.
The findings about royalty and tax effect on upstream petroleum fiscal terms in this research are consistent with the previous results by Nakhle (2004) and Kyari (2013). Likewise, the findings about cost recovery effect on the fiscal regimes’ attractiveness rank, the cost recovery rate in Myanmar also supports the concept that the low-cost recovery limit has a big impact (Johnston 2008).
Myanmar ranks sixth out of eight competing countries. With this low rank, it is not so attractive for investors, especially in comparison with regional countries such as Indonesia, Cambodia, and Vietnam. Disregarding the U.S., Australia, Mozambique, and Canada, which adopt a concessionary system, Myanmar is the least attractive country among those countries which practice a PSC policy in terms of both FLI and CS. In summary, the Myanmar upstream petroleum fiscal regime has a low attraction compared to its competing countries from the investor’s point of view, both in terms of the risk to the investor in the earlier part of the project and in terms of evaluation with or without the time value of money.
6.2. Policy Recommendations
The main motivation for this study came from the necessity to assess the attractiveness rank of Myanmar upstream petroleum fiscal regimes in the E&P investment climate, since Myanmar needs to develop its oil and gas resources to fulfil increasing domestic demand without harming its existing natural gas exports20. As the Myanmar upstream oil and gas investment climate is not favorable, this study suggests some fiscal regime policy recommendations.
First, analysis of findings in GTi by DCF, considering the time value of money, suggests that, in order to encourage investors in the development of Myanmar’s oil and gas E&P industry, the lower the royalty and tax are dropped, the more attractive it will be for the investor. Similarly, the finding for the qualitative analysis of the effects of Myanmar fiscal regimes shows that the Myanmar royalty rate (12.5%), as a non-neutral regime, impacts on the investment decision. To reduce the distortions caused by the imposition of royalty, a sliding scale royalty may be applied. Such a royalty is based on charging different rates of tax, depending on the level of production or oil price. Therefore, the existing royalty regime of Myanmar should be a sliding scale depending on production level or oil price or water depth in offshore oil and gas blocks.
Second, the finding in the analysis of GT, without time consideration, by NDCF suggests that the higher cost recovery incentives are, the more favorable the investment climate. Currently, Myanmar’s cost recovery regime (50%) is the lowest among its competing countries. Although it is between the typical cost recovery range 30–60%, its attractiveness level is low compared to competing countries in this study. All competing countries’ cost recovery regimes are higher than Myanmar’s21. Such a low-cost recovery regime will hinder the attractiveness of its petroleum fiscal regimes. The FLI indicator shows that the countries with the highest attractiveness rank (Indonesia, Cambodia, and Vietnam) adopt the PSC fiscal contractual system. Hence, it suggests that the PSC contractual system, which is currently used in Myanmar, will provide a more favorable investment climate than another system.
Third, the design of an efficient fiscal system must consider the political and geological risks as well as the potential rewards. Even though some countries have the toughest petroleum fiscal regimes, they are still attractive to the investors due to high geological prosperity which significantly reduces exploration costs. Thus, it is recommended that 92% of such factors as geological condition, location, political stability, and investment opportunity should be taken into account before changing Myanmar’s existing petroleum fiscal regimes22. Moreover, Myanmar should consider improving its fiscal regimes that are not neutral—royalty, tax, profit split, and cost recovery—for a favorable investment climate from the Korean investors’ perspective. This is because the current Myanmar fiscal regimes package, composed of four non-neutral regimes, can create high uncertainty for investors.
Finally, the indicator CS for the decisions of investors shows that Myanmar is in the position of sixth attractiveness rank, while Cambodia, Indonesia, and Australia hold the first three ranks23. Hence, in terms of upstream petroleum fiscal regimes, this research suggests that Cambodia, Indonesia, and Australia will be the most attractive countries among eight competing nations where Korean investors want to invest in the oil and gas E&P industry. Selecting the most attractive countries for E&P investment will help them achieve greater operational efficiency, as well as securing and increasing the value of assets by adjusting their business strategy according to their own conditions.
6.3. Further Studies
Based on the discounted cash flow model, it would be interesting to extend the study to analyses other economic indicators—such as NPV, internal rate of return, etc.—with a view to assisting the project selection phase for the investor. Furthermore, this research shows that the PSC system is more attractive than the concessionary system solely in terms of fiscal regimes. However, according to previous studies, there are lots of advantages in the concessionary system such as simplicity and no government intervention, which are beyond the scope of this study. Therefore, it would be interesting to make a comparative analysis of contract systems in the oil and gas E&P industry. This study shows that there are several factors in addition to fiscal regimes which affect the investment decision. Hence, future study can explore the attractiveness rank of petroleum investment, considering the effects of all competing factors on the IOC’s investment decision such as political stability, resource potential, location, project scale, and impact of oil price.
Supplementary Materials
The following are available online at https://0-www-mdpi-com.brum.beds.ac.uk/1911-8074/11/4/85/s1, Table S1: PSC Myanmar Cash Flow Projection of Petroleum Exploration & Production, Table S2: PSC Myanmar Cash Flow Projection of Petroleum Exploration & Production (Cont.), Table S3: PSC Cambodia Cash Flow Projection of Petroleum Exploration & Production, Table S4: PSC Cambodia Cash Flow Projection of Petroleum Exploration & Production (Cont.), Table S5: PSC Indonesia Cash Flow Projection of Petroleum Exploration & Production, Table S6: PSC Indonesia Cash Flow Projection of Petroleum Exploration & Production (Cont.), Table S7: PSC Vietnam Cash Flow Projection of Petroleum Exploration & Production, Table S8: PSC Vietnam Cash Flow Projection of Petroleum Exploration & Production (Cont.), Table S9: Concessionary U.S Cash Flow Projection of Petroleum Exploration & Production, Table S10: Concessionary U.S Cash Flow Projection of Petroleum Exploration & Production (Cont.), Table S11: Concessionary Mozambique Cash Flow Projection of Petroleum Exploration & Production, Table S12: Concessionary Mozambique Cash Flow Projection of Petroleum Exploration & Production (Cont.), Table S13: Concessionary Australia Cash Flow Projection of Petroleum Exploration & Production, Table S14: Concessionary Australia Cash Flow Projection of Petroleum Exploration & Production (Cont.), Table S15: Concessionary Canada Cash Flow Projection of Petroleum Exploration & Production, Table S16: Concessionary Canada Cash Flow Projection of Petroleum Exploration & Production (Cont.), Table S17: Petroleum Fiscal Regimes of Concessionary System.
Author Contributions
Conceptualization, methodology, formal analysis, writing—original draft preparation, W.T.S.; Writing—review and editing, N.V.E.
Funding
This research received no external funding.
Acknowledgments
The authors would like to acknowledge the support and supervision of Eunnyeong Heo and Kyungjin Boo of the Department of Technology Management Economics and Policy Program, College of Engineering, Seoul National University, Seoul, Republic of Korea, as well as U Win Maw and U Tin Zaw Myint of the Department of Oil and Gas Planning Department, Ministry of Electricity and Energy, Myanmar.
Conflicts of Interest
The authors declare no conflict of interest.
References
- Abidin, Faris Anwar Zainal. 2015. At an Investment Crossroads: Malaysia versus Indonesia. Paper presented at SPE/IATMI Asia Pacific Oil & Gas Conference and Exhibition, Society of Petroleum Engineers, Nusa Dua, Indonesia, October 20–22. [Google Scholar]
- Adenikinju, Adeola, and Oladele Oderinde. 2009. Economics of Offshore Oil Investment Projects and Production Sharing Contracts: A Meta Modeling Analysis. Paper presented at the 14th Annual Conference of African Econometric Society, Abuja, Nigeria, July 8–10. [Google Scholar]
- Asian Development Bank (ADB). 2014. Myanmar Unlocking the Potential: Country Diagnostic Study. Available online: http://adb.org/sites/default/files/pub/2014/myanmar-unlocking-potential.pdf (accessed on 22 June 2016).
- Banfi, Silvia, Massimo Filippini, and Cornelia Luchsinger. 2004. Resource Rent Taxation—A New Perspective for the (Swiss) Hydropower Sector. Politiche Pubbliche, Sviluppo E Crescita, side pubblica, Editor. p. 21. Available online: https://www.ethz.ch/content/dam/ethz/special-interest/mtec/cepe/cepe-dam/documents/research/cepe-wp/CEPE_WP34.pdf (accessed on 20 July 2016).
- Banfi, Silvia, Massimo Filippini, and Adrian Mueller. 2005. An estimation of the Swiss hydropower rent. Energy Policy 33: 927–37. [Google Scholar] [CrossRef]
- Baunsgaard, Thomas. 2001. A Primer on Mineral Taxation. No. 1–139. Washington, DC: International Monetary Fund. [Google Scholar]
- Bindemann, Kirsten. 1999. Production-Sharing Agreements: An Economic Analysis. Oxford: Oxford Institute for Energy Studies. [Google Scholar]
- Boodoo, Craig. 2012. Trinidad and Tobago’s Measures to Enhance Its Competitiveness in the Upstream Deep-Water Petroleum Industry Post 2006: Have They Been Successful? Available online: www.dundee.ac.uk/cepmlp/gateway/files.php?file=cepmlp_car16 (accessed on 13 June 2016).
- Boykett, Tim, Marta Peirano, Simone Boria, Heather Kelley, Elisabeth Schimana, Andreas Dekrout, and Rachel OReily. 2012. Oil Contracts: How to Read and Understand a Petroleum Contract. Version 1.1. Available online: http://www.eisourcebook.org/cms/January%202016/Oil%20Contratcs,%20How%20to%20Read%20and%20Understand%20them%202011.pdf (accessed on 15 June 2016).
- Cameron, Peter. 2006. Stabilisation in Investment Contracts and Changes of Rules in Host Countries: Tools for Oil & Gas Investors. Houston: Association of International Petroleum Negotiators. [Google Scholar]
- Cottarelli, Carlo. 2012. Fiscal Regimes for Extractive Industries: Design and Implementation. Washington, DC: International Monetary Fund, p. 67. [Google Scholar]
- Dickson, Timothy. 1999. Taxing Our Resources for the Future. Paper Posted at Economic Research and Analysis (ERA). Available online: http://www. eraweb.net (accessed on 13 March 2016).
- Emhjellen, Magne, and Chris Alaouze. 2001. Discounted Net Cashflow and Modern Asset Pricing Method: Project Selection and Policy Implications. Working Paper No. 35/02. Available online: https://brage.bibsys.no/xmlui/bitstream/handle/11250/165814/A35_02.pdf?sequence=1 (accessed on 24 June 2016).
- Ernst & Young. 2015. Global Oil and Gas Tax Guide. Available online: http://www.ey.com/Publication/vwLUAssets/EY-2015-Global-oil-and-gas-tax-guide/$FILE/EY-2015-Global-oil-and-gas-tax-guide.pdf (accessed on 25 June 2016).
- Evans-Pritchard, Ambrose. 2015. Saudi Arabia May Go Broke before the US Oil Industry Buckles. The Telegraph. Available online: http://www.telegraph.co.uk/finance/oilprices/11768136/Saudi-Arabia-may-go-broke-before-the-US-oil-industry-buckles.html (accessed on 1 July 2016).
- Ghebremusse, Sara. 2015. Conceptualizing the Developmental State in Resource-Rich Sub-Saharan Africa. Law and Development Review 8: 467–502. [Google Scholar] [CrossRef]
- Gudmestad, Ove. T., Anatoly. B. Zolotukhin, and Erik. T. Jarlsby. 2010. Petroleum Resources with Emphasis on Offshore Fields. Southampton: WIT Press. [Google Scholar]
- Hao, Hong, and Mark J. Kaiser. 2010. Modeling China’s offshore production sharing contracts using meta-analysis. Petroleum Science 7: 283–88. [Google Scholar] [CrossRef]
- Henriksen, Anne De Piante, and Ann Jensen Traynor. 1999. A practical R&D project-selection scoring tool. IEEE Transactions on Engineering Management 46: 158–70. [Google Scholar]
- Hunter, Tina. 2008. Review of the Australian Upstream Petroleum Sector: Submission to the Australian Productivity Commission. Research Report. Available online: https://www.pc.gov.au/inquiries/completed/upstream-petroleum/submissions/sub009.pdf (accessed on 11 June 2016).
- Hvozdyk, Lyudmyla, and Valerie Mercer-Blackman. 2010. What Determines Investment in the Oil Sector?: A New Era for National and International Oil Companies. Washington, DC: Inter-American Development Bank. [Google Scholar]
- Iledare, Omowumi O. 2004. Analyzing the Impact of Petroleum Fiscal Arrangements and Contract Terms on Petroleum E&P Economics and the Host Government Take. Paper presented at the Nigeria Annual International Conference and Exhibition, Abuja, Nigeria, August 2–4. [Google Scholar]
- Iledare, Omowumi, and Mark Kaiser. 2006. Physical and Economic Performance Measures in Petroleum Lease Sales & Development: A Case Study of the US Gulf of Mexico Region, 1983–1999. Paper presented at the Nigeria Annual International Conference and Exhibition, Abuja, Nigeria, July 31–August 2; January. [Google Scholar]
- Jiuliang, Xue, and Jin Fenglan. 2001. An Economic Evaluation Study of Sharing Mode in International Petroleum Cooperation. Techno-Economics in Petrochemicals 17: 20–27. [Google Scholar]
- Johnston, Daniel. 1994. International Petroleum Fiscal Systems and Production Sharing Contracts. Houston: PennWell Books. [Google Scholar]
- Johnston, Daniel. 2008. Changing fiscal landscape. The Journal of World Energy Law & Business 1: 31–54. [Google Scholar] [Green Version]
- Johnston, David, Daniel Johnston, and Tony Rogers. 2008. International Petroleum Taxation for the Independent Petroleum Association of America. Washington, DC: IPAA. [Google Scholar]
- Kaiser, Mark J. 2007. Fiscal system analysis—Concessionary systems. Energy 32: 2135–47. [Google Scholar] [CrossRef]
- Kaiser, Mark J., and Allan G. Pulsipher. 2004. Fiscal System Analysis: Concessionary and Contractual Systems Used in Offshore Petroleum Arrangements; New Orleans: US Department of the Interior, Minerals Management Service, Gulf of Mexico OCS Region, OCS Study MMS. Available online: https://www.boem.gov/ESPIS/2/2977.pdf (accessed on 15 July 2016).
- Kemp, Alexander George, and Linda Stephen. 2011. The Short and Long Term Prospects for Activity in the UK Continental Shelf: The 2011 Perspective. North Sea Study Occasional Paper No. 122. Aberdeen: Aberdeen Centre for Research in Energy Economics and Finance. [Google Scholar]
- Kemp, Alexander George, and Linda Stephen. 2012. A Comparative Study of Tax Reliefs for New Developments in the UK Continental Shelf after Budget 2012. North Sea Study Occasional Paper No. 124. Aberdeen: Aberdeen Centre for Research in Energy Economics and Finance. [Google Scholar]
- Khine, Thandar. 2008. Foreign Direct Investment Relations between Myanmar and ASEAN. IDE Discussion Paper 149. Mihama-ku: Institute of Developing Economies. [Google Scholar]
- Kyari, Adam Konto. 2013. A Theoretical and Empirical Investigation into the Design and Implementation of an Appropriate Tax Regime: An Evaluation of Nigeria’s Petroleum Taxation Arrangements. Ph.D. thesis, Robert Gordon University, Aberdeen, UK. [Google Scholar]
- Laughton, David Graham, Jacob. Shimon Sagi, and Michael Robert Samis. 2000. Modern asset pricing and project evaluation in the energy industry. Journal of Energy Literature 6: 3–46. [Google Scholar]
- Løvås, Kjell, and Petter Osmundsen. 2009. Petroleum taxation: Experience and issues. UiS Working Paper in Economics and Finance 2009/8. Available online: http://www1.uis.no/ansatt/odegaard/uis_wps_econ_fin/uis_wps_2009_8_lovas_osmundsen.pdf (accessed on 15 July 2016).
- Lubiantara, Benny. 2007. The Analysis of the Marginal Field Incentive—Indonesian Case. Oil, Gas & Energy Law Journal (OGEL). 5, no. 2. Available online: https://0-www-ogel-org.brum.beds.ac.uk/article.asp?key=2432 (accessed on 18 July 2016).
- Luo, Dongkun, and Na Yan. 2010. Assessment of fiscal terms of international petroleum contracts. Petroleum Exploration and Development 37: 756–62. [Google Scholar] [CrossRef]
- Mabadi, Amir. Hossein. 2008. Legal Strategies in Upstream Oil and Gas Contracts to Attract Foreign Investment: Iran’s Case. Available online: https://papers.ssrn.com/sol3/papers.cfm?abstract_id=1745427 (accessed on 19 July 2016).
- Manaf, Nor Aziah Abd, Natrah Saad, Zuaini Ishak, and Abdulsalam Mas’ud. 2014. Effects of Fiscal Regime Changes on Investment Climate of Malaysia’s Marginal Oil Fields: Proposed Model. Procedia-Social and Behavioral Sciences 164: 55–61. [Google Scholar] [CrossRef]
- McLaughlin, Tim. 2012. Myanmar reforms to lead growth: IMF. Myanmar Times 26 November 2012. Available online: https://www.mmtimes.com/business/3358-myanmar-reforms-to-lead-growth-imf.html (accessed on 21 July 2016).
- Mommer, Bernard. 2001. Fiscal Regimes and Oil Revenues in the UK, Alaska and Venezuela. OIES Working Papers WPM, Oxford Institute for Energy Studies, Oxford, UK. [Google Scholar]
- Mommer, Bernard. 2002. Global Oil and the Nation State. Oxford: Oxford University Press. [Google Scholar]
- Nakhle, Carole. 2004. Petroleum Taxation: A Critical Evaluation with Special Application to the UK Continental Shelf. Ph.D. dissertation, University of Surrey, Guildford, UK. [Google Scholar]
- Nakhle, Carole. 2007. Do high oil prices justify an increase in taxation in a mature oil province? The case of the UK continental shelf. Energy Policy 35: 4305–18. [Google Scholar] [CrossRef]
- Nakhle, Carole. 2008. Petroleum Taxation. London: Routledge. [Google Scholar]
- Nakhle, Carole. 2015. Licensing and Upstream Petroleum Fiscal Regimes: Assessing Lebanon’s Choices. Beirut: The Lebanese Centre for Policy Studies. [Google Scholar]
- 2015) Natural Resource Governace Institute (NRGI). 2015. Oil, Gas, and Mining Fiscal Terms. Available online: http://www.resourcegovernance.org/training/resource_center/backgrounders/oil-gas-and-mining-fiscal-terms (accessed on 22 July 2016).
- Odularu, Gbadebo Olusegun. 2008. Crude oil and the Nigerian economic performance. Oil and Gas Business. 1–29. Available online: https://s3.amazonaws.com/academia.edu.documents/5921722/odularo_1.pdf?AWSAccessKeyId=AKIAIWOWYYGZ2Y53UL3A&Expires=1543583443&Signature=l9llq1FWiEYvOOEX%2BN4mgOM9sOM%3D&response-content-disposition=inline%3B%20filename%3DCrude_Oil_and_the_Nigerian_Economic_Perf.pdf (accessed on 22 July 2016).
- Putrohari, Rovicky Dwi, Anggoro Kasyanto, Heri Suryanto, and Ida Marianna Abdul Rashid. 2007. PSC Term and Condition and Its Implementation in South East Asia Region. Paper presented at the Indonesian Petroleum Association 31st Annual Convention and Exhibition May 2007; Available online: http://archives.datapages.com/data/ipa_pdf/078/078001/pdfs/IPA07-BC-127.htm (accessed on 23 July 2016).
- Raja, Atif. 1999. Should Neutrality be the Major Objective in the Decision-Making Process of the Government and the Firm? CEPMLP Annual Review. 3. Available online: www.dundee.ac.uk/cepmlp/main/html/car_article2.htm (accessed on 13 June 2016).
- Robinson, Gwen. 2012. Myanmar: Opening up. Financial Times, April 19, 18. [Google Scholar]
- Rowland, Chris, and Danny Hann. 1987. Economics of North Sea Oil Taxation. Berlin: Springer. [Google Scholar]
- Sen, Anupama. 2014. Out of Gas: An Empirical Analysis of the Fiscal Regime for Exploration in India, 1999–2010. Available online: http://www.usaee.org/usaee2014/submissions/OnlineProceedings/ANUPAMA%20SEN%20Online%20Proceedings%20Paper%20%20IAEE%202014%20NY.pdf (accessed on 24 July 2016).
- Serova, Dina. 2015. Petroleum Fiscal System Design and Cost-Related Incentives in Oil and Gas Projects. Master’s thesis, Norwegian School of Economics, Bergen, Norway. [Google Scholar]
- Sieminski, Adam. 2014. International Energy Outlook. Available online: http://www.eia.gov/forecasts/ieo/pdf/0484%282014%29.pdf (accessed on 29 July 2016).
- Siew, Wei-Hun. 2001. Financial Evaluation Techniques Used to Evaluate Risk and Appraise Projects in the Oil Industry. Unpublished Ph.D. thesis, University of Dundee, Dundee, UK. [Google Scholar]
- Sunley, Emil M., Thomas Baunsgaard, and Dominique Simard. 2003. Revenue from the oil and gas sector: Issues and country experience. In Fiscal Policy Formulation and Implementation in Oil-Producing Countries. Washington, DC: International Monetary Fund, pp. 153–83. [Google Scholar]
- Thiri Swe, Wint, and Nnaemeka Vincent Emodi. Unpublished. Analysis of Myanmar Upstream Petroleum Fiscal Regimes: The Investors’ perspective.
- Tilton, John E. 2003. Assessing the threat of mineral depletion. Minerals and Energy-Raw Materials Report 18: 33–42. [Google Scholar] [CrossRef]
- United States Energy Information Administration (EIA). 2014. Available online: https://www.eia.gov/ (accessed on 27 July 2016).
- Wenrui, Jia, Xu Qing, Wang Yanling, and Yang Xueyan. 1999. The Development Strategy for China’s Oil Industry, 1996–2010. Beijing: Petroleum Industry Press. [Google Scholar]
- Zahidi, Sara. 2010. Comparative analysis of upstream petroleum fiscal systems of Pakistan, Thailand and other countries with medium ranked oil reserves. Paper presented at the International Conference on Energy and Sustainable Development: Issues and Strategies (ESD), Chiang Mai, Thailand, June 2–4; pp. 1–14. [Google Scholar]
- Zhao, Xu, and Carol Dahl. 2014. How OECD Countries Subsidizes Oil and Natural Gas Producers and Modeling the Consequences. Paper presented at the 37th IAEE International Conference on Energy & the Economy, New York, NY, USA, June 15–18. [Google Scholar]
| 1 | |
| 2 | Net Present Value. |
| 3 | Internal Rate of Return. |
| 4 | For example, business tax, value-added tax, import tax levied on the investment. |
| 5 | For example, royalty, profit split, host government participation, bonus based on income and profit levels. |
| 6 | Luo and Yan (2010) also made an average assumption for the sliding scales of petroleum fiscal regimes. |
| 7 | |
| 8 | Attitudes of the decision makers for the weights regarding the indicators GT and FLI were explained in Section 3 in detail. |
| 9 | Can be provided at a request to the authors. |
| 10 | Luo and Yan (2010). |
| 11 | CS = W1 × GT + W2 × FLI. |
| 12 | In FLI in Table 7, the three highest attractiveness rank countries adopt the PSC system while the three lowest attractiveness rank countries practice the concessionary system. Likewise, In CS in Table 8, the two highest attractiveness rank countries adopt PSC while the two lowest rank countries use concessionary. Hence, it is better to analyze separately for PSC and concessionary. |
| 13 | |
| 14 | Discounted Cash Flow Model for the calculation of GTi. |
| 15 | Non-Discounted Cash Flow Model for the calculation of GT. |
| 16 | The attractiveness rank of U.S. in terms of FLI (Table 8). |
| 17 | The smaller the FLI, the less risk the IOCs will face in the earlier stage, and the more attractive the contract fiscal terms are to the IOCs (Luo and Yan 2010). |
| 18 | Scores and weightings should be determined using a technique such as Delphin or Peer review or a questionnaire (Henriksen and Traynor 1999). |
| 19 | Cost recovery regime is used only in PSC fiscal system. |
| 20 | 25% of foreign earnings comes from natural gas export in Myanmar. |
| 21 | Cost Recovery—50% in Myanmar, 100% in Indonesia, 90% in Cambodia, 70% in Vietnam (Table 7). Cost recovery regime is used only in the PSC system. |
| 22 | The stability of the fiscal regime is also considered to maintain the investor’s confidence. |
| 23 | Assessment and comparison of fiscal terms in different countries can help the IOC in selection of investment areas and adjust its business strategy according to its own situation, to achieve greater operational efficiency and secure and increase the value of assets. |
Figure 1.
Proposed Modeling Framework.

Figure 2.
Attractiveness Rank of Eight Countries by GT.

Figure 3.
Attractiveness Rank of Eight Countries by GTi.

Figure 4.
Attractiveness Rank of Eight Countries by FLI.


Table 1.
Major Concept of Economic Rent.
| No. | Concept | Author |
|---|---|---|
| 1 | Economic rent is extra revenue earn by investors. | Raja (1999) |
| 2 | The true value of the natural resource is the difference between the revenues generated from resource extraction and the costs of extraction. | Dickson (1999) |
| 3. | The surplus return above the value of the capital, labor and other factors of production for resource exploitation or surplus revenue of the resource after the costs of capital and labor inputs. | Banfi et al. (2004) |
| 4. | The idea of surplus return drives from the reason of ownership in which the state should receive compensation above the normal taxes paid by other industries. | Tilton (2003) |
| 5. | In general, the studies contend that a tax based on economic rent is likely to be an ideal tax. | Nakhle (2004) |
| 6. | Economic rent concept is important since the government attempts to capture as much economic rent possible through various levies, taxes, royalties, and bonuses. | Lubiantara (2007) |
| 7. | A fiscal regime that has been designed to capture the economy tends to increase when economic rent increases, and reduce government take when economic rent decreases. | Nakhle (2008) |
| 8. | The reason to adopt the economic rent theory as a framework is that taxes levied on economic rent will not act as a disincentive on investor to undertake any activity. | Nakhle (2008) |
| 9. | Economic rent constitutes a justifiable base for petroleum taxation. | Kyari (2013) |
Table 2.
Data Sources for each Indicator.
| Indicator | Necessary Parameters | Data Source | Previous Studies |
|---|---|---|---|
| GT (NDCF) | Production profile, CAPEX, OPEX, DD& Price Fiscal Term Variables (Royalty, Bonus, Cost Recovery, Profit Split, Tax) | Kaiser (2007) US Energy Information Administration 1. Ernst & Young (2015). Global Oil & Gas Tax Guide 2. PSC Features for Offshore Petroleum Exploration: Ministry of Energy, Myanmar | Same Assumptions 1. (Kaiser (2007) 2. Bindemann (1999) 3. Johnston (1994) Assumption of oil price and relevant taxes is sufficient: - to calculate expected cash flows to determine the investor’s return and government take (GT) (Nakhle 2004) |
| GT (DCF) | Discount Rate (10%) | Nakhle (2004). Petroleum taxation. | Assumption 10 per cent in real terms, - as was applied in the majority of published studies, - to mirror to industry’s discount rate. |
| CS | Weights (Attitude of Decision Makers) | Primary source of data by survey questionnaire to subject matter experts of Korean companies. | Scores and Weightings should be determined using a technique such as Delphin or Peer review or a questionnaire (Henriksen and Traynor 1999). |
| Comparative Analysis | Country Selection | Primary source by survey questionnaire |
Table 3.
Petroleum Fiscal Terms of PSC System.
| Descriptions | Cambodia | Indonesia | Myanmar | Vietnam | ||||
|---|---|---|---|---|---|---|---|---|
| Gov | IOC | Gov | IOC | Gov | IOC | Gov | IOC | |
| Royalty Rate | 12.5% | 12.5% | 6% | |||||
| FTP | 10% | |||||||
| Profit Petroleum | 35% | 65% | 60% | 40% | 60% | 40% | 40% to 80% | |
| Cost Recovery | 90% | 100% | 50% | 70% | ||||
| Production Bonus | Negotiable | 1 MM$ To 10 MM$ | Negotiable | |||||
| Domestic requirement | To meet the domestic demand | 25% | 25% | - | ||||
| Training Fund | 1.5 L to 2.5 L | Negotiable | 0.5 L to 1 L | Subject to Each Contract | ||||
| R&D Fund | Nil | Nil | 0.5% of Profit | Nil | ||||
| Government Participation | Subject to agreement | 10% | 20% to 25% | 15% | ||||
| Tax | 25% | 44% | 25% | 35% to 55% | ||||
Source: PSC Features for Offshore Petroleum Exploration: Research and Training (Ministry of Energy, Myanmar, 2012), [email protected].
Table 4.
Main Fiscal Parameters of Myanmar, Cambodia, Indonesia, and Vietnam.
| Descriptions | Cambodia | Indonesia | Myanmar | Vietnam | ||||
|---|---|---|---|---|---|---|---|---|
| Gov | IOC | Gov | IOC | Gov | IOC | Gov | IOC | |
| Royalty Rate | 12.50% | 12.50% | 6% | |||||
| FTP | 10% | |||||||
| Profit Petroleum | 35% | 65% | 60% | 40% | 60% | 40% | 40–80% | 60–20% |
| Cost Recovery | 90% | 100% | 50% | 70% | ||||
| Tax | 25% | 44% | 25% | 35–55% | ||||
| Host Gov Participation | Open and subject to the petroleum agreement | 10% | 15–25% (if reserves is greater than 5 trillion cubic feet) | Subject to negotiation. Normally 15% | ||||
Table 5.
Petroleum Fiscal Regimes of Concessionary System.
| U.S | Canada | Australia | Mozambique | |||||
|---|---|---|---|---|---|---|---|---|
| Gov | IOC | Gov | Cont | Gov | IOC | Gov | IOC | |
| Royalty Rate (Onshore) | 12.5–30% | 10–45% | 0–12.5% | 6–10% | ||||
| (Offshore) | 18.75% | |||||||
| Average Royalty Rate | 20 | 27.0% | 6.25% | 8% | ||||
| Corporate Income Tax | CIT 35%, State Income Tax 0–12% | Federal Corporate Tax 15% | 30% | 32% | ||||
| Profit-Based Tax | Provincial Tax Rate 10% to 16% | 40% | ||||||
| Depreciation | 10 year Straight-Line | Nil | Immediate write-off | Nil | ||||
| Bonus | Nil | Negotiable | Signature Bonus 0.5–5% of assets | |||||
| Tax-Loss | Carried back 2 years | Carried forward 20 years and backward 3 years | Carried back 2 years | Carried forward 5 years | ||||
Table 6.
Summary of Main Fiscal Parameters in Concessionary and PSC.
| Fiscal Term Policy | Country | ROY (%) | Tax (%) | ROY + Tax (%) | Cost Recovery (%) | Profit Split (%) | Gov-Participation (%) | Depreciation (Year) (Straight Line Method) |
|---|---|---|---|---|---|---|---|---|
| Concessionary | Mozambque | 8 | 32 | 40 | Not applicable | |||
| Australia | 6.25 | 30 | 36.25 | Not applicable | ||||
| Canada | 27.5 | 15 | 42.5 | Not applicable | ||||
| U.S | 20 | 35 | 55 | 10 | ||||
| PSC | Cambodia | 12.25 | 25 | 37.25 | 90 | 35 | Negotiable | 5 |
| Myanmar | 12.25 | 25 | 37.25 | 50 | 60 | 15 to 25 | 5 | |
| Indonesia | 10 | 44 | 54 | 100 | 60 | 10 | 5 | |
| Vietnam | 6 | 55 | 61 | 70 | 40 | Negotiable | 5 |
Source: “PSC Features for Offshore Petroleum Exploration”, paper presented at a research and training meeting in Ministry of Energy, Myanmar. www.vdb-loi.com, and Global Oil and Gas Tax Guide (Ernst & Young 2015).
Table 7.
Results of GT, GTi, and FLI.
| Country | GT (Without Time Consideration) | GTi (With Time Value of Money) | FLI (Front Loading Index) |
|---|---|---|---|
| Myanmar | 63.37% | 22.06% | 65.19% |
| Cambodia | 41.01% | 17.13% | 58.23% |
| Indonesia | 49.32% | 23.34% | 52.67% |
| Vietnam | 58.31% | 23.34% | 59.97% |
| Australia | 43.92% | 14.08% | 67.94% |
| U.S. | 72.74% | 25.67% | 64.71% |
| Canada | 58.36% | 18.00% | 69.15% |
| Mozambique | 49.39% | 16.15% | 67.30% |
Table 8.
CS Value and Attractiveness Rank of Eight Countries.
| Country | CS (Composite Score) | Attractiveness Rank |
|---|---|---|
| Cambodia | 51.00% | 1 |
| Indonesia | 51.26% | 2 |
| Australia | 57.85% | 3 |
| Vietnam | 59.27% | 4 |
| Mozambique | 59.78% | 5 |
| Myanmar | 64.43% | 6 |
| Canada | 64.62% | 7 |
| U.S. | 68.08% | 8 |
© 2018 by the authors. Licensee MDPI, Basel, Switzerland. This article is an open access article distributed under the terms and conditions of the Creative Commons Attribution (CC BY) license (http://creativecommons.org/licenses/by/4.0/).
Share and Cite
MDPI and ACS Style
Swe, W.T.; Emodi, N.V. Assessment of Upstream Petroleum Fiscal Regimes in Myanmar. J. Risk Financial Manag. 2018, 11, 85. https://0-doi-org.brum.beds.ac.uk/10.3390/jrfm11040085
AMA Style
Swe WT, Emodi NV. Assessment of Upstream Petroleum Fiscal Regimes in Myanmar. Journal of Risk and Financial Management. 2018; 11(4):85. https://0-doi-org.brum.beds.ac.uk/10.3390/jrfm11040085
Chicago/Turabian StyleSwe, Wint Thiri, and Nnaemeka Vincent Emodi. 2018. "Assessment of Upstream Petroleum Fiscal Regimes in Myanmar" Journal of Risk and Financial Management 11, no. 4: 85. https://0-doi-org.brum.beds.ac.uk/10.3390/jrfm11040085