Review

Time-Varying Price–Volume Relationship and Adaptive Market Efficiency: A Survey of the Empirical Literature

by
Ashok Chanabasangouda Patil
1,*,†,‡ and
Shailesh Rastogi
2,‡
1
Kirloskar Institute of Advanced Management Studies, Pune 410506, India
2
Symbiosis Institute of Business Management, Pune 412115, India
*
Author to whom correspondence should be addressed.
Current address: Plot 434, Sector 21, Yamunanagar, Nigadi, Pune 411044, India.
These authors contributed equally to this work.
J. Risk Financial Manag. 2019, 12(2), 105; https://0-doi-org.brum.beds.ac.uk/10.3390/jrfm12020105
Submission received: 25 May 2019 / Revised: 18 June 2019 / Accepted: 19 June 2019 / Published: 22 June 2019
(This article belongs to the Special Issue Review Papers for Journal of Risk and Financial Management (JRFM))

Abstract

:
This paper conducts a review of the literature on the price–volume relationship and its relation with the implications of the adaptive market hypothesis. The literature on market efficiency is classified as efficient market hypothesis (EMH) studies or adaptive market hypothesis (AMH) studies. Under each class, studies are categorized either as return predictability studies or price–volume relationship studies. Finally, review in each category is analyzed based on the methodology used. Our review shows that the literature on return predictability and price–volume relationship in classical EMH approach is extensive while studies in return predictability in the AMH approach have gained increased attention in the last decade. However, the studies in price–volume relationship under adaptive approach are limited, and there is a scope for studies in this area. Authors did not find any literature review on time-varying price–volume relationship. Authors find that there is a scope to study the nonlinear cross–correlation between price and volume using detrended fluctuation analysis (DFA)-detrended cross–correlational analysis (DXA) in the AMH domain. Further, it would be interesting to investigate whether the same cross–correlation holds across different measures of stock indices within a country and across different time scales.

Graphical Abstract

1. Introduction

One of the core concepts in the neoclassical finance that has been extensively researched and debated is the market efficiency, and has its roots in the studies conducted by Fama (1965, 1970), Samuelson (1965) and Roberts (1967), who introduced the concepts of efficient markets and efficient market hypothesis (EMH) to the world. Markets are defined to be efficient if prices always fully reflect available information (Fama 1970). This requires that all available information is immediately available to all the participants and prices reflect this information immediately. However, a distinction is made between weak-form, semi-strong form and strong-form of efficiency based on the type of information that is reflected in the price. The weak-form of efficiency tests whether the market prices reflect the information that already is contained in the past market data such as past prices, trading volume or short sales (Rizvi and Arshad 2017).
This weak-form of hypothesis has been extensively tested and debated over the years. Results of some of the studies deduced the existence of the weak form of efficiency while some argued against. The focus of these studies was limited to test whether the markets are efficient. A fresh perspective on the adaptive nature of the market was offered by Lo (2004, 2005) using adaptive market hypothesis (AMH). According to AMH, market efficiency is related to environmental factors such as the number of competitors in the market, the magnitude of profit opportunities available, and the adaptability of market participants.
Although the AMH is not formally defined, its implications have been studied to indicate the existence of the adaptive nature of the markets. The first implication of AMH indicates that the relationship between risk and reward is unlikely to be stable over time. The second implication is that arbitrage opportunities exist from time to time. The third implication suggests that changing business conditions change investment strategies. The fourth implication is that adaptation to changing market conditions is key to survival (Lo 2004). Moreover, the AMH is not a substitute for the EMH, but supports in understanding the empirical variation of the EMH. For example, time-varying efficiency is better understood in the context of the implications of the AMH.
Although the literature on time-varying efficiency is increasing, authors do not find any review of literature on the time-varying price–volume relationship and/or time-varying market efficiency. Trading volume has played second fiddle to returns in understanding the efficiency of the market. Blume et al. (1994) have shown analytically that volume may act as an indicator of the quality of information revealed by prices. This justifies the use of volume in forecasting future stock returns. While authors do agree that return predictability is the focus of the academic literature, however, Gebka and Wohar (2013) have argued that volume return causality is a robust phenomenon. Volume can reveal investor’s future risk preferences and hence expected returns. This time-varying nature of the markets can be studied by testing whether autocorrelation between the returns or price–volume relationship changes over time. Some recent papers that have studied this effect are of Neely et al. (2009); Hiremath and Narayan (2016); Noda (2016), Urquhart and McGroarty (2016); Khuntia and Pattanayak (2018); Rizvi and Arshad (2017); Charles et al. (2017); Ito et al. (2016).
Studies reviewing the conditions of efficiency are of value from the perspective of traders, investors, and policymakers. Such a review also would be valuable as it produces synthesized knowledge base for the future research (Tranfield et al. 2003).
The literature on weak-form market efficiency can be divided into classical and adaptive studies; classical studies focus on the premise that markets move toward efficiency over period whereas adaptive studies focus on changing or dynamic nature of markets. These studies further can be divided into two groups based on the type of relation that is tested to determine the efficiency, viz. return predictability and price–volume relationship. Each study is further compared based on the methodology used to test the efficiency. The focus of this paper is to review the literature studying weak-form, time-varying market efficiency with keeping in mind the following objectives:
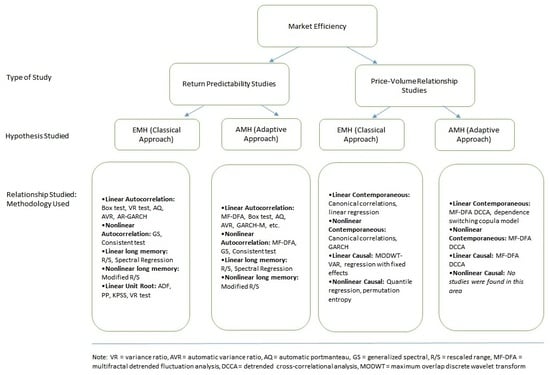
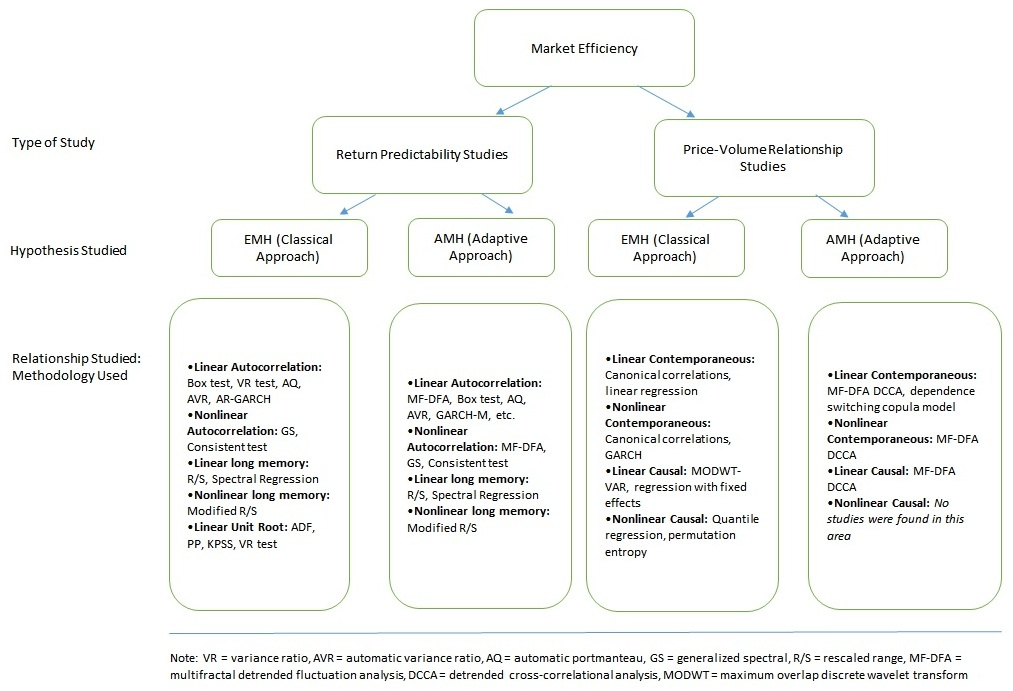
  • To classify the literature based on the approach to the weak-form of the efficiency
  • To categorize the studies in each approach based on the relationships studied
  • To compare each relationship studied based on the methodology adopted
  • To discover the scope for future research
The important implications of this review are as follows. Firstly, we show that the extant literature has established that there exists a nonlinear relationship between returns and past returns and also nonlinear relationship between price and volume. Secondly, the multifractal nature of the price and volume series implies that the relationship to vary over time, which is the implication of AMH. Thirdly, we discover important research gaps that help understand the relationship between price–volume and efficiency in the context of AMH.
The review of studies in this paper is organized as shown in the Table 1 and Table 2. These tables include a few indicative papers for ready reference. Table 1 shows the review matrix for return predictability studies and Table 2 shows the review matrix for price–volume relationship studies.
The rest of the paper is organized as follows. Section 2 describes the random nature of price fluctuation and the efficient market hypothesis. Section 3 develops the perspective of adaptive market hypothesis. Section 4 reviews the return predictability studies in both EMH and AMH perspectives. Section 5 reviews the studies covering the price–volume relationship under EMH and AMH perspectives. Section 6 lists the findings and illustrates the research gap followed by the conclusion in Section 7.

2. The Random Nature of Price Fluctuations and Efficient Market Hypothesis

Study on the random nature of price fluctuation can be traced back to Bachelier (1900) who deduced that the mathematical expectation of a potential profit of a speculator to be zero and showed that movement of stock prices is a stochastic process. The random nature of the price changes was further studied and supported by Cowles (1933); Working (1934); Kendall and Hill (1953); Osborne (1959) and Roberts (1967) and challenged by Cootner (1962); and Steiger (1964). However, the term efficient was first introduced by Fama (1965) for the first time in his paper concluding the prices follow a random walk. Fama (1965) further elaborated that in an efficient market the actual price would be a good estimate of its intrinsic or fundamental value. In the same year, Samuelson (1965) explained the efficient market in terms of a martingale rather than a random walk. (Readers are directed to Delcey (2018) for the precise difference between Fama and Samuelson in the theoretical construction of EMH1.)
Roberts (1967) coined the term efficient market hypothesis (EMH) and also made a distinction between weak and strong form tests. Later, Fama (1970) formally defined efficient markets as
“a market with great number of rational profit maximizers actively competing, with each trying to predict future market values of individual securities, and where current important information is almost freely available to all participants.”
Since then the EMH has been debated and evidence against EMH has been offered by LeRoy (1973, 1976, 1989) pointing out that stock prices follow martingale process and not random walk. Basu (1977) found the use of the P/E ratio to forecast prices while Ball (1978) documented excess returns after public announcements. Jensen (1978) pointed out the existence of arbitrage opportunity while Lucas (1978) indicated that rational investor may behave differently under risk aversion conditions. Grossman and Stiglitz (1980) argued that markets tend to move toward efficiency over time eliminating any price anomalies. Shiller (1981) showed that volatility of the stock prices is higher than calculated based on fundamental information. Banz (1981) documented that small stocks outperform large stocks and LeRoy and Porter (1981) showed excess volatility in the stocks. Kiem (1983) found that the relation between size and excess return is always negative. These studies provide evidence against the tenets of the EMH.
Further evidence against the EMH was shown by Lo and MacKinlay (1988) who used the variance ratio test and rejected the random walk hypothesis.Fama and French (1988) found large negative autocorrelations in the stock returns in longer time horizons, Conrad and Kaul (1988) found time-variation in expected returns, Poterba and Summers (1988) showed positive autocorrelations in short run and negative autocorrelations over the long run, De Long et al. (1990) showed that irrational noise traders earn higher than expected returns.
In the midst of challenges to the EMH theory, Fama (1991) reclassified the empirical tests of market efficiency, renaming the weak form tests of market efficiency as tests for return predictability, semi-strong martingale tests as event studies and tests for strong-form as tests for private information. He conducted tests of return predictability using variables such as dividend-price ratio, earnings–price ratio, the book–to–market ratio among others instead of using the past returns.
The evidence against EMH still continued with De Bondt (1993); Ferson and Harvey (1993); Fama and French (1995); and Pesaran and Timmermann (1995). Fama (1998) termed this evidence as anomalies, anomalies being the chance results. The debate still continued as Shiller (2003) urged to replace EMH with behavioural finance framework and Schwert (2003) presented further anomalies. While Malkiel (2003) made a strong case for the continuation of EMH, he also presented evidence against EMH in the long run trend in 2005 (Malkiel 2005). Timmermann and Granger (2004) found that forecasting patterns are not persistent thereby supporting EMH, while Milionis and Moschos (2000) argued that due to the heteroscedasticity, although the random walk hypothesis is rejected, the weak-form of hypothesis may not be rejected. Brealey et al. (2011) defined a market as efficient when it was not possible to earn a profit higher than the market return. Recently, Gârleanu and Pedersen (2018) proposed a model in which anomalies arise due to the friction between an investor’s search cost of finding informed asset manager and asset manager’s cost of collecting the information about assets. They term the markets with such anomalies as efficiently inefficient markets where there is an equilibrium level of inefficiency reflecting this friction between these two costs.
Apart from arguing against or supporting EMH, there are quite a few papers that could be bifurcated into theoretical exploration papers and survey of literature papers. In the first group, Rubinstein (1975) gave a theoretical exploration of prices fully reflect the information and Milionis (2007) provided the statistical definitions and comments on EMH. Beaver (1981) and Cornelius (1993) explored the definition of informational efficiency. Malkiel (1989) wrote an article on the meaning of efficiency, while Gilson and Kraakman (1984) covered the mechanisms of market efficiency. O’Hara (2003) explored the relationship between liquidity and efficiency, Malkiel (2003) commented on the critics of the EMH, and Jarrow and Larsson (2012) explained the meaning of market efficiency. In the second group, one can refer to the survey of the empirical literature on EMH by Andreou et al. (2001) on the review of statistical models. Yen and Lee (2008) provided empirical evidence on EMH. Degutis and Novickytė (2014) reviewed the literature and methodology on EMH. Ţiţan (2015) and Fakhry (2016) did a review of specialized literature of EMH.
The literature on testing the market efficiency in its weak-form is vast and increasing. However, a new perspective based on bounded rationality is developed recently and is covered in the next section.

3. Adaptive Market Hypothesis

Efficient Market Hypothesis presumes that markets are either efficient or inefficient and that degree of market efficiency over time is stable over a period. This all-or-nothing notion of market efficiency set by EMH was criticized by Grossman and Stiglitz (1980). They argued the impossibility of informationally efficient markets, because if markets are efficient then there would not be any incentive for traders to acquire costly information. In the light of the impossibility of perfect efficient markets, Campbell et al. (1997) introduced a notion of relative efficiency, which permits to compare the efficiency of one market to another market. This gave way to research in the area of changing or dynamic market efficiency.
During this period, academics focused on time-varying or evolving efficiency. For example, Emerson et al. (1997) used Kalman filter technique to trace the changing degree of market efficiency over a period. Zalewska-Mitura and Hall (1999) formalized the time-varying autoregressive model to test the time evolving market efficiency. Charles and Darné (2009) highlighted the use of rolling subsamples to capture the effect of structural changes while applying the time-varying auto-regressive models.
Another stream of literature based on behavioural aspects was developed2 during this period which integrated the behavioural concepts into the modern portfolio theory. This theme was first studied by De Bondt and Thaler (1985) discovering that stock prices overreact implying that markets are inefficient and are dependent on the behavioural aspect of the investors. Daniel et al. (2001) showed that investors are overconfident and have self-attribution bias that goes against the rational behaviour expected from the investor in the EMH paradigm. Shiller (2003) urged to replace EMH with behavioural finance paradigm. Subsequently, Lo (2004) proposed an adaptive market hypothesis (AMH) based on evolutionary principles with the notion of bounded rationality Simon (1955) to coexist with EMH. Recently, Lo (2012) considered that the investor population, who learn from and adapt to the market environment, change over time.
Under the AMH, prices reflect as much information as dictated by the combination of business conditions such as the number of competitors entering and exiting the industry, and the type and magnitude of profit opportunities available (Lo 2004). The AMH is qualitative and abstract in nature, and therefore the formal definition of AMH is not available in the literature. However, concrete practical implications are derived to test the AMH. These implications are as follows. First, the relation between risk and reward is unlikely to be stable over time, i.e., the relation is time-varying. Second, there will be arbitrage opportunities available in the market from time to time, indicating markets efficiency changes over the period. Third, the changing business conditions change the investment strategies and therefore, there will be a change in the payoffs. Fourth, the participants adapt to the changing market condition in order to survive. The AMH can be inferred by studying these implications in the market.
The following section covers the return predictability studies under both the EMH and AMH perspectives.

4. Return Predictability Studies

The weak form of efficiency tests can be classified as tests of return predictability and tests of profitability of trading strategies (Lim and Brooks 2011). Tests of return predictability include tests of linear serial correlations, unit root tests, low-dimensional chaos, nonlinear serial dependence, and long memory. The tests of profitability of trading strategies include technical trading rules, momentum and contrarian strategies. This paper focuses only on the return predictability studies and the following subsection covers the studies under the tests of return predictability.

4.1. Return Predictability and EMH

It is well known that the weak-form of efficiency considers that price movements are random in nature and therefore cannot be predicted based on the past market information. In other words, the prices do not have a long memory and should not exhibit any pattern that could enable forecasting future prices. The weak-form of efficiency of the market is established by testing the randomness (random walk hypothesis—RWH hereafter) or martingale difference hypothesis (MDH hereafter in this section) in the price series.
Unit Root Tests The RWH is tested using unit root tests such as ADF (Dickey and Fuller 1979), PP (Phillips and Perron 1988), DF-GLS (Elliott et al. 1996), NP (Ng and Perron 2001) and KPSS (Kwiatkowski et al. 1992) to show whether the series is non-stationary (non-stationarity implying RWH) and variance ratio test (Lo 1989; Lo and MacKinlay 1988).
Standard linear models test RWH using unit roots tests such as ADF, PP, KPSS or variance ratio test. Konak and Şeker (2014) test developed markets for the presence of random walk using unit root tests such as ADF and PP and shows that the market is non-stationary and therefore random walk hypothesis is accepted and concludes the existence of weak-form of market efficiency in FTSE 100. Gupta and Yang (2011) study Indian capital market using ADF, PP and KPSS tests and find that all three tests reject weak-form of efficiency for daily and weekly data, but support for quarterly data. Worthington and Higgs (2004) also test the European markets for the random walk using ADF, PP, KPSS, multiple variance ratio (MVR) test and find that European markets, in general, are inefficient.
Autocorrelation Tests The MDH is typically tested in the time-domain using the sample autocorrelations or in the spectral-domain (frequency-domain) using the periodogram. In the time-domain, the serial correlation for MDH is tested using the portmanteau test of Ljung and Box (1978) and variance ratio test by Lo (1989); Lo and MacKinlay (1988). Recent development in techniques has bettered these tests in terms of size and power properties. These tests are automatic portmanteau (AQ) test by Escanciano and Lobato (2009) and the automatic variance ratio (AVR) test by Kim (2009). However, the presence of long memory i.e., long term dependence in asset returns poses challenges for the results obtained through linear models and requires that nonlinear models be developed. In the nonlinear measures, most popular are the generalized spectral (GS) test and the Consistent tests of Domínguez and Lobato (2003). Further, a survey of literature supports the use of Wild Bootstrap AVR in linear dependence and Wild Bootstrap GS in nonlinear dependence.
Rockinger and Urga (2000) test the transition economies (Czech Republic, Hungary, Poland, Russia) for the evolution of efficiency using time–varying AR (1) model with GARCH effects and find that Hungarian markets are efficient and Czech and Polish markets are converging toward efficiency.
The general finding in the literature review of this section is that there is evidence for weak-form efficiency in the US, find European markets in general inefficient, while transition economies and developing countries are moving toward efficiency.
Long-memory models As many studies have found out long memory or long-term dependence in the time series, the application of linear models to such a series is questionable. The presence of long memory indicating long term dependence in the series contradicts the weak form of EMH. The long memory or dependence in the series is tested using the rescaled range (R/S) method in the linearity of series framework, but it fails to address the nonlinear series. Lo (1991) developed a modified R/S method to address this issue and found no evidence to support long memory in US stock returns. Gozbasi et al. (2014) employed nonlinear ESTAR unit root test (developed by Kruse (2011)) and found nonlinear behavior in Borsa Istanbul stock price index series. Using R/S method and the spectral regression method, Cheung and Lai (1995) find no evidence of persistence in several international stock returns series. Barkoulas et al. (2000) test the long memory or fractional dynamics with spectral analysis using ARFIMA and find evidence for long memory in the Greek market. For a summary of methods and review of important studies in both linear and long memory models, readers are directed to Sewell (2012).
Contrary to recent findings using the multifractal analysis, these studies didn’t find long memory in the US, Greece, Turkey and many other countries.

4.2. Return Predictability and AMH

One of the stylized facts (refer (Cont 2001)) of financial time series, intermittence, implies the oscillatory and heterogenic fluctuation in the time series. This means that returns display a high degree of variability or fluctuation at any time scale. This fluctuation is found to be multifractal nature, first introduced by Mandelbrot et al. (1997). They claim that the multifractal model of asset returns also explains most of the other stylized facts of financial time series. Standard models like serial correlation tests, runs tests, unit root tests, variance ratio tests cannot capture the multifractal nature of financial time series (Bacry et al. 2001). Therefore, techniques measuring the multifractal nature of time series have emerged in the literature. Two of the most well-known numerical methods to find the multifractal spectrum of time series are the Wavelet Transform Modulus Maxima (WTMM) and Multifractal Detrended Fluctuation Analysis (MF-DFA). MF-DFA is the preferred method showing less bias and giving less false positive results.
Since the AMH implies the fluctuation in the price due to the adaptive nature of its environment and participants, studies employing MF-DFA have mushroomed in this domain. Other commonly used standard techniques are modified R/S analysis, autocorrelation tests, generalized spectral (GS) test, which is a non-parametric test used to determine the existence of linear and nonlinear dependence in a stationary time series. The following discussion reviews the literature in both the modified versions of standard tests and MF-DFA tests to measure the dynamic nature of the market efficiency.

4.2.1. Testing Efficiency with Hurst Exponent

Tiwari et al. (2019) employ MF-DFA based on Hurst exponent to compare the relative efficiency using the long span of data and show that markets are multifractal and mostly long-term persistent. However, they also find even though the efficiency is varying over time, the markets are not weak-form efficient. Hiremath and Narayan (2016) used the Generalised Hurst exponent derived using fixed and rolling windows technique and found that long-range dependence is time-varying, implying that the efficiency of Indian stock markets has evolved over time and is moving toward efficiency. Anagnostidis et al. (2016) tested Eurozone markets for random walk hypothesis (RWH) via the generalized Hurst exponent analysis, in which Hurst exponent was estimated through a rolling window technique. They found significant mean reverting patterns in stock price movements. Sensoy and Tabak (2015) used generalized Hurst exponent and found that stock markets have different time-varying long-term memory. Horta et al. (2014) calculated Hurst exponent with MFDMA i.e., multifractal detrended moving average and found that Hurst exponent exhibit long memory in the crisis period. Wang et al. (2009) investigated the changing Hurst exponent using MF-DFA and found that the Shenzhen stock market was becoming more and more efficient. Cajueiro and Tabak (2004) used Hurst exponent for testing whether markets are becoming more efficient over the period.
A general finding of the literature is that markets are multifractal in nature and efficiency is time-varying and that most popular method is analysing Hurst exponent estimated by MF-DFA method.

4.2.2. Testing Adaptive Efficiency with Modified Standard Tests

Ghazani and Ebrahimi (2019) using automatic portmanteau (AQ) and generalized spectral (GS) test found that the crude oil market conforms with the AMH principle. Khuntia and Pattanayak (2018) used the consistent test of Domínguez and Lobato (2003) and GS of Escanciano and Velasco (2006) to test Martingale Difference Hypothesis and AMH and found that market efficiency evolves with time and validated the AMH in the bitcoin market. They also found that linear and nonlinear dependence evolves with time. Kim et al. (2011) employed automatic variance ratio test, automatic portmanteau test, generalized spectral test and found return predictability to be smaller during economic bubbles than in normal times. They also found evidence that return predictability is associated with stock market volatility and economic fundamentals. Studying the foreign exchange market, Hull and McGroarty (2014) measure the long-term memory using rescaled range methodology and show greater efficiency in returns and volatility for ‘advanced’ emerging markets. They find evidence against weak-form EMH with persistent market memory, which is consistent with AMH.
Charles et al. (2017) test Martingale difference hypothesis using automatic portmanteau and variance ratio tests and find that returns have been predictable in a number of periods, consistent with the implications of AMH. Lim et al. (2013) used automatic portmanteau Box-Pierce and wild bootstrap automatic variance ratio test and found that periods with significant return autocorrelations can largely be associated with major exogenous events. Theoretically, the documented time–varying nature of predictable patterns is consistent with the adaptive markets hypothesis. Using three bootstrapped versions of the variance ratio test on fixed length moving window, Urquhart and McGroarty (2016) found that return predictability in stock markets does vary over time in a manner consistent with AMH.
Hiremath and Kumari (2014) used both linear and nonlinear tests. Linear tests showed a cyclical pattern in linear dependence suggesting that the Indian stock market switched between periods of efficiency and inefficiency. In contrast, the results from nonlinear tests revealed strong evidence of nonlinearity in returns throughout the sample period with a sign of tapering magnitude of nonlinear dependence in the recent period. Ahmed (2014) employed rolling joint variance ratio test tests, in rolling window procedure and found support for the time-varying market efficiency. Todea et al. (2009) verified that implications of AMH and found that the degree of market efficiency varies through time in a cyclical fashion.
Urquhart and Hudson (2013) conclude that the AMH describes the behaviour of stock returns better than the EMH. Al-Khazali and Mirzaei (2017) using stochastic dominance and mean-variance analysis showed that AMH explanation of calendar anomalies is better than EMH explanation. Tuyon and Ahmad (2016) observed that dynamic stock price behaviour is in line with the bounded-adaptive market efficiency. Noda (2016) used time-varying AR model and found that the degree of market efficiency changed over time.
Using a non-Bayesian time-varying AR model approach, Ito et al. (2016) discovered that the US stock market evolved over time in a cyclical fashion and showed considerable long periodicity. Charfeddine and Khediri (2016) tested the weak-form of market efficiency employing GARCH-M with state space time–varying parameter and rolling technique sample test on the long memory parameter. They found that GCC markets have different degrees of time-varying market efficiency.
Neely et al. (2009) discovered that excess returns declined over time, but at a much lower speed that would be consistent with efficient markets. Zalewska-Mitura and Hall (1999) extended the classical test for autocorrelation of returns by combining a multi-factor model with time-varying coefficients and the GARCH-M approach to investigate evolving market efficiency. Using Monte Carlo simulation, their findings indicate changing levels of inefficiency in developing markets.
Most of the studies using modified standard tests have supported the adaptive nature of the stock market.

4.2.3. Testing Efficiency Using Both Modified-Standard and MF-DFA Methods

Khediri and Charfeddine (2015) tested time–varying market efficiency using wild bootstrap variance ratio tests and DFA technique finding strong evidence of time varying markets efficiency with rapid mean reversion toward market efficiency. Rizvi and Arshad (2017) using MFDFA and MGARCH technique found that Japan improved efficiency over the period. Rodriguez et al. (2014) employed the DFA technique and found the US market efficiency varies over time and time scales.
The majority of these studies in this domain found the multifractal nature of time series and showed that market efficiency evolves over a period and is dynamic in nature and thus are in line with implications of AMH.

5. Price–Volume Relationship Studies

According to Karpoff (1986) and Karpoff (1987), price–volume relationship3 is important as it helps in understanding the theories of dissemination of information flow into the market. A positive correlation between stock returns and daily trading volume implies that volume does not provide additional information that is not reflected in stock price (Clark 1973; Crouch 1970; Wood et al. 1985). Blume et al. (1994) and Suominen (2001) investigate the information content of volume on financial markets and find that volume carries information that price alone cannot convey to the market. Lamoureux and Lastrapes (1990) argued that ARCH in the price series represents time dependence in the information flow to the market, and the trading volume reflects this information flow. He showed that trading volume has significant explanatory power in predicting the variance of daily returns, but this effect disappears when the volume is included in the variance equation of the ARCH model. Lee and Swaminathan (2000) show that past volume has information in predicting the price and Chordia and Swaminathan (2000) document that trading volume is a significant determinant of the lead-lag patterns observed in stock returns.
Modeling price–volume relationship Several models are built considering the relation between price and volume, for example, asymmetric volume model of Epps (1975), sequential arrival of information (SIA) model of Copeland (1976), mixture of distribution model (MDM) of Clark (1973); Epps and Epps (1976); Tauchen and Pitts (1983); and Harris (1987). MDM and SIA could be tested with agent-based (simulation) methods, but not with the real data from financial markets. Since trading activity is driven by different types of investors receiving, interpreting and forwarding different types of messages, scholars have come up with two different information related hypotheses that try to explain the relation between price and volume. The first hypothesis relates return volatility and trading volume contemporaneously, based on the mixture of distribution hypothesis (MDH in this section) predicted by Clark (1973) and Harris (1987). The second hypothesis does not relate volume and returns volatility contemporaneously, implying there is a causal lead-lag relationship, predicted by the sequential information arrival hypothesis (SIAH) of Copeland (1976) and Smirlock and Starks (1988). (Refer Wang et al. (2018) for more details)

5.1. Price–Volume Relationship and EMH

Informational efficiency or EMH emphasizes that information should immediately be incorporated into the prices. Therefore, prices should reflect all the information available. The information available for weak-form efficiency is past prices or volume (Rizvi and Arshad 2017). The price and volume series is generated by the market simultaneously. Therefore, any distant relationship (long memory) between the past prices series and volume series indicate that information is not reflected in the price immediately and thus violates the assumption of EMH.
Contemporaneous and Causal Relationship The literature in the contemporaneous and causal relationship can be divided according to the findings of the studies: studies finding contemporaneous, unidirectional causal, and bidirectional causal relationships and no relationship.
Positive correlation was found by Copeland (1976); Harris and Raviv (1993); Chen et al. (2001); Gagnon and Karolyi (2009); He and Wen (2015); Nasiri et al. (2018) whereas Campbell et al. (1993) found negative relationship and Godfrey et al. (1964) find a weak correlation and Azad et al. (2014) find no relationship. Contemporaneous relationship was found by Jennings and Barry (1983); Mahajan and Singh (2008); Chen (2012) and He et al. (2014). Unidirectional causal relationships were found by Moosa and Silvapulle (2000); Mahajan and Singh (2008); Chuang et al. (2009); Chen (2012); He et al. (2014) and Balcilar et al. (2017). Bidirectional causal relationships were found by Chen et al. (2001); Tripathy (2011) and Lin (2013). On the other hand, Saatcioglu and Starks (1998); Lee and Rui (2002) and Gupta et al. (2018) fail to find strong evidence on the causal relationship between price and volume.
Nonlinear causality was found by Llorente et al. (2002); Gündüz and Hatemi-J (2005); Gebka and Wohar (2013); Ciner (2015) and Caginalp and DeSantis (2017) and bidirectional nonlinear causal relationship was found by Hiemstra and Jones (1994); Silvapulle and Choi (1999); Matilla-García et al. (2014).
The review of this section clearly implies the mixed finding on the type of relationship in price volume relationship, although these studies confirm the nonlinear relationship between the price and volume.
The above studies test the relationship between price and volume as a measure of market efficiency. They try to determine whether past volume carries information for the prediction of future prices in line with the assumption of the EMH. This means that these studies do not test the time-varying nature of the price–volume relationship, which is the important implication of the AMH.
The following section focuses on the return predictability and price–volume relationship studies in the context of the AMH.

5.2. Price–Volume Relationship and AMH

Implications of AMH using price–volume relationship has also been tested in the academics in the recent period. Primarily a combination of detrended fluctuation analysis and the detrended cross–correlation analysis (DCCA) is employed to test the relationship between the price and volume in its multifractal nature.
MFDFA-DCCA Approach Ferreira (2019) study Portuguese market and find negative correlations for listed firms. Hasan and Salim (2017) investigate the Indian market for the price–volume cross–correlations and find that cross-correlated price–volume change display low complexity. El Alaoui (2017) find the existence of multifractal price–volume cross-correlations in Moroccan stock market. Ruan et al. (2016) study the time-varying efficiency in the Chinese gold market and find the cross-correlations to be anti-persistent in general. Sukpitak and Hengpunya (2016) find a weak correlation between market efficiency and trading volume in the Thai market. Wang et al. (2013) study Chinese Index Futures market and find that returns and trading volumes are long-range cross-correlated. He and Chen (2011) investigate Chinese market for nonlinear bivariate dependency and show the nonlinear dependency in cross-correlations between price and volume. Podobnik et al. (2009) investigate power-law cross-correlation using DCCA and find no cross-correlation between price and volume.
Other Approaches Wang et al. (2018) used dependence switching copula model and showed asymmetric return-volume dependence. Khuntia and Pattanayak (2018) studied the bitcoin market using Consistent test and GS test. They found that trade volume has explanatory power in the volatility of returns during bearish or bullish markets, but find no effect during the normal period. They documented the long memory in the volatility of return is adaptive.
Stošić et al. (2015) study 13 stock market indices by employing MF-DFA and MF-DXA approach and find that small fluctuations dominate the multifractal behaviour of the volume changes, while large fluctuations dominate price changes. They also found anti-persistent long-term cross-correlations between price and volume changes.

6. Research Gap

Earlier studies confirm the multifractal nature of price–volume relationship but are inconclusive about the exact cross–correlations between price and volume. Some papers show negative, some show weak correlation and some show no cross–correlation between price and volume. A few papers have studied the long-term cross-correlations between price and volume, finding asymmetric relationship. While studies in the classical EMH have confirmed the nonlinear relationship between the price and volume, authors find only one paper studying the nonlinear cross-correlation relationship between price and volume in the AMH domain. From the practitioner’s perspective, it will be important to know the behaviour of these cross-correlations under different market conditions. Previous studies have not investigated such a nonlinear cross-correlation between price and volume during bullish/bearish versus normal period. Therefore, it will be interesting to study the nonlinear price–volume cross–correlations under different market conditions. Also, no previous study has established the asymmetric nature of nonlinear price–volume cross–correlation. Further, it would be interesting to investigate whether the nonlinear cross–correlation holds across different measures of sectoral stock indices within a country and/or across different time scales such as day, week, month, quarter, etc.

7. Conclusions

This paper reviews papers in the weak-form of market efficiency in the period between 1900 and 2019. Authors find that the results of the papers either support classical or adaptive nature of markets, indicating the EMH or AMH respectively. Extensive studies in return predictability have been conducted for testing the weak-form of market efficiency under both EMH and AMH. The weak-form of efficiency is also studied by testing the price–volume relationship under EMH, but in its adaptive form, very limited studies have been conducted by testing price–volume relationship. The literature lacks the studies in the price–volume relationship in the AMH domain. The adaptive market efficiency studies have been able to confirm that market efficiency is a dynamic concept and varies over time. This review leads to further scope in investigating the nonlinear cross–correlation between price and volume.

Author Contributions

This paper was conceptualized by A.C.P. A.C.P. also prepared the original draft including visualization. S.R. did the supervision and validation of the paper. Both the authors contributed in reviewing and editing. The software support was extended by A.C.P.

Funding

This research received no external funding.

Conflicts of Interest

The authors declare no conflict of interest.

References

  1. Ahmed, Amira Akl. 2014. Evolving and relative efficiency of mena stock markets: Evidence from rolling joint variance ratio tests. Ensayos Revista de Economía (Ensayos Journal of Economics) 33: 91–126. [Google Scholar]
  2. Al-Khazali, Osamah, and Ali Mirzaei. 2017. Stock market anomalies, market efficiency and the adaptive market hypothesis: Evidence from islamic stock indices. Journal of International Financial Markets Institutions and Money 51: 190–208. [Google Scholar] [CrossRef]
  3. Anagnostidis, Panagiotis, Christos Varsakelis, and Christos J. Emmanouilides. 2016. Has the 2008 financial crisis affected stock market efficiency? the case of eurozone. Physica A: Statistical Mechanics and Its Applications 447: 116–28. [Google Scholar] [CrossRef]
  4. Andreou, Elena, Nikitas Pittis, and Aris Spanos. 2001. On modelling speculative prices: The empirical literature. Journal of Economic Surveys 15: 187–220. [Google Scholar] [CrossRef]
  5. Azad, A. S. M. Sohel, Saad Azmat, Victor Fang, and Piyadasa Edirisuriya. 2014. Unchecked manipulations, price-volume relationship and market efficiency: Evidence from emerging markets. Research in International Business and Finance 30: 51–71. [Google Scholar] [CrossRef]
  6. Bachelier, Louis. 1900. Théorie de la spéculation. In Annales Scientifiques de l’École Normale Supérieure. Paris: Gauthier-Villars, vol. 17, pp. 21–86. [Google Scholar]
  7. Bacry, Emmanuel, Jean Delour, and Jean-François Muzy. 2001. Modelling financial time series using multifractal random walks. Physica A: Statistical Mechanics and Its Applications 299: 84–92. [Google Scholar] [CrossRef]
  8. Balcilar, Mehmet, Elie Bouri, Rangan Gupta, and David Roubaud. 2017. Can volume predict bitcoin returns and volatility? A quantiles-based approach. Economic Modelling 64: 74–81. [Google Scholar] [CrossRef]
  9. Ball, Ray. 1978. Anomalies in relationships between securities’ yields and yield-surrogates. Journal of Financial Economics 6: 103–26. [Google Scholar] [CrossRef]
  10. Banz, Rolf W. 1981. The relationship between return and market value of common stocks. Journal of Financial Economics 9: 3–18. [Google Scholar] [CrossRef] [Green Version]
  11. Barkoulas, John T., Christopher F. Baum, and Nickolaos Travlos. 2000. Long memory in the greek stock market. Applied Financial Economics 10: 177–84. [Google Scholar] [CrossRef]
  12. Basu, Sanjoy. 1977. Investment performance of common stocks in relation to their price-earnings ratios: A test of the efficient market hypothesis. The Journal of Finance 32: 663–82. [Google Scholar] [CrossRef]
  13. Beaver, William H. 1981. Market efficiency. The Accounting Review 56: 23. [Google Scholar]
  14. Blume, Lawrence, David Easley, and Maureen O’hara. 1994. Market statistics and technical analysis: The role of volume. The Journal of Finance 49: 153–81. [Google Scholar] [CrossRef]
  15. Brealey, Richard A., Stewart C. Myers, Franklin Allen, and Pitabas Mohanty. 2011. Principles of Corporate Finance, 10th ed. New York: McGraw-Hill/Irwin. [Google Scholar]
  16. Caginalp, Gunduz, and Mark DeSantis. 2017. Does price efficiency increase with trading volume? evidence of nonlinearity and power laws in etfs. Physica A: Statistical Mechanics and Its Applications 467: 436–52. [Google Scholar] [CrossRef]
  17. Cajueiro, Daniel O., and Benjamin M. Tabak. 2004. The hurst exponent over time: Testing the assertion that emerging markets are becoming more efficient. Physica A: Statistical Mechanics and Its Applications 336: 521–37. [Google Scholar] [CrossRef]
  18. Campbell, John Y., John J. Champbell, John W. Campbell, Andrew W. Lo, Andrew Wen-Chuan Lo, and Archie Craig MacKinlay. 1997. The Econometrics of Financial Markets. Princeton: Princeton University Press. [Google Scholar]
  19. Campbell, John Y., Sanford J. Grossman, and Jiang Wang. 1993. Trading volume and serial correlation in stock returns. The Quarterly Journal of Economics 108: 905–39. [Google Scholar] [CrossRef]
  20. Charfeddine, Lanouar, and Karim Ben Khediri. 2016. Time varying market efficiency of the gcc stock markets. Physica A: Statistical Mechanics and Its Applications 444: 487–504. [Google Scholar] [CrossRef]
  21. Charles, Amélie, and Olivier Darné. 2009. Variance-ratio tests of random walk: An overview. Journal of Economic Surveys 23: 503–27. [Google Scholar] [CrossRef]
  22. Charles, Amélie, Olivier Darné, and Jae H. Kim. 2017. Adaptive markets hypothesis for islamic stock indices: Evidence from dow jones size and sector-indices. International Economics 151: 100–12. [Google Scholar] [CrossRef]
  23. Chen, Gong-Meng, Michael Firth, and Oliver M. Rui. 2001. The dynamic relation between stock returns, trading volume, and volatility. Financial Review 36: 153–74. [Google Scholar] [CrossRef]
  24. Chen, Shiu-Sheng. 2012. Revisiting the empirical linkages between stock returns and trading volume. Journal of Banking and Finance 36: 1781–88. [Google Scholar] [CrossRef]
  25. Cheung, Yin-Wong, and Kon S. Lai. 1995. Practitioners corner: Lag order and critical values of a modified dickey-fuller test. Oxford Bulletin of Economics and Statistics 57: 411–19. [Google Scholar] [CrossRef]
  26. Chordia, Tarun, and Bhaskaran Swaminathan. 2000. Trading volume and cross-autocorrelations in stock returns. The Journal of Finance 55: 913–35. [Google Scholar] [CrossRef]
  27. Chuang, Chia-Chang, Chung-Ming Kuan, and Hsin-Yi Lin. 2009. Causality in quantiles and dynamic stock return–volume relations. Journal of Banking & Finance 33: 1351–60. [Google Scholar]
  28. Ciner, Cetin. 2015. Time variation in systematic risk, returns and trading volume: Evidence from precious metals mining stocks. International Review of Financial Analysis 41: 277–83. [Google Scholar] [CrossRef]
  29. Clark, Peter K. 1973. A subordinated stochastic process model with finite variance for speculative prices. Econometrica 41: 135–55. [Google Scholar] [CrossRef]
  30. Conrad, Jennifer, and Gautam Kaul. 1988. Time-variation in expected returns. Journal of Business 61: 409–25. [Google Scholar] [CrossRef]
  31. Cont, Rama. 2001. Empirical properties of asset returns: Stylized facts and statistical issues. Quantitative Finance 1: 223–36. [Google Scholar] [CrossRef]
  32. Cootner, Paul H. 1962. Stock prices: Ramdom vs. systematic changes. Industrial Management Review (pre-1986) 3: 24. [Google Scholar]
  33. Copeland, Thomas E. 1976. A model of asset trading under the assumption of sequential information arrival. The Journal of Finance 31: 1149–68. [Google Scholar] [CrossRef]
  34. Cornelius, Peter K. 1993. A note on the informational efficiency of emerging stock markets. Review of World Economics 129: 820–28. [Google Scholar] [CrossRef]
  35. Cowles, Alfred. 1933. Can stock market forecasters forecast? Econometrica 1: 309–24. [Google Scholar] [CrossRef]
  36. Crouch, Robert L. 1970. The volume of transactions and price changes on the new york stock exchange. Financial Analysts Journal 26: 104–9. [Google Scholar] [CrossRef]
  37. Daniel, Kent D., David Hirshleifer, and Avanidhar Subrahmanyam. 2001. Overconfidence, arbitrage, and equilibrium asset pricing. The Journal of Finance 56: 921–65. [Google Scholar] [CrossRef]
  38. De Bondt, Werner F. M., and Richard Thaler. 1985. Does the stock market overreact? The Journal of Finance 40: 793–805. [Google Scholar] [CrossRef]
  39. De Bondt, Werner P. M. 1993. Betting on trends: Intuitive forecasts of financial risk and return. International Journal of Forecasting 9: 355–71. [Google Scholar] [CrossRef]
  40. De Long, J. Bradford, Andrei Shleifer, Lawrence H. Summers, and Robert J. Waldmann. 1990. Noise trader risk in financial markets. Journal of Political Economy 98: 703–38. [Google Scholar] [CrossRef]
  41. Degutis, Augustas, and Lina Novickytė. 2014. The efficient market hypothesis: A critical review of literature and methodology. Ekonomika 93: 7–23. [Google Scholar] [CrossRef]
  42. Delcey, Thomas. 2018. Efficient Market Hypothesis, Eugene Fama and Paul Samuelson: A Reevaluation. Discussion Paper hal-01618347. Copenhagen: HAL. [Google Scholar]
  43. Dickey, David A., and Wayne A. Fuller. 1979. Distribution of the estimators for autoregressive time series with a unit root. Journal of the American Statistical Association 74: 427–31. [Google Scholar]
  44. Domínguez, Manuel A., and Ignacio N. Lobato. 2003. Testing the martingale difference hypothesis. Econometric Reviews 22: 351–77. [Google Scholar] [CrossRef]
  45. El Alaoui, Marwane. 2017. Price–volume multifractal analysis of the moroccan stock market. Physica A: Statistical Mechanics and Its Applications 486: 473–85. [Google Scholar] [CrossRef]
  46. Elliott, Graham, Thomas J. Rothenberg, and James H. Stock. 1996. Efficient tests for an autoregressive unit root. Econometrica 64: 813–36. [Google Scholar] [CrossRef]
  47. Emerson, Rebecca, Stephen G. Hall, and Anna Zalewska-Mitura. 1997. Evolving market efficiency with an application to some bulgarian shares. Economics of Planning 30: 75–90. [Google Scholar] [CrossRef]
  48. Epps, Thomas W. 1975. Security price changes and transaction volumes: Theory and evidence. The American Economic Review 65: 586–97. [Google Scholar]
  49. Epps, Thomas W., and Mary Lee Epps. 1976. The stochastic dependence of security price changes and transaction volumes: Implications for the mixture-of-distributions hypothesis. Econometrica 44: 305–21. [Google Scholar] [CrossRef]
  50. Escanciano, J. Carlos, and Ignacio N. Lobato. 2009. An automatic portmanteau test for serial correlation. Journal of Econometrics 151: 140–49. [Google Scholar] [CrossRef]
  51. Escanciano, J. Carlos, and Carlos Velasco. 2006. Generalized spectral tests for the martingale difference hypothesis. Journal of Econometrics 134: 151–85. [Google Scholar] [CrossRef]
  52. Fakhry, Bachar. 2016. A literature review of the efficient market hypothesis. Turkish Economic Review 3: 431–42. [Google Scholar]
  53. Fama, Eugene F. 1965. The behavior of stock market prices. Journal of Business 38: 34–105. [Google Scholar] [CrossRef]
  54. Fama, Eugene F. 1970. Efficient capital markets: A review of theory and empirical work. The Journal of Finance 25: 383–417. [Google Scholar] [CrossRef]
  55. Fama, Eugene F. 1991. Efficient capital markets: Ii. The Journal of Finance 46: 1575–617. [Google Scholar] [CrossRef]
  56. Fama, Eugene F. 1998. Market efficiency, long-term returns, and behavioral finance. Journal of Financial Economics 49: 283–306. [Google Scholar] [CrossRef]
  57. Fama, Eugene F., and Kenneth R. French. 1988. Dividend yields and expected stock returns. Journal of Financial Economics 22: 3–25. [Google Scholar] [CrossRef]
  58. Fama, Eugene F., and Kenneth R. French. 1995. Size and book-to-market factors in earnings and returns. The Journal of Finance 50: 131–55. [Google Scholar] [CrossRef]
  59. Ferreira, Paulo. 2019. Assessing the relationship between dependence and volume in stock markets: A dynamic analysis. Physica A: Statistical Mechanics and Its Applications 516: 90–97. [Google Scholar] [CrossRef]
  60. Ferson, Wayne E., and Campbell R. Harvey. 1993. The risk and predictability of international equity returns. Review of Financial Studies 6: 527–66. [Google Scholar] [CrossRef]
  61. Gagnon, Louis, and G. Andrew Karolyi. 2009. Information, trading volume, and international stock return comovements: Evidence from cross-listed stocks. Journal of Financial and Quantitative Analysis 44: 953–86. [Google Scholar] [CrossRef]
  62. Gârleanu, Nicolae, and Lasse Heje Pedersen. 2018. Efficiently inefficient markets for assets and asset management. The Journal of Finance 73: 1663–712. [Google Scholar] [CrossRef]
  63. Gebka, Bartosz, and Mark E. Wohar. 2013. Causality between trading volume and returns: Evidence from quantile regressions. International Review of Economics & Finance 27: 144–59. [Google Scholar]
  64. Ghazani, Majid Mirzaee, and Seyed Babak Ebrahimi. 2019. Testing the adaptive market hypothesis as an evolutionary perspective on market efficiency: Evidence from the crude oil prices. Finance Research Letters 30: 60–68. [Google Scholar] [CrossRef]
  65. Gilson, Ronald J., and Reinier H. Kraakman. 1984. The mechanisms of market efficiency. Virginia Law Review 70: 549–644. [Google Scholar] [CrossRef]
  66. Godfrey, Michael D., Clive W. J. Granger, and Oskar Morgenstern. 1964. The random-walk hypothesis of stock market behavior. Kyklos 17: 1–30. [Google Scholar] [CrossRef]
  67. Gozbasi, Onur, Ilhan Kucukkaplan, and Saban Nazlioglu. 2014. Re-examining the turkish stock market efficiency: Evidence from nonlinear unit root tests. Economic Modelling 38: 381–84. [Google Scholar] [CrossRef]
  68. Grossman, Sanford J., and Joseph E. Stiglitz. 1980. On the impossibility of informationally efficient markets. The American Economic Review 70: 393–408. [Google Scholar]
  69. Gündüz, Lokman, and Abdulnasser Hatemi-J. 2005. Stock price and volume relation in emerging markets. Emerging Markets Finance and Trade 41: 29–44. [Google Scholar] [CrossRef]
  70. Gupta, Rakesh, and Junhao Yang. 2011. Testing weak form efficiency in the indian capital market. International Research Journal of Finance and Economics 75: 108–19. [Google Scholar]
  71. Gupta, Suman, Debojyoti Das, Haslifah Hasim, and Aviral Kumar Tiwari. 2018. The dynamic relationship between stock returns and trading volume revisited: A modwt-var approach. Finance Research Letters 27: 91–98. [Google Scholar] [CrossRef]
  72. Harris, Lawrence. 1987. Transaction data tests of the mixture of distributions hypothesis. Journal of Financial and Quantitative Analysis 22: 127–41. [Google Scholar] [CrossRef]
  73. Harris, Milton, and Artur Raviv. 1993. Differences of opinion make a horse race. Review of Financial Studies 6: 473–506. [Google Scholar] [CrossRef]
  74. Hasan, Rashid, and M. Mohammed Salim. 2017. Power law cross-correlations between price change and volume change of indian stocks. Physica A: Statistical Mechanics and Its Applications 473: 620–31. [Google Scholar] [CrossRef]
  75. He, Ling-Yun, and Shu-Peng Chen. 2011. Nonlinear bivariate dependency of price–volume relationships in agricultural commodity futures markets: A perspective from multifractal detrended cross-correlation analysis. Physica A: Statistical Mechanics and Its Applications 390: 297–308. [Google Scholar] [CrossRef]
  76. He, Ling-Yun, and Xing-Chun Wen. 2015. Predictability and market efficiency in agricultural futures markets: A perspective from price–volume correlation based on wavelet coherency analysis. Fractals 23: 1550003. [Google Scholar] [CrossRef]
  77. He, Ling-Yun, Sheng Yang, Wen-Si Xie, and Zhi-Hong Han. 2014. Contemporaneous and asymmetric properties in the price-volume relationships in china’s agricultural futures markets. Emerging Markets Finance and Trade 50: 148–66. [Google Scholar] [CrossRef]
  78. Hiemstra, Craig, and Jonathan D. Jones. 1994. Testing for linear and nonlinear granger causality in the stock price-volume relation. The Journal of Finance 49: 1639–64. [Google Scholar]
  79. Hiremath, Gourishankar S., and Seema Narayann. 2016. Testing the adaptive market hypothesis and its determinants for the indian stock markets. Finance Research Letters 19: 173–80. [Google Scholar] [CrossRef]
  80. Hiremath, Gourishankar S., and Jyoti Kumari. 2014. Stock returns predictability and the adaptive market hypothesis in emerging markets: Evidence from india. SpringerPlus 3: 428. [Google Scholar] [CrossRef]
  81. Horta, Paulo, Sérgio Lagoa, and Luis Martins. 2014. The impact of the 2008 and 2010 financial crises on the hurst exponents of international stock markets: Implications for efficiency and contagion. International Review of Financial Analysis 35: 140–53. [Google Scholar] [CrossRef]
  82. Hull, Matthew, and Frank McGroarty. 2014. Do emerging markets become more efficient as they develop? Long memory persistence in equity indices. Emerging Markets Review 18: 45–61. [Google Scholar] [CrossRef]
  83. Ito, Mikio, Akihiko Noda, and Tatsuma Wada. 2016. The evolution of stock market efficiency in the us: A non-bayesian time-varying model approach. Applied Economics 48: 621–35. [Google Scholar] [CrossRef]
  84. Jarrow, Robert A., and Martin Larsson. 2012. The meaning of market efficiency. Mathematical Finance: An International Journal of Mathematics, Statistics and Financial Economics 22: 1–30. [Google Scholar] [CrossRef]
  85. Jennings, Robert H., and Christopher B. Barry. 1983. Information dissemination and portfolio choice. Journal of Financial and Quantitative Analysis 18: 1–19. [Google Scholar] [CrossRef]
  86. Jensen, Michael C. 1978. Some anomalous evidence regarding market efficiency. Journal of Financial Economics 6: 95–101. [Google Scholar] [CrossRef]
  87. Karpoff, Jonathan M. 1986. A theory of trading volume. The Journal of Finance 41: 1069–87. [Google Scholar] [CrossRef]
  88. Karpoff, Jonathan M. 1987. The relation between price changes and trading volume: A survey. Journal of Financial and Quantitative Analysis 22: 109–26. [Google Scholar] [CrossRef]
  89. Kendall, Maurice George, and A. Bradford Hill. 1953. The analysis of economic time-series-part i: Prices. Journal of the Royal Statistical Society. Series A (General) 116: 11–34. [Google Scholar] [CrossRef]
  90. Khediri, Karim Ben, and Lanouar Charfeddine. 2015. Evolving efficiency of spot and futures energy markets: A rolling sample approach. Journal of Behavioral and Experimental Finance 6: 67–79. [Google Scholar] [CrossRef]
  91. Khuntia, Sashikanta, and J. K. Pattanayak. 2018. Adaptive market hypothesis and evolving predictability of bitcoin. Economics Letters 167: 26–28. [Google Scholar] [CrossRef]
  92. Kiem, Donald B. 1983. Size-related anomalies and stock return seasonality: Further empirical evidence. Journal of Financial Economics 12: 13–32. [Google Scholar] [CrossRef]
  93. Kim, Jae H., Abul Shamsuddin, and Kian-Ping Lim. 2011. Stock return predictability and the adaptive markets hypothesis: Evidence from century-long u.s. data. Journal of Empirical Finance 18: 868–79. [Google Scholar] [CrossRef]
  94. Kim, Jae H. 2009. Automatic variance ratio test under conditional heteroskedasticity. Finance Research Letters 6: 179–85. [Google Scholar] [CrossRef]
  95. Konak, Fatih, and Yasin Şeker. 2014. The efficiency of developed markets: Empirical evidence from ftse 100. Journal of Advanced Management Science 2: 29–32. [Google Scholar] [CrossRef]
  96. Kruse, Robinson. 2011. A new unit root test against estar based on a class of modified statistics. Statistical Papers 52: 71–85. [Google Scholar] [CrossRef]
  97. Kwiatkowski, Denis, Peter C. B. Phillips, Peter Schmidt, and Yongcheol Shin. 1992. Testing the null hypothesis of stationarity against the alternative of a unit root: How sure are we that economic time series have a unit root? Journal of Econometrics 54: 159–78. [Google Scholar] [CrossRef]
  98. Lamoureux, Christopher G., and William D. Lastrapes. 1990. Heteroskedasticity in stock return data: Volume versus garch effects. The Journal of Finance 45: 221–29. [Google Scholar] [CrossRef]
  99. Lee, Bong-Soo, and Oliver M. Rui. 2002. The dynamic relationship between stock returns and trading volume: Domestic and cross-country evidence. Journal of Banking and Finance 26: 51–78. [Google Scholar] [CrossRef]
  100. Lee, Charles, and Bhaskaran Swaminathan. 2000. Price momentum and trading volume. The Journal of Finance 55: 2017–69. [Google Scholar] [CrossRef]
  101. LeRoy, Stephen F. 1973. Risk aversion and the martingale property of stock prices. International Economic Review 14: 436–46. [Google Scholar] [CrossRef]
  102. LeRoy, Stephen F. 1976. Efficient capital markets: Comment. The Journal of Finance 31: 139–41. [Google Scholar] [CrossRef]
  103. LeRoy, Stephen F. 1989. Efficient capital markets and martingales. Journal of Economic Literature 27: 1583–621. [Google Scholar]
  104. LeRoy, Stephen F., and Richard D. Porter. 1981. The present-value relation: Tests based on implied variance bounds. Econometrica 49: 555–74. [Google Scholar] [CrossRef]
  105. Lim, Kian-Ping, and Robert Brooks. 2011. The evolution of stock market efficiency over time: A survey of the empirical literature. Journal of Economic Surveys 25: 69–108. [Google Scholar] [CrossRef]
  106. Lim, Kian-Ping, Weiwei Luo, and Jae H. Kim. 2013. Are us stock index returns predictable? Evidence from automatic autocorrelation-based tests. Applied Economics 45: 953–62. [Google Scholar] [CrossRef]
  107. Lin, Hsin-Yi. 2013. Dynamic stock return-volume relation: Evidence from emerging asian markets. Bulletin of Economic Research 65: 178–93. [Google Scholar] [CrossRef]
  108. Ljung, Greta M., and George E. P. Box. 1978. On a measure of lack of fit in time series models. Biometrika 65: 297–303. [Google Scholar] [CrossRef]
  109. Llorente, Guillermo, Roni Michaely, Gideon Saar, and Jiang Wang. 2002. Dynamic volume-return relation of individual stocks. The Review of Financial Studies 15: 1005–47. [Google Scholar] [CrossRef]
  110. Lo, Andrew W. 1989. Long-Term Memory in Stock Market Prices. Technical Report. Cambridge: National Bureau of Economic Research. [Google Scholar]
  111. Lo, Andrew W. 1991. Long-term memory in stock market prices. Econometrica 59: 1279–313. [Google Scholar] [CrossRef]
  112. Lo, Andrew W. 2004. The adaptive markets hypothesis. Journal of Portfolio Management 30: 15–29. [Google Scholar] [CrossRef]
  113. Lo, Andrew W. 2005. Reconciling efficient markets with behavioral finance: The adaptive markets hypothesis. Journal of Investment Consulting 7: 21–44. [Google Scholar]
  114. Lo, Andrew W. 2012. Adaptive markets and the new world order (corrected may 2012). Financial Analysts Journal 68: 18–29. [Google Scholar] [CrossRef]
  115. Lo, Andrew W., and A. Craig MacKinlay. 1988. Stock market prices do not follow random walks: Evidence from a simple specification test. The Review of Financial Studies 1: 41–66. [Google Scholar] [CrossRef]
  116. Lucas, Robert E., Jr. 1978. Asset prices in an exchange economy. Econometrica: Journal of the Econometric Society 46: 1429–45. [Google Scholar] [CrossRef]
  117. Mahajan, Sarika, and Balwinder Singh. 2008. An empirical analysis of stock price-volume relationship in indian stock market. Vision 12: 1–13. [Google Scholar] [CrossRef]
  118. Malkiel, Burton G. 1989. Efficient market hypothesis. In Finance. Edited by John Eatwell, Murray Milgate and Peter Newman. London: The New Palgrave. Palgrave Macmillan, pp. 127–34. [Google Scholar]
  119. Malkiel, Burton G. 2003. The efficient market hypothesis and its critics. Journal of Economic Perspectives 17: 59–82. [Google Scholar] [CrossRef]
  120. Malkiel, Burton G. 2005. Reflections on the efficient market hypothesis: 30 years later. Financial Review 40: 1–9. [Google Scholar] [CrossRef]
  121. Mandelbrot, Benoit B., Adlai J. Fisher, and Laurent E. Calvet. 1997. A Multifractal Model of Asset Returns. Cowles Foundation Discussion Paper 1164, Sauder School of Business Working Paper. Amsterdam: Elsevier, November. [Google Scholar]
  122. Matilla-García, Mariano, Manuel Ruiz Marín, and Mohammed I. Dore. 2014. A permutation entropy based test for causality: The volume-stock price relation. Physica A: Statistical Mechanics and Its Applications 398: 280–88. [Google Scholar] [CrossRef]
  123. Milionis, Alexandros E. 2007. Efficient capital markets: A statistical definition and comments. Statistics & Probability Letters 77: 607–13. [Google Scholar]
  124. Milionis, Alexandros E., and Demetrios Moschos. 2000. On the validity of the weak–form efficient markets hypothesis applied to the london stock exchange: comment. Applied Economics Letters 7: 419–21. [Google Scholar] [CrossRef]
  125. Moosa, Imad A., and Param Silvapulle. 2000. The price-volume relationship in the crude oil futures market some results based on linear and nonlinear causality testing. International Review of Economics and Finance 9: 11–30. [Google Scholar] [CrossRef]
  126. Nasiri, Sina, Eralp Bektas, and G. Reza Jafari. 2018. The impact of trading volume on the stock market credibility: Bohmian quantum potential approach. Physica A: Statistical Mechanics and Its Applications 512: 1104–12. [Google Scholar] [CrossRef]
  127. Neely, Christopher J., Paul A. Weller, and Joshua M. Ulrich. 2009. The adaptive markets hypothesis: Evidence from the foreign exchange market. Journal of Financial and Quantitative Analysis 44: 467–88. [Google Scholar] [CrossRef]
  128. Ng, Serena, and Pierre Perron. 2001. Lag length selection and the construction of unit root tests with good size and power. Econometrica 69: 1519–54. [Google Scholar] [CrossRef]
  129. Noda, Akihiko. 2016. A test of the adaptive market hypothesis using a time-varying ar model in japan. Finance Research Letters 17: 66–71. [Google Scholar] [CrossRef]
  130. O’Hara, Maureen. 2003. Presidential address: Liquidity and price discovery. The Journal of Finance 58: 1335–54. [Google Scholar] [CrossRef]
  131. Osborne, Maury F. M. 1959. Brownian motion in the stock market. Operations Research 7: 145–73. [Google Scholar] [CrossRef]
  132. Pesaran, M. Hashem, and Allan Timmermann. 1995. Predictability of stock returns: Robustness and economic significance. The Journal of Finance 50: 1201–28. [Google Scholar] [CrossRef]
  133. Phillips, Peter C. B., and Pierre Perron. 1988. Testing for a unit root in time series regression. Biometrika 75: 335–46. [Google Scholar] [CrossRef]
  134. Podobnik, Boris, Davor Horvatic, Alexander M. Petersen, and H. Eugene Stanley. 2009. Cross-correlations between volume change and price change. Proceedings of the National Academy of Sciences of the United States of America 106: 22079–84. [Google Scholar] [CrossRef] [PubMed]
  135. Poterba, James M., and Lawrence H. Summers. 1988. Mean reversion in stock prices: Evidence and implications. Journal of Financial Economics 22: 27–59. [Google Scholar] [CrossRef]
  136. Rizvi, Syed Aun R., and Shaista Arshad. 2017. Analysis of the efficiency–integration nexus of japanese stock market. Physica A: Statistical Mechanics and Its Applications 470: 296–308. [Google Scholar] [CrossRef]
  137. Roberts, Harry V. 1967. Statistical versus Clinical Prediction of the Stock Market. Chicago: Centre for Research in Security Prices, University of Chicago, unpublished manuscript. [Google Scholar]
  138. Rockinger, Michael, and Giovanni Urga. 2000. The evolution of stock markets in transition economies. Journal of Comparative Economics 28: 456–72. [Google Scholar] [CrossRef]
  139. Rodriguez, Elsa, Manuel Aguilar-Cornejo, Ricardo Femat, and Jose Alvarez-Ramirez. 2014. Us stock market efficiency over weekly, monthly, quarterly and yearly time scales. Physica A: Statistical Mechanics and Its Applications 413: 554–64. [Google Scholar] [CrossRef]
  140. Ruan, Qingsong, Wei Jiang, and Guofeng Ma. 2016. Cross-correlations between price and volume in Chinese gold markets. Physica A: Statistical Mechanics and Its Applications 451: 10–22. [Google Scholar] [CrossRef]
  141. Rubinstein, Mark. 1975. Securities market efficiency in an arrow-debreu economy. The American Economic Review 65: 812–24. [Google Scholar]
  142. Saatcioglu, Kemal, and Laura T. Starks. 1998. The stock price-volume relationship in emerging stock markets: The case of Latin America. International Journal of Forecasting 14: 215–25. [Google Scholar] [CrossRef]
  143. Samuelson, Paul A. 1965. Proof that properly anticipated prices fluctuate randomly. Industrial Management Review 6: 41–49. [Google Scholar]
  144. Schwert, G. William. 2003. Anomalies and market efficiency. Handbook of the Economics of Finance 1: 939–74. [Google Scholar]
  145. Sensoy, Ahmet, and Benjamin M. Tabak. 2015. Time-varying long term memory in the european union stock markets. Physica A: Statistical Mechanics and Its Applications 436: 147–58. [Google Scholar] [CrossRef]
  146. Sewell, Martin. 2012. The efficient market hypothesis: Empirical evidence. International Journal of Statistics and Probability 1: 164. [Google Scholar] [CrossRef]
  147. Shiller, Robert J. 1981. Do stock prices move too much to be justified by subsequent changes in dividends? American Economic Review 17: 83–104. [Google Scholar]
  148. Shiller, Robert J. 2003. From efficient markets theory to behavioral finance. Journal of Economic Perspectives 71: 421–36. [Google Scholar] [CrossRef]
  149. Silvapulle, Param, and Jong-Seo Choi. 1999. Testing for linear and nonlinear granger causality in the stock price-volume relation: Korean evidence. Quarterly Review of Economics and Finance 39: 59–76. [Google Scholar] [CrossRef]
  150. Simon, Herbert A. 1955. A behavioral model of rational choice. The Quarterly Journal of Economics 69: 99–118. [Google Scholar] [CrossRef]
  151. Smirlock, Michael, and Laura Starks. 1988. An empirical analysis of the stock price-volume relationship. Journal of Banking and Finance 12: 31–41. [Google Scholar] [CrossRef]
  152. Steiger, William. 1964. A Test of Nonrandomness in Stock Price Changes. Cambridge: MIT Press. [Google Scholar]
  153. Stošić, Dusan, Darko Stošić, Tatijana Stošić, and H. Eugene Stanley. 2015. Multifractal properties of price change and volume change of stock market indices. Physica A: Statistical Mechanics and Its Applications 428: 46–51. [Google Scholar]
  154. Sukpitak, Jessada, and Varagorn Hengpunya. 2016. The influence of trading volume on market efficiency: The dcca approach. Physica A: Statistical Mechanics and Its Applications 458: 259–65. [Google Scholar] [CrossRef]
  155. Suominen, Matti. 2001. Trading volume and information revelation in stock market. Journal of Financial and Quantitative Analysis 36: 545–65. [Google Scholar] [CrossRef]
  156. Tauchen, George E., and Mark Pitts. 1983. The price variability-volume relationship on speculative markets. Econometrica: Journal of the Econometric Society 51: 485–505. [Google Scholar] [CrossRef]
  157. Timmermann, Allan, and Clive W. J. Granger. 2004. Efficient market hypothesis and forecasting. International Journal of Forecasting 20: 15–27. [Google Scholar] [CrossRef]
  158. Ţiţan, Alexandra Gabriela. 2015. The efficient market hypothesis: Review of specialized literature and empirical research. Procedia Economics and Finance 32: 442–49. [Google Scholar] [CrossRef]
  159. Tiwari, Aviral Kumar, Goodness C. Aye, and Rangan Gupta. 2019. Stock market efficiency analysis using long spans of data: A multifractal detrended fluctuation approach. Finance Research Letters 28: 398–411. [Google Scholar] [CrossRef]
  160. Todea, Alexandru, Adrian Zoicas-Ienciu, and Angela-Maria Filip. 2009. Profitability of the moving average strategy and the episodic dependencies: Empirical evidence from european stock markets. European Research Studies Journal 12: 63–72. [Google Scholar]
  161. Tranfield, David, David Denyer, and Palminder Smart. 2003. Towards a methodology for developing evidence-informed management knowledge by means of systematic review. British Journal of Management 14: 207–22. [Google Scholar] [CrossRef]
  162. Tripathy, Naliniprava. 2011. The relation between price changes and trading volume: A study in indian stock market. Interdisciplinary Journal of Research in Business 1: 81–95. [Google Scholar]
  163. Tuyon, Jasman, and Zamri Ahmad. 2016. Behavioural finance perspectives on malaysian stock market efficiency. Borsa Istanbul Review 16: 43–61. [Google Scholar] [CrossRef]
  164. Urquhart, Andrew, and Robert Hudson. 2013. Efficient or adaptive markets? evidence from major stock markets using very long run historic data. International Review of Financial Analysis 28: 130–42. [Google Scholar] [CrossRef]
  165. Urquhart, Andrew, and Frank McGroarty. 2016. Are stock markets really efficient? evidence of the adaptive market hypothesis. International Review of Financial Analysis 47: 39–49. [Google Scholar] [CrossRef]
  166. Wang, Dong-Hua, Yuan-Yuan Suo, Xiao-Wen Yu, and Man Lei. 2013. Price–volume cross-correlation analysis of csi300 index futures. Physica A: Statistical Mechanics and Its Applications 392: 1172–79. [Google Scholar] [CrossRef]
  167. Wang, Yudong, Li Liu, and Rongbao Gu. 2009. Analysis of efficiency for shenzhen stock market based on multifractal detrended fluctuation analysis. International Review of Financial Analysis 18: 271–76. [Google Scholar] [CrossRef]
  168. Wang, Yi-Chiuan, Jyh-Lin Wu, and Yi-Hao Lai. 2018. New evidence on asymmetric return–volume dependence and extreme movements. Journal of Empirical Finance 45: 212–27. [Google Scholar] [CrossRef]
  169. Wood, Robert A., Thomas H. McInish, and J. Keith Ord. 1985. An investigation of transactions data for nyse stocks. The Journal of Finance 40: 723–39. [Google Scholar] [CrossRef]
  170. Working, Holbrook. 1934. A random-difference series for use in the analysis of time series. Journal of the American Statistical Association 29: 11–24. [Google Scholar] [CrossRef]
  171. Worthington, Andrew C., and Helen Higgs. 2004. Random walks and market efficiency in european equity markets. Global Journal of Finance and Economics 1: 59–78. [Google Scholar]
  172. Yen, Gili, and Cheng-Few Lee. 2008. Efficient market hypothesis (emh): Past, present and future. Review of Pacific Basin Financial Markets and Policies 11: 305–29. [Google Scholar] [CrossRef]
  173. Zalewska-Mitura, Anna, and Stephen G. Hall. 1999. Examining the first stages of market performance: A test for evolving market efficiency. Economics Letters 64: 1–12. [Google Scholar] [CrossRef]
1.
Delcey (2018) classifies the definition of EMH as ‘Fama’s EMH’ and ‘Samuelson’s EMH’. Fama’s EMH is based on the claim that prices reflect economic fundamentals and the prices fluctuate randomly as they converge to fundamental values, while ‘Samuelson’s EMH’ based on the pure random nature of price changes with no regard to fundamental value.
2.
Readers may refer to Emerson et al. (1997); Zalewska-Mitura and Hall (1999); Lo (2004, 2005) to see the development of literature in time-varying market efficiency.
3.
The price–volume relationship is important for four reasons: (a) to get insights into the structure of financial markets (b) combination of price and volume data is useful in understanding the consequences of event studies (c) to understand speculative prices and (d) it has high impact on future contracts
Table 1. Review matrix for return predictability studies.
EMH (Classical)AMH (Adaptive)
Linear autocorrelationBox test—Q, VR test, AQ, AVR, Wild bootstrap AVR and AR-GARCH (Kim 2009; Rockinger and Urga 2000)MF-DFA (rolling subsample), Box test, autocorrelation tests, AQ, VR, AVR, wild bootstrap AVR, time-varying AR model, GARCH-M (Sensoy and Tabak 2015; Tiwari et al. 2019)
Nonlinear autocorrelationGS, Consistent test, Wild bootstrap GS (Gozbasi et al. 2014)MF-DFA, GS test, Consistent test (Khuntia and Pattanayak 2018; Kim et al. 2011)
Linear long memoryR/S, Spectral Regression (Barkoulas et al. 2000)MF-DFA, R/S (Hull and McGroarty 2014)
Nonlinear long memorymodified R/S, ESTAR unit root test (Gozbasi et al. 2014)MF-DFA, Modified R/S analysis (Todea et al. 2009)
Linear unit rootADF, PP, DF-GLS, NP, KPSS or VR test (Konak and Şeker 2014), (Gupta and Yang 2011)
Note: VR = variance ratio, AVR = automatic variance ratio, AQ = automatic portmantau, GS = generalized spectral. R/S = rescaled range, MF-DFA = multifractal detrended fluctuation analysis.
Table 2. Review matrix for price–volume relationship studies.
EMH (Classical)AMH (Adaptive)
Linear ContemporaneousCanonical correlations, linear regression (Chen 2012; He et al. 2014; Lee and Swaminathan 2000)MF-DFA DCCA (rolling subsample), dependence switching copula model, MF-DFA and MF-DXA (Ferreira 2019; Hasan and Salim 2017)
Nonlinear ContemporaneousCanonical correlations, nonlinear regression, GARCH (Chordia and Swaminathan 2000; He et al. 2014)MF-DFA DCCA (rolling subsample), dependence switching copula model, MF-DFA and MF-DXA (Khuntia and Pattanayak 2018)
Linear CausalMODWT-VAR, causality tests based on quantiles, Granger causality, regression with fixed effects (Balcilar et al. 2017; Chordia and Swaminathan 2000; Gupta et al. 2018; Lin 2013)MF-DFA DCCA (rolling subsample), dependence switching copula model, MF-DFA and MF-DXA (Stošić et al. 2015)
Nonlinear CausalRegression with fixed effects, quantile regression, permutation entropy (Caginalp and DeSantis 2017; Hiemstra and Jones 1994; Matilla-García et al. 2014)——
Note MF-DFA = Multifractal Detrended Fluctuation Analysis, DCCA = Detrended Cross Correlational Analysis, also quoted as DXA, MODWT = Maximum Overlap Discrete Wavelet Transform.

