Article

When Does Earnings Management Matter? Evidence across the Corporate Life Cycle for Non-Financial Chinese Listed Companies

1
Department of Management Sciences, COMSATS University Islamabad (Sahiwal Campus), Sahiwal 57000, Pakistan
2
School of Management, Xi’an Jiaotong University, Xi’an 710049, China
3
International Business School, Guangzhou College of South China University of Technology, Guangzhou 510080, China
4
Department of Cybernetics, Economic Informatics, Finance and Accounting, Petroleum-Gas University of Ploiesti, Ploiesti 100680, Romania
*
Author to whom correspondence should be addressed.
J. Risk Financial Manag. 2020, 13(12), 313; https://0-doi-org.brum.beds.ac.uk/10.3390/jrfm13120313
Submission received: 28 October 2020 / Revised: 20 November 2020 / Accepted: 2 December 2020 / Published: 8 December 2020
(This article belongs to the Special Issue Sustainable Development and CSR – Perfect Match?)

Abstract

:
Information availability, firm performance, idiosyncratic volatility and bankruptcy-risk vary across the Corporate Life Cycle (CLC) stages. The purpose of this paper is to examine whether CLC stages explain firm’s propensity to engage in both accrual base and real earning management practices in the context of China. Panel data of 3250 non-financial Chinese listed firms spanning from 2009 to 2018 is used to investigate the proposed relationship. CLC stages were captured through Dickinson’s model, while earnings management is measured by employing both techniques, i.e., accruals-base earnings management and real earnings management. The data were analyzed through Panel data fixed-effects and random-effects techniques. Results reveal that, when compared to shakeout phase, managers’ response to use both earnings management practices is significantly higher during introduction and decline phases, and lower during growth and mature stages of CLC. It suggests that introductory and later-staged firms distort their factual financial information from creditors to obtain loans without strict debt covenants. Our results are robust to alternate measures and specifications. The core contribution of this research is to add a fresh perspective to the CLC research by uncovering its imperative role in influencing the earning management behavior of corporate managers.

Graphical Abstract

1. Introduction

After recent accounting scandals caused the bankruptcy of many large organizations across the world, the efficacy of the control mechanisms and authenticity of the accounting information has been thrown into question. Managers can misuse the powers entrusted by the stakeholders by applying their discretion over accounting numbers (Lazzem and Jilani 2018). This study discusses the Earnings Management (EM, hereafter) phenomena, which has become a very hot topic in the recent decade.
Numerous definitions of EM are available in the literature. However, the most comprehensive and widely used definition is; “Earnings management occurs when managers employ judgment in financial reporting and in structuring transactions to alter financial reports. The motive is either to mislead certain stakeholders about the underlying economic performance of the company or to influence contractual outcomes that depend on the reported accounting numbers” (Healy and Wahlen 1999). Hence, distorting the firm’s actual financial information from stakeholders and influencing credit terms are the key objectives of EM. Managers can adopt an opportunistic approach to manipulate earnings either through Real Earning Management (REM) or through Accrual-based Earning Management (AEM) activities. They can undertake REM activities throughout the fiscal period, however, AEM activity is only possible at the end of a fiscal year but before the issuance of financial reports so as to reflect that the income target has been achieved (Zang 2012).
The notion of corporate life cycle stages is derived from the organizational sciences literature (Hasan and Habib 2017). The theory of CLC postulates that a firm moves through a number of foreseeable phases of development and its structure, capabilities, resources and strategies vary significantly over different phases of firm life cycle (Gray and Ariss 1985; Miller and Friesen 1984). This theory also provides help to the management with some fundamental guidelines, diagnostic tools and parameters for assessing the firms’ transition from one stage to another (Hasan et al. 2015). Recent studies show that CLC is not based on a single firm level element, rather it is a combination of multiple factors, i.e., firms’ external and internal factors, unobservable and observable factors, macro-economic factors and various firm and management related attributes (Hasan and Habib 2017).
CLC is an inherited and time-varying phenomenon which helps to predict a firm’s level of cash holdings, risk-return paradox, capital structure, dividend policy, debt maturity structure, investment criteria and quality of disclosure, among other things (Akbar et al. 2020; Al-Hadi et al. 2016; DeAngelo et al. 2006; Faff et al. 2016; Hasan and Habib 2017; Zhang and Xu 2020). In the context of EM, extant literature suggests that institutional environment, cost of capital, audit quality, financing constraints, diversification and asymmetric information have an effect on the EM practices of the firms (Abad et al. 2018; Alzoubi 2018; An et al. 2016; Farrell et al. 2014; Habib et al. 2019; Rodríguez-Pérez and van Hemmen 2010). Habib and Hasan (2017) also suggested that firm risk taking is higher (lower) during the introduction and decline (growth and maturity) phase of CLC. Drake (2015) argued that tax-avoidance practices are expected to vary over the CLC stages. Hasan et al. (2017) have claimed that CLC stages have significant correlation with tax-avoidance practices. They found that compared to the shake-out stage, introductory and decline (growth and mature) stages have positive (negative) association with corporate tax-avoidance practices. Similar outcomes are proved by (Mangoting and Onggara 2019) in the context of Indonesian manufacturing sector. This suggests that variations in tax-avoidance practices also affect the managers’ attitude towards the EM practices over CLC stages. Moreover, financial distress also has a significant association with EM (Agustia et al. 2020; Ghazali et al. 2015; Habib et al. 2013; Jacoby et al. 2019; Li et al. 2020). This financial distress/bankruptcy risk level varies over different stages of CLC (Akbar et al. 2019). Thus, it is reasonable to posit that managerial EM practices may also respond differently to the varying stages of a firm life cycle. However, no empirical study has been designed to explore the possible effects of corporate life cycle stages on the earnings management behavior of firms. Therefore, the prime objective of present study is to investigate the impact of CLC stages on the EM of sample firms.
The contribution of this study is manifold: first, we provide an extension to the literature on EM determinants by documenting varying managerial opportunistic behavior towards EM practices across the CLC stages. Second, a large number of studies have used only one type of EM (mostly AEM) in their analysis to reach the conclusion. However, to cope up with this deficiency in the extant literature we employ both AEM and REM in the present study. Third, to empirically demonstrate the CLC stages where firms will be more and/or less engaged in both AEM and REM practices is a fairly new topic. Fourth, the contribution of this study may be observed in context of its auxiliary validation of the (Dickinson 2011) measure, which to the best of our knowledge has remained unexplored in this relation. Fifth, our study also contributes to CLC literature by documenting the unique role of CLC to express the cross-sectional variations in EM behaviors. Finally, our research has direct implications for creditors and investors, because investors usually rely on the analyst coverage for growth and mature phased firms, while accounting information becomes more relevant during the earlier and decline phase of firms (Dickinson et al. 2018). Present study recommends that creditors and investors should appraise the EM activities in conjunction with CLC stages.

Why China?

China is the second largest economy of the world and experts forecast that it will achieve the mark of world’s largest economy in the next decade.1 Further, China has become exemplar for all developing countries and it plays a very significant and active role in the global economy (Khan et al. 2018; Zaman and Oehler-Şincai 2019; Erokhin and Gao 2020; Prabhakar and Erokhin 2020; Zaman and Oehler-Şincai 2020). Moreover, the Chinese corporate sector is completely different from the rest of the developed and emerging economies because of the its unique regulatory environment and capital market mechanism (Lan et al. 2013). Khan et al. (2017) have documented that the Chinese financial and legal system is not well developed as compared to other developed countries, which makes the present research more influential and interesting. Furthermore, many listed firms in China are governed and controlled by the local and central governments (Lan et al. 2013). The central government gives subsidies to state-owned firms for meeting the criteria of central government, which might cause the managers to use their incentives on earnings to artificially fulfill standards. In Chinese quoted firms, analysts usually set tough targets for managers and may also impose pressure on firms’ managers (Cang et al. 2014), which in turn ultimately motivates the managers to fabricate earnings in order to meet the analysts’ expectations. Moreover, Morck et al. (2000) document that in emerging economies, including China, stock price movement is synchronous with those of developed countries. This phenomenon enhances the protection of minority shareholders in stock markets of emerging economies. Therefore, EM is considered very common on the mainland (Noronha et al. 2008). For all of these reasons, we believe that China is an interesting case for this research.
The rest of the paper proceeds as follows: literature review and hypothesis development is presented in Section 2; research design is discussed in Section 3; Section 4 presents the univariate and multivariate analysis; and Section 5 concludes the study.

2. Literature Review and Hypothesis Development

CLC theory posits that firms do not follow a static pattern throughout their life. Instead, they formulate and employ various strategies in order to maximize the efficiency of available scare resources at each stage of CLC (Jenkins et al. 2004). Moreover, profitability, earnings persistence, cash-flows volatility, idiosyncratic volatility and the cost of capital also varies across CLC stages (Hasan and Habib 2017; Hribar and Yehuda 2007). Therefore, it would be interesting to explore whether managers’ attitudes toward EM practices also vary across different stages of CLC.
The first CLC stage is the “Introduction stage.” This is also known as the “Start-Up stage” (Habib and Hasan 2017), “existence stage” (Lester and Parnell 2008), “birth stage” (Lippitt and Schmidt 1967) and “entrepreneurial stage” (Quinn and Cameron 1983). This is the time a firm enters in the market and there is high risk and uncertainty in the market (Yoo et al. 2019). The ownership of these firms is usually held by a single individual or very few shareholders (Lester et al. 2003). Jaafar and Halim (2016) contend that at the introduction stage of CLC, firms require higher investment as these firms have more opportunities to invest in projects with Positive Net Present-Value (NPV). However, initially, start-up firms earn low profits and face difficulties in meeting their expenditures; this situation is known as “Death Valley” (Laaksonen and Sipilä 2006). Moreover, introduction firms bear higher costs of debt (Bulan and Yan 2009), high uncertainty of R&D expenditures (Yoo et al. 2019) and bankruptcy risk (Akbar et al. 2019). With regard to AEM, Krishnan et al. (2018) point out that during introduction phases, the amount of accruals will be high, which motivates the managers to exercise their discretion over reported accounting figures. Consistent with resource-based theory Koester et al. (2013) have documented that at the birth stage, firms will allocate and use their resources for its competitive advantage, which may be achieved through aggressive tax planning. Moreover, young firms grow rapidly which makes it difficult to ensure high financial reporting quality (Doyle et al. 2007). The introductory stage also negatively affects the firm reporting quality (Can 2020). Idiosyncratic volatility and uncertainty about cash-flows is also much higher for the new start-ups (Habib and Hasan 2017; Irvine and Pontiff 2009). These factors (low profitability, higher cost of debt, bankruptcy risk, high uncertainty of R&D expenditures, accruals and idiosyncratic volatility, among others) may trigger the managers to use EM tactics to present a better financial picture to the creditors for obtaining loans at a lower cost.
The second CLC stage is the “Growth stage” also known as the “Survival stage” (Lester and Parnell 2008). Growth firms are characterized by new resources, success, development and expansion of business activities (Rautanen 2013). This stage is also defined as a growing phase of an enterprise which is yet to attain maturity. Growth firms are usually more structured in operations and decentralized in the decision-making process as compared to the introduction phase. At this stage, the debt ratio starts deteriorating (Bulan and Yan 2009), and sales-volume and market share expands considerably (Bender 2013; Mokhova and Zinecker 2013), even though these firms have a lower level of assets but still have meaningful market value (Paul Hribar and Yehuda 2015). Moreover, compared to new entrants, growth firms have higher sales growth, higher profit ratios and less asymmetric information (Akbar et al. 2019). Besides, growth firms are promising and have less uncertainty about cash flows (Dickinson 2011; Spence 1979). Although these firms have positive financing cash flow, they still need loans to fuel rapid expansion (Krishnan et al. 2018) and receive much analyst coverage which reduces the mispricing and uncertainty issues (Hasan and Habib 2017). However, at the growth phase, firms may have more concerns about their reputation, while tax aggressiveness may badly affect the reputation of the firm (Vacca et al. 2020) which in turn ultimately dampens the managers involvement in tax-avoidance practices at this phase (Austin and Wilson 2015; Graham et al. 2014; Hasan et al. 2017). This stage also increases the demand for accountability and transparency from the firm in order to seek additional external financings (Habib and Hasan 2019). Further, through the visibility hypothesis, (Hamers et al. 2016) have documented that analyst following is much greater in the growth stage as compared other CLC stages, which might dampen the managers’ involvement in EM tactics. Krishnan et al. (2018) also assert that growth firms exhibit proper internal control and monitoring mechanisms and consequently a higher financial reporting quality. These arguments indicate that less information asymmetry, higher internal cash-flow generation and analyst coverage, lower demand of external financing and strict internal control mechanisms restrict managers from engaging in EM practices.
The third stage of CLC is the “Mature stage” also known as the “Formalization and Control stage” (Quinn and Cameron 1983). This is the time when competition becomes fierce and business expansion and profits are stagnant (Yoo et al. 2019). Mature firms are considered to be highly stable, large, rich and profitable as compared to the growth phase (Bulan and Yan 2010). Hasan et al. (2015) state that mature firms enjoy their presence in the market for a longer time period when compared to earlier phases, therefore these firms are followed more keenly by analysts. At the mature phase, firms have greater access toward the resources (such as expertise), which implies that management have much more concerns for efficiently managing its core operations instead of tax-avoidance practices (Agyei et al. 2020; Koester et al. 2013). At this stage, firms are interested in sustaining what they have already accomplished instead of exploring new opportunities. Consequently, these firms do not require much of the debt financing, even though they are able to get loans at lower rate (Bulan and Yan 2009). Besides, mature firms have higher fixed assets, less uncertainty, more growth opportunities and less asymmetric information problems (Suberi et al. (2012). Furthermore, at this stage, cash-flows from operations and earnings level become positive (Hasan and Habib 2017; Paul Hribar and Yehuda 2015). In addition, O’Connor and Byrne (2015) reveal that at the mature stage, firms have a better ranking in governance activities and are also more accountable and transparent as compared to other CLC stages. Zadband and Omrani (2014) also documented that at maturity stage firms reveal the highest level of reporting quality. Further, a recent study has concluded that during the maturity phase the firm’s disclosure narrative is less ambiguous, less complex and much more optimistic (Bakarich et al. 2019). Therefore, based on these arguments, we expect that the mature stage stifles the managerial involvement in EM practices.
The fourth CLC stage is the “Shake-Out stage” also known as the “Renewal phase” (Lester and Parnell 2008) and “Revival phase” (Miller and Friesen 1984). This stage arises when competitors with lower market share begin to leave the market, which intensifies the competition among strong competitors (Carroll 1985; Karniouchina et al. 2013). Theoretically, the shake-out stage is characterized by a tough business environment due to increased uncertainty between the Mature and Terminal stage (Dickinson 2011). At this stage, sales volume tends to decline, thus firms are forced to boost innovation-related activities to attain stability (Mangoting and Onggara 2019). On the contrary, (Dickinson 2011) posits that during the shake-out stage of the life cycle, firm size increases. (1985) states that the number of products produced by the firm starts to decline which causes a further reduction in product prices. Further, in the shake-out stage, reduced monitoring level leads to an increase in after tax cash-flows, which may provide incentive for managers to actively avail the tax-avoidance practices (Richardson et al. 2015). Although many researchers have discussed the shake-out phase, because of competing arguments the true nature of this stage is still unclear. Therefore, by following (Hasan et al. 2015; Wang et al. 2020) we use this stage as a benchmark to interpret the findings of other CLC stages.
The last stage of CLC is the “Decline stage” (Dickinson 2011) also referred to as the “Terminal stage”, typically characterized by decreasing earning and sales volume (Paul Hribar and Yehuda 2015) which could trigger the demise of a firm. During the decline phase, board members are usually interested in their personal goals instead of firm related goals (Quinn and Cameron 1983). This is considered the toughest stage that a firm confronts during its life cycle. Bakarich et al. (2019) have concluded that the decline stage firms make more complex and ambiguous disclosures. Dickinson (2011) states that during this stage firms’ growth, cash-flows and profits start to decline, which in turn increase the uncertainty about return on investment, cash-flow volatility and earnings level. Besides, financially troubled decline firms usually face the dilemma of an inadequate internal control system (Doyle et al. 2007). Hence, this stage requires the managers to reflect a stable condition in front of investors (Zamrudah and Salman 2013). Thus, managers of declining firms play with accruals in an attempt to minimize the chances of debt covenant violations (DeFond and Jiambalvo 1994). Edwards et al. (2016) claimed that when firms are financially distressed, they are likely to get involved in tax-avoidance practices due to low liquidity level. In this stage, firms usually pursue more risky projects that could motivate the managers to pursue aggressive tax and financing strategies (Akhtar 2012; Habib and Hasan 2019). Krishnan et al. (2020) observed that violation of the matching principle during the introduction and decline stages leads to more aggressive and conservative recognition of earnings, which results in poor reporting quality. Moreover, these firms tend to escalate investment activities (Habib and Hasan 2017) in an attempt to regain their market share (Dickinson 2011). Decline-staged firms also face higher bankruptcy risk/financial distress (Akbar et al. 2019) and are usually involved in fraudulent reporting activities to conceal their poor performance (Rosner 2003). Based on the above arguments, we expect that managers of declining firms may opportunistically utilize EM practices to get cheap loans and also to portray a stable position in front of stakeholders. Therefore, we hypothesize that:
Compared to the shake-out stage of CLC;
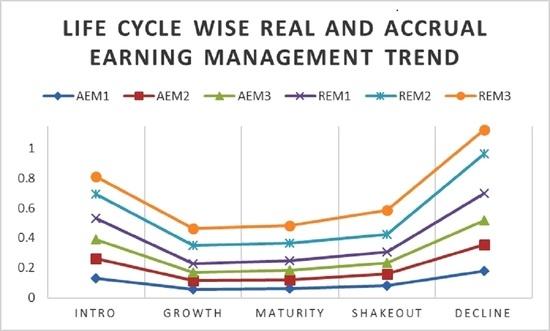
Hypothesis 1 (H1). 
Accruals base EM is higher during introduction and decline stages but lower during the growth and maturity stages.
Hypothesis 2 (H2). 
Real EM is higher during introduction and decline stages but lower during the growth and maturity stages.

3. Research Design

3.1. Sample Selection

The sample of this study consists of all the non-financial Chinese firms listed on Shanghai and Shenzhen stock exchanges over a time span of 10 years (2009 to 2018). We excluded firms with missing data for three consecutive years from our final sample. This practice yielded 3250 firms with 27,019 firm-year observations. In order to remove the potential effect of outliers, we winsorized all the variables at the 1st and 99th percentiles. Consistent with the prior literature (Jiang and Akbar 2018), we excluded the financial sector as the risk, accounting practices and financial characteristics of these firms are different from non-financial firms.

3.2. Variables Measurement

3.2.1. Dependent Variable Measurement: Accrual-Base Earnings Management

In line with the extant literature in this domain (An et al. 2016; Anagnostopoulou and Tsekrekos 2017; Lazzem and Jilani 2018; Wang et al. 2018), we employed the Discretionary Accruals (DAC, hereafter) as a proxy of AEM. Furthermore, in order to prove the robustness of our results, we used three different AEM measures based on Hribar and Collins (2002), Kothari et al. (2005) and Raman and Shahrur (2008) models.
Hribar and Collins (2002) present the following income statement based model to calculate DAC.2
T A i t   / A i t 1   = β 0 ( 1 / A i t 1   ) + β 1 ( Δ R E V i t   / A i t 1   ) + β 2 ( P P E i t   / A i t 1   ) +   i . t
where:
  • T A i t   = Sum of accruals, it is measured by operating income of firm ‘i’ at time ‘t’ minus operating cash flow of firm ‘i’ at time ‘t’.
  • A i t 1   = Beginning level of total assets of firm ‘i’ at time ‘t’.
  • Δ R E V i t   = Change in sales revenues minus change in account receivables of firm ‘i’ at time ‘t’.
  • P P E i t   = It is the sum of fixed assets (plant, property, and equipment) of firm ‘i’ at time ‘t’.
  • i . t = Denotes the residual term and captures the level of discretionary accruals. Therefore, this is the basic proxy for DAC.
Further, Kothari et al. (2005) adjusted the previous model of Hribar and Collins (2002) with performance indicator i.e., ROA (return on assets).
Kothari et al. (2005) proposed the following model:
T A i t   A i t 1   = β 0 ( 1 A i t 1   ) + β 1 ( Δ R E V i t   A i t 1   ) +   β 2 ( P P E i t   A i t 1   ) + β 3 ( R O A i t 1   ) +   i . t
where:
  • R O A i t 1 = The lag value on Return on Asset. ROA is calculated as the net income divided by the total assets of firm ‘i’ at time ‘t’, and other variables are the same as explained in the previous model.
Finally, we measured DAC by employing the newly proposed approach of Raman and Shahrur (2008). They measured the DAC by using a modified jones model which also takes into account the performance indicator (Kothari et al. 2005) and firm growth level.
The Raman and Shahrur (2008) DAC model is mathematically expressed as follows:
T A i t   / A i t 1   = β 0 ( 1 / A i t 1   ) + β 1 ( Δ R E V i t   / A i t 1   ) + β 2 ( P P E i t   / A i t 1   ) + β 3 ( R O A i t 1   ) + β 4 B M i t   +   i . t
where:
  • B M i t = Ratio of total assets of the firm ‘i’ at time ‘t’ to total assets − book value of firm equity + firms market value. The rest of the variables are the same as explained in the first model.
The lagged value of total assets ( A i t 1 ) is used in all of the above three models to eliminate the heteroscedasticity problem from the estimated equations.

3.2.2. Dependent Variable Measurement: Real Earnings Management

Consistent with Cohen and Zarowin (2010) and Zamri et al. (2013), we employed the (Roychowdhury 2006) model to measure the REM practices. Roychowdhury (2006) presents three different metrics to measure the REM practices, namely: abnormal cash-flows from operations (REM_CFO), abnormal production cost (REM_PROD) and abnormal discretionary expenses (REM_DISEXP). He found that managers may take one or all of these three accounting variables to manage the earnings upward: (i) abnormally low cash-flows from operations occur because of offering much relaxed credit policies and heavy sales discount to achieve targeted sales; (ii) abnormally high production cost in order to decrease the CGS that uplift the current operating margins, (iii) abnormally low discretionary expenses because of a reduction in selling, general and administration expenses and R&D expenditures. Thus, to ensure robustness we applied all of these three metrics individually as well as in combined form to investigate the linkage between CLC stages and REM practices. All of these metrics are mathematically expressed as follows:
REM_CFO model:
C F i t   A i t 1 = β 1 ( 1 A i t 1 ) + β 2 ( S a l e s i t A i t 1 ) + β 3 ( Δ S a l e s i t A i t 1 ) +   u i t
where:
  • C F i t = The cash-flow (firm ‘i’ at time ‘t’) from operations.
  • A i t 1 = Level of total assets firm ‘i’ at time t − 1.
  • S a l e s i t = Sales volume of firm ‘i’ at time ‘t’.
  • Δ S a l e s i t = The sale volume of firm ‘i’ at time ‘t’—sales volume of firm ‘i’ at time t − 1.
  • u i t = The residual term, which captures abnormal cash flows level of firm ‘i’ at time ‘t’.
REM_PROD model:
P R O D i t   A i t 1 = β 1 ( 1 A i t 1 ) + β 2 ( S a l e s i t A i t 1 ) + β 3 ( Δ S a l e s i t A i t 1 ) + β 4 ( Δ S a l e s i t 1 A i t 1 ) +   u i t
where:
  • P R O D i t = Sum of CGS (cost of goods sold) and change in level of inventory of firm ‘i’ at time ‘t’.
  • u i t = Residual term, which captures abnormal production cost of firm ‘i’ at time ‘t’.
The rest of the variables are the same as explained in the previous model.
REM_DISEXP model:
D I S E X P i t   A i t 1 = β 1 ( 1 A i t 1 ) + β 2 ( S a l e s i t 1 A i t 1 ) +   u i t
where:
  • D I S E X P i t   = The sum of sales, general and administration expenditures, and research and development expenditures of firm ‘i’ at time ‘t’.
  • u i t = Residual term, which captures abnormal discretionary expenses of firm ‘i’ at time ‘t’.
The rest of the variables are the same as explained in the first model.
REM_COM model:
This comprehensive REM proxy is established by taking the sum of the above three REM metrics (REM_CFO + REM_PROD + REM_DISEXP).
In practice, both AEM and REM residual values are positive and negative, respectively. Though, in line with (An et al. 2016; Doukakis 2014; Lazzem and Jilani 2018; Pappas et al. 2019), we use the absolute form of both EM practices. The major benefit of using absolute value is that it allows us to investigate whether the relationship-specific investment is linked with increased accounting discretions.

3.2.3. Independent Variable: Corporate Life Cycle Stages

CLC stages are the main independent variable of this study. Dickinson (2011) argued that firms consist of overlapped and distinctive CLC stages because of different products offered at varying stages of the product life cycle, which makes it hard to measure the specific stage of CLC. Therefore, following (Chang 2015; Wang et al. 2020), we measured the CLC stages by employing the (Dickinson 2011) model. This model uses cash-flow patterns of a firm to measure the different stages of CLC. The Dickinson (2011) model is based on five stages of CLC: introduction, growth, maturity, shake-out and decline. The benefit of using the (Dickinson 2011) model is that it shows cyclical movements in CLC stages. However, many prior models have used firm age as a measure of CLC stages which makes the model a sequential measure, largely denounced in the real World scenario (Levie and Lichtenstein 2010). The methodology to measure these stages using cash-flow information is described below in Table 1.
Figure 1 exhibits the distribution of sample firms in different stages of CLC using the (Dickinson 2011) model. It shows that 32% of the firms are at the growth stage, 31% at maturity stage, 19% at shake-out stage, 14% at introduction stage, and only 4% firms are at the decline stage of CLC.

3.2.4. Measurement of Control Variables

We incorporated a set of control variables that might have an influence on the managers’ opportunistic behavior toward EM practices as suggested by the previous studies. Wasimullah et al. (2010) and Lazzem and Jilani (2018) both reveal that self-financing ratio (SFR) shows the firms’ capacity to finance its fixed assets by utilizing its internal resources, and found it to be negatively associated with EM practices. Hence, we add SFR as a control variable in our regression models and expect a negative linkage with EM practices. Gunny (2010) and Chen et al. (2010) suggest that profitable firms have an incentive to use EM practices so as to present a rosy picture to the creditors. Therefore, we used Net Profit Margin (NPM) ratio in our regression analysis to control the effects of firms’ profitability. Besides, during the time of higher bankruptcy risk, tangible assets do not lose their market value and thus lower the distress cost, minimize uncertainty about firms’ future performance and reduce the need for managers to engage in EM practices (Pappas et al. 2019). Hence, we add the tangibility ratio in our regression models and expect a negative impact of tangible assets on EM practices, consistent with (An et al. 2016; Pappas et al. 2019). More often, the utility of EM arises when managerial compensations are closely tied to firms’ stock returns (Fields et al. 2018; Li and Zaiats 2017). Thus, to account for this effect we included the variable of yearly stock return (YSTOCKRET) in our regression models and expect it to be positively associated with EM practices of corporate managers.

3.3. Empirical Models

To identify the association between CLC stages and EM practices, we developed the following regression models:
| DAC i ,   t | = β 0 + i = 1 4 β i C L C s t a g e s i , t + β 5 S F R i , t + β 6 N P M i , t + β 7 T a n g i b i l i t y i , t +   β 8 Y S T O C K R E T i , t + u i , t
| REM i ,   t | =   β 0 + i = 1 4 β i C L C s t a g e s i , t + β 5 S F R i , t + β 6 N P M i , t + β 7 T a n g i b i l i t y i , t +   β 8 Y S T O C K R E T i , t + u i , t
where:
  • | D A C | = Absolute value of all three discretionary accrual measures, individually, it is used as a proxy of AEM.
  • | REM | = Absolute value of real earnings management metrics namely: REM_CFO, REM_PROD, REM_DISEXP and REM_COM, respectively.
  • C L C s t a g e s = Vector of dummy variables which represents different corporate life-cycle stages, wherein β 1 ,   β 2 ,   β 3 ,   β 4 represents the introduction, growth, maturity and decline stage of CLC respectively.
  • S F R = Self-financing ratio, calculated as the cash-flow from operations/net fixed assets.
  • N P M = Net profit margin, it is measured as net-income/total sales.
  • T a n g i b i l i t y = Represents the firm’s tangibility level, measured as net PPE ÷ book value of assets.
  • Y S T O C K R E T = Represents the yearly stock return of firm ‘i’ at time ‘t’.
  • u i t = Denotes error term.

4. Empirical Results

4.1. Univariate Analysis

Table 2 reports the descriptive statistics for different AEM and REM measures in absolute value, while Table 3 presents the descriptive statistics for independent and control variables. Numeric figures report that among all the measures of EM practices, the mean value is greater than zero, which confirms the existence of EM practices in Chinese firms.
The mean value of SFR ratio (29.42%) highlights that our sample firms have limited capacity to finance their fixed assets through internal resources. Moreover, the sample has an average NPM of 7.71%, tangibility ratio of 16.85% and yearly stock return of 15.90%.

4.2. Multivariate Analysis

Table 4 entails the correlation matrix of the study variables. We find that all the correlation values are less than + or − (0.70), consistent with the limit proposed by (Kervin 1992).
VIF statistics are presented under Table 5. All the VIF values lie between 1.00 and 1.90, less than the threshold of 5 as recommended by (Ringle et al. 2015). Therefore, we conclude that there is no multicollinearity issue among the study variables.
Recent studies in accounting, especially earnings management and the corporate life cycle, has shown major concerns about the potential endogenous biases. A simple OLS method cannot completely eliminate the endogeneity issue from analysis. Therefore, a move towards individual-specific test (fixed or random) models is necessary in order to confirm which model is more valid to test the proposed hypothesis consistent with following studies on EM (Habib et al. 2019; Kardan et al. 2016; Kim and An 2018; Lazzem and Jilani 2018). For this purpose, we used the Hausman test for determining which model (either fixed or random) provides more consistent results. Based on the Hausman test, we found that in all the regression models, including three for AEM and four for REM practices, the p-value is less than the threshold level 0.05. Thus, the present study uses fixed effects in all models to estimate the regression coefficients.
Further, to verify the absence of random effects through another econometric approach, we performed a Breush-Pagan-Lagrangian Multiplier (BP LM) test. All of the (prob > chibar2) values are greater than 0.05, which allows us not to reject the null hypothesis of the absence of random effects. Consequently, fixed effects are more appropriate to estimate the regression coefficients.
Table 6 reports the results of regression Equation (1), where we regressed three different measures of AEM practices on CLC stages and a set of control variables. We hypothesize that managers’ opportunistic behavior toward AEM increases (decreases) during the introduction and decline (growth and maturity) phases of CLC (H1). Results illustrate that all the three measures of AEM have a positive coefficient (0.0478, 0.0479 and 0.0483) during the introduction phase of CLC, significant at (p < 0.01). It conjectures that managers of introductory firms have an incentive to opportunistically use AEM practices. As argued by (Jaafar and Halim 2016), compared to other phases of CLC, introduction firms require more capital with higher information asymmetry, which motivates the managers to pursue EM practices to obtain loans at favorable rates. The results are also in line with the argument of Krishnan et al. (2020) that at birth stage the amount of accruals is high, which motivates the managers to use their discretions over the earnings. Moreover, consistent with the H1, all the measures of AEM have an insignificant association with growth and mature stages of CLC. It supports the proposition that less asymmetric information, higher analyst coverage, the ability to get loans at lower rates and higher accountability and transparency of growth and mature firms makes EM practices unattractive for the managers. These findings also provide support to the notion that the growth stage increases the demand of accountability and transparency in order to seek additional external financings (Habib and Hasan 2019), and maturity makes the firm disclosure narrative less ambiguous, and much more optimistic (Bakarich et al. 2019); all of these ultimately restrict the managers’ involvement in EM practices. Moreover, these results are also aligned with the findings of (Can 2020), who stated that growth and mature phase positively affects the firm reporting quality.
Furthermore, AEM measures are found to have a positive and statistically significant (p < 0.01) association with decline-stage firms. This positive relationship supports the notion that managers of declining firms require higher financing and also have pressure to portray a stable financial position to the stakeholders (Zamrudah and Salman 2013). Therefore, they opportunistically utilize AEM practices to hide the actual financial condition to obtain loans at favorable terms. Moreover, the coefficients for the decline stage firms (0.0560, 0.0563, and 0.0534) are higher than that of their introductory counterparts (0.0478, 0.0479, and 0.0483) in all three regression models. One plausible explanation of higher coefficient at the decline stage is perhaps with the erosion of business idea and declining sales revenue, managers of these firms tend to try every possible option to escape bankruptcy. In contrast, introductory firms have a bright future ahead with a list of opportunities to invest in positive NPV projects; hence, managers of these firms always undertake new projects with a degree of caution.
With respect to the control variables, Table 6 shows that in all the three models the impact of SFR on AEM is negative and significant (p < 0.01). Similar results were reported by (Lazzem and Jilani 2018; Wasimullah et al. 2010). Though, the profitability indicator NPM has a positive association with AEM practices, significant at (p < 0.01). It reflects that management of profitable firms have an incentive to engage in AEM practices to maintain their credibility in the capital markets and to get loans with favorable conditions in the future (Lazzem and Jilani 2018). As expected, the tangibility measure has a significantly (p < 0.01) negative coefficient with AEM. This indicates that firms with a higher tangibility ratio experience less financial distress, which reduces the firm’s need to engage in AEM practices (Pappas et al. 2019). Finally, the response of YSTOCKRET (yearly stock return) to AEM practices is positive and significant (p < 0.01), suggesting that higher stock returns propel the managers to try out AEM techniques in order to continue the winning streak (Bouwman 2014).
Table 7 presents the results of the estimated regression for Equation (2), where four different measures of REM practices have been regressed on CLC stages in the presence of a list of control variables. The results unveil that the introduction phase has a positive and statistically significant association with three REM measures. It confirms that at the introductory stage, managers have a positive attitude toward the use of REM practices. Doukas and Kan (2004) and Hasan and Habib (2017) observe that in the introduction phase, firms face the dilemma of lower profits, high asymmetric information, higher idiosyncratic volatility and uncertainty about cash-flows, which motivate the managers to practice REM activities. Further, this output also proves that during the birth stage, due to higher uncertainty of R&D expenditures (Yoo et al. 2019), managers may pursue more EM practices. Consistent with H2, growth and mature firms show an insignificant association with REM, except for one measure of REM (REM_CFO) that has a significant yet negative association with the growth firms. It indicates that growth and mature firms have no discretion over their spending levels which lessens the managerial involvement in REM practices (Nagar and Radhakrishnan 2017). Results are also consistent with the (O’Connor and Byrne 2015) study, in that mature stage firms have a better ranking in governance activities and are also much more accountable compared to other CLC stages. Nevertheless, two out of three individuals, as well as combined measures of REM, have a significantly positive association with the decline stage firms, suggesting that managers opportunistically use REM practices to portray a stable financial position to the stakeholders. This proves that due to a weaker information environment, higher idiosyncratic volatility and uncertainty of cash-flows and returns incentivize the managers to manage the earnings through making intervention into accounts which have actual cash-flow consequences. Interestingly, all the CLC stages reveal an insignificant coefficient with the REM_DISEXP model. This supports the proposition that managers of sample firms were unable to cut the discretionary expenses (R&D expenses and selling and administrative expenses) at either stage of CLC to meet the earnings benchmark because these are necessary for firms at each stage for firm future prospects and for making building blocks. Taken together, the results in Table 5 and Table 6 document that compared to the shake-out stage, managers’ behaviors towards both EM practices is higher at the introductory and decline phases and lower at the growth and mature phases.
Regarding control variables, results are highly aligned with the findings of Equation (1).

5. Conclusions

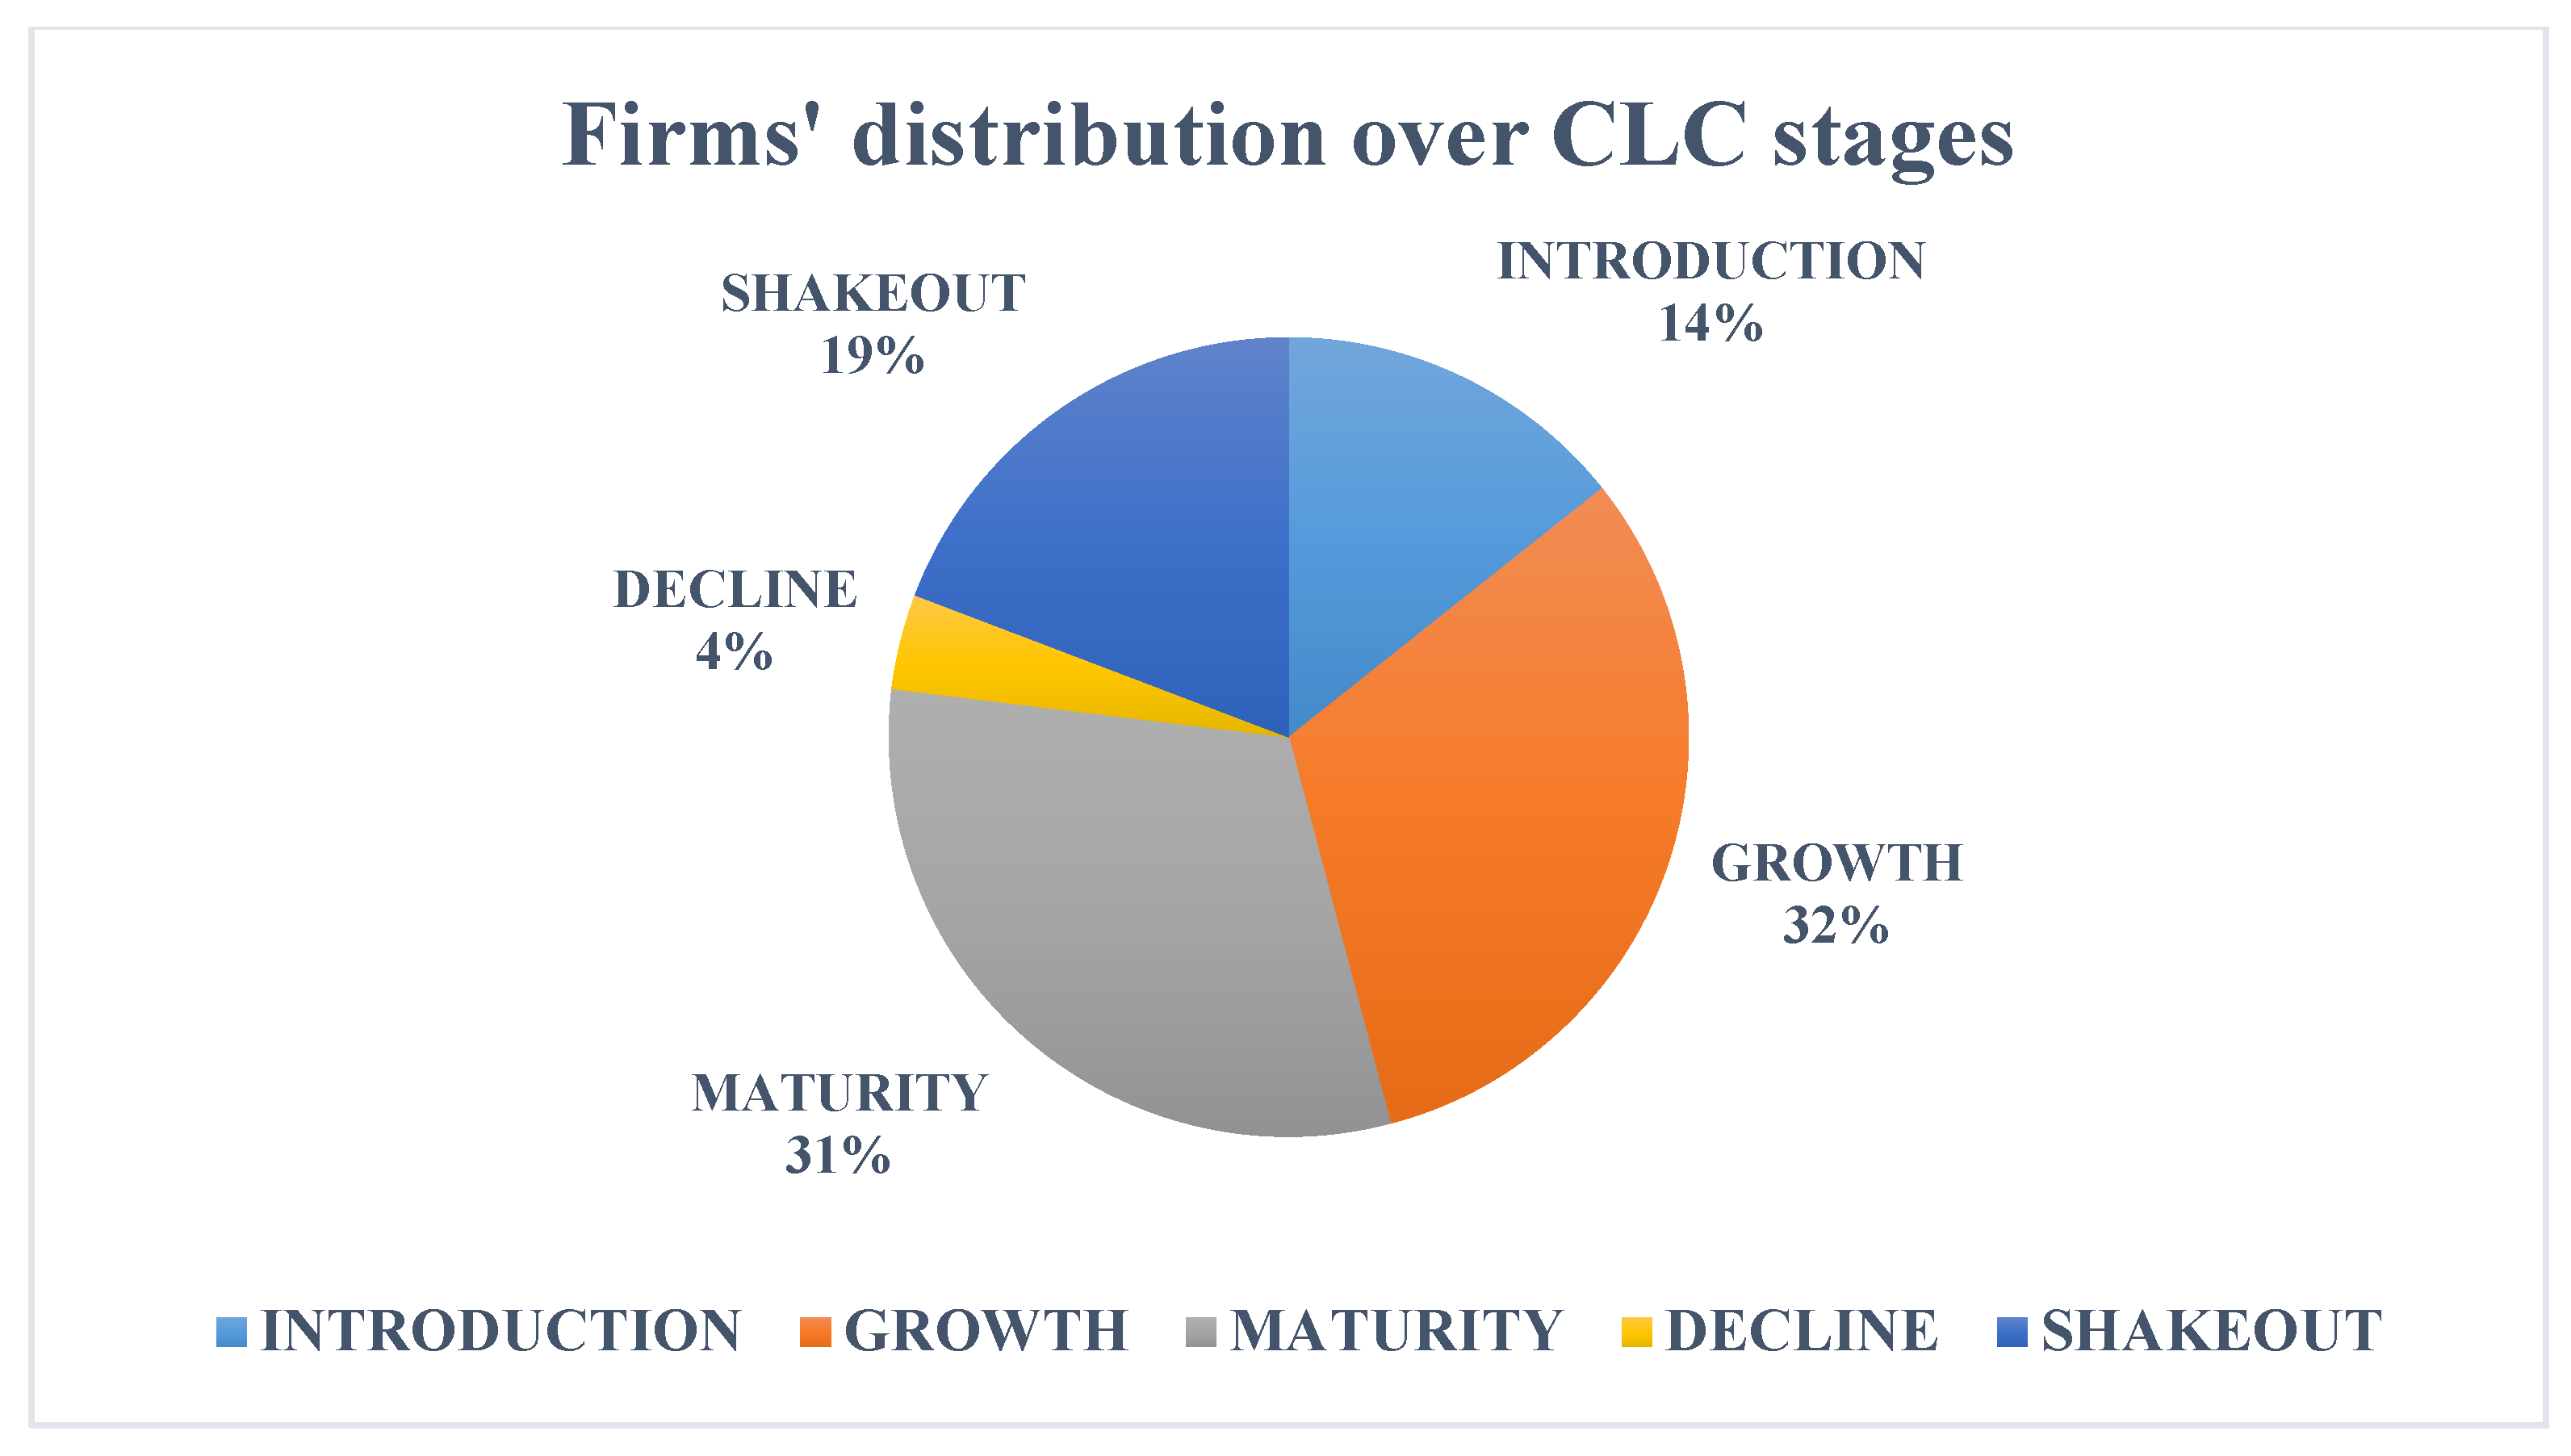
The present study investigates the role of CLC stages in influencing EM practices (AEM and REM). We propose that managers opportunistically change their behavior towards EM practices over different stages of CLC. For this purpose, we employ a large panel of 3250 non-financial Chinese listed firms, with 27,019 firm-year observations and cover the time span from 2009 to 2018. Panel data techniques, such as fixed-effects and random-effects models, have been employed to estimate regression models. The study findings reveal that, during the introduction and decline stages of CLC, managers opportunistically use EM practices to secure cheap loans and portray a stable financial position to the stakeholders. Interestingly, as compared to the introduction stage, managers of declining firms are more inclined to engage in both AEM and REM practices. Moreover, consistent with the proposition, we find that growth and mature firms do not significantly involve in any kind of EM practices, mainly because of the less asymmetric information, higher analyst coverage and ability to get loans at lower rates, as well as higher accountability and transparency of these firms. Last but not least, our results reveal that managers of sample firms were unable to exploit discretionary expenses to manipulate earnings of the firm at any stage of CLC. These findings add a fresh perspective to corporate life cycle research by uncovering the role of the corporate life cycle in influencing the earning management behavior of firm’s managers.
Findings of this study have some important implications for the regulators, creditors and investors of the Chinese listed firms. Tentative managerial behavior during the introduction and decline stages of CLC to engage in EM practices confirms the existence of asymmetric information between investors and the managers of Chinese listed firms. Further, dependability on financial reports for making decisions has always been considered doubtful due to the incorporation of the accruals principle in making financial reports. This grants the possibility of the use of EM tactics to artificially manage the earnings. Thus, the regulators should put in place strict measures to ensure fair reporting and disclosure of financial position of the introductory and decline stage firms. Nevertheless, financial analysts should also give extensive coverage to the financial data of such firms to curb EM practices. Dickinson et al. (2018) argued that investors and creditors are usually interested in relying only on analyst coverage for growth and mature stage firms, while value-relevance of accounting information becomes more relevant at birth and decline staged firms. Therefore, our study recommends that investors should exercise caution while investing in the early and decline stage firms. Likewise, the creditors shall also account for the life cycle stage of the firm before extending credit. Last but not least, if concerned parties of accounting reports observe that managers have access to free cash-flows, then they should enhance their expectations regarding lending their money to firms. Despite the important contribution to the literature on earnings management and CLC, the present study also bears some limitations. First, we only measure the managers’ opportunistic behavior through employing different AEM and REM proxies. Future studies may extend this research by examining the mediating influence of top management’s characteristics such as executive background, gender, age and qualification in the association between EM and CLC. Finally, the findings of this research are only generalizable to countries at a similar stage of corporate development, such as China. Hence, industry- and country-wise investigation of this relationship is needed to validate this association across diverse samples and corporate settings. Given the composition of the research team, future research directions will take into account the group of former communist countries from Central and Eastern Europe that bear some similarities to China’s economy, such as the recent establishment of stock exchanges and reduced financial education of citizens.

Author Contributions

The authors contributed equally to this work. All authors have read and agreed to the published version of the manuscript.

Funding

The author (Muhammad Kaleem Khan) is enormously grateful to the research funding support by China Postdoctoral Science Foundation (#2019M663768).

Conflicts of Interest

The authors declare no conflict of interest.

References

  1. Abad, David, M. Fuensanta Cutillas Gomariz, Juan Pedro Sánchez-Ballesta, and Jose Yagüe. 2018. Real earnings management and information asymmetry in the equity market. European Accounting Review 27: 209–35. [Google Scholar] [CrossRef] [Green Version]
  2. Agustia, Dian, Nur Pratama Abdi Muhammad, and Yani Permatasari. 2020. Earnings management, business strategy, and bankruptcy risk: Evidence from Indonesia. Heliyon 6: 1–9. [Google Scholar] [CrossRef] [PubMed]
  3. Agyei, Samuel Kwaku, Edward Marfo-Yiadom, Abraham Ansong, and Anthony Adu Asare Idun. 2020. Corporate Tax Avoidance Incentives of Banks in Ghana. Journal of African Business 2: 544–59. [Google Scholar] [CrossRef]
  4. Akbar, Ahsan, Minhas Akbar, Wenjin Tang, and M. Azeem Qureshi. 2019. Is Bankruptcy Risk Tied to Corporate Life-Cycle? Evidence from Pakistan. Sustainability 11: 678. [Google Scholar] [CrossRef] [Green Version]
  5. Akbar, Minhas, Ahsan Akbar, Petra Maresova, Minghui Yang, and H. Muhammad Arshad. 2020. Unraveling the Bankruptcy Risk‒Return Paradox across the Corporate Life Cycle. Sustainability 12: 3547. [Google Scholar] [CrossRef]
  6. Akhtar, Shumi. 2012. Capital structure and business cycles. Accounting & Finance 52: 25–48. [Google Scholar]
  7. Al-Hadi, Ahmed, Mostafa Monzur, and Ahsan Habib. 2016. Risk committee, firm life cycle, and market risk disclosures. Corporate Governance: An International Review 24: 145–70. [Google Scholar] [CrossRef]
  8. Alzoubi, Ebraheem Saleem Salem. 2018. Audit quality, debt financing, and earnings management: Evidence from Jordan. Journal of International Accounting, Auditing and Taxation 30: 69–84. [Google Scholar] [CrossRef]
  9. An, Zhe, Donghui Li, and Jin Yu. 2016. Earnings management, capital structure, and the role of institutional environments. Journal of Banking & Finance 68: 131–52. [Google Scholar]
  10. Anagnostopoulou, Seraina C., and Andrianos E. Tsekrekos. 2017. The effect of financial leverage on real and accrual-based earnings management. Accounting and Business Research 47: 191–236. [Google Scholar] [CrossRef]
  11. Austin, Chelsea Rae, and Ryan Wilson. 2015. Are Reputational Costs a Determinant of Tax Avoidance? 2013 American Taxation Association Midyear Meeting: Tax Avoidance in an International Setting. Available online: https://papers.ssrn.com/sol3/papers.cfm?abstract_id=2216879 (accessed on 1 December 2020).
  12. Bakarich, M. Kathleen, Mahumd Hossain, and Joseph Weintrop. 2019. Different time, different tone: Company life cycle. Journal of Contemporary Accounting & Economics 15: 69–86. [Google Scholar]
  13. Bender, Ruth. 2013. Corporate Financial Strategy. Abingdon: Routledge. [Google Scholar]
  14. Bouwman, Christa H. S. 2014. Managerial optimism and earnings smoothing. Journal of Banking & Finance 41: 283–303. [Google Scholar]
  15. Bulan, Laarni, and Zhipeng Yan. 2009. The pecking order of financing in the firm’s life cycle. Banking and Finance Letters 1: 129–40. [Google Scholar]
  16. Bulan, Laarni, and Yan Zhipeng. 2010. Firm Maturity and the Pecking Order Theory. Available online: https://papers.ssrn.com/sol3/papers.cfm?abstract_id=1760505 (accessed on 1 December 2020).
  17. Can, Gökberk. 2020. Do Life Cycles Affect Financial Reporting Quality? Evidence from Emerging Market. Available online: https://papers.ssrn.com/sol3/papers.cfm?abstract_id=3530338 (accessed on 1 December 2020).
  18. Cang, Yongtao, Yiyun Chu, and Thomas W. Lin. 2014. An exploratory study of earnings management detectability, analyst coverage and the impact of IFRS adoption: Evidence from China. Journal of Accounting and Public Policy 33: 356–71. [Google Scholar] [CrossRef]
  19. Carroll, Glenn. 1985. Concentration and specialization: Dynamics of niche width in populations of organizations. American Journal of Sociology 90: 1262–83. [Google Scholar] [CrossRef]
  20. Chang, Hye Sun. 2015. Firm Life Cycle and Detection of Accrual-Based Earnings Manipulation. Ph.D. dissertation, University of Illinois at Urbana-Champaign, Champaign, IL, USA. [Google Scholar]
  21. Chen, Bing-Xuan Lin, Yaping Wang, and Liansheng Wu. 2010. The frequency and magnitude of earnings management: Time-series and multi-threshold comparisons. International Review of Economics & Finance 19: 671–85. [Google Scholar]
  22. Cohen, Daniel, and Paul Zarowin. 2010. Accrual-based and real earnings management activities around seasoned equity offerings. Journal of Accounting and Economics 50: 2–19. [Google Scholar] [CrossRef] [Green Version]
  23. DeAngelo, Harry, Linda DeAngelo, and Rene M. Stulz. 2006. Dividend policy and the earned/contributed capital mix: A test of the life-cycle theory. Journal of Financial Economics 81: 227–54. [Google Scholar] [CrossRef]
  24. DeFond, Mark L., and James Jiambalvo. 1994. Debt covenant violation and manipulation of accruals. Journal of Accounting and Economics 17: 145–76. [Google Scholar] [CrossRef]
  25. Dickinson, Victoria. 2011. Cash flow patterns as a proxy for firm life cycle. The Accounting Review 86: 1969–94. [Google Scholar] [CrossRef]
  26. Dickinson, Victoria, Haimanot Kassa, and Philipp D. Schaberl. 2018. What information matters to investors at different stages of a firm’s life cycle? Advances in Accounting 42: 22–33. [Google Scholar] [CrossRef]
  27. Doukakis, Leonidas C. 2014. The effect of mandatory IFRS adoption on real and accrual-based earnings management activities. Journal of Accounting and Public Policy 33: 551–72. [Google Scholar] [CrossRef]
  28. Doukas, John A., and Ozgur B. Kan. 2004. Excess cash flows and diversification discount. In Financial Management. Hoboken: Wiley, pp. 71–88. [Google Scholar]
  29. Doyle, Jeffrey, Weili Ge, and Sarah McVay. 2007. Determinants of weaknesses in internal control over financial reporting. Journal of Accounting and Economics 44: 193–223. [Google Scholar] [CrossRef]
  30. Drake, Katharine D. 2015. Does Firm Life Cycle Inform the Relation between Book-Tax Differences and Earnings persistence? Available online: https://papers.ssrn.com/sol3/papers.cfm?abstract_id=2547778 (accessed on 1 December 2020).
  31. Edwards, Alexander, Casey Schwab, and Terry Shevlin. 2016. Financial constraints and cash tax savings. The Accounting Review 91: 859–81. [Google Scholar] [CrossRef]
  32. Erokhin, Vasilii, and Tianming Gao. 2020. China and the Eurasian Economic Union: A Future of Agricultural Trade in BRICS+ Format. In Regional Trade and Development Strategies in the Era of Globalization. Pennsylvania: IGI Global, pp. 68–92. [Google Scholar]
  33. Faff, Robert, Wing Chun Kwok, Edward J. Podolski, and George Wong. 2016. Do corporate policies follow a life-cycle? Journal of Banking & Finance 69: 95–107. [Google Scholar]
  34. Farrell, Kathleen, Emre Unlu, and Jin Yu. 2014. Stock repurchases as an earnings management mechanism: The impact of financing constraints. Journal of Corporate Finance 25: 1–15. [Google Scholar] [CrossRef]
  35. Fields, L. Paige, Manu Gupta, Mike Wilkins, and Shage Zhang. 2018. Refinancing pressure and earnings management: Evidence from changes in short-term debt and discretionary accruals. Finance Research Letters 25: 62–68. [Google Scholar] [CrossRef] [Green Version]
  36. Ghazali, Aziatul Waznah, Nur Aima Shafie, and Zuraidah Mohd Sanusi. 2015. Earnings management: An analysis of opportunistic behaviour, monitoring mechanism and financial distress. Procedia Economics and Finance 28: 190–201. [Google Scholar] [CrossRef] [Green Version]
  37. Graham, John A., Michelle Hanlon, Terry Shevlin, and Nemit Shroff. 2014. Incentives for tax planning and avoidance: Evidence from the field. The Accounting Review 89: 991–1023. [Google Scholar] [CrossRef] [Green Version]
  38. Gray, Barbara, and Sony S. Ariss. 1985. Politics and strategic change across organizational life cycles. Academy of Management Review 10: 707–23. [Google Scholar] [CrossRef]
  39. Gunny, Katherine A. 2010. The relation between earnings management using real activities manipulation and future performance: Evidence from meeting earnings benchmarks. Contemporary Accounting Research 27: 855–88. [Google Scholar] [CrossRef]
  40. Habib, Ahan, and Mostafa Monzur Hasan. 2017. Firm life cycle, corporate risk-taking and investor sentiment. Accounting & Finance 57: 465–97. [Google Scholar]
  41. Habib, Ahsan, and Mostafa Monzur Hasan. 2019. Corporate life cycle research in accounting, finance and corporate governance: A survey, and directions for future research. International Review of Financial Analysis 61: 188–201. [Google Scholar] [CrossRef]
  42. Habib, Ahsan, Borhan Uddin Bhuiyan, and Ainel Islam. 2013. Financial distress, earnings management and market pricing of accruals during the global financial crisis. Managerial Finance 39: 156–80. [Google Scholar] [CrossRef]
  43. Habib, Ahsan, Borhan Uddin Bhuiyan, and Mostafa Monzur Hasan. 2019. IFRS adoption, financial reporting quality and cost of capital: A life cycle perspective. Pacific Accounting Review 31: 497–522. [Google Scholar] [CrossRef]
  44. Hamers, Lars, Annelies Renders, and Patrick Vorst. 2016. Firm Life Cycle and Analyst Forecast Behavior. Available online: https://papers.ssrn.com/sol3/papers.cfm?abstract_id=2874845 (accessed on 1 December 2020).
  45. Hasan, Mostafa Monzur, and Ahsan Habib. 2017. Firm life cycle and idiosyncratic volatility. International Review of Financial Analysis 50: 164–75. [Google Scholar] [CrossRef]
  46. Hasan, Mostafa Monzur, Mahmud Hossain, and Ahsan Habib. 2015. Corporate life cycle and cost of equity capital. Journal of Contemporary Accounting & Economics 11: 46–60. [Google Scholar]
  47. Hasan, Mostafa Monzu, Ahmed Al-Hadi, Grantley Taylor, and Grant Richardson. 2017. Does a firm’s life cycle explain its propensity to engage in corporate tax avoidance? European Accounting Review 26: 469–501. [Google Scholar] [CrossRef] [Green Version]
  48. Healy, Paul M., and James M. Wahlen. 1999. A review of the earnings management literature and its implications for standard setting. Accounting Horizons 13: 365–83. [Google Scholar] [CrossRef]
  49. Hribar, Paul, and Daniel W. Collins. 2002. Errors in estimating accruals: Implications for empirical research. Journal of Accounting Research 40: 105–34. [Google Scholar] [CrossRef]
  50. Hribar, Paul, and Nir Yehuda. 2007. Life-Cycle, Cost of Capital, Earnings Persistence and Stock Returns. New York: University of Iowa and Columbia University, Unpublished work. [Google Scholar]
  51. Hribar, Paul, and Nir Yehuda. 2015. The Mispricing of Cash Flows and Accruals at Different Life-Cycle Stages. Contemporary Accounting Research 32: 1053–72. [Google Scholar] [CrossRef]
  52. Irvine, Paul J., and Jeffrey Pontiff. 2009. Idiosyncratic return volatility, cash flows, and product market competition. The Review of Financial Studies 22: 1149–77. [Google Scholar] [CrossRef]
  53. Jaafar, Hartini, and Hazianti Abdul Halim. 2016. Refining the firm life cycle classification method: A firm value perspective. Journal of Economics, Business and Management 4: 112–19. [Google Scholar] [CrossRef]
  54. Jacoby, Gady, Jialong Li, and Mingzhi Liu. 2019. Financial distress, political affiliation and earnings management: The case of politically affiliated private firms. The European Journal of Finance 25: 508–23. [Google Scholar] [CrossRef]
  55. Jenkins, David S., Gregory D. Kane, and Uma Velury. 2004. The impact of the corporate life-cycle on the value-relevance of disaggregated earnings components. Review of Accounting and Finance 3: 5–20. [Google Scholar] [CrossRef]
  56. Jiang, Xinfeng, and Ahsan Akbar. 2018. Does increased representation of female executives improve corporate environmental investment? Evidence from China. Sustainability 10: 4750. [Google Scholar] [CrossRef] [Green Version]
  57. Kardan, Behzad, Mahdi Salehi, and Rahimeh Abdollahi. 2016. The relationship between the outside financing and the quality of financial reporting: Evidence from Iran. Journal of Asia Business Studies 10: 20–40. [Google Scholar] [CrossRef] [Green Version]
  58. Karniouchina, Ekaterina V., Stephen J. Carson, Jeremy C. Short, and David J. Ketchen Jr. 2013. Extending the firm vs. industry debate: Does industry life cycle stage matter? Strategic Management Journal 34: 1010–18. [Google Scholar] [CrossRef]
  59. Kervin, John B. 1992. Methods for Business Research. New York: Harper Collins. [Google Scholar]
  60. Khan, Muhammad Kaleem, Ying He, Umair Akram, and Suleman Sarwar. 2017. Financing and monitoring in an emerging economy: Can investment efficiency be increased? China Economic Review 45: 62–77. [Google Scholar] [CrossRef]
  61. Khan, Muhammad Khalil, Imran Ali Sandano, Cornelius B. Pratt, and Tahir Farid. 2018. China’s belt and road initiative: A global model for an evolving approach to sustainable regional development. Sustainability 10: 4234. [Google Scholar] [CrossRef] [Green Version]
  62. Kim, Sang Ho, and Youhan An. 2018. The effect of ownership-control disparity on the Chinese firm’s real activity earnings management. Pacific Accounting Review 30: 482–99. [Google Scholar] [CrossRef]
  63. Koester, Allison, Terry Shevlin, and Din Wangerin. 2013. Does operational efficiency spill over onto the tax return. Paper Presented at the Tax Symposium 2013, Chapel Hill, NC, USA, January 25–26; pp. 1–49. [Google Scholar]
  64. Kothari, Andrew J. Leone, and Charles E. Wasley. 2005. Performance matched discretionary accrual measures. Journal of Accounting and Economics 39: 163–97. [Google Scholar] [CrossRef]
  65. Krishnan, Gopal V., Emma-Riikka Myllymäki, and Neerav Nagar. 2018. Does Financial Reporting Quality Vary Across Firm Life Cycle? pp. 1–64. Available online: https://papers.ssrn.com/sol3/papers.cfm?abstract_id=3233512 (accessed on 25 October 2018).
  66. Krishnan, Gopal V., Emma-Riikka Myllymäki, and Neerav Nagar. 2020. Does Financial Reporting Quality vary across Firm Life Cycle? Journal of Business Finance and Economics, 1–72. [Google Scholar] [CrossRef]
  67. Laaksonen, Silva, and Heikki Sipilä. 2006. Lyhyen Elinkaaren Omaavien Pk-Yritysten Liiketoiminnan Päättymisen Syyt Espoon ja Kauniaisten Alueella. Laurea Julkaisut B16. Available online: https://www.theseus.fi/bitstream/handle/10024/114671/Laurea%20julkaisut%20B16.pdf?sequence=1 (accessed on 1 December 2020).
  68. Lan, Yang, Lilli Wang, and Xueyong Zhang. 2013. Determinants and features of voluntary disclosure in the Chinese stock market. China Journal of Accounting Research 6: 265–85. [Google Scholar] [CrossRef] [Green Version]
  69. Lazzem, Safa, and Faouzi Jilani. 2018. The impact of leverage on accrual-based earnings management: The case of listed French firms. Research in International Business and Finance 44: 350–58. [Google Scholar] [CrossRef]
  70. Lester, Donald L., and John A. Parnell. 2008. Firm size and environmental scanning pursuits across organizational life cycle stages. Journal of Small Business and Enterprise Development 15: 540–54. [Google Scholar] [CrossRef]
  71. Lester, Donald L., John A. Parnell, and Shawn Carraher. 2003. Organizational life cycle: A five-stage empirical scale. The International Journal of Organizational Analysis 11: 339–54. [Google Scholar] [CrossRef] [Green Version]
  72. Levie, Jonathan, and Banyamin B. Lichtenstein. 2010. A terminal assessment of stages theory: Introducing a dynamic states approach to entrepreneurship. Entrepreneurship Theory and Practice 34: 317–50. [Google Scholar] [CrossRef] [Green Version]
  73. Li, Ting, and Nataliya Zaiats. 2017. Information environment and earnings management of dual class firms around the world. Journal of Banking & Finance 74: 1–23. [Google Scholar]
  74. Li, Yuanhui, Xiao Li, Erwei Xiang, and Hadrian Geri Djajadikerta. 2020. Financial Distress, Internal Control, and Earnings Management: Evidence from China. Journal of Contemporary Accounting & Economics 16: 1–18. [Google Scholar]
  75. Lippitt, Gordon L., and Warren H. Schmidt. 1967. Crises in a developing organization. Harvard Business Review 2: 102–12. [Google Scholar]
  76. Mangoting, Yenny, and Claudia Tysia Onggara. 2019. The Firm Life Cycle Dynamics of Tax Avoidance. Paper presented at the International Conference on Tourism, Economics, Accounting, Management, and Social Science, Bali, Indonesia, October 10–11. [Google Scholar]
  77. Miller, Danny, and Peter H. Friesen. 1984. A longitudinal study of the corporate life cycle. Management Science 30: 1161–83. [Google Scholar] [CrossRef]
  78. Mokhova, Natalia, and Marek Zinecker. 2013. Liquidity, probability of bankruptcy and the corporate life cycle: The evidence from Czech Republic. International Journal of Globalisation and Small Business 5: 189–208. [Google Scholar] [CrossRef]
  79. Morck, Randall, Bernard Yeung, and Wayne Yu. 2000. The information content of stock markets: Why do emerging markets have synchronous stock price movements? Journal of Financial Economics 58: 215–60. [Google Scholar] [CrossRef] [Green Version]
  80. Nagar, Neerav, and Suresh Radhakrishnan. 2017. Firm Life Cycle and Real-Activity Based Earnings Management. Available online: https://papers.ssrn.com/sol3/papers.cfm?abstract_id=2701680 (accessed on 1 May 2017).
  81. Noronha, Carlos, Yun Zeng, and Gerald Vinten. 2008. Earnings management in China: An exploratory study. Managerial Auditing Journal 23: 367–85. [Google Scholar] [CrossRef]
  82. O’Connor, Thomas, and Julie Byrne. 2015. Governance and the corporate life-cycle. International Journal of Managerial Finance 11: 23–43. [Google Scholar] [CrossRef]
  83. Pappas, Kostas, Eamoon Walsh, and Alice Liang Xu. 2019. Real earnings management and Loan Contract terms. The British Accounting Review 51: 373–401. [Google Scholar] [CrossRef]
  84. Prabhakar, Akhilesh Chnadra, and Vasilii Erokhin. 2020. Globalization: Reshaping the World Economy in the 21st Century. In Regional Trade and Development Strategies in the Era of Globalization. Pennsylvania: IGI Global, pp. 1–24. [Google Scholar]
  85. Quinn, Robert E., and Kim Cameron. 1983. Organizational life cycles and shifting criteria of effectiveness: Some preliminary evidence. Management Science 29: 33–51. [Google Scholar] [CrossRef] [Green Version]
  86. Raman, Kartik, and Husayn Shahrur. 2008. Relationship-specific investments and earnings management: Evidence on corporate suppliers and customers. The Accounting Review 83: 1041–81. [Google Scholar] [CrossRef]
  87. Rautanen, Jani. 2013. External Financing during a Company’s Life Cycle. Bachelor’s dissertation, Turku University of Applied Sciences, Turku, Finland; pp. 1–71. [Google Scholar]
  88. Richardson, Grant, Roman Lanis, and Grantley Taylor. 2015. Financial distress, outside directors and corporate tax aggressiveness spanning the global financial crisis: An empirical analysis. Journal of Banking & Finance 52: 112–29. [Google Scholar]
  89. Ringle, Christian M., Sven Wende, and Jan-Michael Becker. 2015. SmartPLS 3. Bönningstedt: SmartPLS. [Google Scholar]
  90. Rodríguez-Pérez, Gonzalo, and Stefan van Hemmen. 2010. Debt, diversification and earnings management. Journal of Accounting and Public Policy 29: 138–59. [Google Scholar] [CrossRef]
  91. Rosner, Rebecca L. 2003. Earnings manipulation in failing firms. Contemporary Accounting Research 20: 361–408. [Google Scholar] [CrossRef]
  92. Roychowdhury, Sugata. 2006. Earnings management through real activities manipulation. Journal of Accounting and Economics 42: 335–70. [Google Scholar] [CrossRef]
  93. Spence, A. Michael. 1979. Investment strategy and growth in a new market. The Bell Journal of Economics 10: 1–19. [Google Scholar] [CrossRef]
  94. Suberi, Adilah Zafria Mohd, Grace Hsu, and Anee Wyatt. 2012. The Relation between Firm Growth and Accounting Quality: A Test of the Life Cycle Hypothesis: Working Paper. Brisbane: University of Queensland, Australia. [Google Scholar]
  95. Vacca, Andrea, Antonio Iazzi, Demitris Vrontis, and Monica Fait. 2020. The Role of Gender Diversity on Tax Aggressiveness and Corporate Social Responsibility: Evidence from Italian Listed Companies. Sustainability 12: 2007. [Google Scholar] [CrossRef] [Green Version]
  96. Wang, Teng-Shih, Yi-Mien Lin, Edward M. Werner, and Hsihui Chang. 2018. The relationship between external financing activities and earnings management: Evidence from enterprise risk management. International Review of Economics & Finance 58: 312–29. [Google Scholar]
  97. Wang, Zanxin, Minhas Akbar, and Ahsan Akbar. 2020. The Interplay between Working Capital Management and a Firm’s Financial Performance across the Corporate Life Cycle. Sustainability 12: 1661. [Google Scholar] [CrossRef] [Green Version]
  98. Wasimullah, I. U. Toor, and Z. Abbas. 2010. Can high leverage control the opportunistic behavior of managers: Case Analysis of textile sector of Pakistan. International Research Journal of Finance and Economics 47: 137–44. Available online: https://www.researchgate.net/publication/287397802_Can_high_leverage_control_the_opportunistic_behavior_of_managers_Case_analysis_of_textile_sector_of_Pakistan (accessed on 1 December 2020).
  99. Yoo, Jiyeon, Sangryul Lee, and Sambock Park. 2019. The effect of firm life cycle on the relationship between R&D expenditures and future performance, earnings uncertainty, and sustainable growth. Sustainability 11: 2371. [Google Scholar]
  100. Zadband, Vahid Khosravi, and Hamed Omrani. 2014. The Effect of Corporate Life Cycle on Financial Reporting Quality Companies Listed in Tehran Stock Exchange. International Journal of Management & Information Technology 9: 1564–71. [Google Scholar]
  101. Zaman, Gheorghe, and Lulia Monica Oehler-Şincai. 2019. Computation of China’s Export Performance. Romanian Journal of Economic Forecasting 22: 1–70. [Google Scholar]
  102. Zaman, Gheorghe, and Lulia Monica Oehler-Şincai. 2020. ESTG BRI: Principles for a Sustainable Belt and Road Initiative. China-CEE Institute Working Paper 9. Hungary: China-CEE Institute, pp. 1–16. [Google Scholar]
  103. Zamri, Norhayati, Rahayu Abduk Rahman, and Noor Saatila Mohd Isa. 2013. The Impact of Leverage on Real Earnings Management. Procedia Economics and Finance 7: 86–95. [Google Scholar] [CrossRef] [Green Version]
  104. Zamrudah, Rikazh, and Riza Kautsar Salman. 2013. Earnings management prediction (a study of company’s life cycle). The Indonesian Accounting Review 3: 107–20. [Google Scholar] [CrossRef]
  105. Zang, Amy Y. 2012. Evidence on the Trade-Off between Real Activities Manipulation and Accrual-Based Earnings Management. The Accounting Review 87: 675–703. [Google Scholar] [CrossRef]
  106. Zhang, Xiaofei, and Longbing Xu. 2020. Firm life cycle and debt maturity structure: Evidence from China. Accounting & Finance, 1–40. [Google Scholar] [CrossRef]
1
2
Sum of accruals is the combination of discretionary and non-discretionary accruals. DAC occur when the manager shows opportunistic behavior towards manipulation of earnings while, non-DAC arise due to the normal activities of firm managers. In other words, DAC are the activities which are undertaken by managers voluntarily in order to notice the earnings manipulation.
In measurements, calculation of total accruals can be done either through direct method (net income − operating cash-flows) or indirect method (assess each component: like depreciation reversal and WCR). In this study we employ the direct approach to measure the DAC, because its superiority, results quality and ease of use, the direct approach is preferable over indirect approach (Hribar and Collins 2002).
Figure 1. Distribution of sample firms in different CLC stages using Dickinson (2011) model.
Jrfm 13 00313 g001
Table 1. Measurement of corporate life cycle stages using Dickinson (2011) model.
CLC Stages
Cash-Flow ActivitiesIntroductionGrowthMaturityDeclineShake-Out
Operating++Any other combination other than prior combinations.
Investing+
Investing+
Financing++− or +
Note: In Table 1, – sign represents the cash-flow values which are less than zero and + represents the cash-flow values which are greater than one.
Table 2. Descriptive Statistics for the Dependent variables (AEM and REM measures).
VariablesMeanStd.DevMin.Max.
|DAC| Hribar and Collins (2002)0.07780.23670.000012.8292
|DAC| Kothari et al. (2005)0.07760.23680.000012.8404
|DAC| Raman and Shahrur (2008)0.07550.21400.000012.8439
|REM_CFO| Roychowdhury (2006)0.07790.23300.000011.8620
|REM_PROD| Roychowdhury (2006)0.13220.69430.000051.0721
|REM_DISEXP| Roychowdhury (2006)0.12620.32870.000018.9045
|REM_COM| Roychowdhury (2006)0.33550.97550.006559.7092
Table 3. Descriptive Statistics for the Independent and Control Variables.
VariablesMeanStd.DevMin.Max.
INTRO0.14340.35050.00001.0000
GROWTH0.31560.46480.00001.0000
MATURITY0.31030.46260.00001.0000
DECLINE0.03850.19240.00001.0000
SHAKEOUT0.19220.39400.00001.0000
SFR0.294218.5344−1047.6100946.6590
NPM0.07711.6017−44.0997109.7490
Tangibility 0.16850.1699−0.68751.0000
YSTOCKRET0.15900.6285−0.71683.2581
Table 4. Correlation Matrix.
No.Variables123456789
1INTRO1.00
2GROWTH−0.281.00
3MATURITY−0.27−0.461.00
4SHAKEOUT−0.20−0.33−0.331.00
5DECLINE−0.08−0.14−0.13−0.101.00
6SFR−0.070.030.050.02−0.111.00
7NPM−0.010.010.000.00−0.010.011.00
8Tangibility−0.120.040.15−0.07−0.09−0.01−0.021.00
9YSTOCKRET−0.030.030.000.00−0.010.010.010.021.00
Table 5. Variance Inflation Factor (VIF) results.
VariablesHribar and Collins (2002)Kothari et al. (2005)Raman and Shahrur (2008)Roychowdhury (2006)Roychowdhury (2006)Roychowdhury (2006)Roychowdhury (2006)
|DAC||DAC||DAC||REM_CFO||REM_PROD||REM_DISEXP||REM_COM|
INTRO1.081.081.081.081.081.081.08
GROW1.371.371.371.371.371.371.37
MATU1.501.501.501.491.501.491.50
DECLI1.021.021.021.021.021.021.02
SFR1.021.021.021.021.021.021.02
NPM1.001.001.001.001.001.001.00
Tangibility1.901.901.911.901.901.901.90
YSTOCKRET1.061.061.061.061.071.061.06
Table 6. H1 Estimations (CLC Stages and AEM Practices).
VariablesHribar and Collins (2002)Kothari et al. (2005)Raman and Shahrur (2008)
|DAC||DAC||DAC|
INTRO0.0478 ***0.0479 ***0.0483 ***
(8.78)(8.80)(8.67)
GROWTH−0.0010−0.00110.0011
(−0.23)(−0.25)(0.23)
MATURITY0.00200.00200.0048
(0.44)(0.43)(1.02)
DECLINE0.0560 ***0.0563 ***0.0534 ***
(6.02)(6.05)(5.61)
SFR−0.0008 ***−0.0008 ***−0.0007 ***
(−9.89)(−9.92)(−8.78)
NPM0.0042 ***0.0042 ***0.0050 ***
(3.60)(3.58)(4.03)
Tangibility −0.0981 ***−0.0989 ***−0.1060 ***
(−5.55)(−5.59)(−5.80)
YSTOCKRET0.0225 ***0.0226 ***0.0222 ***
(10.33)(10.35)(10.00)
Constant 0.0794 ***0.0794 ***0.0794 ***
(16.81)(16.79)(16.33)
R20.10480.1050.0988
Prob > F0.00000.00000.0000
Hausman test P value0.00000.00000.0000
BP LM test P value1.00001.00001.0000
Observations24,11824,11823,415
Group id’s313931393137
t-statistics are informed in parentheses. *** p < 0.01.
Table 7. H2 Estimations (CLC stages and REM Practices).
VariablesRoychowdhury (2006)Roychowdhury (2006)Roychowdhury (2006)Roychowdhury (2006)
|REM_CFO||REM_PROD||REM_DISEXP||REM_COM|
INTRO0.0615 ***0.0338 *0.0005820.0925 ***
(10.68)(1.85)(0.09)(3.73)
GROWTH−0.0093 *0.0242−0.00190.0111
(−1.84)(1.52)(−0.34)(0.51)
MATURITY−0.00630.0090−0.00300.0012
(−1.29)(0.59)(−0.54)(0.06)
DECLINE0.0873 ***0.0743 **0.00680.1700 ***
(8.92)(2.45)(0.62)(4.12)
SFR−0.0006 ***−0.0011 ***−0.0000−0.0017 ***
(−6.95)(−4.48)(−0.12)(−4.97)
NPM0.0025 **0.0020−0.00160.0027
(2.10)(0.56)(−1.23)(0.55)
Tangibility−0.0641 ***−0.1730 ***−0.0792 ***−0.3140 ***
(−3.43)(−2.96)(−3.77)(−3.94)
YSTOCKRET0.0275 ***0.0572 ***0.0308 ***0.118 ***
(11.90)(7.92)(11.83)(12.03)
Constant0.0768 ***0.1330 ***0.1340 ***0.3410 ***
(15.42)(8.42)(23.86)(15.93)
R20.08410.01870.0060.0269
Prob > F0.00000.00000.00000.0000
Hausman p value0.00000.00010.00000.0000
BP-LM test p value1.00001.00001.00001.0000
Observations24,32522,72224,32522,722
Group id’s3140314031403140
t-statistics are informed in parentheses. *** p < 0.01, ** p < 0.05, * p < 0.1.
Publisher’s Note: MDPI stays neutral with regard to jurisdictional claims in published maps and institutional affiliations.

