Digitalization of the EU Economies and People at Risk of Poverty or Social Exclusion


1
The London Academy of Science and Business, 3rd Floor, 120 Baker Street, London W1U 6TU, UK
2
Marketing Department, Sumy State University, 2 Rymskogo Street, 40007 Sumy, Ukraine
3
Institute of Industrial Economics of the NAS of Ukraine, 2 Maria Kapnist Street, 03057 Kyiv, Ukraine
4
Faculty of Organization and Management, Silesian University of Technology, 26–28 Roosevelt Street, 41–800 Zabrze, Poland
*
Author to whom correspondence should be addressed.
J. Risk Financial Manag. 2020, 13(7), 142; https://0-doi-org.brum.beds.ac.uk/10.3390/jrfm13070142
Submission received: 3 June 2020
/
Revised: 21 June 2020
/
Accepted: 30 June 2020
/
Published: 2 July 2020
(This article belongs to the Special Issue Trends in Information Technology)
Abstract
:Despite the fact that a comprehensive analysis of digitalization processes in the EU member states has been carried out, the impact of a country’s digitalization level on the risks of poverty and social exclusion requires further investigation. The purpose of the paper is to verify a hypothesis that a higher level of national digitalization provides positive trends in reducing the risks of poverty and social exclusion for the population. The Digital Economy and Society Index (DESI) was used to evaluate the digitalization levels of the EU countries. The indicator “People at risk of poverty or social exclusion” (AROPE) was applied to estimate the poverty level. As the main research methods, the authors used a comparative and correlation analysis with respect to the above-mentioned indicators, as well as the Monte Carlo method in order to evaluate the probability of a change in the indicator “population at risk of poverty or social exclusion” in 2021. The EU countries with higher digitalization levels have a lower percentage of the population at risk of poverty and social exclusion. However, a higher digitalization level of the EU member states does not provide an accelerated risk reduction of poverty and social exclusion. Statistical calculations with respect to the entire population of these countries mainly indicate reverse processes. At the same time, a further reduction of poverty and social exclusion level is less probable in the countries with a higher level of digitalization. For relatively poor segments of the population (the 1st and 2nd quintiles by income) in the EU member states, the level of digitalization does not play a significant role. For relatively wealthy segments of the population (the 3rd and 4th quintiles by income) the authors noticed a pattern: the higher the level of digitalization is, the lower the risk of poverty and social exclusion becomes. A pairwise comparison of countries with initially similar AROPE values showed that in most cases (3 out of 5), the countries with higher levels of digitalization showed a more significant reduction in poverty and social exclusion. However, the probability of further positive changes in this area is higher for the countries with a lower level of digitalization.
JEL Classification:
O33; I3; C551. Introduction
The development of Industry 4.0 and the formation of a single digital market are among the key items on the EU agenda. The EU is constantly expanding their legal support to stimulate economic activity in these spheres. Over the past ten years, the following has been adopted: “A Digital Agenda for Europe” (EUR-Lex 2010a), “European Broadband: Investing in Digitally Driven Growth” (EUR-Lex 2010b), “Towards a Thriving Data-Driven Economy” (EUR-Lex 2014), “The EU’s New Digital Single Market Strategy” (EUR-Lex 2015), “Building a European Data Economy” (EUR-Lex 2017), “Information Society” (EUR-Lex 2018) “The Age of Artificial Intelligence: Towards a European Strategy for Human-Centric Machines” (European Political Strategy Centre (European Commission 2018)), and other documents.
According to these strategic documents, digitalization has not only economic, but also social benefits. However, not all of the associated social problems have been resolved yet. Poverty still remains as one of the major issues. As of 2018, there are more than 110 million people in the EU-28 who are at risk of poverty or social exclusion (Eurostat 2020b).
Thus, there is a scientific and practical problem concerning the impact of the digitalization level on the EU member states’ population, and especially on that part of population that is at risk of poverty or social exclusion.
In recent years there has been active study of the issues related to the information economy (Aumann and Heifetz 2002; Basile et al. 2009; Brynjolfsson and Saunders 2009; Elsner et al. 2015; Karmarkar and Apte 2007; Кwilinski 2018a, 2018b; Sun et al. 2017; Trushkina 2019; Vyshnevskyi 2019); Industry 4.0 (Backhaus and Nadarajah 2019; Dźwigoł et al. 2020; Korže 2019; Kumar and Kumar 2019; Sanghavi et al. 2019; Lenart-Gansiniec 2019; Vrchota et al. 2020; Vyshnevskyi et al. 2019), artificial intelligence (Hoła et al. 2015; Kuzior et al. 2019; Kwilinski et al. 2019; Miśkiewicz 2019; Shank and Gott 2019; Tkachenko et al. 2019; Wang and Xiu 2019; Zhao et al. 2019), implementation of the digital market (Gupta and Bose 2019; Lutz 2019), and digital exclusion and inclusion (Ragnedda 2018).
According to the results of the above-mentioned studies, the most common viewpoint is that digitalization of the economy has a predominantly positive impact on the socio-economic development of individual regions and countries. However, there are studies that show that “there is no correlation between economic growth (both globally and at the national level) and the processes of ICT technologies development and the governments’ willingness to use AI” (Vyshnevskyi et al. 2019), and, moreover, that “the development of the information society has highlighted the existence of obstacles preventing certain social groups from accessing and properly using technologies” (Ragnedda 2018).
Despite the expected high economic efficiency of digitalization and the observed success at the micro-level, the problems associated with poverty risks remain relevant for the EU (Birau et al. 2019; Jenkins 2019; Kis and Gábos 2016). At the same time, digitalization is not one of the main priority tools used for combating poverty. For instance, social spending is considered to be the main instrument for reducing poverty (Brown and James 2020; Miežienė and Krutulienė 2019; Harrison et al. 2019).
However, a comparison of economic and social indicators (Dalevska et al. 2019) does not take into account the context of digitalization. Thus, the socio-economic efficiency of introducing Industry 4.0 and the formation of a single digital market in the EU has been examined from different perspectives, but the social effectiveness of digitalization remains neglected. More detailed research on digitalization’s social effectiveness is required, which is the purpose of this article.
Based on the results of the literature review, it is possible to formulate a hypothesis that the digitalization level of a country positively affects its socio-economic development; the higher the level of a country’s digitalization is, the lower the risks of poverty and social exclusion are for the population and the dynamics of their negative change. Therefore, the purpose of the article is to test this hypothesis.
This study is focused on the EU, where digitalization processes are actively supported and the problems of relative poverty remain relevant.
2. The Research Tools and Methods
The research methodology is based on comparing the quantitative characteristics of an economy’s digitalization level with its poverty level.
Digitalization of the economy is a complex process. Therefore, there are two alternatives for its description. The first alternative involves exploring a set of different indicators. The second alternative involves the use of existing indexes, which, in turn, are a convolution of a set of indicators. Given that various indexes already exist, one of them was chosen.
To evaluate the digitalization level of the EU countries, the Digital Economy and Society Index (DESI) was used, which is regularly calculated by the European Commission for all the EU member states (European Commission 2019). Unlike other indexes that characterize digitalization processes (for example the ICT Development Index; Digital Adoption Index; UN Global E-Government Development Index; Networked Readiness Index) and are calculated by various international organizations, companies, and research groups for all countries of the world, DESI is compiled exclusively for the EU member states taken as the target group. This ensures maximum consideration of the socio-economic specificity of these EU countries and the relevance of comparing the data obtained.
The DESI structure includes 37 indicators, which describe five dimensions of digitalization: (1) connectivity, (2) human capital, (3) use of internet services, (4) integration of digital technology, (5) digital public services.
A connectivity dimension includes 8 indicators (Table 1). All of them describe access to broadband coverage (fixed and mobile). A higher level of connectivity creates more opportunities for using digital skills, internet services, digital technology, and digital public services.
A human capital dimension includes 6 indicators (Table 2), which are connected with Internet user skills and employment of the ICT specialists. Possession of these skills creates income-generating opportunities that allow people to be outside the poverty zone.
The use of an internet services dimension includes 11 indicators (Table 3), which are connected with frequency of using the internet for online activities and transactions. The use of the internet services does not only create extra ways for earning, but it multiplies social capital and ensures wider opportunities for finding a job.
A dimension of digital technology integration comprises 7 indicators (Table 4), which characterize business and commerce digitalization. This dimension creates opportunities for running your own business more efficiently and increasing the quantity of work places.
A dimension of digital public services includes 5 indicators (Table 5), which characterize the e-Government domain. E-Government allows for businesses to cut costs when they communicate with authorities. This frees up resources to expand business activities.
Most of the indicators examined characterize processes and states that directly or indirectly create conditions for reducing poverty. This is primarily due to the expansion of opportunities for taking online income, business development, and employment in the ICT sector. An indicator of the people at risk of poverty or social exclusion (AROPE) was used to measure poverty. This indicator is regularly calculated by the statistical service of the European Union (Eurostat 2020a, 2020b). It “corresponds to the sum of persons who are either at risk of poverty or severely materially deprived or living in a household with a very low work intensity. Persons are only counted once even if they are present in several sub-indicators. The AROPE rate, the share of the total population who are at risk of poverty or social exclusion, is the headline indicator to monitor the EU 2020 Strategy poverty target” (Eurostat 2020c). AROPE, as well as DESI, is calculated specifically for the EU member states.
In order to test the research hypothesis, DESI and AROPE were compared comprehensively and their dependence was evaluated, which covered the following steps:
- Step 1.
- Countries from the top to the bottom of the sample are compared in terms of digitalization relative to AROPE.
- Step 2.
- SThe general relationships between DESI and AROPE are analyzed.
- Step 3.
- AROPE is compared by income and the level of digitalization in the EU countries.
- Step 4.
- The dynamics of DESI and AROPE changes are compared.
- Step 5.
- The probability of positive changes in AROPE against the background of DESI values is estimated.
- Step 6.
- The dynamics of country pairs with the AROPE close values is compared, taking the average DESI level into account.
The authors used a comparative and correlation analysis with respect to the above-mentioned indicators as the main research method, as well as the Monte Carlo method, in order to estimate the probability of a change in the AROPE indicator in 2021.
3. Results and Discussion
An increase of the digitalization level is a characteristic found in all EU member states. Moreover, the digital dominance (and, accordingly, the backlog) of individual countries is a very stable process. During the observation period (2014–2018), only a few countries moved up or down by several positions. None of the countries moved from the first position to the last or vice versa. The level of autocorrelation with a lag of 1 year is 0.99 and higher.
The initial comparison of the level of digitalization and poverty in the EU (Table 6) suggests that the countries from the TOP-5 (Denmark, Finland, Sweden, the Netherlands, and Luxembourg) have a lower poverty level with digitalization than countries occupying the last five positions (Italy, Poland, Bulgaria, Greece, and Romania). For the former, the percentage of their population at risk of poverty or social exclusion is in the range 16.5–21.8% (on average, 18.1%), and for the latter, the range is 18.4–32.8% (on average, 28.6%).
Consequently, the Spearman’s rank correlation coefficient between the DESI rank and the AROPE indicator has a plus sign throughout the observation period, although the coefficient value decreases over the years (2014: +0.71; 2015: +0.71; 2016: +0.68; 2017: +0.66; 2018: +0.49).
Analyzing the share of people at risk of poverty or social exclusion by income quintile against digitalization (Table 7), we can see the ambiguity of the digitalization role, which depends on the quintile of the population income.
So, in the first quintile by income (20% of the population with the lowest incomes) the group of countries with a low digitalization level (an average rank during the monitoring period from 21 to 28) shows a lower risk of poverty or social exclusion than a group of countries with a medium-high digitalization level (rank 8–14), 86.81% and 86.86%, respectively.
The lowest risk of the population’s poverty or social exclusion occurs in the group of countries with a medium-low level of digitalization–78.16%.
At the same time, the group of countries with a high level of digitalization (ranks 1–7) does not always show a better result than countries with a relatively lower level of digitalization. In this group, 83.03% of the population are at risk of poverty or social exclusion. In the meantime, this value is 78.16% on average in countries with a medium-low level of digitalization (ranks 15–21).
An ambiguous situation also takes place in relation to the 2nd quintile by income. The population of low-digitalized countries is more at risk of poverty and social exclusion (25.44%), and the population of countries with a high level of digitalization is less at risk of poverty and social exclusion (9.74%). However, the population of countries with a medium-high digitalization level has greater risks of poverty and social exclusion than the population of a group of countries with a medium-low digitalization level (14.06% and 11.6%, respectively).
According to the research hypothesis, the logical dynamics occur only for the 3rd and 4th quintiles, where the higher the digitalization level of a group of countries is, the lower the risk is of poverty or social exclusion of their populations.
However, a direct relationship between the risk of poverty and the level of digitalization is not entirely clear, because more economically developed countries have a higher level of digitalization (Micic 2017). Therefore, we can say that the level of economic development, being a key factor, affects both the country’s level of digitalization and the level of poverty. The higher the economic development is, the higher the level of digitalization and the lower the risks of poverty or social exclusion.
Therefore, it is advisable to use other research approaches: (1) to compare progress in digitalization with progress in reducing the risks of poverty or social exclusion; (2) to estimate the probability of poverty reduction; (3) to divide the EU member states into groups according to their level of risks of poverty or social exclusion and to compare the dynamics of these level changes depending on the level of digitalization.
For the period from 2014 to 2018, the change in the countries’ DESI ranking varies from +4 to –3, at the same time ranking varies from −12.7 to +2.8 pp by percentage of the population at risk of poverty and social exclusion (Table 8). The greatest progress in reducing the share of the population according to the AROPE indicator was observed for the countries that moved down one place due to increased digitalization in 5 years and amounted to −9.3 pp. The second most successful country in terms of reducing poverty risks for the population is Ireland (−6.6 percentage points), which moved its digitalization rate up by three places from 11 to 8.
At the same time, Lithuania, which showed the greatest positive change in the DESI index (+4 positions), is among the countries where the situation outlined by the AROPE indicator worsened (+1 pp in 2014–2018). In this case, progress in digitalization has failed to ensure there is progress in the fight against poverty and social discrimination.
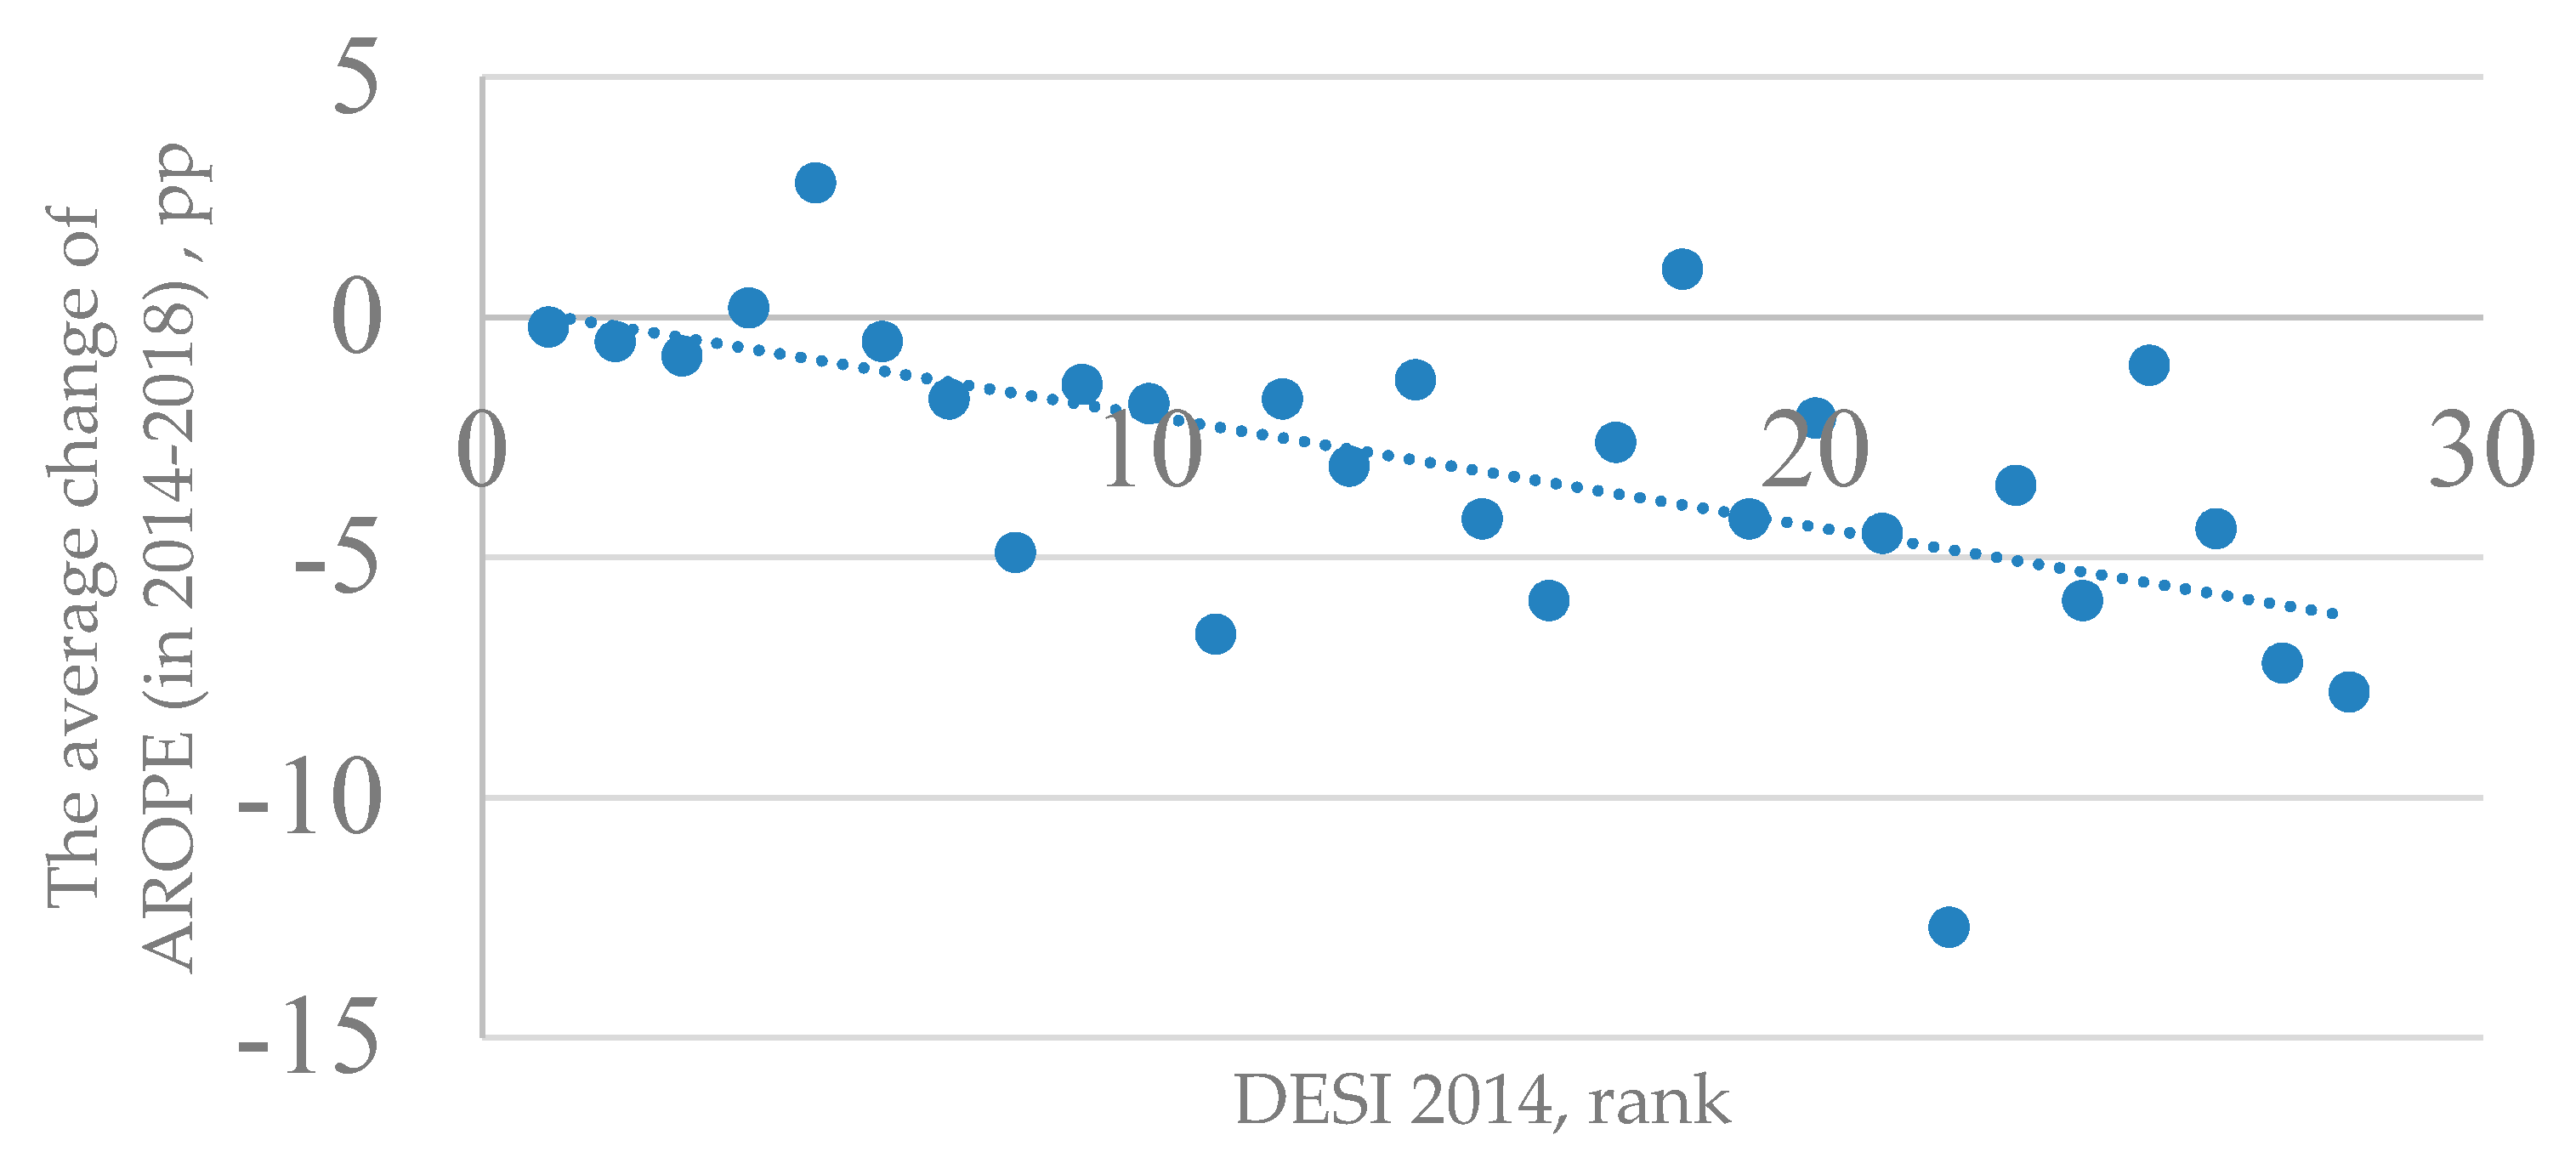
Thus, a relatively high level of digitalization does not provide the accelerated poverty alleviation. This is confirmed graphically (Figure 1).
The Spearman’s rank correlation coefficient between the change of the percentage of the population at risk of poverty and social exclusion in 2014–2018 in the EU countries and the rank shown by the DESI index in 2014 is −0.6. Thus, on average, a country’s higher level of digitalization does not provide an accelerated reduction of poverty risks.
The small volume of observations does not make it possible to use the regression analysis effectively in order to form possible scenarios of further changes in the dynamics of the AROPE indicator. For this reason, the Monte Carlo simulation method was used based on the following assumptions: (1) changes in the AROPE indicator in year n do not depend on its values in previous and subsequent years; (2) a change in a particular country within each of the years during the forecast period is assumed to be within the range of changes of annual fluctuations during the period under consideration. If for Austria, the fluctuations were +0.4 pp in 2014, −0.9 pp in 2015, −0.3 pp in 2016, +0.1 pp in 2017, and −0.6 pp in 2018, the fluctuation in each year of the forecast period would be in the interval [−0.9; +0.4], and the distribution function within this interval can be distributed between the five intervals: [0; +0.4], [−0.9; 0], [−0.3; 0], [0; 0.1], [−0.6; 0]. To estimate the changes within one forecast year, 10,000 independent scenarios were generated for each country. Accordingly, the probability is the ratio of the number of positive outcomes (a reduction in the percentage of the population at risk of poverty or social exclusion) to the total number of outcomes generated. Aggregated results for 2019–2021 are presented in Table 9.
For a group of countries with a high digitalization level, the average probability of the AROPE index to decrease in 2021 compared to 2018 is 75.61%, which is lower than for a group of countries with a medium-high (81.99%), medium-low (81.05%), and low (76.45%) digitalization level.
The Spearman’s rank correlation coefficient (0.32) shows that the lower the country’s digitalization level is, the higher the probability of poverty reduction and social exclusion. This contradicts the original hypothesis.
The approaches discussed above have their limitations because a different percentage of the population at risk of poverty or social exclusion forms different basic conditions, and a direct comparison of these populations is not always correct. For example, in Bulgaria in 2013 the AROPE level was 48%, and in 2018 it fell to 32.8% (minus 15.2 pp). In Czechia, such a significant decline is impossible even theoretically, because in 2013, this percentage amounted for 14.6% and theoretically could fall only to 0% or only by 14.6 pp. Consequently, the probability of a decrease in AROPE is to some extent determined by initial values.
Therefore, to further estimate the impact of the digitalization level on the risks of poverty or social exclusion, the authors selected pairs of the countries where initial values in 2013 were the same or differed no more than 0.1 pp. Thus, we can say that these countries were at the same starting position. Five pairs were selected for comparison (Table 10), and the authors analyzed the change of the percentage of the people at risk of poverty or social exclusion for 2014–2018 against the rank of the average digitalization level (DESI indicator) for the same period, as well as the probability of further positive changes.
In pair No. 1 (the Netherlands and Finland), a country with a higher digitalization level (Finland) has less rapid growth of the percentage of the population at risk of poverty or social exclusion (+0.5 pp) than a country with a lower level of digitalization (+0.8 pp). Thus, we observe a positive effect, which manifested itself in a lesser degree of deterioration of the situation.
In pair No. 2 (France and Sweden), a country with a higher level of digitalization (Sweden) showed lower rates of poverty risk reduction (−0.3 percentage points) than France (−0.9 percentage points). Therefore, in this pair, the positive effect of a higher level of digitalization is not observed.
In pair No. 3 (Sweden and Denmark), a country with a higher level of digitalization (Denmark) showed a higher rate of poverty reduction (−0.9 percentage points) than Sweden (−0.3 percentage points). Therefore, in this pair, the positive effect of a higher level of digitalization is observed.
In pair No. 4 (Slovenia and Germany), a country with a higher level of digitalization (Germany) showed lower rates of poverty risk reduction (−1.6 percentage points) than Slovenia (−4.2 percentage points). Therefore, in this pair, the positive effect of a higher level of digitalization is not observed.
In the last pair No. 5 (Ireland and Croatia), a country with a higher level of digitalization (Ireland) showed higher rates of poverty risk reduction (−8.8 percentage points) than Croatia (−5.1 percentage points). Therefore, in this pair, the positive effect of a higher level of digitalization is observed.
Thus, three pairs out of five demonstrated a positive effect of the digitalization level. Moreover, the probability of further positive changes within each of the five pairs is higher for a country with a lower level of DESI.
4. Conclusions
Comprehensive studies and statistics show that two processes are simultaneously taking place in the EU: deepening of economic digitalization and poverty reductions. Given its potential, it was logical to assume that digitalization has a positive effect on reducing the risks of poverty and social exclusion. However, on average, a higher level of digitalization of an EU member state does not provide an accelerated reduction of the risks of poverty and social exclusion.
Statistical calculations for the EU-28 countries mainly indicate the opposite; a higher level of digitalization provides a less rapid rate of poverty risk reduction. At the same time, countries with a higher level of digitalization are less likely to reduce poverty and social exclusion further.
For relatively poor segments of the population (1st, 2nd quintile by income) in the EU member states, the level of digitalization does not play a significant role. For relatively wealthy segments of the population (the 3rd and 4th quintiles by income) there is a pattern: the higher the level of digitalization is, the lower the risk of poverty and social exclusion.
A pairwise comparison of countries with similar initial AROPE levels showed that in most cases (three out of five), countries with a higher digitalization level showed a more significant reduction in poverty and social exclusion. However, the probability of further positive changes in this area was higher for countries with a lower level of digitalization.
Given the ambiguity of the results and the EU’s focus on further deepening of the digitalization level, there still remains the need for a more detailed study of the digitalization impact on social processes, although there is no doubt that further research, aimed at improving the social efficiency of introducing digital technology, is necessary.
Author Contributions
Conceptualization. A.K., O.V., and H.D.; methodology. A.K., O.V., and H.D.; software. A.K., O.V., and H.D.; validation. A.K., O.V., and H.D.; formal analysis. A.K., O.V., and H.D.; investigation. A.K., O.V., and H.D.; resources. A.K., O.V., and H.D.; data curation. A.K., O.V., and H.D.; writing—original draft preparation. A.K., O.V., and H.D.; writing—review and editing. A.K., O.V., and H.D.; visualization. A.K., O.V., and H.D.; supervision. A.K., O.V., and H.D.; project administration. A.K.; funding acquisition. A.K., O.V., and H.D. All authors have read and agreed to the published version of the manuscript.
Funding
This research received no external funding.
Acknowledgments
The authors are very grateful to the anonymous referees for their helpful comments and constructive suggestions.
Conflicts of Interest
The authors declare no conflict of interest.
References
- Aumann, Robert J., and Aviad Heifetz. 2002. Incomplete Information. In Handbook of Game Theory with Economic Applications. Edited by Robert Aumann and Sergiu Hart. Amsterdam: Elsevier Science B.V., pp. 1665–86. [Google Scholar]
- Backhaus, Simon Karl Hubert, and Devika Nadarajah. 2019. Investigating the Relationship between Industry 4.0 and Productivity: A Conceptual Framework for Malaysian Manufacturing Firms. Procedia Computer Science 161: 696–706. [Google Scholar] [CrossRef]
- Basile, Achille, Chiara Donnini, and Maria Gabriella Graziano. 2009. Core and Equilibria in Coalitional Asymmetric Information Economies. Journal of Mathematical Economics 45: 293–307. [Google Scholar] [CrossRef]
- Birau, Ramona, Abdullah Ejaz, Daniel-Iulian Doaga, and Andrei-Cristian Spulbar. 2019. Statistical Survey on People at Risk of Poverty or Social Exclusion in the European Union. Contemporary Economy 4: 81–90. Available online: http://www.revec.ro/article-2019-id-89-volume.4.issue.3-705-statistical.survey.on.people.at.risk.of.poverty.or.social.exclusion.in.the.european.union.html (accessed on 27 February 2020).
- Brown, Phillip, and David James. 2020. Educational Expansion, Poverty Reduction and Social Mobility: Reframing the Debate. International Journal of Educational Research 100: 101537. [Google Scholar] [CrossRef]
- Brynjolfsson, Erik, and Adam Saunders. 2009. Wired for Innovation: How Information Technology Is Reshaping the Economy. Cambridge: The MIT Press. [Google Scholar]
- Dalevska, Nataliya, Valentyna Khobta, Aleksy Kwilinski, and Sergey Kravchenko. 2019. A Model for Estimating Social and Economic Indicators of Sustainable Development. Entrepreneurship and Sustainability 6: 1839–60. [Google Scholar] [CrossRef]
- Dźwigoł, Henryk, Mariola Dźwigoł–Barosz, and Aleksy Kwiliński. 2020. Formation of Global Competitive Enterprise Environment Based on Industry 4.0 Concept. International Journal of Entrepreneurship 24: 1–5. Available online: https://www.abacademies.org/articles/Formation-of-global-competitive-enterprise-environment-based-on-industry-4.0-concept.pdf (accessed on 25 February 2020).
- Elsner, Wolfram, Torsten Heinrich, and Henning Schwardt. 2015. The Information Economy and the Open-Source Principle. In The Microeconomics of Complex Economies. Evolutionary, Institutional, and Complexity Perspectives. Chapter 15. Edited by Wolfram Elsner, Torsten Heinrich and Henning Schwardt. Amsterdam: Elsevier Inc., pp. 451–71. [Google Scholar]
- EUR-Lex. 2010a. A Digital Agenda for Europe. Available online: https://eur-lex.europa.eu/legal-content/EN/TXT/PDF/?uri=CELEX:52010DC0245&from=en (accessed on 24 February 2020).
- EUR-Lex. 2010b. European Broadband: Investing in Digitally Driven Growth. Available online: https://eur-lex.europa.eu/legal-content/EN/TXT/HTML/?uri=LEGISSUM:si0017&from=EN (accessed on 24 February 2020).
- EUR-Lex. 2014. Towards a Thriving Data-Driven Economy. Available online: http://eur-lex.europa.eu/legal-content/EN/TXT/?uri=COM%3A2014%3A0442%3AFIN (accessed on 24 February 2020).
- EUR-Lex. 2015. The EU’s New Digital Single Market. Strategy. Available online: http://eur-lex.europa.eu/legal-content/EN/TXT/?uri=legissum:3102_3 (accessed on 24 February 2020).
- EUR-Lex. 2017. Building a European Data Economy. Available online: https://eur-lex.europa.eu/legal-content/EN/TXT/?qid=1521790097276&uri=CELEX:52017DC0009 (accessed on 24 February 2020).
- EUR-Lex. 2018. Information Society. Available online: http://eur-lex.europa.eu/summary/chapter/information_society.html?root_default=SUM_1_CODED%3D31&locale=en#s_1244 (accessed on 24 February 2020).
- European Commission. 2018. The Age of Artificial Intelligence: Towards a European Strategy for Human-Centric Machines. EPSC Strategic Notes. Brussels: European Political Strategy Centre, vol. 29, pp. 1–14. [Google Scholar]
- European Commission. 2019. Digital Economy and Society Index (DESI) 2019 Ranking. Available online: https://ec.europa.eu/digital-single-market/en/digital-economy-and-society-index-desi (accessed on 24 February 2020).
- European Commission. 2020. Digital Economy and Society Index (DESI) 2020. Methodological Note. Available online: https://ec.europa.eu/digital-single-market/en/desi (accessed on 15 June 2020).
- Eurostat. 2020a. People at Risk of Poverty or Social Exclusion by Income Quintile and Household Type. Available online: https://appsso.eurostat.ec.europa.eu/nui/show.do?dataset=ilc_peps03&lang=en (accessed on 24 February 2020).
- Eurostat. 2020b. People at Risk of Poverty or Social Exclusion by Age and Sex. Available online: https://appsso.eurostat.ec.europa.eu/nui/show.do?dataset=ilc_peps01&lang=en (accessed on 24 February 2020).
- Eurostat. 2020c. Glossary: At Risk of Poverty or Social Exclusion (AROPE). Available online: https://ec.europa.eu/eurostat/statistics-explained/index.php/Glossary:At_risk_of_poverty_or_social_exclusion_(AROPE) (accessed on 24 February 2020).
- Gupta, Gaurav, and Indranil Bose. 2019. Strategic Learning for Digital Market Pioneering: Examining the Transformation of Wishberry’s Crowdfunding Model. Technological Forecasting and Social Change 146: 865–76. [Google Scholar] [CrossRef]
- Harrison, Jane L., A. Montgomery Claire, and P. Wilner Jeanty. 2019. A Spatial, Simultaneous Model of Social Capital and Poverty. Journal of Behavioral and Experimental Economics 78: 183–92. [Google Scholar] [CrossRef]
- Hoła, Bożena, Marek Sawicki, and Mirosław Skibniewski. 2015. An IT Model of a Knowledge Map which Supports Management in Small and Medium-Sized Companies Using Selected Polish Construction Enterprises as an Example. Journal of Civil. Engineering and Management 21: 1014–26. [Google Scholar] [CrossRef] [Green Version]
- Jenkins, Stephen P. 2019. Perspectives on Poverty in Europe. Following in Tony Atkinson’s Footsteps. Italian Economic Journal 6: 129–55. [Google Scholar] [CrossRef] [Green Version]
- Karmarkar, Uday S., and Uday M. Apte. 2007. Operations Management in the Information Economy: Information Products, Processes, and Chains. Journal of Operations Management 25: 438–53. [Google Scholar] [CrossRef]
- Kis, Anna B., and András Gábos. 2016. Consistent Poverty across the EU. Corvinus Journal of Sociology and Social Policy 7: 3–27. [Google Scholar] [CrossRef] [Green Version]
- Korže, Saša Zupan. 2019. From Industry 4.0 to Tourism 4.0. Innovative Issues and Approaches in Social Sciences 12: 29–52. [Google Scholar]
- Kumar, Naveen, and Jyoti Kumar. 2019. Efficiency 4.0 for Industry 4.0. Human Technology 15: 55–78. [Google Scholar] [CrossRef]
- Kuzior, Aleksandra, Aleksy Kwilinski, and Volodymyr Tkachenko. 2019. Sustainable Development of Organizations Based on the Combinatorial Model of Artificial Intelligence. Entrepreneurship and Sustainability 7: 1353–76. [Google Scholar] [CrossRef]
- Кwilinski, Aleksy. 2018a. Mechanism of Modernization of Industrial Sphere of Industrial Enterprise in Accordance with Requirements of the Information Economy. Marketing and Management of Innovations 4: 116–28. [Google Scholar] [CrossRef]
- Kwilinski, Aleksy. 2018b. Mechanism of Formation of Industrial Enterprise Development Strategy in the Information Economy. Virtual Economics 1: 7–25. [Google Scholar] [CrossRef]
- Kwilinski, Aleksy, Volodymyr Tkachenko, and Aleksandra Kuzior. 2019. Transparent Cognitive Technologies to Ensure Sustainable Society Development. Journal of Security and Sustainability 9: 561–70. [Google Scholar] [CrossRef]
- Lenart-Gansiniec, Regina. 2019. Organizational Learning in Industry 4.0. Problemy Zarządzania–Management 2: 96–108. [Google Scholar] [CrossRef]
- Lutz, Sebastian Uljas. 2019. The European Digital Single Market Strategy: Local Indicators of Spatial Association 2011–2016. Telecommunications Policy 43: 393–410. [Google Scholar] [CrossRef]
- Micic, Ljubiša. 2017. Digital Transformation and its Influence on GDP. Economics 5: 135–47. [Google Scholar] [CrossRef] [Green Version]
- Miežienė, Rasa, and Sandra Krutulienė. 2019. The Impact of Social Transfers on Poverty Reduction in EU Countries. Baltic Journal of European Studies Tallinn University of Technology 9: 157–75. [Google Scholar] [CrossRef] [Green Version]
- Miśkiewicz, Julia. 2019. The Merger of Natural Intelligence with Artificial Intelligence, with a Focus on Neuralink Company. Virtual Economics 2: 22–29. [Google Scholar] [CrossRef]
- Ragnedda, Massimo. 2018. Tackling Digital Exclusion Counter: Social Inequalities through Digital Inclusion. In Global Agenda for Social Justice. Edited by Glenn W. Muschert, Kristen Budd, Michelle Christian, Brian V. Klocke, Jon Shefner and Robert Perrucci. Bristol: Polity Press, pp. 151–57. Available online: https://mragnedda.wordpress.com/2018/08/23/tackling-digital-exclusion-counter-social-inequalities-through-digital-inclusion/ (accessed on 15 June 2020).
- Sanghavi, Devansh, Sahil Parikh, and S. Aravind Raj. 2019. Industry 4.0: Tools and Implementation. Management and Production Engineering Review 10: 3–13. [Google Scholar]
- Shank, Daniel B., and Alexander Gott. 2019. People’s Self-Reported Encounters of Perceiving Mind in Artificial Intelligence. Data in Brief 25: 104220. [Google Scholar] [CrossRef]
- Sun, Xiang, Yeneng Sun, Le Wu, and C. Yannelis Nicholas. 2017. Equilibria and Incentives in Private Information Economies. Journal of Economic Theory 169: 474–88. [Google Scholar] [CrossRef]
- Tkachenko, Volodymyr, Aleksandra Kuzior, and Aleksy Kwilinski. 2019. Introduction of Artificial Intelligence Tools into the Training Methods of Entrepreneurship Activities. Journal of Entrepreneurship Education 22: 1–10. Available online: https://www.abacademies.org/articles/Introduction-of-artificial-intelligence-tools-1528-2651-22-6-477.pdf (accessed on 24 February 2020).
- Trushkina, Nataliia. 2019. Development of the Information Economy under the Conditions of Global Economic Transformations: Features, Factors and Prospects. Virtual Economics 2: 7–25. [Google Scholar] [CrossRef]
- Vrchota, Jaroslav, Monika Mařiková, Petr Řehoř, Ladislav Rolínek, and Radek Toušek. 2020. Human Resources Readiness for Industry 4.0. Journal of Open Innovation: Technology, Market, and Complexity 6: 1–20. [Google Scholar] [CrossRef] [Green Version]
- Vyshnevskyi, Oleksandr. 2019. Unity of Digital and Virtual Economies within Concept of Dataism. Virtual Economics 2: 7–21. [Google Scholar] [CrossRef]
- Vyshnevskyi, Oleksandr, Viacheslav Liashenko, and Oleksandr Amosha. 2019. The Impact of Industry 4.0 and AI on Economic Growth. Scientific Papers of Silesian University of Technology. Organization and Management Series 140: 391–400. [Google Scholar]
- Wang, Yu-Gang, and Shi-Chao Xiu. 2019. An Intelligence Evaluation Method of the Environmental Impact for the Cutting Process. Journal of Cleaner Production 2271: 229–36. [Google Scholar]
- Zhao, Yang, Tingting Li, Xuejun Zhang, and Chaobo Zhang. 2019. Artificial Intelligence-Based Fault Detection and Diagnosis Methods for Building Energy Systems: Advantages, Challenges and the Future. Renewable and Sustainable Energy Reviews 109: 85–101. [Google Scholar] [CrossRef]
Figure 1.
The Change of the Percentage of the Population at Risk of Poverty and Social Exclusion in the EU Countries in 2014–2018 against their positions in the DESI Ranking in 2014. Source: Compiled by the authors based on the data of the European Commission (2019) and Eurostat (2020a).
Figure 1.
The Change of the Percentage of the Population at Risk of Poverty and Social Exclusion in the EU Countries in 2014–2018 against their positions in the DESI Ranking in 2014. Source: Compiled by the authors based on the data of the European Commission (2019) and Eurostat (2020a).


Table 1.
A Connectivity Dimension in the Digital Economy and Society Index (DESI) Structure.
| Indicator | Description |
|---|---|
| 1a Fixed broadband take-up | |
| 1a1 Overall fixed broadband take-up | % of households subscribing to fixed broadband |
| 1a2 At least 100 Mbps fixed broadband take-up | % of households subscribing to fixed broadband of at least 100 Mbps, calculated as overall fixed broadband take-up (source: Eurostat) multiplied by the percentage of fixed broadband lines of at least 100 Mbps |
| 1b Fixed broadband coverage | |
| 1b1 Fast broadband (NGA) coverage | % of households covered by fixed broadband of at least 30 Mbps download. The technologies considered are FTTH, FTTB, Cable Docsis 3.0, and VDSL |
| 1b2 Fixed Very High Capacity Network (VHCN) coverage | % of households covered by any fixed VHCN. The technologies considered are FTTH and FTTB for 2015–2018 and FTTH, FTTB, and Cable Docsis 3.1 for 2019 |
| 1c Mobile broadband | |
| 1c1 4G coverage | % of populated areas with 4G coverage, measured as the average coverage of telecom operators in each country |
| 1c2 Mobile broadband take-up | Number of mobile data subscriptions per 100 people |
| 1c3 5G readiness | The amount of spectrum assigned and ready for 5G use by the end of 2020 within the so-called 5G pioneer bands. These bands are 700 MHz (703–733 MHz and 758–788 MHz), 3.6 GHz (3400–3800 MHz), and 26 GHz (1000 MHz within 24250–27500 MHz). All three spectrum bands have an equal weight |
| 1d Broadband price index | |
| 1d1 Broadband price index | The broadband price index measures the prices of representative baskets of fixed, mobile, and converged broadband offers |
Source: Compiled by the authors based on the data of the European Commission (2020).
Table 2.
A Human Capital Dimension in the DESI Structure.
| Indicator | Description |
|---|---|
| 2a Internet user skills | |
| 2a1 At least basic digital skills | Individuals with ‘basic’ or ‘above basic’ digital skills in each of the following four dimensions: information, communication, problem solving, and software for content creation (as measured by the number of activities carried out during the previous 3 months). |
| 2a2 Above basic digital skills | Individuals with ‘above basic’ digital skills in each of the following four dimensions: information, communication, problem solving, and software for content creation (as measured by the number of activities carried out during the previous 3 months). |
| 2a3 At least basic software skills | Individuals who, in addition to having used basic software features such as word processing, have used advanced spreadsheet functions, created a presentation or document integrating text, pictures, and tables or charts, or a written code in a programming language. |
| 2b Advanced skills and development | |
| 2b1 ICT specialists | Employed ICT specialists. Broad definition based on the ISCO-08 classification and including jobs like ICT service managers, ICT professionals, ICT technicians, ICT installers, and servicers. |
| 2b2 Female ICT specialists | Employed ICT specialists. Broad definition based on the ISCO-08 classification and including jobs like ICT service managers, ICT professionals, ICT technicians, ICT installers, and servicers. |
| 2b3 ICT graduates | Individuals with a degree in ICT. |
Source: Compiled by the authors based on the data of the European Commission (2020).
Table 3.
The Use of an Internet Services Dimension in the DESI structure.
| Indicator | Description |
|---|---|
| 3a Internet use | |
| 3a1 People who have never used the internet | Individuals who have never used the internet |
| 3a2 Internet users | Individuals who used the internet at least once a week |
| 3b Activities online | |
| 3b1 News | Individuals who used the internet to read online news sites, newspapers or news magazines |
| 3b2 Music, videos and games | Individuals who used the internet to play or download games, images, films or music |
| 3b3 Video on demand | Individuals who used the internet to use video on demand services |
| 3b4 Video calls | Individuals who used the internet to make telephone or video calls (e.g., Skype) |
| 3b5 Social networks | Individuals who used the internet to participate in social networks (create user profile, post messages or other contributions) |
| 3b6 Doing an online course | Individuals who used the internet to do an online course (on any subject) |
| 3c Transactions | |
| 3c1 Banking | Individuals who used the internet to use online banking |
| 3c2 Shopping | Individuals who ordered goods or services online |
| 3c3 Selling online | Individuals who sold goods or services online |
Source: Compiled by the authors based on the data of the (European Commission 2020).
Table 4.
A Dimension of Digital Technology Integration in the DESI structure
| Indicator | Description |
|---|---|
| 4a Business digitization | |
| 4a1 Electronic information sharing | Businesses which use an ERP (enterprise resource planning) software package to share information among different functional areas (e.g., accounting, planning, production, marketing) |
| 4a2 Social media | Businesses using two or more of the following social media: social networks, an enterprise’s blog or microblog, multimedia content sharing websites, wiki-based knowledge sharing tools. Using social media means that the enterprise has a user profile, an account, or a user license depending on the requirements and the type of social media. |
| 4a3 Big data | Enterprises analyzing big data from any data source |
| 4a4 Cloud | Businesses purchasing at least one of the following cloud computing services: hosting of its database, accounting software applications, CRM software, computing power |
| 4b e-Commerce | |
| 4b1 SMEs selling online | SMEs selling online (at least 1% of turnover) |
| 4b2 e-Commerce turnover | SMEs total turnover from e-commerce |
| 4b3 Selling online cross-border | SMEs that carried out electronic sales to other EU countries |
Source: Compiled by the authors based on the data of the European Commission (2020).
Table 5.
A Dimension of Digital Public Services in the DESI structure.
| Indicator | Description |
|---|---|
| 5a e-Government | |
| 5a1 e-Government users | Individuals who sent filled forms to public authorities over the internet in the previous 12 months |
| 5a2 Pre-filled forms | Amount of data that is pre-filled in public service online forms |
| 5a3 Online service completion | The share of administrative steps that can be done online for major life events (birth of a child, new residence, etc.) |
| 5a4 Digital public services for businesses | The indicator broadly reflects the share of public services needed to start a business and to conduct regular business operations that are available online for domestic as well as foreign users. Services provided through a portal receive a higher score, services which provide only information (but have to be completed offline) receive a more limited score. |
| 5a5 Open data | This composite indicator measures the availability of an open data policy in a country (including the transposition of the revised PSI Directive), the estimated political, social, and economic impact of open data, and the characteristics (functionalities, data availability and usage) of the national data portal. |
Source: Compiled by the authors based on the data of the European Commission (2020).
Table 6.
People at risk of poverty or social exclusion (AROPE) against the DESI Rank in 2014–2018.
| # | Country | DESI Rank * | Average DESI Rank 2014–2018 | Change of DESI Rank Δ (2014–2018) | AROPE **, % | |||||
|---|---|---|---|---|---|---|---|---|---|---|
| 2014 | 2018 | 2014 | 2015 | 2016 | 2017 | 2018 | ||||
| 1 | Austria | 12 | 12 | 12.2 | 0 | 19.2 | 18.3 | 18.0 | 18.1 | 17.5 |
| 2 | Belgium | 9 | 9 | 8.2 | 0 | 21.2 | 21.1 | 20.7 | 20.4 | 19.8 |
| 3 | Bulgaria | 27 | 26 | 26.6 | 1 | 40.0 | 41.4 | 40.4 | 38.9 | 32.8 |
| 4 | Croatia | 21 | 21 | 20.4 | 0 | 29.3 | 29.1 | 27.9 | 26.4 | 24.8 |
| 5 | Cyprus | 23 | 22 | 22.2 | 1 | 27.4 | 28.9 | 27.7 | 25.2 | 23.9 |
| 6 | Czechia | 17 | 17 | 16 | 0 | 14.8 | 14.0 | 13.3 | 12.2 | 12.2 |
| 7 | Denmark | 2 | 4 | 1.8 | −2 | 17.9 | 17.7 | 16.8 | 17.2 | 17.4 |
| 8 | Estonia | 7 | 7 | 7.8 | 0 | 26.0 | 24.3 | 24.4 | 23.5 | 24.3 |
| 9 | Finland | 3 | 3 | 2.4 | 0 | 17.3 | 16.8 | 16.6 | 15.7 | 16.5 |
| 10 | France | 14 | 16 | 14.8 | −2 | 18.5 | 17.6 | 18.1 | 16.9 | 17.2 |
| 11 | Germany | 10 | 13 | 11.2 | −3 | 20.6 | 20.0 | 19.7 | 19.0 | 18.8 |
| 12 | Greece | 26 | 28 | 26.6 | −2 | 36.0 | 35.7 | 35.5 | 34.8 | 31.6 |
| 13 | Hungary | 22 | 23 | 22.4 | −1 | 31.8 | 28.1 | 26.2 | 25.5 | 19.1 |
| 14 | Ireland | 11 | 8 | 9.8 | 3 | 27.7 | 26.2 | 24.4 | 22.7 | 21.1 |
| 15 | Italy | 25 | 24 | 24.2 | 1 | 28.3 | 28.7 | 30.0 | 28.9 | 27.3 |
| 16 | Latvia | 19 | 18 | 18.8 | 1 | 32.6 | 30.7 | 28.5 | 28.3 | 28.4 |
| 17 | Lithuania | 18 | 14 | 17.2 | 4 | 27.3 | 29.5 | 30.2 | 29.6 | 28.3 |
| 18 | Luxembourg | 5 | 5 | 5 | 0 | 19.0 | 18.5 | 19.8 | 21.5 | 21.8 |
| 19 | Malta | 8 | 10 | 8.4 | −2 | 23.9 | 23.0 | 20.3 | 19.3 | 19.0 |
| 20 | Netherlands | 4 | 2 | 3.4 | 2 | 16.5 | 16.4 | 16.7 | 17.0 | 16.7 |
| 21 | Poland | 24 | 25 | 24.8 | −1 | 24.3 | 23.2 | 21.5 | 19.3 | 18.4 |
| 22 | Portugal | 16 | 19 | 16.6 | −3 | 27.5 | 26.6 | 25.1 | 23.3 | 21.6 |
| 23 | Romania | 28 | 27 | 27.8 | 1 | 40.3 | 37.3 | 38.8 | 35.7 | 32.5 |
| 24 | Slovakia | 20 | 20 | 21 | 0 | 18.4 | 18.4 | 18.1 | 16.3 | 16.3 |
| 25 | Slovenia | 15 | 15 | 15.6 | 0 | 20.4 | 19.2 | 18.4 | 17.1 | 16.2 |
| 26 | Spain | 13 | 11 | 12.4 | 2 | 29.2 | 28.6 | 27.9 | 26.6 | 26.1 |
| 27 | Sweden | 1 | 1 | 2.4 | 0 | 18.1 | 18.6 | 18.2 | 17.5 | 17.9 |
| 28 | UK | 6 | 6 | 6 | 0 | 24.1 | 23.5 | 22.2 | 22.0 | 23.6 |
Source: Compiled by the authors based on the data of the European Commission (2019) and Eurostat (2020a). Note: * Rank 1 shows the best national digitalization situation. Rank 28 shows the worst national digitalization situation; ** The lower AROPE, the better the changes of low poverty or social exclusion.
Table 7.
Average AROPE by income and level of digitalization in the EU countries in 2018, %.
| Digitalization Level (DESI Rank) | Income Quintile, % | |||
|---|---|---|---|---|
| 1st Quintile | 2nd Quintile | 3rd Quintile | 4th Quintile * | |
| Low (rank 21–28) | 86.81 | 25.44 | 11.27 | 6.69 |
| Medium-low (rank 15–21) | 78.16 | 11.60 | 4.60 | 2.61 |
| Medium-high (rank 8–14) | 86.86 | 14.06 | 4.09 | 1.64 |
| High (rank 1–7) | 83.03 | 9.74 | 3.66 | 1.83 |
Source: Compiled by the authors based on the data of the European Commission (2019) and Eurostat (2020a). Note: * Eurostat does not provide calculations for the 5th quintile.
Table 8.
Comparing the Change in the DESI Ranking and the Percentage of the Population by the AROPE Indicator in 2014–2018.
Table 8.
Comparing the Change in the DESI Ranking and the Percentage of the Population by the AROPE Indicator in 2014–2018.
| Country | Change of DESI Rank | The Average Change of AROPE, pp |
|---|---|---|
| Lithuania | +4 | +1.0 |
| Ireland | +3 | −6.6 |
| Netherlands; Spain | +2 | −1.5 |
| Cyprus; Italy; Latvia; Romania; Bulgaria | +1 | −4.7 |
| Czechia; Finland; Sweden; Austria; Luxembourg; Slovakia; Slovenia; Belgium; Estonia; United Kingdom; Croatia | 0 | −1.5 |
| Poland; Hungary | −1 | −9.3 |
| France; Denmark; Malta; Greece | −2 | −2.8 |
| Germany; Portugal | −3 | −3.9 |
Source: Compiled by the authors based on the data of the European Commission (2019) and Eurostat (2020a).
Table 9.
The Probability that the Value of the AROPE Indicator in 2021 will be lower than in 2018, %.
Table 9.
The Probability that the Value of the AROPE Indicator in 2021 will be lower than in 2018, %.
| Rank of DESI Average Values 2014–2018 | Country | P(X2021 < α2018) * | Rank of DESI Average Values 2014–2018 | Country | P(X2021 < α2018) |
|---|---|---|---|---|---|
| 1 | Denmark | 56.62 | 15 | Slovenia | 99.13 |
| 2 | Finland | 69.00 | 16 | Czechia | 52.21 |
| 3 | Sweden | 57.12 | 17 | Portugal | 100.00 ** |
| 4 | Netherlands | 91.71 | 18 | Lithuania | 70.83 |
| 5 | Luxembourg | 84.61 | 19 | Latvia | 99.67 |
| 6 | UK | 67.61 | 20 | Croatia | 86.93 |
| 7 | Estonia | 50.50 | 21 | Slovakia | 57.18 |
| Average 1–7 | 75.61 | Average 15–21 | 81.05 | ||
| 8 | Belgium | 76.74 | 22 | Cyprus | 88.40 |
| 9 | Malta | 91.06 | 23 | Hungary | 100.00 |
| 10 | Ireland | 76.79 | 24 | Italy | 45.41 |
| 11 | Germany | 99.97 | 25 | Poland | 84.04 |
| 12 | Austria | 73.32 | 26 | Bulgaria | 95.08 |
| 13 | Spain | 66.92 | 27 | Greece | 98.84 |
| 14 | France | 78.81 | 28 | Romania | 87.17 |
| Average 8–14 | 81.99 | Average 22–28 | 76.45 | ||
Note: * the probability that the value of AROPE in 2021 will be lower than in 2018; ** for Portugal and Hungary, the probability of a decrease of the AROPE value in 2021 is estimated at 100% because within the entire observation period (2014–2018), a decrease of this indicator was observed for each year. Source: Compiled by the authors based on the data of the European Commission (2019) and Eurostat (2020a).
Table 10.
The Dynamics of the Countries-Pairs with the Same (Close) Values of Percentage of the People at Risk of Poverty or Social Exclusion in 2013, Taking into Account the Average Digitalization Level.
Table 10.
The Dynamics of the Countries-Pairs with the Same (Close) Values of Percentage of the People at Risk of Poverty or Social Exclusion in 2013, Taking into Account the Average Digitalization Level.
| Pair Number | Country | Rank of DESI Average Values 2014–2018 | AROPE | P(X2021 < α2018) | ||
|---|---|---|---|---|---|---|
| 2013, % | 2018, % | Δ, “5”–“4” pp | ||||
| 1 | The Netherlands | 4 | 15.9 | 16.7 | 0.8 | 91.71 |
| Finland | 2 | 16.0 | 16.5 | 0.5 | 69.00 | |
| 2 | France | 14 | 18.1 | 17.2 | −0.9 | 78.81 |
| Sweden | 3 | 18.2 | 17.9 | −0.3 | 57.12 | |
| 3 | Sweden | 3 | 18.2 | 17.9 | −0.3 | 57.12 |
| Denmark | 1 | 18.3 | 17.4 | −0.9 | 56.62 | |
| 4 | Slovenia | 15 | 20.4 | 16.2 | −4.2 | 99.13 |
| Germany | 11 | 20.4 | 18.8 | −1.6 | 99.97 | |
| 5 | Ireland | 10 | 29.9 | 21.1 | −8.8 | 76.79 |
| Croatia | 20 | 29.9 | 24.8 | −5.1 | 86.93 | |
Source: Compiled by the authors based on the data of the European Commission (2019) and Eurostat (2020a).
© 2020 by the authors. Licensee MDPI, Basel, Switzerland. This article is an open access article distributed under the terms and conditions of the Creative Commons Attribution (CC BY) license (http://creativecommons.org/licenses/by/4.0/).
Share and Cite
MDPI and ACS Style
Kwilinski, A.; Vyshnevskyi, O.; Dzwigol, H. Digitalization of the EU Economies and People at Risk of Poverty or Social Exclusion. J. Risk Financial Manag. 2020, 13, 142. https://0-doi-org.brum.beds.ac.uk/10.3390/jrfm13070142
AMA Style
Kwilinski A, Vyshnevskyi O, Dzwigol H. Digitalization of the EU Economies and People at Risk of Poverty or Social Exclusion. Journal of Risk and Financial Management. 2020; 13(7):142. https://0-doi-org.brum.beds.ac.uk/10.3390/jrfm13070142
Chicago/Turabian StyleKwilinski, Aleksy, Oleksandr Vyshnevskyi, and Henryk Dzwigol. 2020. "Digitalization of the EU Economies and People at Risk of Poverty or Social Exclusion" Journal of Risk and Financial Management 13, no. 7: 142. https://0-doi-org.brum.beds.ac.uk/10.3390/jrfm13070142