
Spillovers of the COVID-19 Pandemic: Impact on Global Economic Activity, the Stock Market, and the Energy Sector


Abstract
:1. Introduction
2. Literature Review
3. Materials and Methods
4. Empirical Results
4.1. Descriptive Statistics
4.2. Structural Vector Autoregression (SVAR)
5. Conclusions
Author Contributions
Funding
Data Availability Statement
Conflicts of Interest
| 1 | The information is obtained from World Health Organization (WHO) website: https://www.who.int/emergencies/diseases/novel-coronavirus-2019/events-as-they-happen (accessed on 23 February 2021). |
| 2 | World Economic Outlook Update (June 2020) Available at: https://www.imf.org/en/Publications/WEO/Issues/2020/06/24/WEOUpdateJune2020#:~:text=Global%20growth%20is%20projected%20at,Economic%20Outlook%20(WEO)%20forecast.&text=In%202021%20global%20growth%20is,19%20projections%20of%20January%202020 (accessed on 24 February 2021). |
| 3 | ‘COVID-19 pandemic’s global cost may exceed $4T’ report by Anadolu Agency. Available at: https://www.aa.com.tr/en/economy/covid-19-pandemics-global-cost-may-exceed-4t/1790582 (accessed on 24 February 2021). |
| 4 | Impact of Covid-19 on the global energy sector. Available at: https://www.pv-magazine.com/2020/04/24/impact-of-covid-19-on-the-global-energy-sector/ (accessed on 24 February 2021). |
| 5 | 5 things to know about how coronavirus has hit global energy. Available at: https://www.weforum.org/agenda/2020/05/covid19-energy-use-drop-crisis/ (accessed on 22 February 2021). |
| 6 | World Energy Outlook flagship report (October 2020). Available at: https://www.iea.org/reports/world-energy-outlook-2020 (accessed on 25 February 2021). |
| 7 | The Baltic dry index, which measures the cost of shipping goods around the world. The index is reported daily by the Baltic Exchange in London. It provides a benchmark for the price of moving the major raw materials by sea. The Baltic dry index is not restricted to Baltic Sea countries or to a few commodities like crude oil. Instead, the Baltic dry index takes into account 23 different shipping routes carrying coal, iron ore, grains and many other commodities. (tradingeconomics.com) (accessed on 26 February 2021). |
| 8 | For details, see the link, https://www.msci.com/documents/10199/149ed7bc-316e-4b4c-8ea4-43fcb5bd6523 (accessed on 22 February 2021). |
| 9 | https://www.msci.com/documents/10199/de6dfd90-3fcd-42f0-aaf9-4b3565462b5a (accessed on 26 February 2021). |
| 10 | Timeline: How the new coronavirus spread by Al Jazeera (Available at: https://www.aljazeera.com/news/2020/01/timeline-china-coronavirus-spread-200126061554884.html) (accessed on 26 February 2021). |
| 11 | The daily global COVID-19 cases are an exogenous variable, as it is not affected at all by other variables included in the model. |
| 12 | |
| 13 | https://www.pv-magazine.com/2020/04/24/impact-of-covid-19-on-the-global-energy-sector/ (accessed on 23 February 2021). |
References
- Al-Awadhi, Abdullah M., Khaled Alsaifi, Ahmad Al-Awadhi, and Salah Alhammadi. 2020. Death and contagious infectious diseases: Impact of the COVID-19 virus on stock market returns. Journal of Behavioral and Experimental Finance 27: 1–5. [Google Scholar] [CrossRef] [PubMed]
- Albulescu, Claudiu. 2020. Coronavirus and Oil Price Crash. Available online: https://ssrn.com/abstract=3553452 (accessed on 12 February 2021).
- Ashraf, Badar Nadeem. 2020. Stock markets’ reaction to COVID-19: Cases or fatalities? Research in International Business and Finance 54: 1–18. [Google Scholar] [CrossRef]
- Baek, Seungho, Sunil K. Mohanty, and Mina Glambosky. 2020. COVID-19 and stock market volatility: An industry level analysis. Finance Research Letters 37: 1–10. [Google Scholar] [CrossRef]
- Baker, Scott R., Nicholas Bloom, Steven J. Davis, Kyle J. Kost, Marco C. Sammon, and Tasaneeya Viratyosin. 2020. The Unprecedented Stock Market Impact of COVID-19. NBER Working Papers 26945. Cambridge: National Bureau of Economic Research, Inc. [Google Scholar]
- Baldwin, Richard, and Beatrice Weder di Mauro. 2020. Economics in the Time of COVID-19. London: Centre for Economic Policy Research. [Google Scholar]
- Baldwin, Richard, and Eiichi Tomiura. 2020. Thinking Ahead about the Trade Impact of COVID-19. London: Centre for Economic Policy Research. [Google Scholar]
- Chaudhary, Rashmi, Priti Bakhshi, and Hemendra Gupta. 2020. Volatility in International Stock Markets: An Empirical Study during COVID-19. Journal of Risk and Financial Management 13: 208. [Google Scholar] [CrossRef]
- Chen, Chun-Da, Chin-Chun Chen, Wan-Wei Tang, and Bor-Yi Huang. 2009. The Positive and Negative Impacts of the Sars Outbreak: A Case of the Taiwan Industries. The Journal of Developing Areas 43: 281–93. [Google Scholar] [CrossRef]
- Chen, Mei-Ping, Chien-Chiang Lee, Yu-Hui Lin, and Wen-Yi Chen. 2018. Did the S.A.R.S. epidemic weaken the integration of Asian stock markets? Evidence from smooth time-varying cointegration analysis. Economic Research-Ekonomska Istraživanja 31: 908–26. [Google Scholar] [CrossRef] [Green Version]
- Chevallier, Julien. 2021. COVID-19 Outbreak and CO2 Emissions: Macro-Financial Linkages. Journal of Risk and Financial Management 14: 12. [Google Scholar] [CrossRef]
- Choi, Yukyung, Glenn Levine, and Samuel W. Malone. 2020. The Coronavirus (COVID-19) Pandemic: Assessing the Impact on Corporate Credit Risk. Moody’s Analytics. Available online: https://www.moodysanalytics.com/articles/2020/coronavirus-assessing-the-impact-on-corporate-credit-risk (accessed on 15 February 2021).
- Chowdhury, Emon Kalyan, Iffat Ishrat Khan, and Bablu Kumar Dhar. 2021. Catastrophic impact of Covid-19 on the global stock markets and economic activities. Business and Society Review. Forthcoming. [Google Scholar] [CrossRef]
- Dutta, Anupam, Debojyoti Das, R. K. Jana, and Xuan Vinh Vo. 2020. COVID-19 and oil market crash: Revisiting the safe haven property of gold and Bitcoin. Resources Policy 69: 1–6. [Google Scholar] [CrossRef]
- Fan, Ying, and Jin-Hua Xu. 2011. What has driven oil prices since 2000? A structural change perspective. Energy Economics 33: 1082–94. [Google Scholar] [CrossRef]
- Giannarakis, Grigoris, Christos Lemonakis, Asterios Sormas, and Christos Georganakis. 2017. The effect of Baltic Dry Index, gold, oil and USA trade balance on Dow Jones Sustainability Index world. International Journal of Economics and Financial Issues 7: 155–60. [Google Scholar]
- Giudice, Alfonso Del, and Andrea Paltrinieri. 2017. The impact of the Arab Spring and the Ebola outbreak on African equity mutual fund investor decisions. Research in International Business and Finance 41: 600–12. [Google Scholar] [CrossRef]
- Goodell, John W. 2020. COVID-19 and finance: Agendas for future research. Finance Research Letters 35: 1–5. [Google Scholar] [CrossRef] [PubMed]
- Grahama, Michael, Jarkko Peltomäki, and Vanja Piljak. 2016. Global economic activity as an explicator of emerging market equity returns. Research in International Business and Finance 36: 424–35. [Google Scholar] [CrossRef]
- Hassan, Sherif M., and John M. Riveros Gavilanes. 2021. First to React Is the Last to Forgive: Evidence from the Stock Market Impact of COVID 19. Journal of Risk and Financial Management 14: 26. [Google Scholar] [CrossRef]
- He, Qing, Junyi Liu, Sizhu Wang, and Jishuang Yu. 2020. The impact of COVID-19 on stock markets. Economic and Political Studies 8: 275–88. [Google Scholar] [CrossRef]
- Ho, Linh Tu, and Christopher Gan. 2021. Foreign Direct Investment and World Pandemic Uncertainty Index: Do Health Pandemics Matter? Journal of Risk and Financial Management 14: 107. [Google Scholar] [CrossRef]
- Hsieh, Shu-Fan. 2013. Individual and institutional herding and the impact on stock returns: Evidence from Taiwan stock market. International Review of Financial Analysis 29: 175–88. [Google Scholar] [CrossRef]
- Ichev, Riste, and Matej Marinč. 2018. Stock prices and geographic proximity of information: Evidence from the Ebola outbreak. International Review of Financial Analysis 56: 153–66. [Google Scholar] [CrossRef]
- IMF. 2020. The Great Lockdown: Worst Economic Downturn since the Great Depression World. World Economic Outlook. Washington, DC: IMF. [Google Scholar]
- Joo, H., B. Maskery, A. Berro, L. Rotz, Y. Lee, and C. Brown. 2019. Economic Impact of the 2015 MERS Outbreak on the Republic of Korea’s Tourism-Related Industries. Health Security 17: 100–8. [Google Scholar] [CrossRef]
- Jordà, Òscar, Sanjay. R. Singh, and Alan. M. Taylor. 2020. History shows COVID-19’s economic fallout may be with us for decades. Finance & Development 57: 12–15. [Google Scholar]
- Keating, John. 1992. Structural Approaches to Vector Autoregressions. Federal Reserve Bank of St. Louis Review 74: 37–57. [Google Scholar] [CrossRef] [Green Version]
- Kilian, Lutz. 2009. Not all oil price shocks are alike: Disentangling demand and supply shocks in the crude oil market. American Economic Review 99: 1053–69. [Google Scholar] [CrossRef] [Green Version]
- Laborda, Ricardo, and Jose Olmo. 2021. Volatility spillover between economic sectors in financial crisis prediction: Evidence spanning the great financial crisis and Covid-19 pandemic. Research in International Business and Finance 57: 1–13. [Google Scholar] [CrossRef]
- Lin, Arthur J., Hai Yen Chang, and Jung Lieh Hsiao. 2019. Does the Baltic Dry Index drive volatility spillovers in the commodities, currency, or stock markets? Transportation Research Part E: Logistics and Transportation Review 127: 265–83. [Google Scholar] [CrossRef]
- Makridakis, Spyros, Andreas Merikas, Anna Merika, Mike G Tsionas, and Marwan Izzeldin. 2020. A novel forecasting model for the Baltic dry index utilizing optimal squeezing. Journal of Forecasting 39: 56–68. [Google Scholar] [CrossRef]
- McPhail, Lihong Lu. 2011. Assessing the impact of US ethanol on fossil fuel markets: A structural VAR approach. Energy Economics 33: 1177–85. [Google Scholar] [CrossRef]
- Nasir, Muhammad Ali, Ahmed Abdulsalam Al-Emadi, Muhammad Shahbaz, and Shawkat Hammoudeh. 2019. Importance of oil shocks and the GCC macroeconomy: A structural VAR analysis. Resources Policy 61: 166–79. [Google Scholar] [CrossRef]
- Ocampo, Sergio, and Norberto Rodríguez. 2012. An Introductory Review of a Structural VAR-X Estimation and Applications. Revista Colombiana de Estadística 35: 479–508. [Google Scholar]
- Onali, Enrico. 2020. COVID-19 and Stock Market Volatility. Available online: https://ssrn.com/abstract=3571453 (accessed on 18 February 2021).
- Ozili, Peterson K. 2020. COVID-19 pandemic and economic crisis: The Nigerian experience and structural causes. Journal of Economic and Administrative Sciences. Forthcoming. [Google Scholar] [CrossRef]
- Ozili, Peterson K., and Thankom Arun. 2020. Spillover of COVID-19: Impact on the Global Economy. Available online: https://ssrn.com/abstract=3562570 (accessed on 16 February 2021).
- Qiu, Cheng, Gregory Colson, Cesar Escalante, and Michael Wetzstein. 2012. Considering macro-economic indicators in the food before fuel nexus. Energy Economics 34: 2021–28. [Google Scholar] [CrossRef]
- Raghavan, Mala, Paramsothy Silvapulle, and George Athanasopoulos. 2012. Structural VAR models for Malaysian monetary policy analysis during the pre-and post-1997 Asian crisis periods. Applied Economics 44: 3841–56. [Google Scholar] [CrossRef]
- Ramelli, Stefano, and Alexander F. Wagner. 2020. Feverish Stock Price Reactions to COVID-19. Review of Corporate Finance Studies 9: 622–55. [Google Scholar] [CrossRef]
- Roser, Max, Hannah Ritchie, Esteban Ortiz-Ospina, and Joe Hasell. 2020. Coronavirus Pandemic (COVID-19). Published Online at OurWorldInData.org. Available online: https://ourworldindata.org/coronavirus (accessed on 16 February 2021).
- Sharif, Arshian, Chaker Aloui, and Larisa Yarovaya. 2020. COVID-19 pandemic, oil prices, stock market, geopolitical risk and policy uncertainty nexus in the US economy: Fresh evidence from the wavelet-based approach. International Review of Financial Analysis 70: 1–9. [Google Scholar] [CrossRef]
- Sun, Yunchuan, Mengyuan Wu, Xiaoping Zeng, and Zihan Peng. 2021. The impact of COVID-19 on the Chinese stock market: Sentimental or substantial? Finance Research Letters 38: 101838. [Google Scholar] [CrossRef]
- Yarovaya, Larisa, Nawazish Mirza, Syed Kumail Abbas Rizvi, Irum Saba, and Bushra Naqvi. 2020a. The Resilience of Islamic Equity Funds during COVID-19: Evidence from Risk Adjusted Performance, Investment Styles and Volatility Timing. Available online: https://ssrn.com/abstract=3737689 (accessed on 16 February 2021).
- Yarovaya, Larisa, Roman Matkovskyy, and Akanksha Jalan. 2020b. The COVID-19 Black Swan Crisis: Reaction and Recovery of Various Financial Markets. Available online: https://ssrn.com/abstract=3611587 (accessed on 16 February 2021).
- Yilmazkuday, Hakan. 2020. COVID-19 Effects on the S&P 500 Index. Available online: https://ssrn.com/abstract=3555433 (accessed on 17 February 2021).
- Zhang, Dayong, Min Hu, and Qiang Ji. 2020. Financial markets under the global pandemic of COVID-19. Finance Research Letters 39: 1–6. [Google Scholar]


| Before Human-to-Human COVID-19 Transmission | After Human-to-Human COVID-19 Transmission | |||||
|---|---|---|---|---|---|---|
| BDI | MSCI | MSCIE | BDI | MSCI | MSCIE | |
| Mean | −0.2335 | 0.0686 | −0.0067 | 0.2878 | 0.0420 | −0.0853 |
| Median | −0.0432 | 0.081 | 0.0405 | 0.0779 | 0.1477 | −0.2064 |
| S.D. | 2.8149 | 0.677 | 1.0065 | 3.9374 | 1.7551 | 3.22401 |
| Kurtosis | 4.9375 | 5.8453 | 3.9622 | 6.9976 | 13.5794 | 13.9996 |
| Skewness | −0.2998 | −0.2603 | −0.1627 | 1.0925 | −1.2581 | −1.1572 |
| Min. | −11.047 | −2.4804 | −3.3208 | −10.0694 | −10.4411 | −21.2318 |
| Max. | 10.1959 | 3.0403 | 3.2443 | 20.3366 | 8.4063 | 15.6704 |
| Count | 289 | 289 | 289 | 289 | 289 | 289 |
| COVID-19 Cases | BDI | MSCI | MSCIE | |
|---|---|---|---|---|
| COVID-19 Cases | 1 | |||
| BDI | −0.0047 | 1 | ||
| MSCI | −0.0032 | −0.0783 | 1 | |
| MSCIE | −0.0165 | −0.1212 | 0.8466 | 1 |
| Variable | ADF Test | PP Test | ||
|---|---|---|---|---|
| Statistic | p-Value | Statistic | p-Value | |
| COVID-19 Cases | −5.7556 | 0.0000 | −29.6280 | 0.0000 |
| MSCI | −7.5545 | 0.0000 | −64.3032 | 0.0001 |
| MSCIE | −7.2902 | 0.0000 | −41.1184 | 0.0001 |
| BDI | −5.5706 | 0.0000 | −38.3640 | 0.0001 |
| After 1 Day | After 1 Week | After 2 Weeks | After 1 Month | |
|---|---|---|---|---|
| Impulse of COVID-19 cases on MSCI | −0.0093 | −0.0117 | −0.0142 | −0.0144 |
| Impulse of COVID-19 cases on BDI | −0.0095 | −0.0056 | −0.0028 | −0.0019 |
| Impulse of COVID-19 cases on MSCIE | −0.0165 | −0.0191 | −0.0245 | −0.0262 |
| After 1 Day | After 1 Week | After 2 Weeks | After 1 Month | |
|---|---|---|---|---|
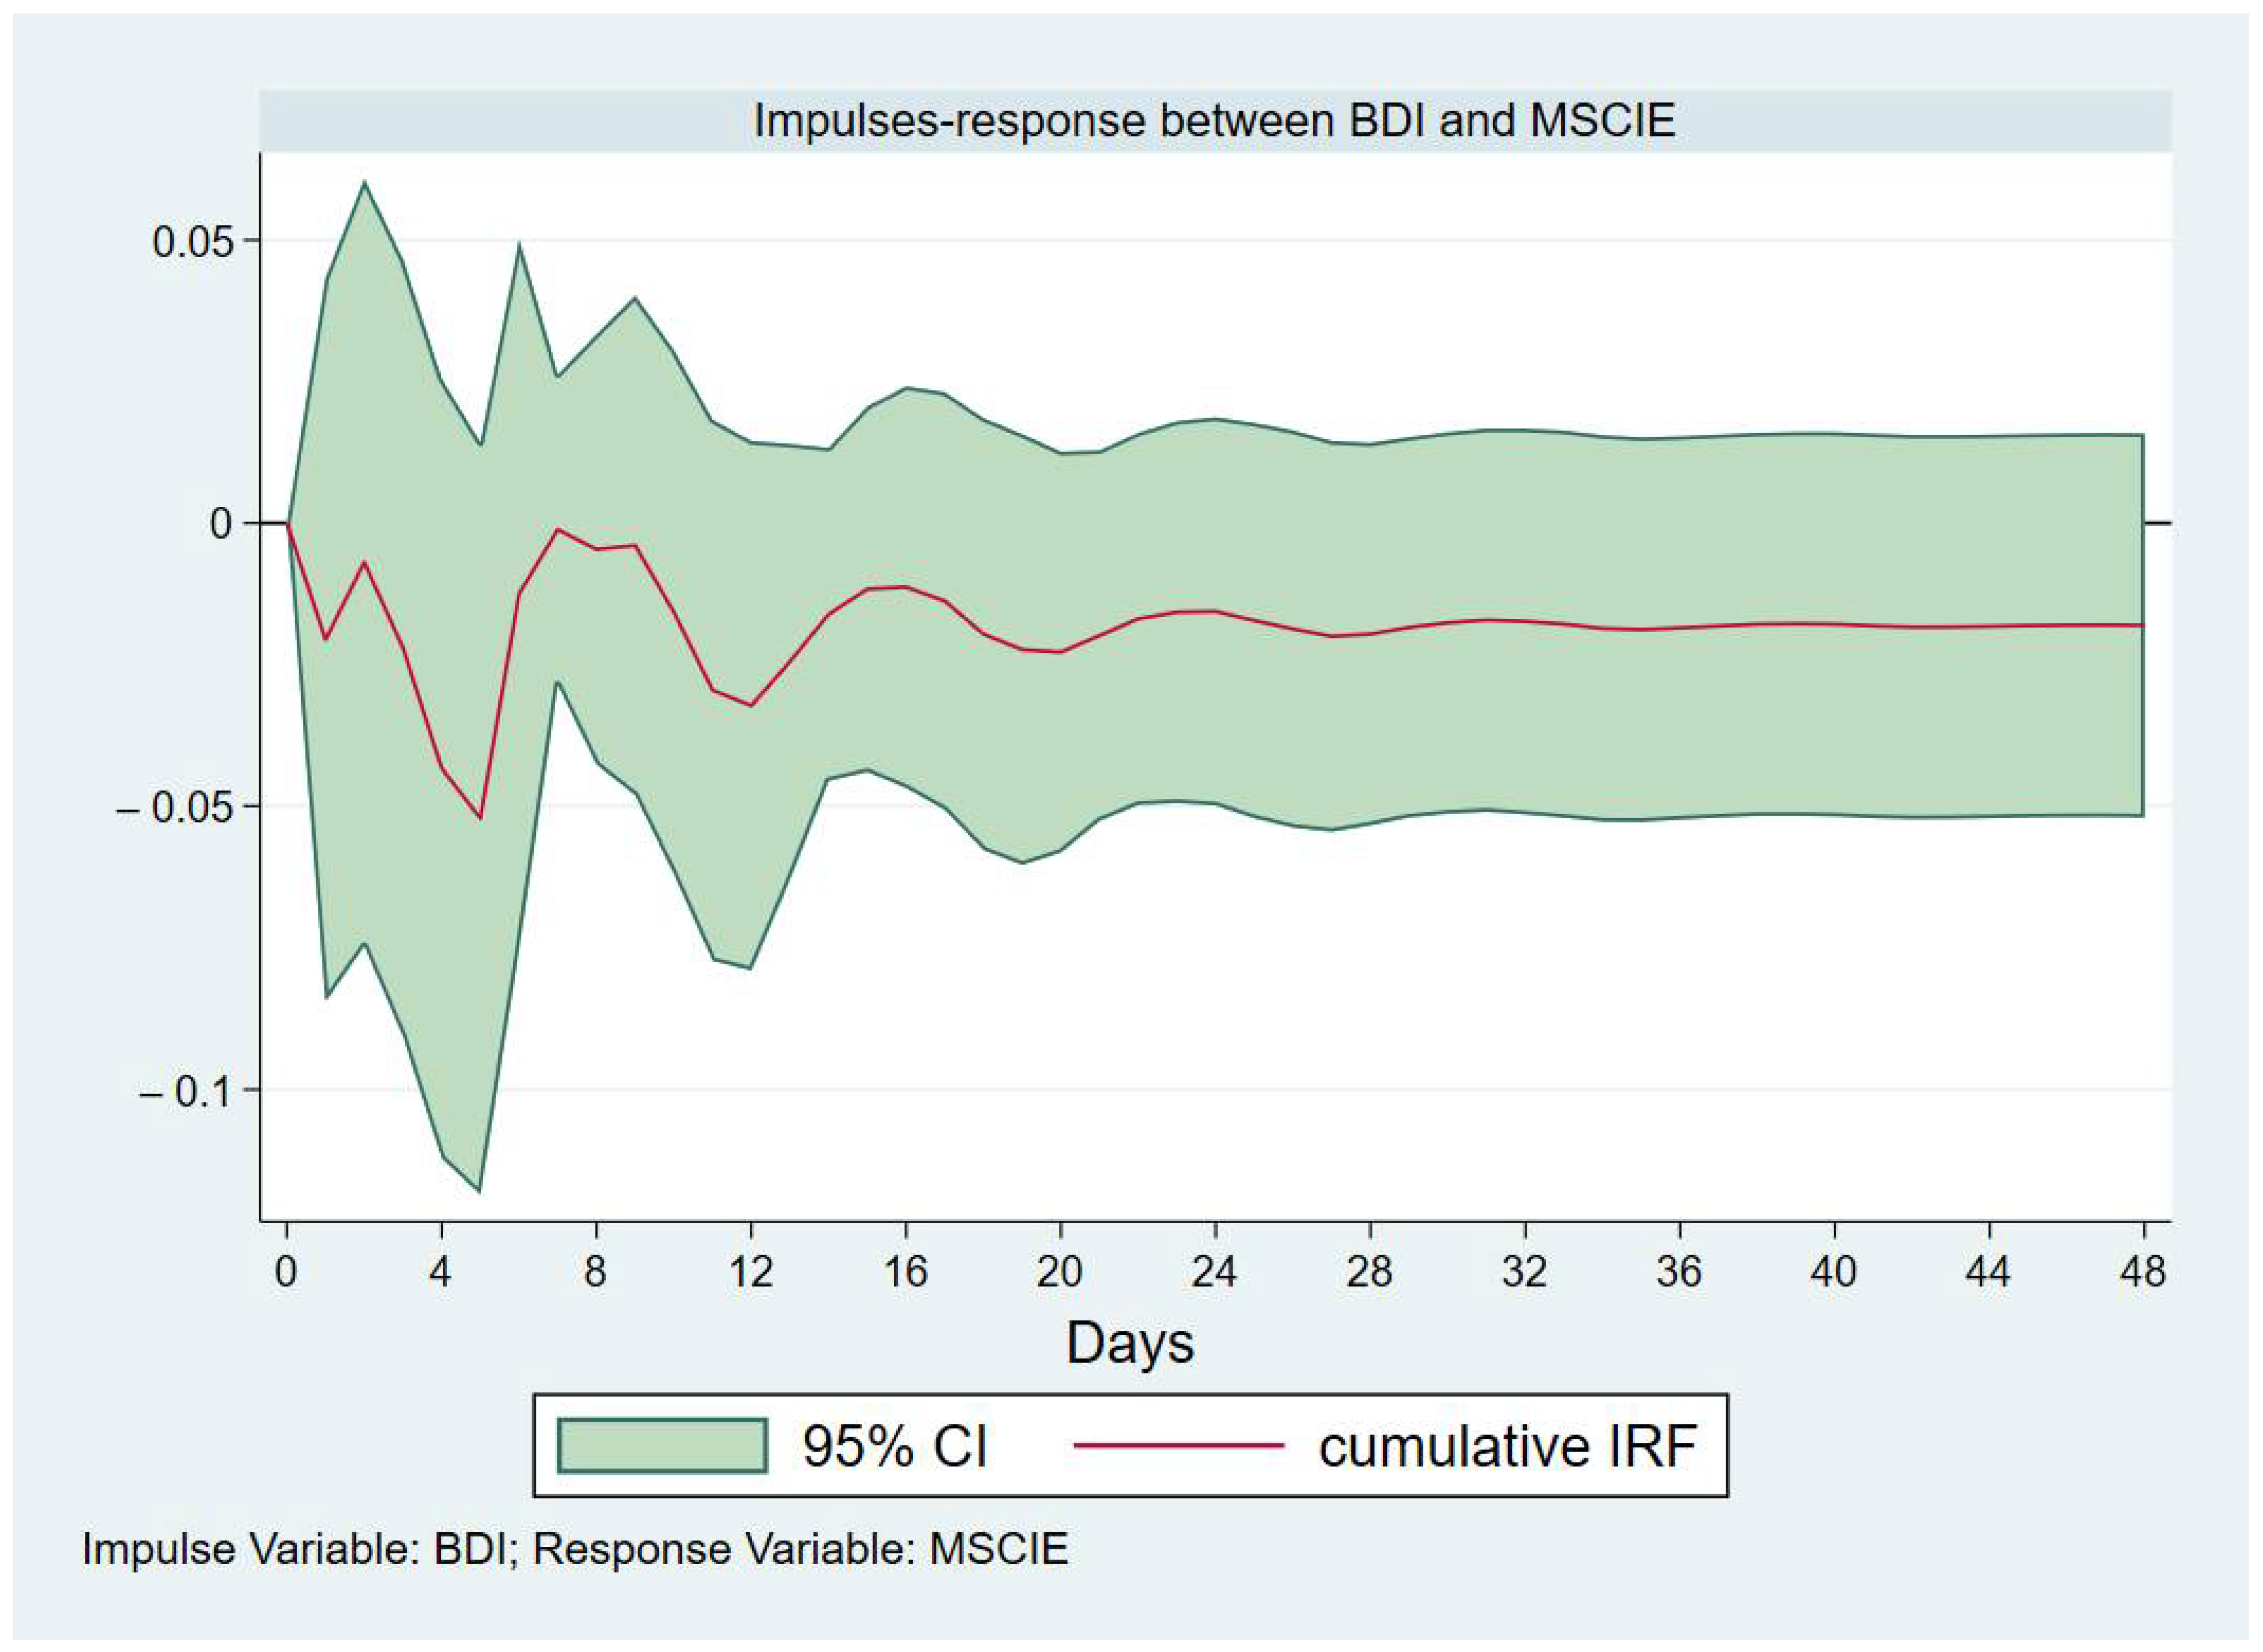
| Impulse of BDI on MSCI | −0.0261 | −0.0067 | −0.0065 | −0.0068 |
| Impulse of BDI on MSCIE | −0.0206 | −0.0012 | −0.0161 | −0.0176 |
Publisher’s Note: MDPI stays neutral with regard to jurisdictional claims in published maps and institutional affiliations. |
© 2021 by the authors. Licensee MDPI, Basel, Switzerland. This article is an open access article distributed under the terms and conditions of the Creative Commons Attribution (CC BY) license (https://creativecommons.org/licenses/by/4.0/).
Share and Cite
Hasan, M.B.; Mahi, M.; Sarker, T.; Amin, M.R. Spillovers of the COVID-19 Pandemic: Impact on Global Economic Activity, the Stock Market, and the Energy Sector. J. Risk Financial Manag. 2021, 14, 200. https://0-doi-org.brum.beds.ac.uk/10.3390/jrfm14050200
Hasan MB, Mahi M, Sarker T, Amin MR. Spillovers of the COVID-19 Pandemic: Impact on Global Economic Activity, the Stock Market, and the Energy Sector. Journal of Risk and Financial Management. 2021; 14(5):200. https://0-doi-org.brum.beds.ac.uk/10.3390/jrfm14050200
Chicago/Turabian StyleHasan, Md. Bokhtiar, Masnun Mahi, Tapan Sarker, and Md. Ruhul Amin. 2021. "Spillovers of the COVID-19 Pandemic: Impact on Global Economic Activity, the Stock Market, and the Energy Sector" Journal of Risk and Financial Management 14, no. 5: 200. https://0-doi-org.brum.beds.ac.uk/10.3390/jrfm14050200