
The Heterogeneous Impact of Financialisation on Economic Growth in the Long Run


Institute of Regional Development, Vilnius University Siauliai Academy, 76285 Šiauliai, Lithuania
*
Author to whom correspondence should be addressed.
J. Risk Financial Manag. 2021, 14(5), 209; https://0-doi-org.brum.beds.ac.uk/10.3390/jrfm14050209
Submission received: 25 March 2021
/
Revised: 15 April 2021
/
Accepted: 23 April 2021
/
Published: 5 May 2021
(This article belongs to the Special Issue Financial Development and Economic Growth)
Abstract
:Financialisation, i.e., the process by which financial markets and their participants gain more influence over the functioning of enterprises/companies and the framework of the financial system, changes the functioning of the economic system, both at the macro- and microeconomic level. There is no doubt that financialisation impacts economic growth. Still, research does not substantiate the heterogeneity of financialisation effects and does not provide a comprehensive analysis of the sources of heterogeneity. In most cases, researchers provide only theoretical insights into what may lead to different effects of financialisation on economic growth. This study empirically examines whether institutional quality and economic development intermediate the relationship between financialisation and economic growth using a panel of 96 countries over the period of 1996–2017 and least squares dummy variables (LSDV) estimator. We found that the impact of financialisation on economic growth differs across countries and that institutional quality and economic development are the sources of the heterogeneous impact of financialisation on economic growth.
JEL Classification:
O11; F631. Introduction
Financialisation is vital for economic growth. Along with neoliberalism, financialisation has found its place in the world (Barthold et al. 2017). The financial system’s share in economic, political, and social importance is growing, with increase in the volume of financial services provided to all economic entities and development of new financial instruments. Financialisation has changed the relationship between the financial sector and the real sector. The assets managed by companies and corporations are being transferred to the financial sector, as more and more attention is paid to shareholder value additions. Researchers have singled out several forms of financialisation: the development of financial markets (Godechot 2016; Hall and Soskice 2001; Streeck 2008; Greenwood and Scharfstein 2013), growth of the financial sector, non-financial corporations’ financialisation (Useem 1996; Fligstein 2002; Lapavitsas 2011, 2013; Heilbron et al. 2014), and households’ financialisation (Martin 2003; Montagne 2006). Financialisation can also be analysed from macro- and micro-level perspectives (Qi 2019). The influence of the financial sphere emerged in the 20th century, and its impact on economy is the subject of many debates.
The topic of financialisation is widely analysed theoretically and empirically by Levine (2001, 2003, 2005), Epstein (2005), Beck (2011), Loayza and Ranciere (2006), King and Levine (1993a, 1993b), and others. The literature (Levine et al. 2000; Demir 2007; Dore 2008; Hein 2012; Henderson et al. 2013; Andini and Andini 2014; Dávila-Fernández and Punzo 2019; and many more) points out the following problems of financialisation and related phenomena: what are the proxies of financialisation, what are the consequences of financialisation, what is the impact of financialisation on different economic subjects, what is the relationship between financialisation and other economic phenomena in the specific countries, etc.
As the phenomenon of financialisation results in various economic outcomes and changes, it can have not only a positive (Williams 2019; He et al. 2019; Nguyen 2019; Guru and Yadav 2019; Nazir et al. 2020) but also a negative (Law and Singh 2014; Arcand et al. 2015; Ibrahim and Alagidede 2018) effect on economic growth in the long run, and this effect can be heterogeneous. The impact of financialisation on economic growth is underpinned by a lot of research covering different panels of countries. However, the estimated impact of financialisation varies across countries, and thus it becomes essential to identify the sources of this heterogeneity. By identifying the sources of the heterogeneous financialisation growth nexus and by examining the impact of financialisation on economic growth, decisions can be made that would reduce the harmful effects of financialisation on the economy and stimulate economic growth.
Four groups of research have studied financialisation and its forms. The first group has analysed the impact of the growing financial sector on the economy (Beck et al. 2010; Arcand et al. 2015; Beck et al. 2014; Cheng et al. 2014; Durlauf et al. 2001; Favara 2003; Henderson et al. 2013; Levine 2003; Petkovski and Kjosevski 2014; Rioja and Valev 2004; Shen and Lee 2006; etc.), the second one—the impact of financial markets development on economic growth (Klein and Olivei 2008; Kose et al. 2009; Ferreira and Laux 2009; Chanda 2005; Choong et al. 2010; Henry 2003; Quinn and Toyoda 2008; etc.). Empirical research of these two groups suggests that financialisation is positively, negatively, non-linearly or insignificantly related to economic growth. However, research has not investigated why the impact of financialisation differs across studies. The third group (Leon 2016, 2019; Bezemer et al. 2016; Sassi and Gasmi 2014; Beck et al. 2012; Büyükkarabacak and Valev 2010; etc.) has studied the impact of households’ financialisation on economic growth. These studies raise much less discussion, as the results of the research are essentially the same—households’ financialisation has a negative effect on economic growth. The fourth group of research analyses the financialisation of non-financial corporations (Lazonick and O’Sullivan 2000; Krippner 2005; Orhangazi 2008; Onaran et al. 2011; Davis 2013; etc.). These studies are conducted at the microeconomic level, therefore, do not analyse the impact of the financialisation of non-financial corporations on economic growth.
There are relatively few studies that analyse the heterogeneous impact of financialisation on economic growth. In most cases, research only gives insights into the factors that may lead to the heterogeneous effect of financialisation, but they are not analysed empirically. Most often, research analyses how the impact of financialisation differs across different levels of development. Fufa and Kim (2018) found that the link between financialisation and economic growth depends on the countries’ economic development stages. Financialisation, as credit extends to the private sector, strongly boosts the economic growth of middle-income counties. Still, it has no discernible effect on high-income countries growth. According to Singh and Weisse (1998), the banking system’s measures lead to economic growth in less developed countries. In this context, the banking system is effective while boosting economic development because of two reasons. First, by having in-depth knowledge of their clients’ operations, banks can effectively assess credit risk, ex post, as well as monitor management performance during the investment process. Second, the banking system, with its focus on long-term relationships and lending, is capable of shielding the firm from instabilities in financial markets.
Greenwood and Jovanovic (1990) found that the relationship between the financial sector and economic growth is mediated by the initial level of income. Researchers developed a model of interactions between financialisation and economic growth where a country passes through a development cycle—from an agriculture stage to a developed fast-growing stage. At first, the country is in the agriculture stage, and economic growth is slow. During the early stage, the financial sector only mobilises savings and diversifies risk. However, as the levels of per capita income begin to increase, the financial intermediaries become more modern and accomplish costly functions of supervising investment and searching for cost-effective innovations. Finally, at the late stage, the country’s financial system growth is quite steady and quick and becomes fully developed. Furthermore, at first, the financial system is relatively closed, and access to financial markets is limited to a few wealthy individuals. However, as the economy grows at the aggregate level, the formal financial system becomes accessible to many people, with spill-over effects on economic growth. Under other conditions, the increase in the level of income determines the demand for financial services, agents improve financial intermediation, thus increasing the impact of financial systems on economic growth. This presents a bidirectional relationship between the financial sector and growth, where a higher income level stimulates the financial sector, which, in turn, accelerates overall economic growth. Thus, financialisation has a disproportionately positive impact on growth in higher-income countries, while no significant effect on the economies in relatively low-income countries is observed (Ibrahim and Alagidede 2017).
Berthelemy and Varoudakis (1996) argue that economies with low educational levels are stuck in low-development equilibrium and cannot reap the benefits of financial sector development. Consequently, the weak competition causes a low savings level and a “quiet” financial sector in these countries. Conversely, countries with high levels of education are characterised by a well-developed financial sector and thus enjoy the benefits of higher savings and investment. Ibrahim and Alagidede (2017) show that growth is insensitive to the impact of financialisation at a low education level, but after exceeding a threshold level of education, financialisation significantly drives growth. It is possible that for countries with low human capital endowment, innovation, and constrained technological advancement, accessibility to the financial sector and financial inclusion is minimal, and the development of the financial sector is low, which, in turn, affects growth. However, as the education level increases, agents’ risk-taking behaviour may change, raising credit and investment demand and accelerating the development of the financial system. Higher education encourages innovation, creativity, and technology, thus improving financial intermediation and financial sector efficiency, which boosts economic growth.
The heterogeneous impact of financialisation can be caused by the specialisation of countries, which is one of the factors determining the development of the country’s economy. It is considered that a larger service sector signals a higher level of development. Ibrahi and Cheng et al. (2014) found that in less-developed industrial countries, financialisation retards output and economic growth by damaging investment rates, resource misallocation, as well as magnifying macroeconomic instability.
Research (Demetriades and Rousseau 2016; Caglayan et al. 2017; Rousseau and Wachtel 2017; Lim 2018; etc.) also identifies institutional quality as a potential determinant of the heterogeneous effect of financialisation on economic growth, but there are not enough empirical studies to support this. Research points out that various aspects of the institutional quality can lead to a heterogeneous effect of financialisation: the rule of law (Haque et al. 2008; Graff 2012; Caporale et al. 2015; etc.), control of corruption (Kane 1993; Khemani and Meyerman 1998; Song et al. 2021; etc.), democracy and political stability (Beck and Honohan 2007; etc.). According to Singh and Weisse (1998), the impact of financialisation on economic growth in India, Mexico, China, and Turkey has not been as strong as in East Asia and Europe for a variety of reasons. These reasons included, in particular, poor regulation and supervision, monopoly abuses, and corruption. In a country with good institutional quality, there are more constraints and restrictions on politicians, more supervisors, so credit is directed to productive investment. Meanwhile, the poor quality of the institutional environment is associated with fewer restrictions on political activity and a lack of control, leading to a shift of credit to unproductive but more politically favourable investments. The closest to our research is the study of Williams (2019), who analysed the effect of institutional quality on financialisation-growth nexus. The results suggest that financialisation has a negative impact on economic growth, but the high institutional quality reduces the negative effect.
This study aims to test the hypothesis that the heterogeneous impact of financialisation on long-run economic growth simultaneously depends on countries’ level of development and institutional quality. The rest of the paper is organised as follows: Section 2 develops the specification of the model, data, and estimation strategy. Section 3 presents the empirical results. The last section concludes the paper.
2. Methodology
The model to assess the heterogeneous impact of financialisation on long-run economic growth is developed based on the neoclassical growth equation. The model for examining economic growth outcomes of financialisation can be specified as follows:
where measures an average yearly (from period t up to T) rate of economic growth for a cross-sectional unit i. Fi,t is the level of financialisation over the initial period t, Cj,i,t is a set of controls usually included in growth equations. j represents the j-th control variable. μi are time-invariant, i.e., country-fixed effects, while φt represents the time dummies and εi,t is the error term under classical assumptions. b0, b1, cj are parameters to be estimated.
The aim of this paper is to evaluate not only the constant (unconditional) impact of financialisation on economic growth but also the heterogeneous effect, which is simultaneously moderated by the country’s development level and institutional quality. Thus, our equation includes variables to serve as proxy of the country’s development level, institutional quality, their interaction terms, and terms of interaction with the financialisation. The general model used in this study can be specified as follows:
where Di,t is a term used to proxy a country’s development level, Ii,t is a term that represents institutional quality, multiplicative terms Ii,tDi,t represent the simultaneous effect of institutional quality and country’s development level on growth. Multiplicative terms Fi,tIi,t, Fi,tDi,t, and Fi,tIi,tDi,t models the moderating effects of institutional quality and the country’s development level separately and simultaneously on the financialisation-growth nexus. The non-constant financialisation–growth relationship and for any given values of Ii,t and Di,t can be estimated by:
where a composite term in the brackets expresses the conditional marginal effect of Fi,t on gri,t→T, i.e., the impact of financialisation on growth for any particular combination of values for Ii,t and Di,t.
Following Wright (1976), Friedrich (1982), and Leona and West (1991), it can be argued that not just the slope of gri,t→T on Fi,t varies depending on the values of Di,t, Ii,t and their interaction, i.e., Ii,tDi,t, as Equation (3) shows, but also the standard error associated with this slope. According to Butkus et al. (2020), the standard error of the estimated composite term is:
Following the usual logic, t value for a composite term that expresses the effect of financialisation on growth, which is moderated by institutional quality and country’s development level, can be found as:
Since estimated composite term , as well as the standard errors associated with the tesp, are not constant as Equation (4) shows, this also implies that there could be a combination of country’s development level and institutional quality over which the estimated effect of financialisation on economic growth is positive and levels over which this effect is negative, and a combination which leads to statistically significant/insignificant effect of financialisation on economic growth.
This study uses panel data covering 96 countries between 1996 and 2017. The list of countries is presented in Table A1 (see Appendix A). We use a 10-year overlapping forward-looking average growth rate as a dependent variable (gr). This study is limited to analysing only one aspect of financialization—financial deepening. Thus, we proxy financialisation by one of the most frequently used indicators, i.e., domestic credit provided by the financial sector as a percentage of GDP (Cfs). Cfs refers to financial resources provided to the private sector by the financial sector, such as through loans, purchases of non-equity securities, and trade credits and other accounts receivable, that establish a claim for repayment. The financial sector includes monetary authorities and deposit money banks, as well as other financial corporations where data are available. This variable has been used as a proxy for financialisation by Lee and Cheng (2011), Rana and Barua (2015), Patra and Dastidar (2018). Though research uses other indicators of financialisation, such as banking assets to GDP, gross value-added of the financial sector to GDP, M2 to GDP and others, domestic credit provided by the financial sector to GDP is available for a larger number of diverse economies. Institutional quality is approximated using six alternative indexes: control of corruption (CC), political stability and absence of violence/terrorism (PS), regulatory quality (RQ), the rule of law (RL), voice and accountability (VA), government effectiveness (GEf). Four alternative indicators measure the country’s development level: secondary school enrollment (E2), tertiary school enrollment (E3), size of the service sector (S), GDP per capita (Y). Additionally, control variables are included to capture other growth factors (see Table 1 for the full list of variables measurement unit and descriptive statistics of the raw data). Our specification includes eight growth control variables—initial per capita GDP (Y), secondary school enrollment (E2), tertiary school enrollment (E3), trade openness (O), inflation (I), gross fixed capital formation (GFCF), general government final consumption expenditure (GE), and population growth (Pop_gr). Data on the variables are sourced from the World Bank’s World Development Indicators database, the World Bank’s World Governance Indicator’s database, and the World Bank’s Global Financial Development database.
To evaluate the effect of financialisation on long-run economic growth, we use a 10-year overlapping forward-looking average growth rate as a dependent variable. Using one-year growth rates allows us to maximise the sample size. However, this strategy implies that the estimates of the parameters of the equation will be affected by the cyclicality and endogenous nature of economic growth, as the financialisation in relation to economic growth would be delayed only by one period. These problems are usually solved by setting T = 10 and calculating the impact of the current level of financialisation and other factors on the average annual growth rates of non-overlapping periods over the next ten years. Because the current or projected rate of economic growth for the next year affects financialisation, ten-year average growth rates may, to some extent, prevent this reverse causality. However, at the same time, this strategy significantly reduces the sample size. As an alternative, we use overlapping periods of economic growth of ten years.
According to the methodology for calculating institutional quality indices, indices can acquire values in the range [−2.5; 2.5]. For these indicators to have only a positive value and to have the possibility of logarithmic transformation, we applied the additive transformation, i.e., added 2.5 to each indicator of institutional quality used in the study. In the specification, we use the logarithm of financialisation, level of development, indicators of institutional quality, and other economic growth factors, with the exception of inflation and population change. The specification also includes the square of gross capital formation to model the non-linear nexus between investment economic growth, i.e., diminishing marginal effect on economic growth.
There are 24 estimations of Equation (2) to assess the heterogeneous impact of financialisation on long-term economic growth, where different combinations of variables to proxy the country’s development level and institutional quality are used for the robustness check. We use the LSDV estimator. Since panel data have both a time-series and a cross-sectional dimension, it requires handling both heteroskedasticity and autocorrelation. Our estimations are based on stabilised residual error regression when standard errors and thus t-ratio and p-values are rescaled according to autocorrelation and heteroskedasticity problems. The results of the estimations are presented in Appendix B. Estimations are accompanied by reliability criteria, which show that the estimations are reliable and well-suited to the data. The adjusted R-squared values are greater than 0.25, and the obtained F-values are greater than the critical one with p-values less than 0.05.
3. Results
3.1. The Dynamic of Financialisation and Long-Run Economic Growth
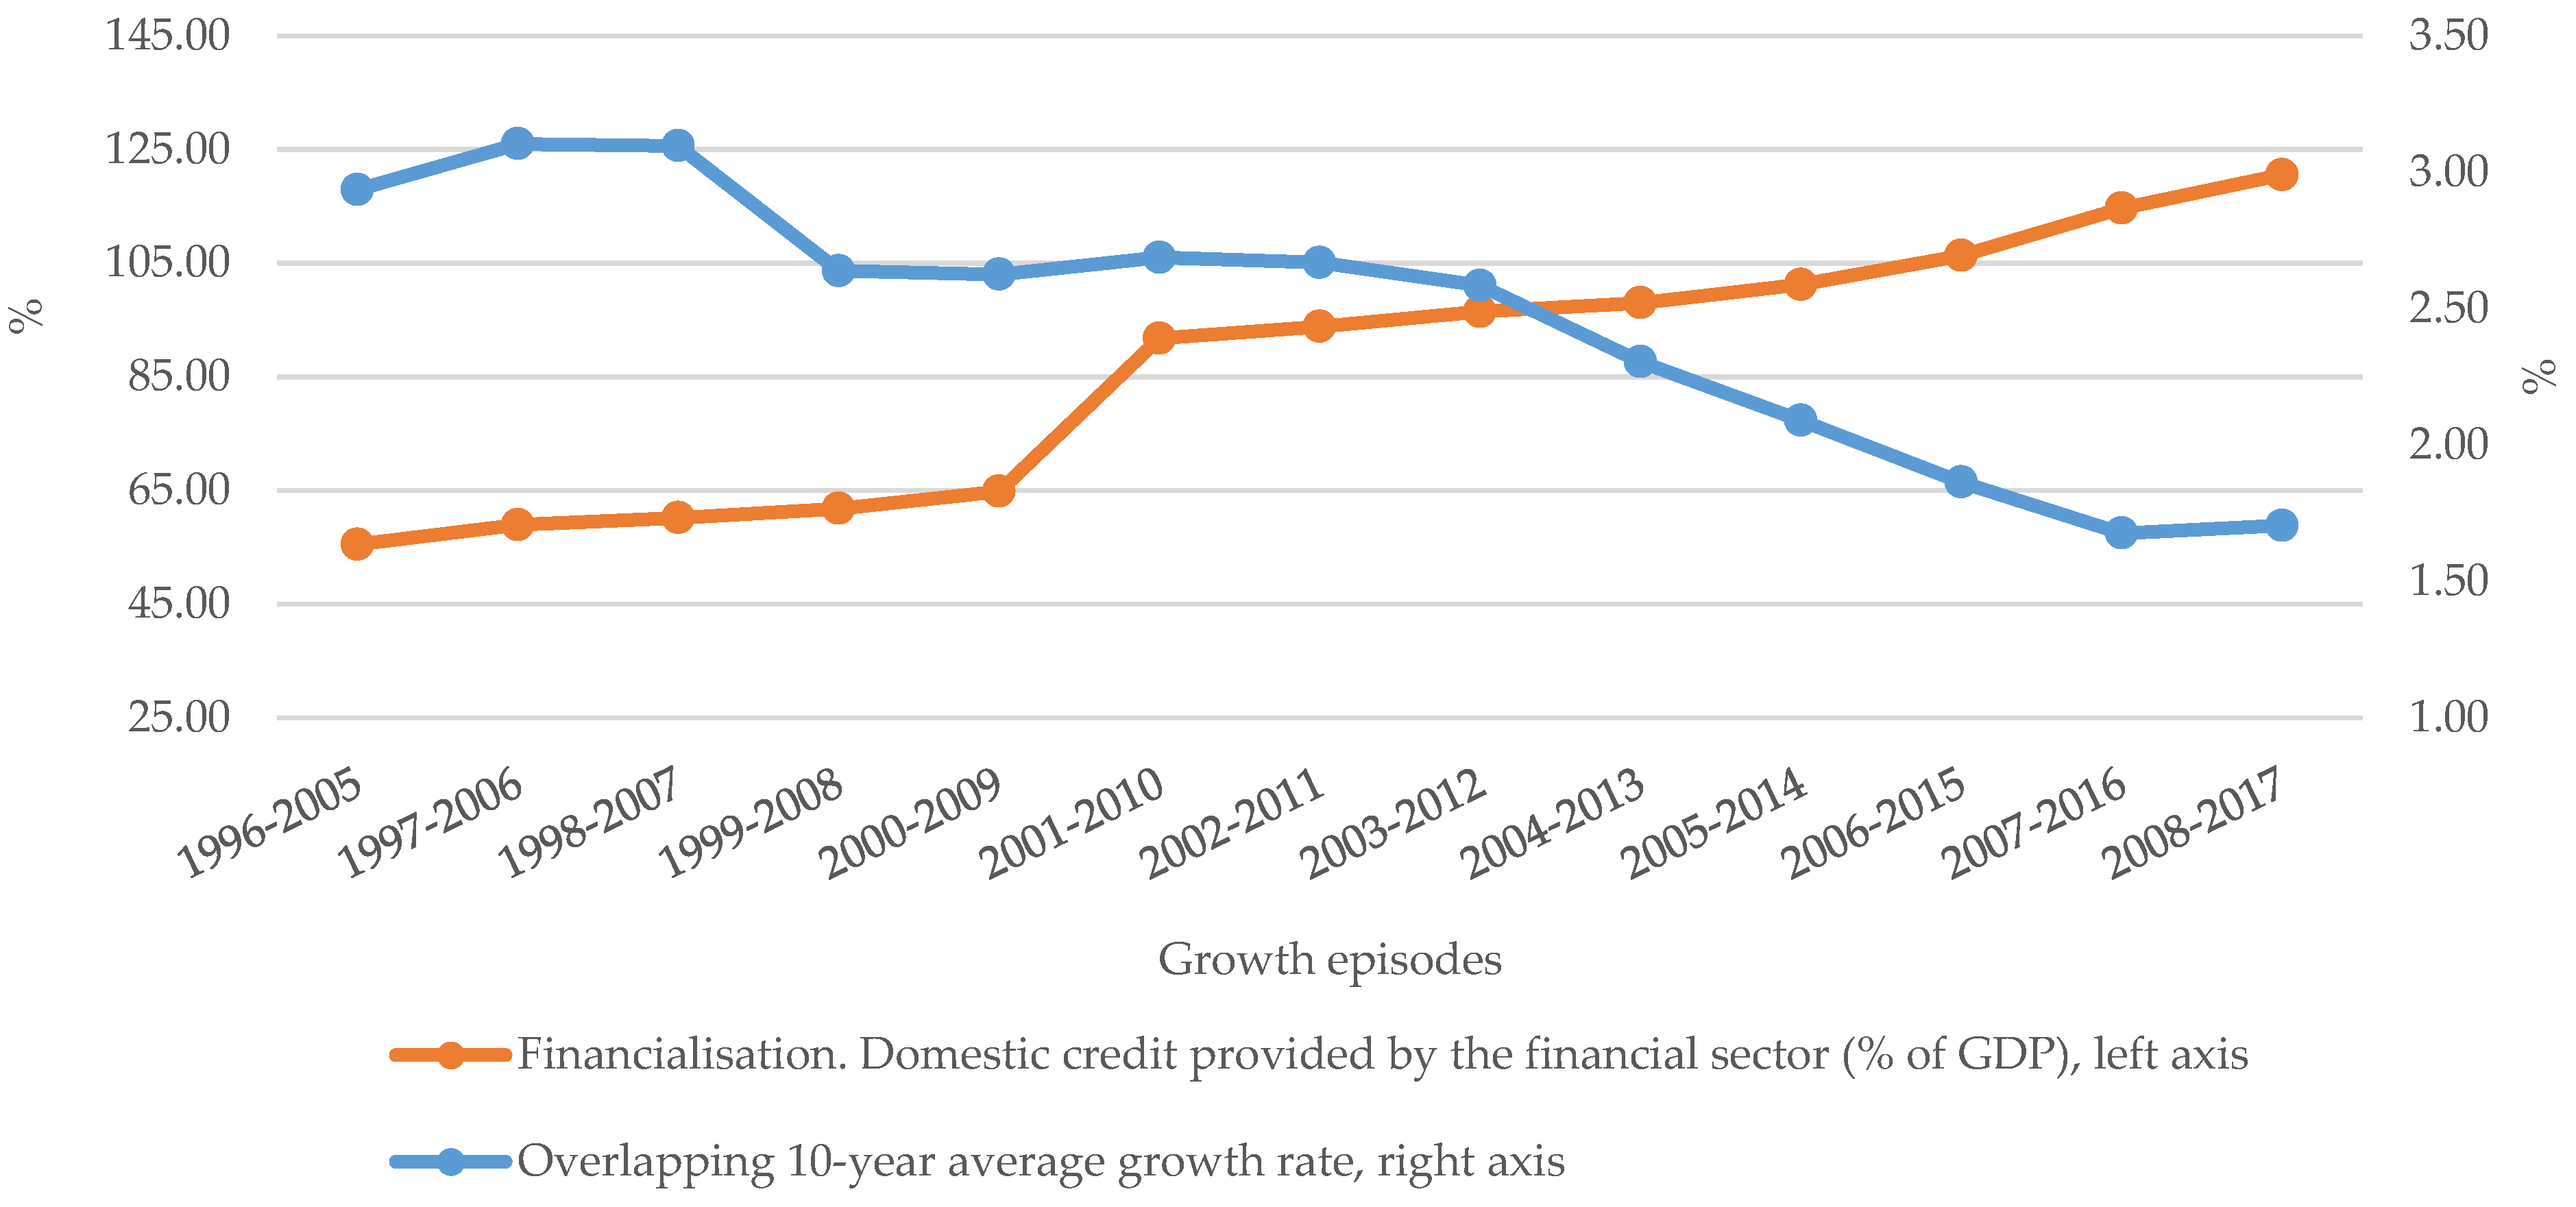
We start the examination of financialisation and long-run growth by analysing the dynamic of these two phenomena. Figure 1 shows that extent of the financialisation tended to grow: from 1996 until 2000, financialisation grew, but the rate of growth was not rapid. From 2000 until 2001, financialisation increased the most, i.e., by 26.93 percentage points (p.p.). Growth of financialisation slowed down after 2001 with the fastest growth rate over 2004–2008—domestic credit provided by the financial sector increased by 22.52 p.p. and reached the highest level in 2008. The domestic credit provided by the financial sector during the analysed period increased by 64.99 p.p. and the average was 86.46 per cent of GDP in analysed countries.
The highest level of financialisation was in Cyprus, where the average of the domestic credit provided by the financial sector during the analysed period was 220.34 per cent of GDP, since 1996 financialisation increased in 69 analysed countries and decreased in 23. The highest increase was in Iceland (by 238.48 p.p.), while Macao had the highest decrease (by 75.74 p.p.). The lowest level of financialisation was in Benin—averaged 7.82 per cent of GDP.
The overlapping 10-year average growth rates are positive, which means that the economy has been growing over the long term. The fastest economic growth over the studied period was in 1997–2006 when the economy grew on average by 3.10 per cent per year. The slowest average economic growth rate was over 2007–2016 when the economy grew on average by a 1.68 per cent a year. Assessing the average growth rates over 10-year periods, we see that the growth rates trend is the opposite of financialisation: economic growth rates are slowing down.
Assessing the economic growth, it was found that the overlapping 10-year average growth rates were negative in five countries: Brunei (−0.59%), New Zealand (−0.29%), Algeria (−0.26%), The Netherlands (−0.19%), and Norway (−0.06%). In Hungary, the level of the economy has not changed, while in the remaining countries, the economic growth rate has been positive. The highest 10-year average economic growth rates were in Indonesia (averaging 6.56 per cent), Brazil (6.36 per cent), and Vanuatu (6.01 per cent).
3.2. The Nexus between Financialisation and Long-Run Economic Growth
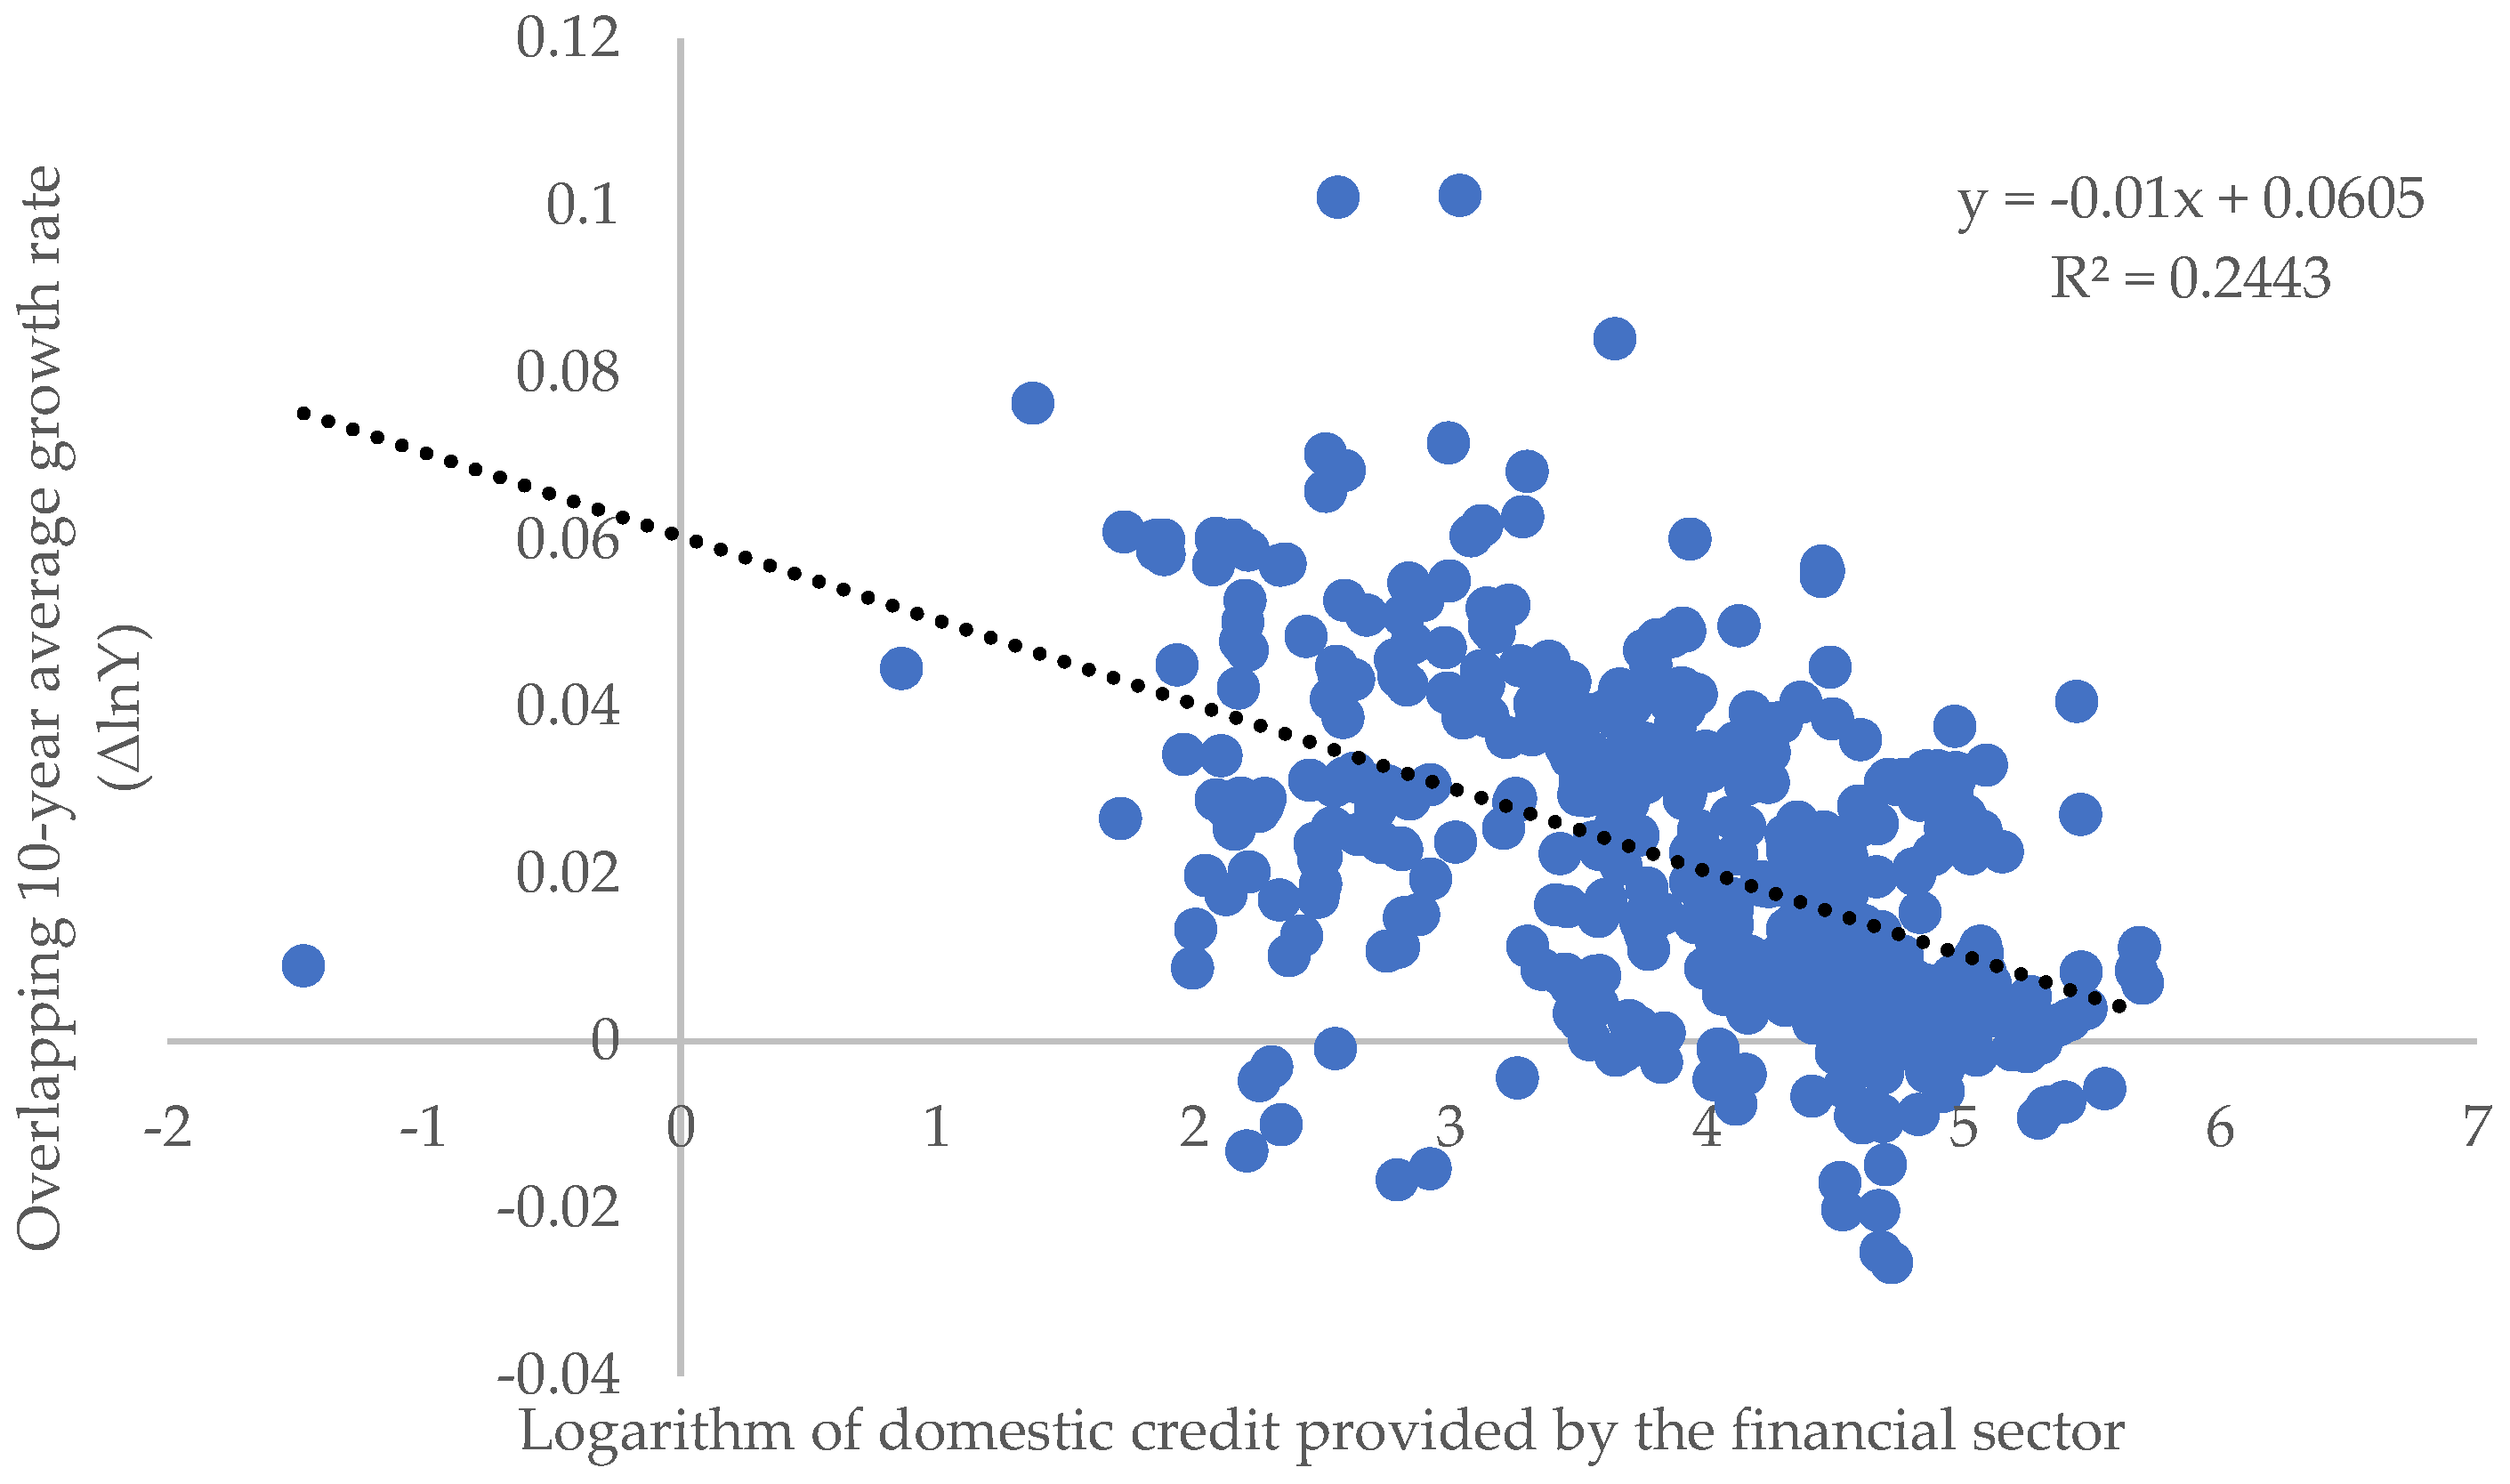
Long-run economic growth and financialisation are two specific but potentially interrelated phenomena. The calculated Pearson’s correlation coefficient between domestic credit provided by the financial sector and long-run economic growth (−0.494; 2-tailed p-value < 0.0001) shows a statistically significant inverse medium-strength relationship.
Figure 2 plots the relationship between financialisation and long-term economic growth. We see that the larger the financialisation, the slower the economic growth, like most research works have has found (Law and Singh 2014; Arcand et al. 2015; Ibrahim and Alagidede 2018, etc.). The estimated coefficient from the simple regression equation shows that the increase of domestic credit provided by the financial sector by 1 p.p. is associated with the slowdown of economic growth by 0.01 per cent.
A weak relationship between long-run economic growth and financialisation in a linear setting can be caused by several reasons. Firstly, the effect of financialisation on economic growth may occur already in the short run. Therefore, by analysing 10-year growth episodes, some short-run effects could be missed. Secondly, it can be assumed that there is a non-linear relationship between the studied phenomena. The non-linearity of the impact of financialisation may arise because other factors moderate the effect of financialisation.
3.3. The Heterogeneous Impact of Financialisation on Long-Run Economic Growth
The estimation results of Equation (2) using different combinations (24 in total) of variables to proxy the country’s development level and institutional quality are presented in Appendix B. The estimated coefficients for the control variables are in line with the economic theory and previous contributions. The estimated coefficient on GDP per capita ranges from −0.00655 to −0.01173 and appears to be statistically significant at 99 per cent in all estimations. This indicates that there is a conditional beta–convergence between countries and the convergence rate ranges from 0.7 up to 1.17 per cent per year. The share of the population with secondary education has a statistically insignificant effect on economic growth. The share of the population with tertiary education has a positive and statistically significant effect on economic growth. The same is true for trade openness. The effect of inflation on economic growth is estimated as negative and significant. We modelled a non-linear relationship between investment (gross fixed capital formation) and economic growth. Estimation results show that the effect of investment on long-run economic growth is positive over the whole range of the observed values. General government final consumption expenditures have a negative impact on economic growth. The same effect is found for population growth, but in some estimations, it was statistically insignificant.
Since the specification of Equation (2) assumes the conditional effect of financialisation on growth, after estimating the equation with different variables to proxy institutional quality and development level, we calculated the slope of growth on financialisation over the range of the observed values of proxies using Equation (3). The standard errors (Equation (4)) and t-values (Equation (5)) are calculated to determine which level of institutional quality and development is associated with the statistically significant effect of financialisation on growth for the different combinations of variables to proxy these mediators (see Appendix C). The impact (positive/negative) of financialisation on long-term economic growth according to estimated slopes and their statistical significance are summarised in Table 2 for relatively good/bad institutional quality and relatively high/low development level.
Table 2 is compiled using data provided in Figure A1, Figure A2, Figure A3, Figure A4, Figure A5, Figure A6, Figure A7, Figure A8, Figure A9, Figure A10, Figure A11, Figure A12, Figure A13, Figure A14, Figure A15, Figure A16, Figure A17, Figure A18, Figure A19, Figure A20, Figure A21, Figure A22, Figure A23 and Figure A24, which are presented in Appendix C. All 24 estimations identified a statistically significant effect of financialisation on long-run economic growth. Still, the effect’s direction and significance depend on the country’s development level, institutional quality, and the variables used to proxy them.
In countries with a lower level of development and relatively bad institutions, the effect of financialisation is positive and statistically significant. These results are based on a combinations of proxies—value added in the service sector with control of corruption, government effectiveness, regulatory quality, and voice and accountability. Using combinations of GDP per capita with control of corruption and GDP per capita with government effectiveness, the effect in the same group of countries is negative and statistically significant. In countries with a lower level of development but relatively good institutions, the effect of financialisation is negative and statistically significant when combinations of secondary school enrollment with political stability, GDP per capita with control of corruption, government effectiveness, political stability, and absence of violence/terrorism or regulatory quality are used. In countries with a higher level of development and relatively good institutions, the effect of financialisation is negative and statistically significant, using almost all combinations of proxies. Only when a combination of secondary school enrollment with voice and accountability is used, the impact of financialisation on growth is positive and significant. In countries with a higher level of development and relatively bad institutions, the effect of financialisation is similar to the impact in countries with a higher level of development and relatively good institutions, except for a few combinations of proxies when the insignificant effect has been identified. It could mean that the institutional environment is not as important in more developed countries as in less developed ones. Moreover, developed countries usually have better institutions and much lower cross-country variation of this characteristic compared to less-developed ones.
In less-developed countries, credits are directed towards investments in the real sector to improve its productivity and quality, and thus financial sector contributes to economic growth. Meanwhile, in more developed countries, a bigger proportion of savings are invested in stock markets to profit and create shareholder value. In highly developed countries, resources are shifted from the manufacturing sector to the financial sector, resulting in a negative impact of financialisation on economic growth. In less-developed countries, financialisation creates new opportunities for savers and investors and thus stimulates economic growth. This is consistent with what has been previously found by Dabla-Norris et al. (2015), Lapavitsas (2011, 2013), Orhangazi (2008), Hecht (2014), and De Gregorio and Guidotti (1995). We expected that our findings would be consistent with the study by Williams (2019), who found that institutional quality reduces the negative impact of financialisation on economic growth. However, we did not find differences in the impact of financialisation depending on the institutional quality after controlling heterogeneity of the effect imposed by the development level. It is likely that the level of development of the country has a stronger impact on the effect of financialisation on economic growth than institutional quality.
The study results show that more developed countries, regardless of their institutional quality, most likely experience a negative effect of financialisation on long-run economic growth. However, in countries with a lower level of development, we, in the majority of cases, find a statistically significant positive effect. The fact that the effect of financialisation, mediated by institutional quality, level of development, and interaction using the same proxies, differs across countries, shows that the effect on long-run growth is heterogeneous and depends on variables used to proxy the country’s development level and institutional quality. This finding, to some extent, explains the ambiguous conclusions of previous research.
4. Conclusions
Though there have been many attempts to study the relationship between financialisation and economic growth, this study contributes to the literature by examining the heterogeneous impact of financialisation on long-run economic growth. To the best of our knowledge, there is no other study in which the effect of financialisation on economic growth is examined by considering two simultaneous mediators and their interaction.
This study contributes to the methodological approaches used to estimate the effect of financialisation by augmenting a traditional model with a three-way multiplicative term. Contrary to previous research, which only allowed to estimate the effect of the financialisation on growth directly in different groups of countries, this study contributes to the direct estimation of the variability of the financialisation, which depends on the factors that could mediate the effect of financialisation. The suggested specification of the model and the computation of conditional standard errors could contribute to the analysis of any mediating factor.
Aiming to evaluate the heterogeneous effect of financialisation on long-run economic growth and by computing the conditional marginal effects and their standard errors, we showed that it is possible to find the positive and negative as well as significant and insignificant effect of financialisation in different countries.
The findings of the research support the view that the impact of financialisation on long-run economic growth is heterogeneous. In addition, we find evidence that the source of heterogeneity is the country’s development level and institutional quality, which work simultaneously. Using different combinations of proxies for institutional quality and level of development, we found that more developed countries, regardless of their institutional quality, experience a negative effect of financialisation on long-run economic growth. If investments are directed to stock markets to profit and create shareholder value, resources are shifted from the manufacturing sector to the financial sector, which has a negative impact on economic growth. Contrary, in countries with a lower development level, a positive and statistically significant effect was found. Since credit is channelled to investment in the service sector or the real sector to improve productivity and quality, the financial sector, by providing new opportunities for savers and investors, stimulates economic growth. In many cases, in relatively less-developed countries, the effect of financialisation, mediated by the interaction between secondary school enrollment or tertiary school enrollment and institutional quality indicators, is insignificant. The country’s level of development likely has a stronger impact on the effect of financialisation on economic growth than institutional quality. However, this study did not intend to investigate which factor has a stronger mediating effect on the financialisation-growth nexus. Moreover, including other variables of financialisation and other mediating factors could be considered as the scope for further research.
The results of this paper point out some policy recommendations. For developing countries, financialisation can be a driving force for economic growth. It is more common in countries with a lower development level to find a positive and statistically significant effect of financialisation, which is mediated by the interaction between the size of the service sector and institutional quality. Thus, it is important to allocate financial resources properly and direct investment to the service sector to stimulate its growth. In developed countries, financialisation has a positive effect on long-run economic growth only when it is driven by the interaction of secondary school enrollment and voice and accountability. Thus, for developed countries, other sources of heterogeneity that could reduce the negative effects of financialisation on economic growth should be sought.
Author Contributions
Conceptualisation, A.S.; methodology, M.B.; validation, M.B.; formal analysis, A.S.; data curation, A.S.; writing—original draft preparation, A.S. and M.B; writing—review and editing, A.S. and M.B; visualisation, A.S.; supervision, M.B. Both authors have read and agreed to the published version of the manuscript.
Funding
This research received no external funding.
Data Availability Statement
Publicly available datasets were analysed in this study. This data can be found here: The World Bank’s World Development Indicator’s database [https://databank.worldbank.org/source/world-development-indicators] (accessed on 6 February 2021), the World Bank’s World Governance Indicator’s database [https://info.worldbank.org/governance/wgi/] (accessed on 6 February 2021), and the World Bank’s Global Financial Development Database [https://www.worldbank.org/en/publication/gfdr/data/global-financial-development-database] (accessed on 6 February 2021).
Conflicts of Interest
The authors declare no conflict of interest.
Appendix A

Table A1.
List of Countries.
| Country Code | Country | Region | Income Group |
|---|---|---|---|
| ALB | Albania | Europe & Central Asia | Upper middle income |
| ARM | Armenia | Europe & Central Asia | Lower middle income |
| AUS | Australia | East Asia & Pacific | High income |
| AUT | Austria | Europe & Central Asia | High income |
| BEL | Belgium | Europe & Central Asia | High income |
| BEN | Benin | Sub-Saharan Africa | Low income |
| BFA | Burkina Faso | Sub-Saharan Africa | Low income |
| BGD | Bangladesh | South Asia | Lower middle income |
| BGR | Bulgaria | Europe & Central Asia | Upper middle income |
| BHR | Bahrain | Middle East & North Africa | High income |
| BRA | Brazil | Latin America & Caribbean | Upper middle income |
| BRB | Barbados | Latin America & Caribbean | High income |
| BRN | Brunei | East Asia & Pacific | High income |
| BTN | Bhutan | South Asia | Lower middle income |
| BWA | Botswana | Sub-Saharan Africa | Upper middle income |
| CHE | Switzerland | Europe & Central Asia | High income |
| CHL | Chile | Latin America & Caribbean | High income |
| COL | Colombia | Latin America & Caribbean | Upper middle income |
| CPV | Cabo Verde | Sub-Saharan Africa | Lower middle income |
| CYP | Cyprus | Europe & Central Asia | High income |
| CZE | Czech Republic | Europe & Central Asia | High income |
| DNK | Denmark | Europe & Central Asia | High income |
| DZA | Algeria | Middle East & North Africa | Upper middle income |
| ESP | Spain | Europe & Central Asia | High income |
| EST | Estonia | Europe & Central Asia | High income |
| FIN | Finland | Europe & Central Asia | High income |
| FRA | France | Europe & Central Asia | High income |
| GBR | United Kingdom | Europe & Central Asia | High income |
| GHA | Ghana | Sub-Saharan Africa | Lower middle income |
| GIN | Guinea | Sub-Saharan Africa | Low income |
| GRC | Greece | Europe & Central Asia | High income |
| GTM | Guatemala | Latin America & Caribbean | Lower middle income |
| HKG | Hong Kong | East Asia & Pacific | High income |
| HRV | Croatia | Europe & Central Asia | High income |
| HUN | Hungary | Europe & Central Asia | High income |
| IDN | Indonesia | East Asia & Pacific | Lower middle income |
| IRL | Ireland | Europe & Central Asia | High income |
| IRQ | Iraq | Middle East & North Africa | Upper middle income |
| ISL | Iceland | Europe & Central Asia | High income |
| ISR | Israel | Middle East & North Africa | High income |
| ITA | Italy | Europe & Central Asia | High income |
| JAM | Jamaica | Latin America & Caribbean | Upper middle income |
| JOR | Jordan | Middle East & North Africa | Upper middle income |
| KAZ | Kazakhstan | Europe & Central Asia | Upper middle income |
| KEN | Kenya | Sub-Saharan Africa | Lower middle income |
| KGZ | Kyrgyz Republic | Europe & Central Asia | Lower middle income |
| KHM | Cambodia | East Asia & Pacific | Lower middle income |
| KOR | Korea Republic | East Asia & Pacific | High income |
| LAO | Lao PDR | East Asia & Pacific | Lower middle income Upper middle income |
| LCA | St. Lucia | Latin America & Caribbean | |
| LTU | Lithuania | Europe & Central Asia | High income |
| LUX | Luxembourg | Europe & Central Asia | High income |
| LVA | Latvia | Europe & Central Asia | High income |
| MAC | Macao SAR, China | East Asia & Pacific | High income |
| MAR | Morocco | Middle East & North Africa | Lower middle income |
| MDA | Moldova | Europe & Central Asia | Lower middle income |
| MDG | Madagascar | Sub-Saharan Africa | Low income |
| MEX | Mexico | Latin America & Caribbean | Upper middle income |
| MKD | Macedonia, FYR | Europe & Central Asia | Upper middle income |
| MLI | Mali | Sub-Saharan Africa | Low income |
| MLT | Malta | Middle East & North Africa | High income |
| MNG | Mongolia | East Asia & Pacific | Lower middle income |
| MRT | Mauritania | Sub-Saharan Africa | Lower middle income |
| MUS | Mauritius | Sub-Saharan Africa | Upper middle income |
| MWI | Malawi | Sub-Saharan Africa | Low income |
| MYS | Malaysia | East Asia & Pacific | Upper middle income |
| NER | Niger | Sub-Saharan Africa | Low income |
| NLD | Netherlands | Europe & Central Asia | High income |
| NOR | Norway | Europe & Central Asia | High income |
| NPL | Nepal | South Asia | Low income |
| NZL | New Zealand | East Asia & Pacific | High income |
| OMN | Oman | Middle East & North Africa | High income |
| PAK | Pakistan | South Asia | Lower middle income |
| PAN | Panama | Latin America & Caribbean | Upper middle income |
| PER | Peru | Latin America & Caribbean | Upper middle income |
| PHL | Philippines | East Asia & Pacific | Lower middle income |
| POL | Poland | Europe & Central Asia | High income |
| PRT | Portugal | Europe & Central Asia | High income |
| PRY | Paraguay | Latin America & Caribbean | Upper middle income |
| PSE | West Bank and Gaza | Middle East & North Africa | Lower middle income |
| ROU | Romania | Europe & Central Asia | Upper middle income |
| SEN | Senegal | Sub-Saharan Africa | Low income |
| SLV | El Salvador | Latin America & Caribbean | Lower middle income |
| SRB | Serbia | Europe & Central Asia | Upper middle income |
| SVK | Slovak Republic | Europe & Central Asia | High income |
| SVN | Slovenia | Europe & Central Asia | High income |
| SWE | Sweden | Europe & Central Asia | High income |
| SWZ | Swaziland | Sub-Saharan Africa | Lower middle income |
| TCD | Chad | Sub-Saharan Africa | Low income |
| THA | Thailand | East Asia & Pacific | Upper middle income |
| TJK | Tajikistan | Europe & Central Asia | Lower middle income |
| UGA | Uganda | Sub-Saharan Africa | Low income |
| UKR | Ukraine | Europe & Central Asia | Lower middle income |
| URY | Uruguay | Latin America & Caribbean | High income |
| USA | United States | Šiaurės Amerika | High income |
| VUT | Vanuatu | East Asia & Pacific | Lower middle income |
Source: The World Bank’s World Development Indicator’s database.
Appendix B
Table A2.
LSDV estimates of financialization—ten-year average growth rate nexus.
| Est. (1) | Est. (2) | Est. (3) | Est. (4) | Est. (5) | Est. (6) | Est. (7) | Est. (8) | |
| Where D is | ln(E2) | ln(E2) | ln(E2) | ln(E2) | ln(E2) | ln(E2) | ln(E3) | ln(E3) |
| Where I is | ln(CC) | ln(Gef) | ln(PS) | ln(RQ) | ln(RL) | ln(VA) | ln(CC) | ln(Gef) |
| Financialisation (F), ln(Cfs) | 0.0119 | 0.0162 | −0.0151 | 0.0160 | 0.0023 | −0.0199 | −0.0049 | −0.0086 |
| (0.0375) | (0.0498) | (0.0205) | (0.0521) | (0.0356) | (0.0366) | (0.0107) | (0.0131) | |
| Institutional quality (I) | −0.0440 | 0.0544 | −0.0514 | −0.0198 | −0.1212 | −0.2569 * | −0.0432 | −0.0647 |
| (0.1884) | (0.2424) | (0.0766) | (0.1899) | (0.1568) | (0.1296) | (0.0576) | (0.0751) | |
| Development level (D) | 0.0016 | 0.0164 | −0.0120 | 0.0039 | −0.0060 | −0.0339 | 0.0025 | 0.0009 |
| (0.0246) | (0.0381) | (0.0154) | (0.0380) | (0.0234) | (0.0254) | (0.0108) | (0.0142) | |
| Interactions | ||||||||
| F *I | −0.0017 | −0.0153 | 0.0132 | −0.0129 | 0.0204 | 0.0412 | 0.0116 | 0.0164 |
| (0.0587) | (0.0706) | (0.0230) | (0.0615) | (0.0515) | (0.0452) | (0.0152) | (0.0187) | |
| F *D | −0.0039 | −0.0058 | 0.0030 | −0.0052 | −0.0022 | 0.0040 | −0.0003 | −0.0002 |
| (0.0087) | (0.0119) | (0.0053) | (0.0128) | (0.0085) | (0.0090) | (0.0033) | (0.0042) | |
| D *I | 0.0157 | −0.0112 | 0.0139 | 0.0047 | 0.0331 | 0.0662 ** | 0.0171 | 0.0199 |
| (0.0421) | (0.0556) | (0.0193) | (0.0450) | (0.0356) | (0.0319) | (0.0155) | (0.0217) | |
| F *D *I | 0.0002 | 0.0042 | −0.0036 | 0.0033 | −0.0045 | −0.0102 | −0.0030 | −0.0035 |
| (0.0131) | (0.0160) | (0.0056) | (0.0143) | (0.0115) | (0.0106) | (0.0039) | (0.0051) | |
| Control variables | ||||||||
| GDP per capita, ln(Y) | −0.0114 *** | −0.0098 *** | −0.0068 *** | −0.0079 *** | −0.0116 *** | −0.0010 *** | −0.0113 *** | −0.0108 *** |
| (0.0028) | (0.0027) | (0.0023) | (0.0027) | (0.0026) | (0.0021) | (0.0027) | (0.0025) | |
| Secondary school enrollment, ln(E2) | 0.0012 | 0.0012 | ||||||
| (0.0056) | (0.0058) | |||||||
| Tertiary school enrollment, ln(E3) | 0.0072 ** | 0.0067 ** | 0.0064 * | 0.0066 * | 0.0071 ** | 0.0060 ** | ||
| (0.0034) | (0.0033) | (0.0038) | (0.0034) | (0.0034) | (0.0030) | |||
| Trade openness, ln(O) | 0.0069 ** | 0.0065 ** | 0.0066 ** | 0.0070 ** | 0.0060 ** | 0.0075 *** | 0.0062 ** | 0.0057 * |
| (0.0029) | (0.0029) | (0.0025) | (0.0029) | (0.0029) | (0.0027) | (0.0030) | (0.0029) | |
| Inflation, I | −0.0004 * | −0.0003 * | −0.0004 * | −0.0004 * | −0.0003 | −0.0004 ** | −0.0003 | −0.0003 |
| (0.0002) | (0.0002) | (0.0002) | (0.0002) | (0.0002) | (0.0002) | (0.0002) | (0.0002) | |
| Gross fixed capital formation, ln(GFCF) | −0.1203 * | −0.1161 * | −0.1289 * | −0.1077 * | −0.1150 * | −0.1163 ** | −0.1194 ** | −0.1147 * |
| (0.0624) | (0.0612) | (0.0712) | (0.0627) | (0.0623) | (0.0574) | (0.0600) | (0.0586) | |
| General government final consumption expenditure, ln(GE) | −0.0207 *** | −0.0176 *** | −0.0171 *** | −0.0172 *** | −0.0196 *** | −0.0165 *** | −0.0194 *** | −0.0162 *** |
| (0.0043) | (0.0042) | (0.0038) | (0.0039) | (0.0043) | (0.0039) | (0.0041) | (0.0039) | |
| Population annual growth, Pop_gr | −0.0015 | −0.0013 | −0.0013 | −0.0012 | −0.0014 | 0.0005 | −0.0015 | −0.0012 |
| (0.0014) | (0.0015) | (0.0017) | (0.0016) | (0.0015) | (0.0016) | (0.0014) | (0.0015) | |
| Squared gross fixed capital formation, [ln(GFCF)]2 | 0.0188 * | 0.0183 * | 0.0203 * | 0.0169 * | 0.0178 * | 0.0179 * | 0.0187 ** | 0.0181 * |
| (0.0098) | (0.0096) | (0.0111) | (0.0099) | (0.0098) | (0.0091) | (0.0094) | (0.0092) | |
| Constant | 0.3116 *** | 0.2386 * | 0.3457 *** | 0.2605 * | 0.3429 *** | 0.4295 *** | 0.3306 *** | 0.3276 *** |
| (0.1031) | (0.1359) | (0.1078) | (0.1528) | (0.1008) | (0.1214) | (0.0908) | (0.0944) | |
| Number of observations | 450 | 450 | 448 | 450 | 450 | 450 | 450 | 450 |
| LSDV Adj. R2 | 0.4974 | 0.4834 | 0.4722 | 0.4726 | 0.5061 | 0.5177 | 0.5049 | 0.4952 |
| F-values | 10.1465 | 9.6002 | 9.1153 | 9.7086 | 11.2889 | 15.6041 | 10.7331 | 10.5556 |
| p-value (1) (F) | <0.0001 | <0.0001 | <0.0001 | <0.0001 | <0.0001 | <0.0001 | <0.0001 | <0.0001 |
| Est. (9) | Est. (10) | Est. (11) | Est. (12) | Est. 13 | Est. 14 | Est. 15 | Est. 16 | |
| Where D is | ln(E3) | ln(E3) | ln(E3) | ln(E3) | ln(E2) | ln(E2) | ln(E2) | ln(E2) |
| Where I is | ln(PS) | ln(RQ) | ln(RL) | ln(VA) | ln(CC) | ln(Gef) | ln(PS) | ln(RQ) |
| Financialisation (F), ln(Cfs) | −0.0092 | −0.0103 | −0.0092 | −0.0116 | 0.1307 | 0.1519 | 0.06609 | 0.1992 |
| (0.0080) | (0.0122) | (0.0108) | (0.0115) | (0.0997) | (0.1148) | (0.0953) | (0.1249) | |
| Institutional quality (I) | −0.0350 | −0.0870 * | −0.0640 | −0.0975 ** | 0.1202 | 0.0758 | 0.0241 | 0.1138 |
| (0.0306) | (0.0511) | (0.0458) | (0.0413) | (0.0806) | (0.2472) | (0.2942) | (0.2741) | |
| Development level (D) | −0.0026 | −0.0079 | −0.0022 | −0.0126 | 0.00429 | 0.1305 | 0.0727 | 0.1610 |
| (0.0101) | (0.0148) | (0.0107) | (0.0124) | (0.0033) | (0.0922) | (0.0839) | (0.1036) | |
| Interactions | ||||||||
| F *I | 0.0088 | 0.0167 | 0.0175 | 0.0205 | −0.0319 | −0.0470 | −0.0069 | −0.0713 |
| (0.0088) | (0.0142) | (0.0135) | (0.0132) | (0.0737) | (0.0798) | (0.0835) | (0.0872) | |
| F *D | 0.0020 | 0.0012 | 0.0005 | 0.0022 | −0.0362 | −0.0424 | −0.018 | −0.0548 * |
| (0.0028) | (0.0048) | (0.0034) | (0.0041) | (0.0260) | (0.0300) | (0.0244) | (0.0329) | |
| D *I | 0.0126 | 0.0262 | 0.0233 * | 0.0335 ** | −0.0214 | −0.0241 | −0.0073 | −0.0378 |
| (0.0101) | (0.0179) | (0.0132) | (0.0150) | (0.0637) | (0.0648) | (0.0739) | (0.0725) | |
| F *D *I | −0.0030 | −0.0043 | −0.0043 | −0.0059 | 0.0099 | 0.0143 | 0.0022 | 0.0210 |
| (0.0027) | (0.0046) | (0.0035) | (0.0042) | (0.0100) | (0.0207) | (0.0211) | (0.0229) | |
| Control variables | ||||||||
| GDP per capita, ln(Y) | −0.0070 *** | −0.0088 *** | −0.0177 *** | −0.0104 *** | −0.0103 *** | −0.0102 *** | −0.0065 *** | −0.0084 *** |
| (0.0023) | (0.0026) | (0.0024) | (0.0022) | (0.0025) | (0.0023) | (0.0022) | (0.0023) | |
| Secondary school enrollment, ln(E2) | 0.000 | 0.0013 | 0.0026 | 0.0041 | 0.0048 | 0.0061 | 0.0017 | 0.0062 |
| (0.0063) | (0.0058) | (0.0058) | (0.0052) | (0.0064) | (0.0066) | (0.0054) | (0.0067) | |
| Tertiary school enrollment, ln(E3) | 0.0727 | 0.0038 | 0.0042 | 0.0031 | ||||
| (0.2476) | (0.0031) | (0.0033) | (0.0031) | |||||
| Trade openness, ln(O) | 0.0061 ** | 0.0067 ** | 0.00510 * | 0.00706 ** | 0.0062 *** | 0.0060 *** | 0.0065 *** | 0.00576 ** |
| (0.0025) | (0.0029) | (0.0029) | (0.0028) | (0.0023) | (0.0023) | (0.0023) | (0.0023) | |
| Inflation, I | −0.0004 * | −0.0003 * | −0.0003 | −0.0004 ** | −0.0004 ** | −0.0004 ** | −0.0004 ** | −0.0004 ** |
| (0.0002) | (0.0002) | (0.0002) | (0.0002) | (0.0002) | (0.0002) | (0.0002) | (0.0002) | |
| Gross fixed capital formation, ln(GFCF) | −0.1286 * | −0.1049 * | −0.1201 ** | −0.1180 ** | −0.1584 ** | −0.1518 ** | −0.1524 ** | −0.1440 ** |
| (0.0722) | (0.0594) | (0.0594) | (0.0562) | (0.0611) | (0.0599) | (0.0667) | (0.0631) | |
| General government final consumption expenditure, ln(GE) | −0.0165 *** | −0.0154 *** | −0.0183 *** | −0.0160 *** | −0.0210 *** | −0.0174 *** | −0.0184 *** | −0.0166 *** |
| (0.0036) | (0.0037) | (0.0038) | (0.0036) | (0.0035) | (0.0033) | (0.0038) | (0.0036) | |
| Population annual growth, Pop_gr | −0.0012 | −0.0010 | −0.0015 | 0.0003 | −0.0022 | −0.0018 | −0.0016 | −0.0016 |
| (0.0016) | (0.0016) | (0.0015) | (0.0015) | (0.0014) | (0.0015) | (0.0017) | (0.0014) | |
| Squared gross fixed capital formation, [ln(GFCF)]2 | 0.0202 * | 0.0163 * | 0.0186 ** | 0.0184 ** | 0.0252 *** | 0.0243 ** | 0.0243 ** | 0.0229 ** |
| (0.0113) | (0.0094) | (0.0093) | (0.0089) | (0.0096) | (0.0094) | (0.0105) | (0.0099) | |
| Constant | 0.3260 *** | 0.3165 *** | 0.3496 *** | 0.3386 *** | −0.0816 | −0.1382 | 0.0587 | −0.2711 |
| (0.1093) | (0.1000) | (0.0915) | (0.0900) | (0.2785) | (0.3180) | (0.3119) | (0.3530) | |
| Number of observations | 448 | 450 | 450 | 450 | 434 | 434 | 432 | 434 |
| LSDV Adj, R2 | 0.4936 | 0.4899 | 0.517 | 0.5135 | 0.5368 | 0.5359 | 0.5034 | 0.5312 |
| F-values | 8.9031 | 12.8179 | 10.6723 | 16.0974 | 13.8206 | 14.4032 | 9.5666 | 12.6967 |
| p-value (1) (F) | <0.0001 | <0.0001 | <0.0001 | <0.0001 | <0.0001 | <0.0001 | <0.0001 | <0.0001 |
| Est, 17 | Est, 18 | Est, 19 | Est, 20 | Est, 21 | Est, 22 | Est, 23 | Est, 24 | |
| Where D is | ln(E2) | ln(E2) | ln(E3) | ln(E3) | ln(E3) | ln(E3) | ln(E3) | ln(E3) |
| Where I is | ln(RL) | ln(VA) | ln(CC) | ln(Gef) | ln(PS) | ln(RQ) | ln(RL) | ln(VA) |
| Financialisation (F), ln(Cfs) | 0.1417 | 0.1921 *** | 0.0184 | 0.0320 | 0.0157 | 0.0187 | 0.0231 | −0.0031 |
| (0.1104) | (0.0722) | (0.0216) | (0.0268) | (0.0210) | (0.0325) | (0.0234) | (0.02424) | |
| Institutional quality (I) | 0.0473 | 0.4728 | 0.0460 | 0.1032 | 0.0943 | 0.0053 | 0.0365 | −0.1082 |
| (0.2387) | (0.3166) | (0.1188) | (0.1331) | (0.0809) | (0.1254) | (0.1014) | (0.0991) | |
| Development level (D) | 0.1204 | 0.2077 *** | −0.0017 | 0.0072 | 0.0032 | 0.0006 | 0.0016 | −0.0126 |
| (0.0881) | (0.0658) | (0.0115) | (0.0134) | (0.0114) | (0.0173) | (0.0126) | (0.0123) | |
| Interactions | ||||||||
| F×I | −0.0359 | −0.1145 | −0.0129 | −0.0261 | −0.0240 | −0.0089 | −0.0101 | 0.0178 |
| (0.0768) | (0.0808) | (0.0306) | (0.0336) | (0.0204) | (0.0320) | (0.0266) | (0.0256) | |
| F×D | −0.0395 | −0.0532 *** | −0.0030 | −0.0052 | −0.0024 | −0.0034 | −0.0041 | −0.0003 |
| (0.0291) | (0.0188) | (0.0029) | (0.0034) | (0.0028) | (0.0045) | (0.0033) | (0.0032) | |
| D×I | −0.0148 | −0.1307 | −0.0044 | −0.0126 | −0.0110 | −0.0024 | −0.0047 | 0.0129 |
| (0.0632) | (0.0812) | (0.0121) | (0.0142) | (0.0101) | (0.0157) | (0.0116) | (0.0127) | |
| F×D×I | 0.0113 | 0.0322 | 0.0018 | 0.0037 | 0.0027 | 0.0017 | 0.0020 | −0.0018 |
| (0.0202) | (0.0206) | (0.0030) | (0.0035) | (0.0025) | (0.0039) | (0.0029) | (0.0031) | |
| Control variables | ||||||||
| GDP per capita, ln(Y) | −0.0109 *** | −0.0073 *** | ||||||
| (0.0022) | (0.0021) | |||||||
| Secondary school enrollment, ln(E2) | 0.0050 | 0.0037 | 0.0003 | 0.0006 | −0.0017 | −0.0008 | −0.0005 | 0.0010 |
| (0.0065) | (0.0056) | (0.0063) | (0.0065) | (0.0066) | (0.0067) | (0.0063) | (0.0057) | |
| Tertiary school enrollment, ln(E3) | 0.0043 | 0.0040 | 0.0070 * | 0.0065 * | 0.0070 * | 0.0063 * | 0.0070 * | 0.0052 * |
| (0.0033) | (0.0030) | (0.0037) | (0.0037) | (0.0038) | (0.0037) | (0.0037) | (0.0029) | |
| Trade openness, ln(O) | 0.0057 ** | 0.0079 *** | 0.0066 ** | 0.0064 ** | 0.0070 *** | 0.0065 ** | 0.0061 ** | 0.0076 *** |
| (0.0023) | (0.0025) | (0.0027) | (0.0029) | (0.0025) | (0.0028) | (0.0028) | (0.0029) | |
| Inflation, I | −0.0004 ** | −0.0005 *** | −0.0004 * | −0.0003 * | −0.0004 ** | −0.0003 * | −0.0003 * | −0.0004 * |
| (0.0002) | (0.0002) | (0.0002) | (0.0002) | (0.0002) | (0.0002) | (0.0002) | (0.0002) | |
| Gross fixed capital formation, ln(GFCF) | −0.1544 ** | −0.1748 *** | −0.1226 ** | −0.1158 * | −0.1388 ** | −0.1071 * | −0.1173 * | −0.1147 * |
| (0.0625) | (0.0596) | (0.0611) | (0.0603) | (0.0682) | (0.0627) | (0.0619) | (0.0585) | |
| General government final consumption expenditure, ln(GE) | −0.0206 *** | −0.0190 *** | −0.0209 *** | −0.0176 *** | −0.0174 *** | −0.0169 *** | −0.0203 *** | −0.0170 *** |
| (0.0033) | (0.0033) | (0.0041) | (0.0039) | (0.0037) | (0.0037) | (0.0040) | (0.0036) | |
| Population annual growth, Pop_gr | −0.0022 | −0.0016 | −0.0015 | −0.0012 | −0.0012 | −0.0014 | −0.0015 | −0.0006 |
| (0.0014) | (0.0014) | (0.0014) | (0.0015) | (0.0016) | (0.0015) | (0.0014) | (0.0015) | |
| Squared gross fixed capital formation, [ln(GFCF)]2 | 0.0245 ** | 0.0277 *** | 0.0193 ** | 0.0183 * | 0.0218 ** | 0.0170 * | 0.0184 * | 0.0181 * |
| (0.0098) | (0.0094) | (0.0100) | (0.0094) | (0.0106) | (0.0098) | (0.0096) | (0.0092) | |
| Constant | −0.0815 | −0.4021 * | 0.2531 * | 0.1741 | 0.2414 * | 0.2224 | 0.2334 | 0.3181 ** |
| (0.3005) | (0.2070) | (0.1279) | (0.1425) | (0.1311) | (0.1740) | (0.1446) | (0.1297) | |
| Number of observations | 434 | 434 | 450 | 450 | 448 | 450 | 450 | 450 |
| LSDV Adj, R2 | 0.5485 | 0.5287 | 0.4944 | 0.4897 | 0.4748 | 0.4743 | 0.4996 | 0.4891 |
| F-values | 16.9307 | 10.7430 | 10.1773 | 11.1592 | 9.0110 | 9.5684 | 11.4149 | 9.9614 |
| p-value (1) (F) | <0.0001 | <0.0001 | <0.0001 | <0.0001 | <0.0001 | <0.0001 | <0.0001 | <0.0001 |
Notes: (1) A low p-value counts against the null hypothesis: all regressors are jointly insignificant. Heteroscedasticity robust (HCCME with Arellano correction) standard errors are presented in parentheses. All estimations include time-dummies and. *, **, *** indicate significance at the 10, 5 and 1 percent level, respectively. Source: authors’ contributions.
Appendix C
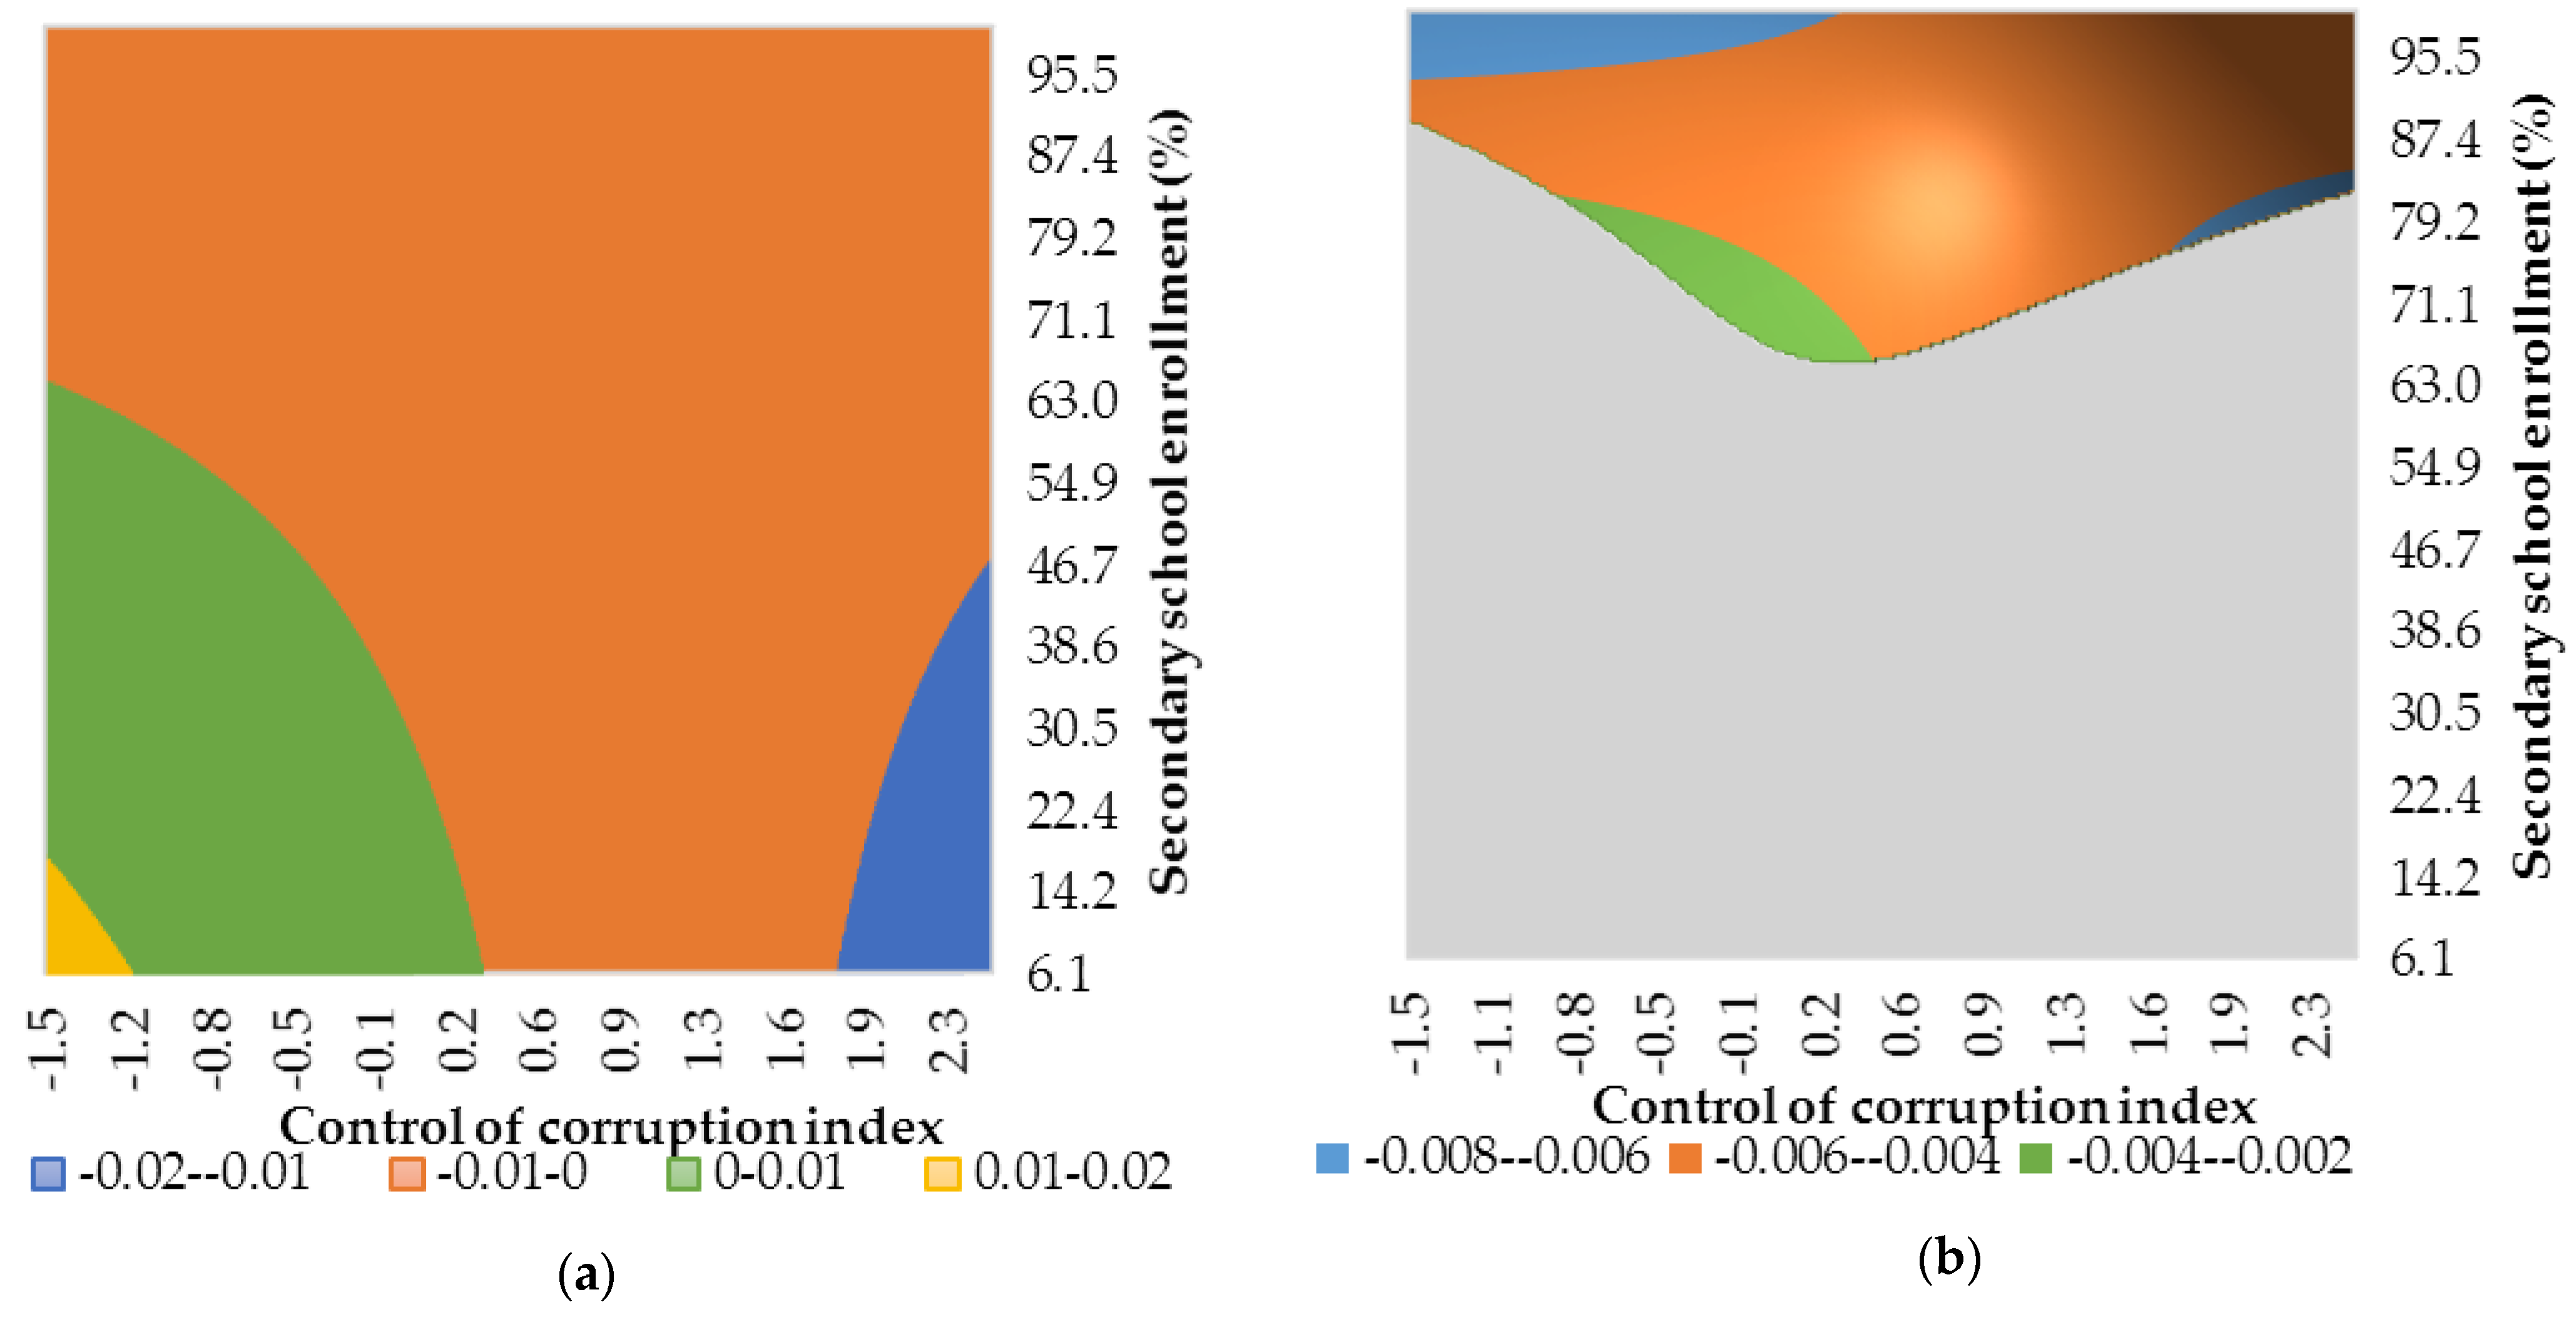
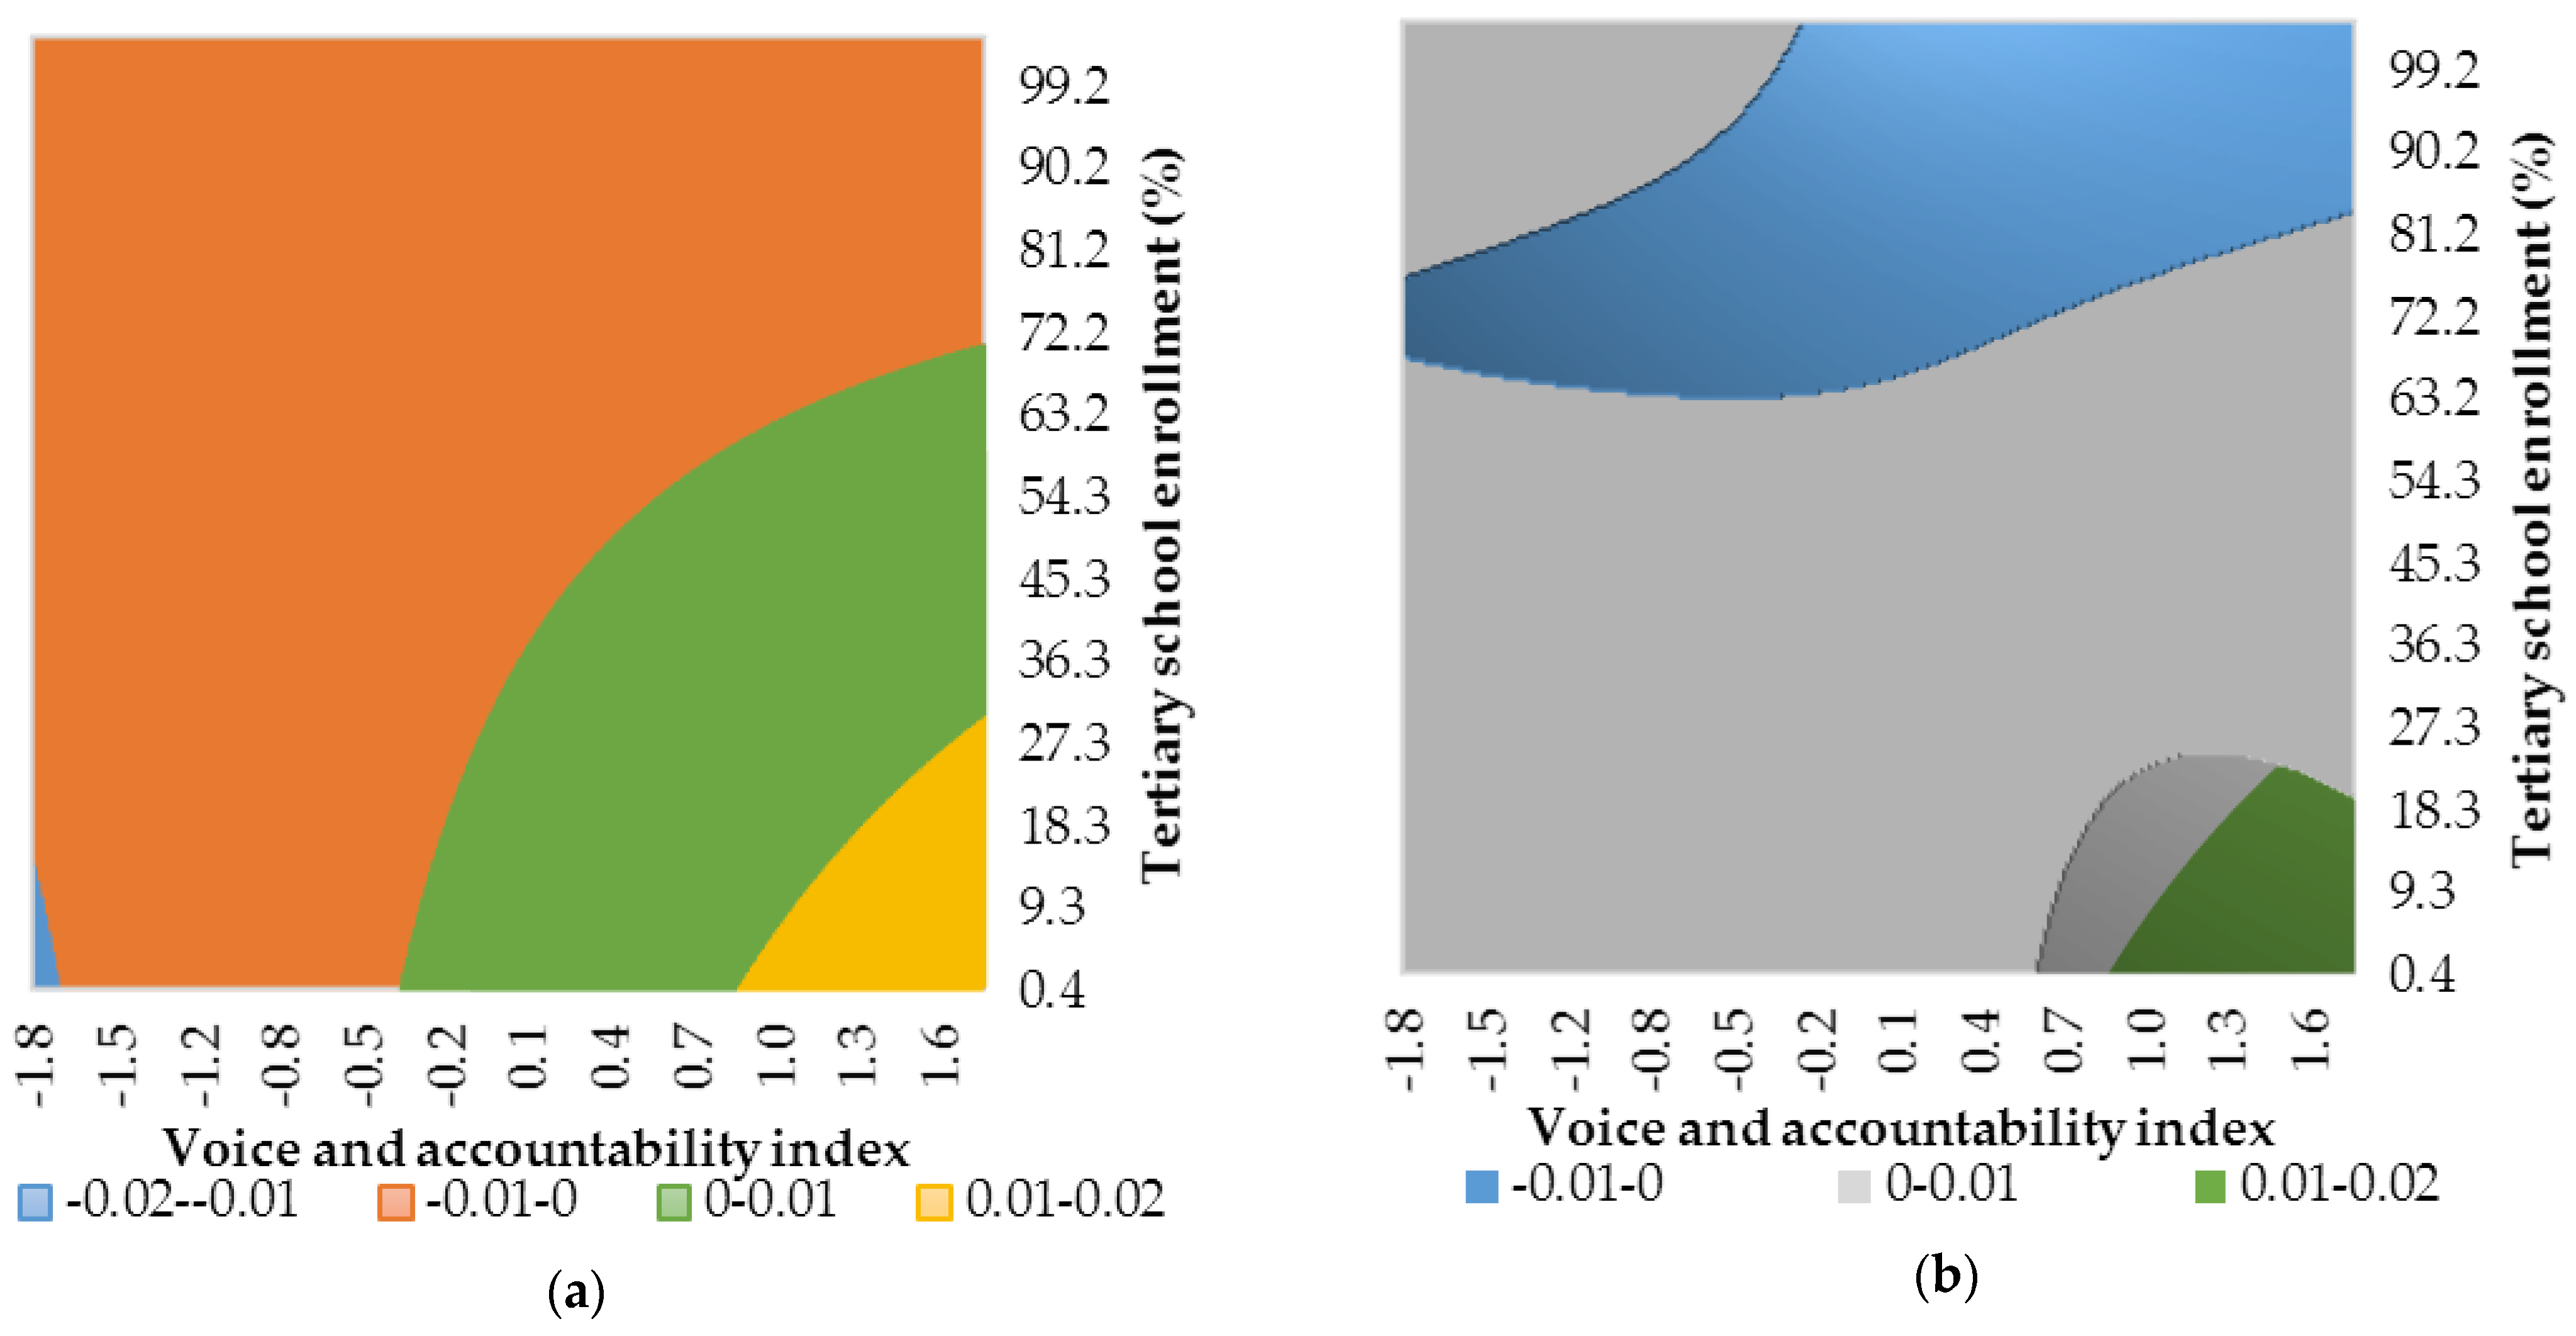
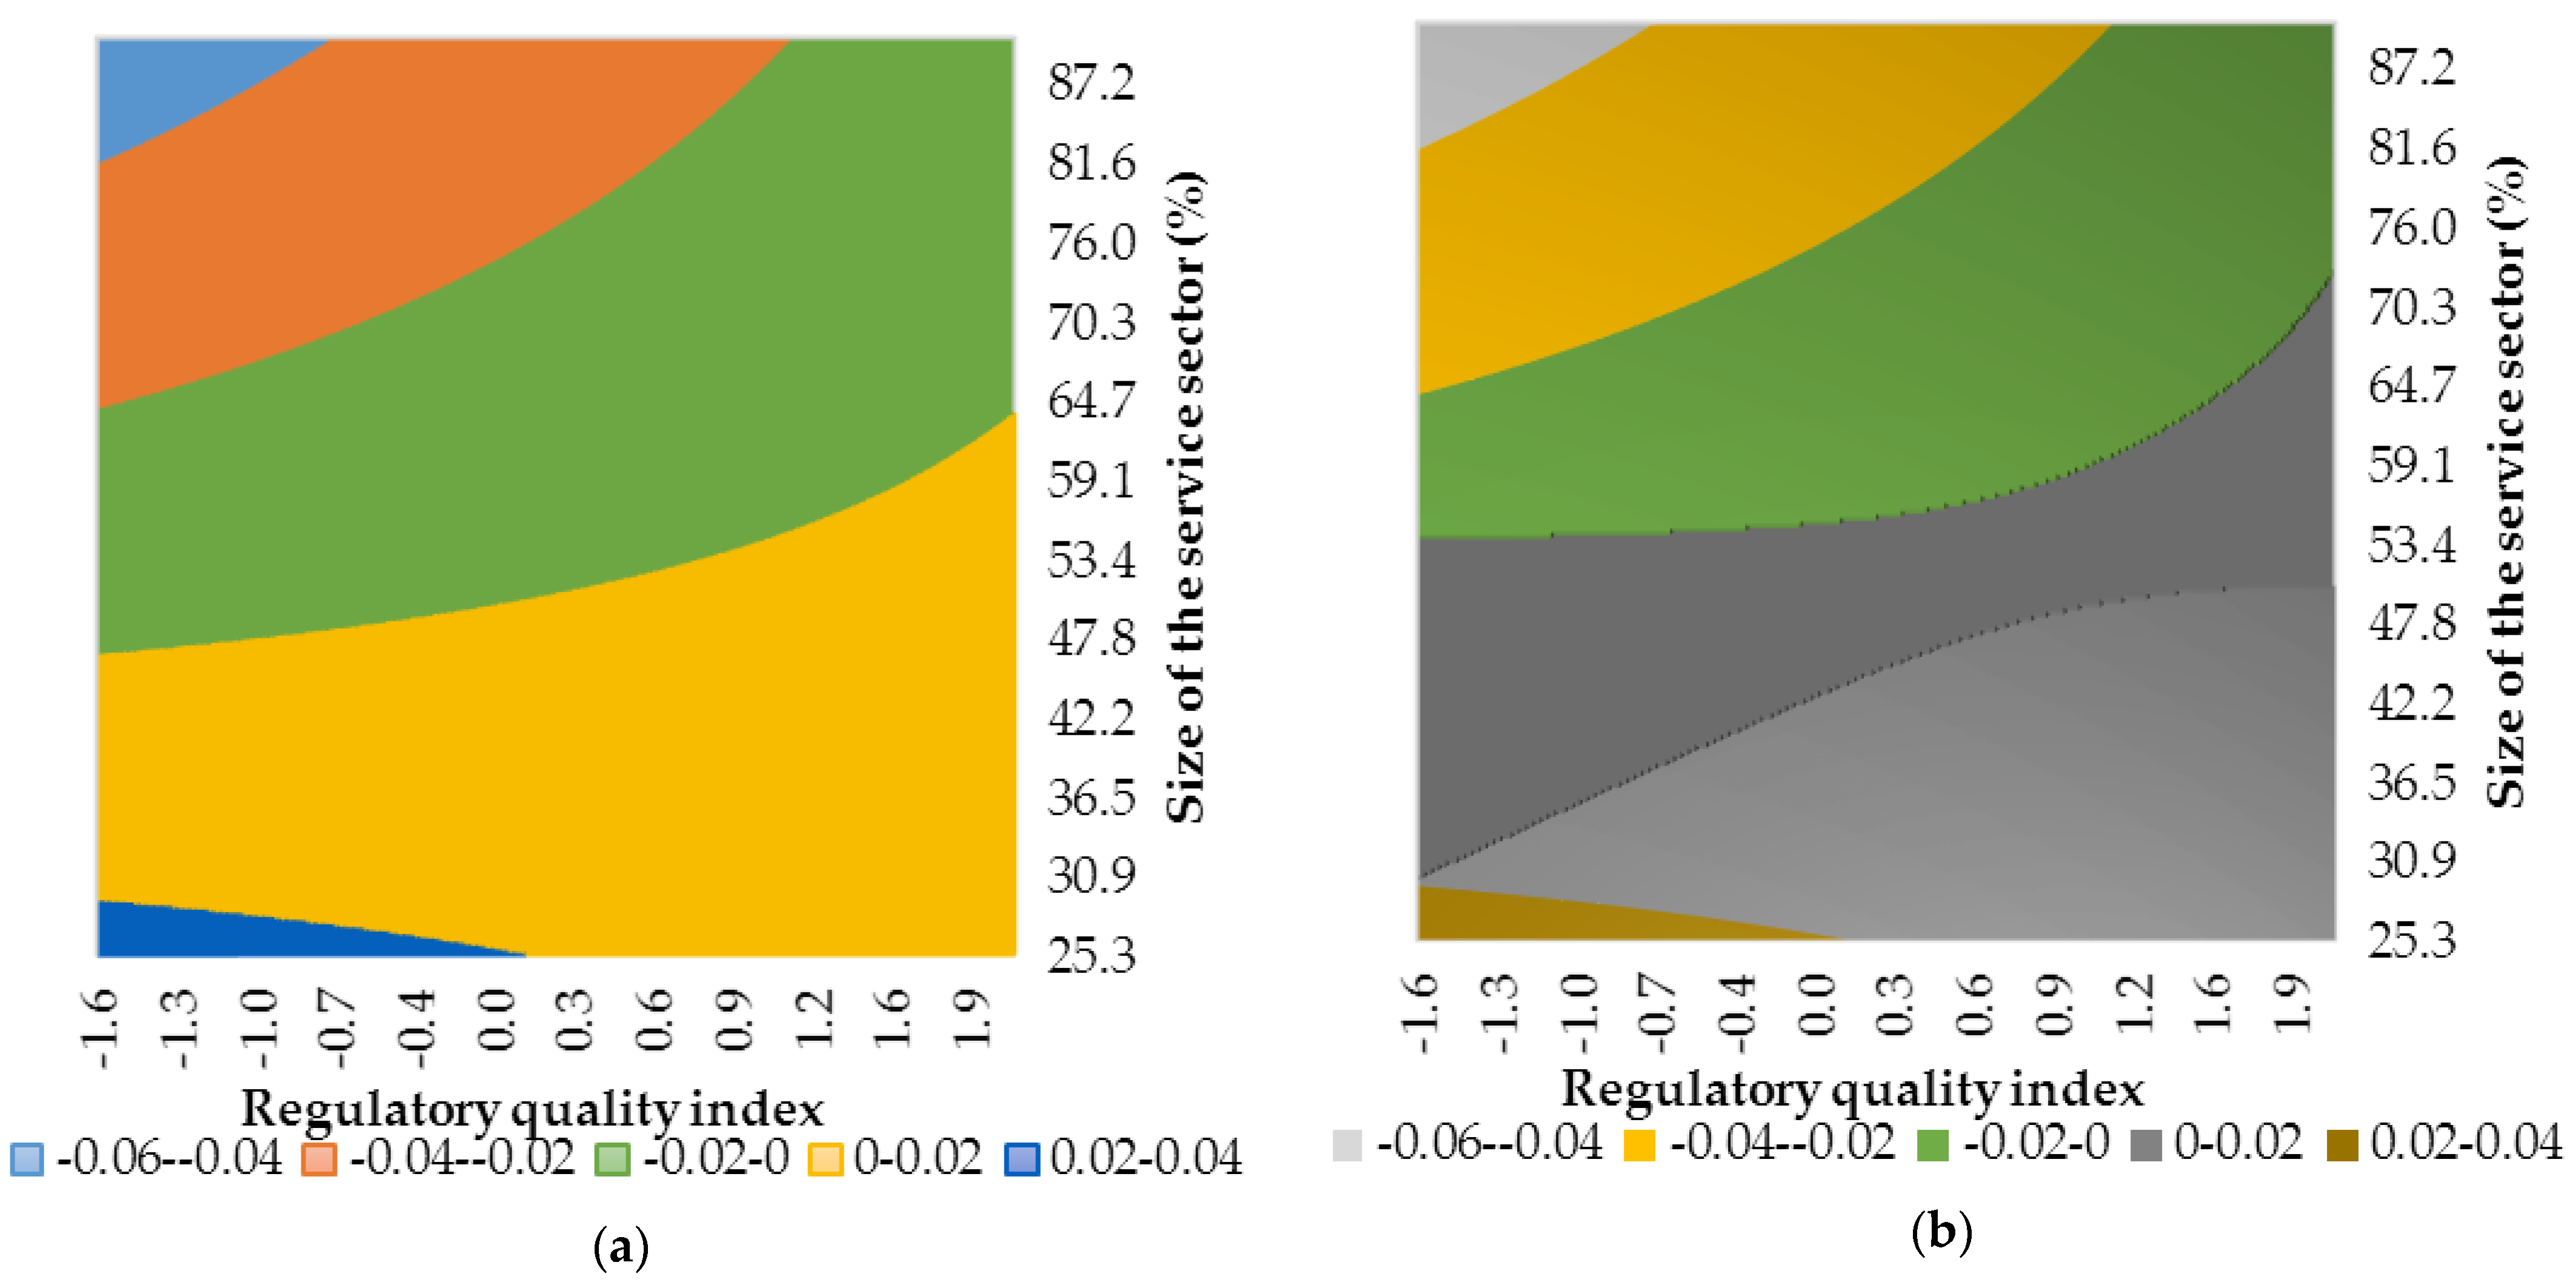
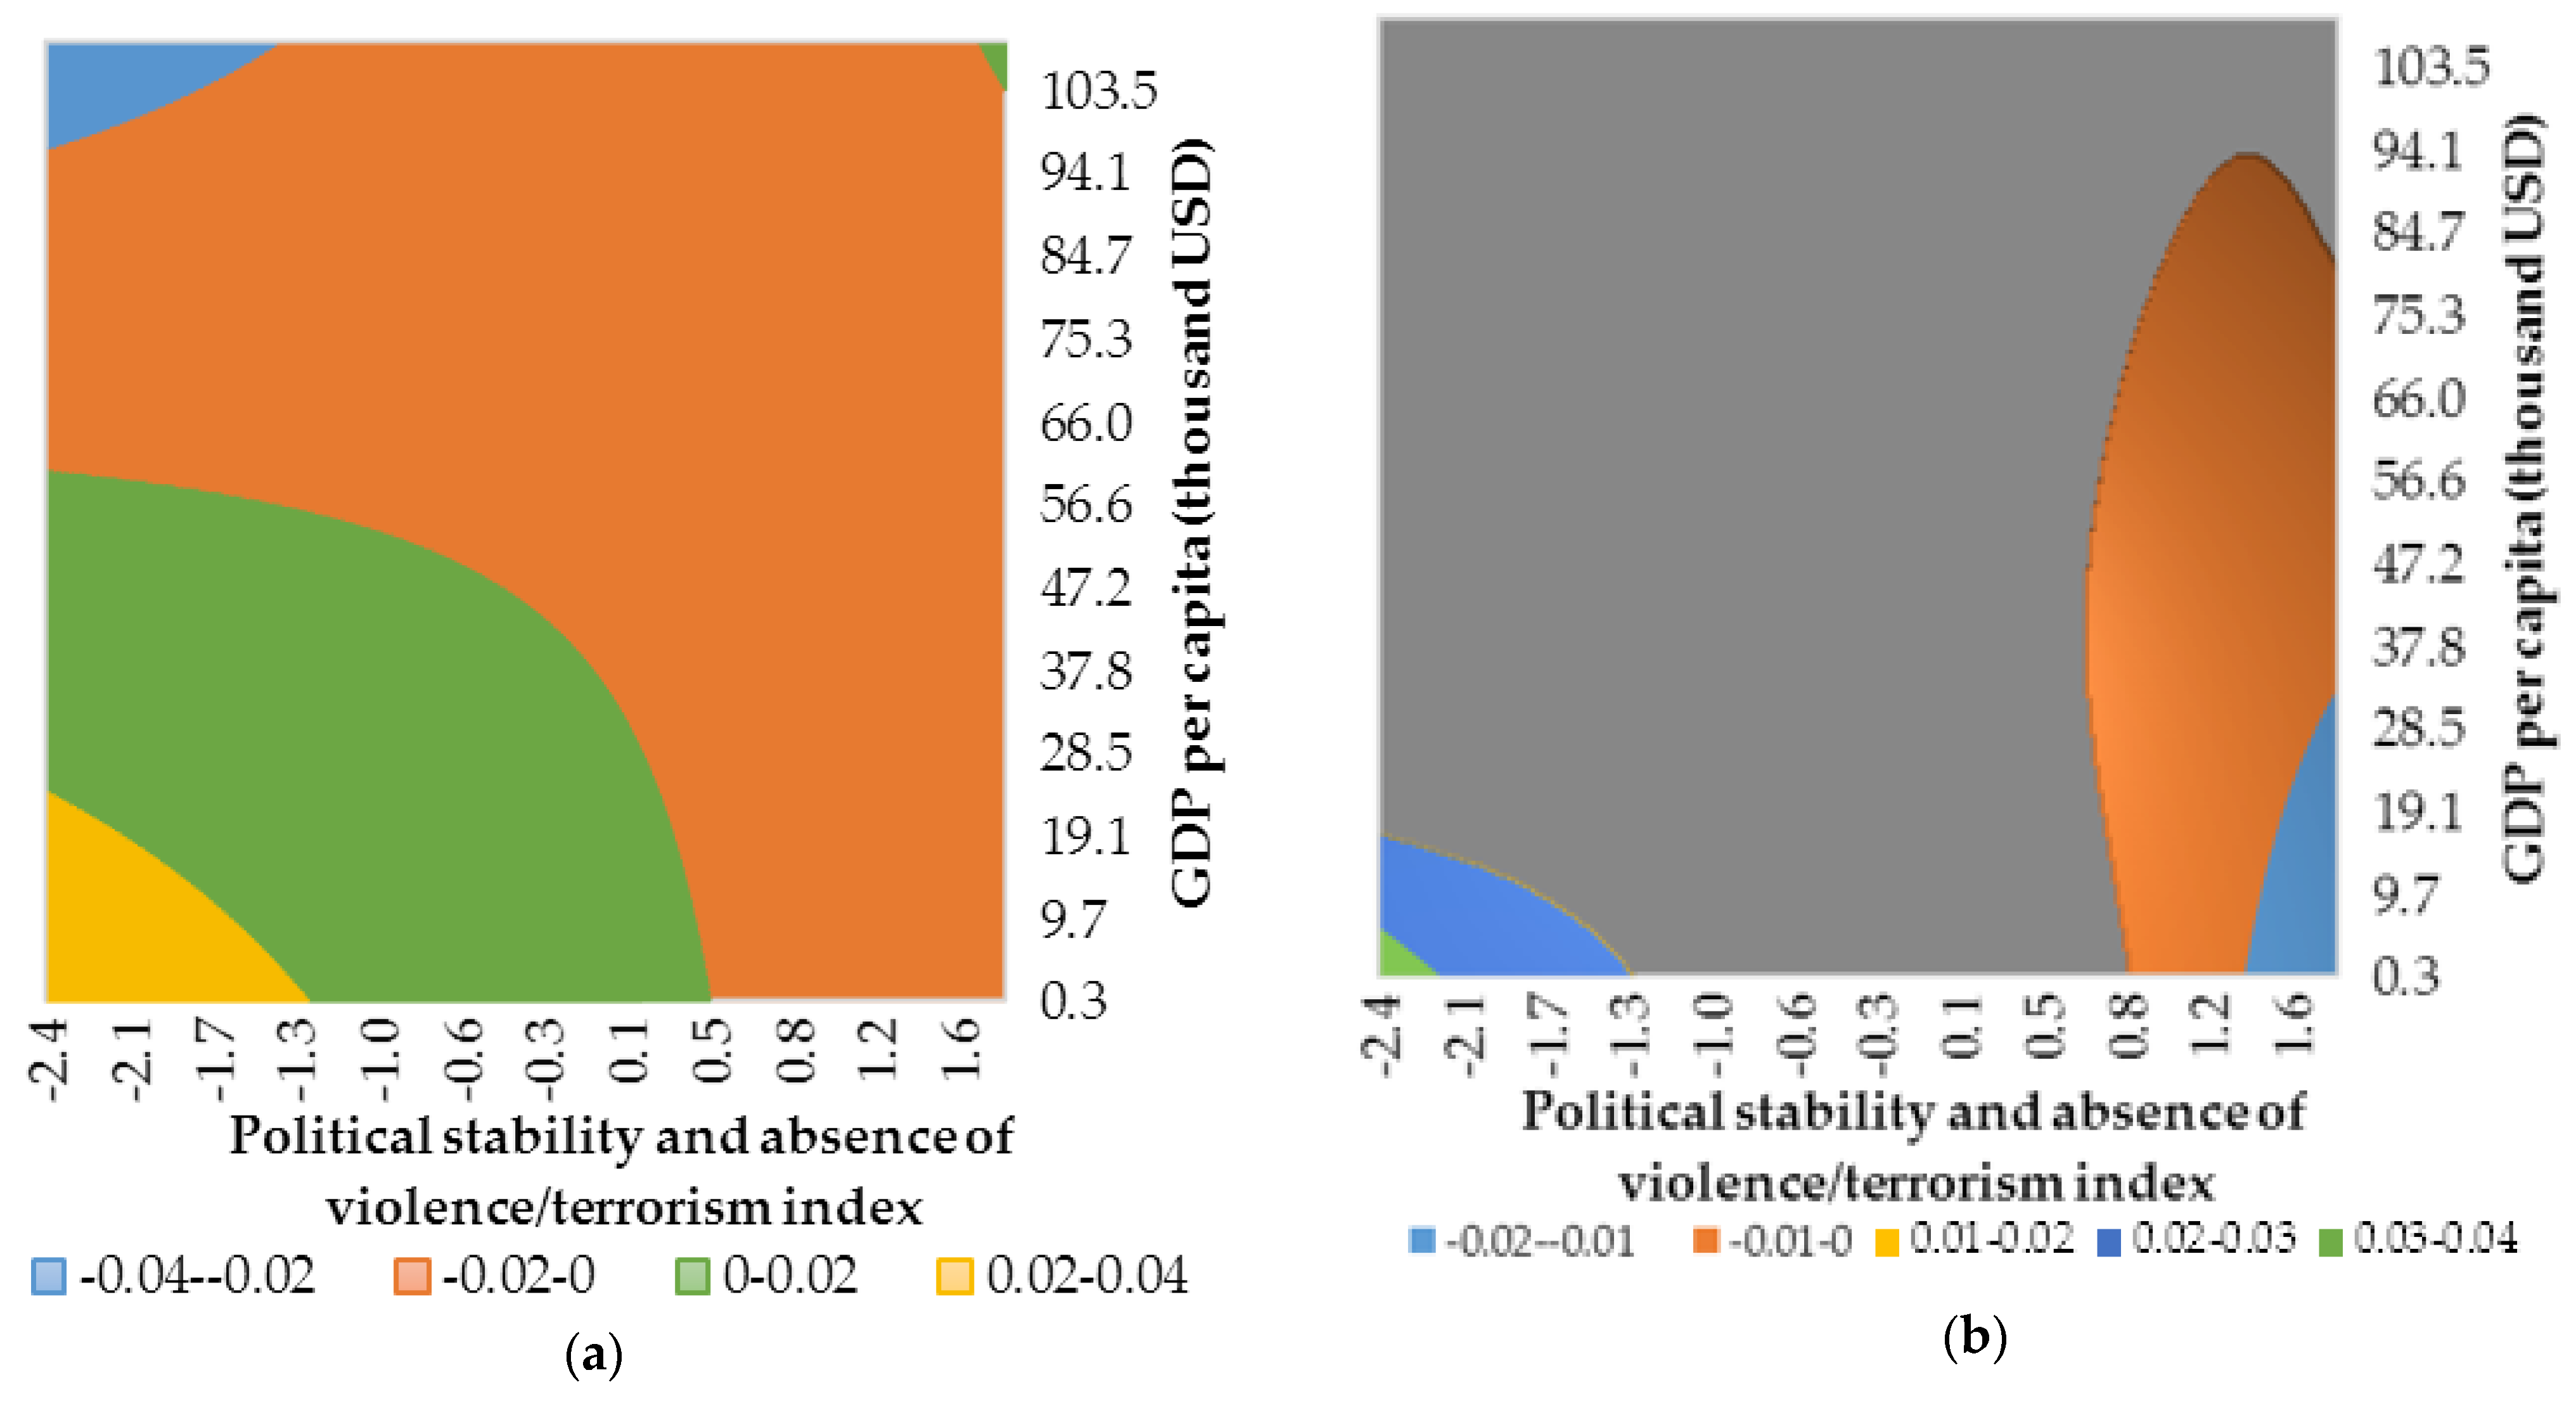
Figure A1.
Conditional effect of financialisation on growth based on Est. 1 in Table A2. (a) Estimated conditional slope coefficient over the whole range of observed values for institutional quality and development level. (b) Estimated statistically significant conditional slope coefficient. Gray represents a combination of institutional quality and development level for which effect of financialisation on growth is statistically insignificant. Source: authors’ contributions.

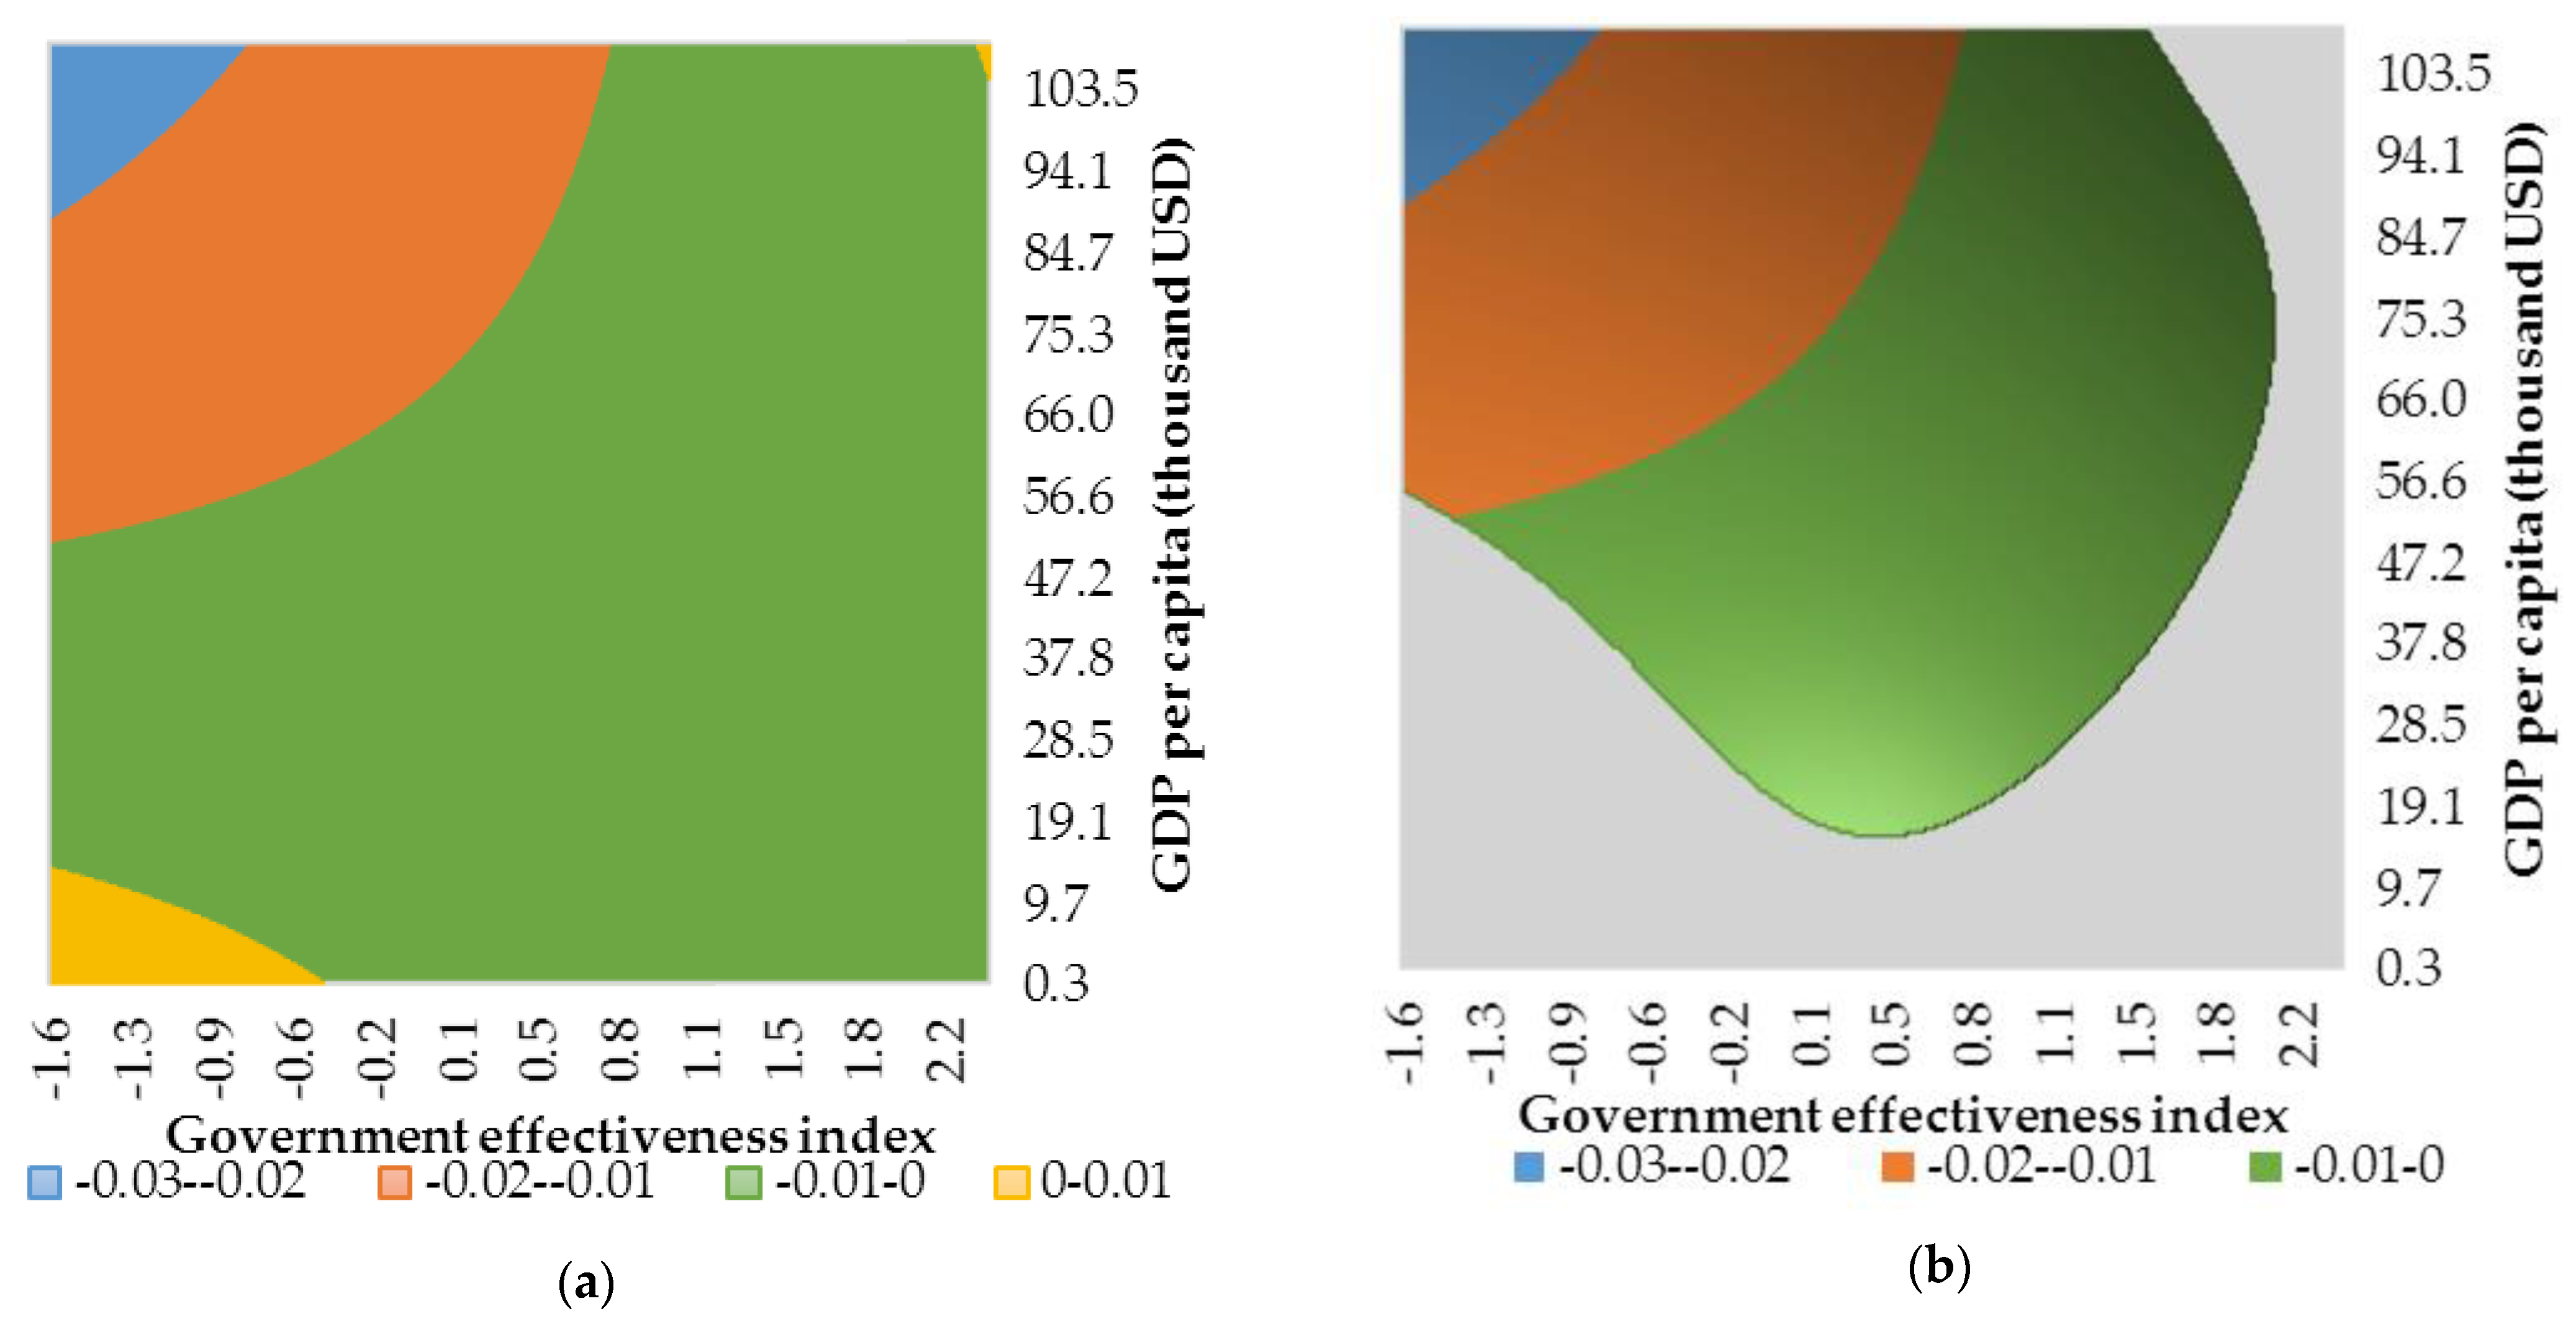
Figure A2.
Conditional effect of financialisation on growth based on Est. 2 in Table A2. (a) Estimated conditional slope coefficient over the whole range of observed values for institutional quality and development level. (b) Estimated statistically significant conditional slope coefficient. Gray represents a combination of institutional quality and development level for which effect of financialisation on growth is statistically insignificant. Source: authors’ contributions.

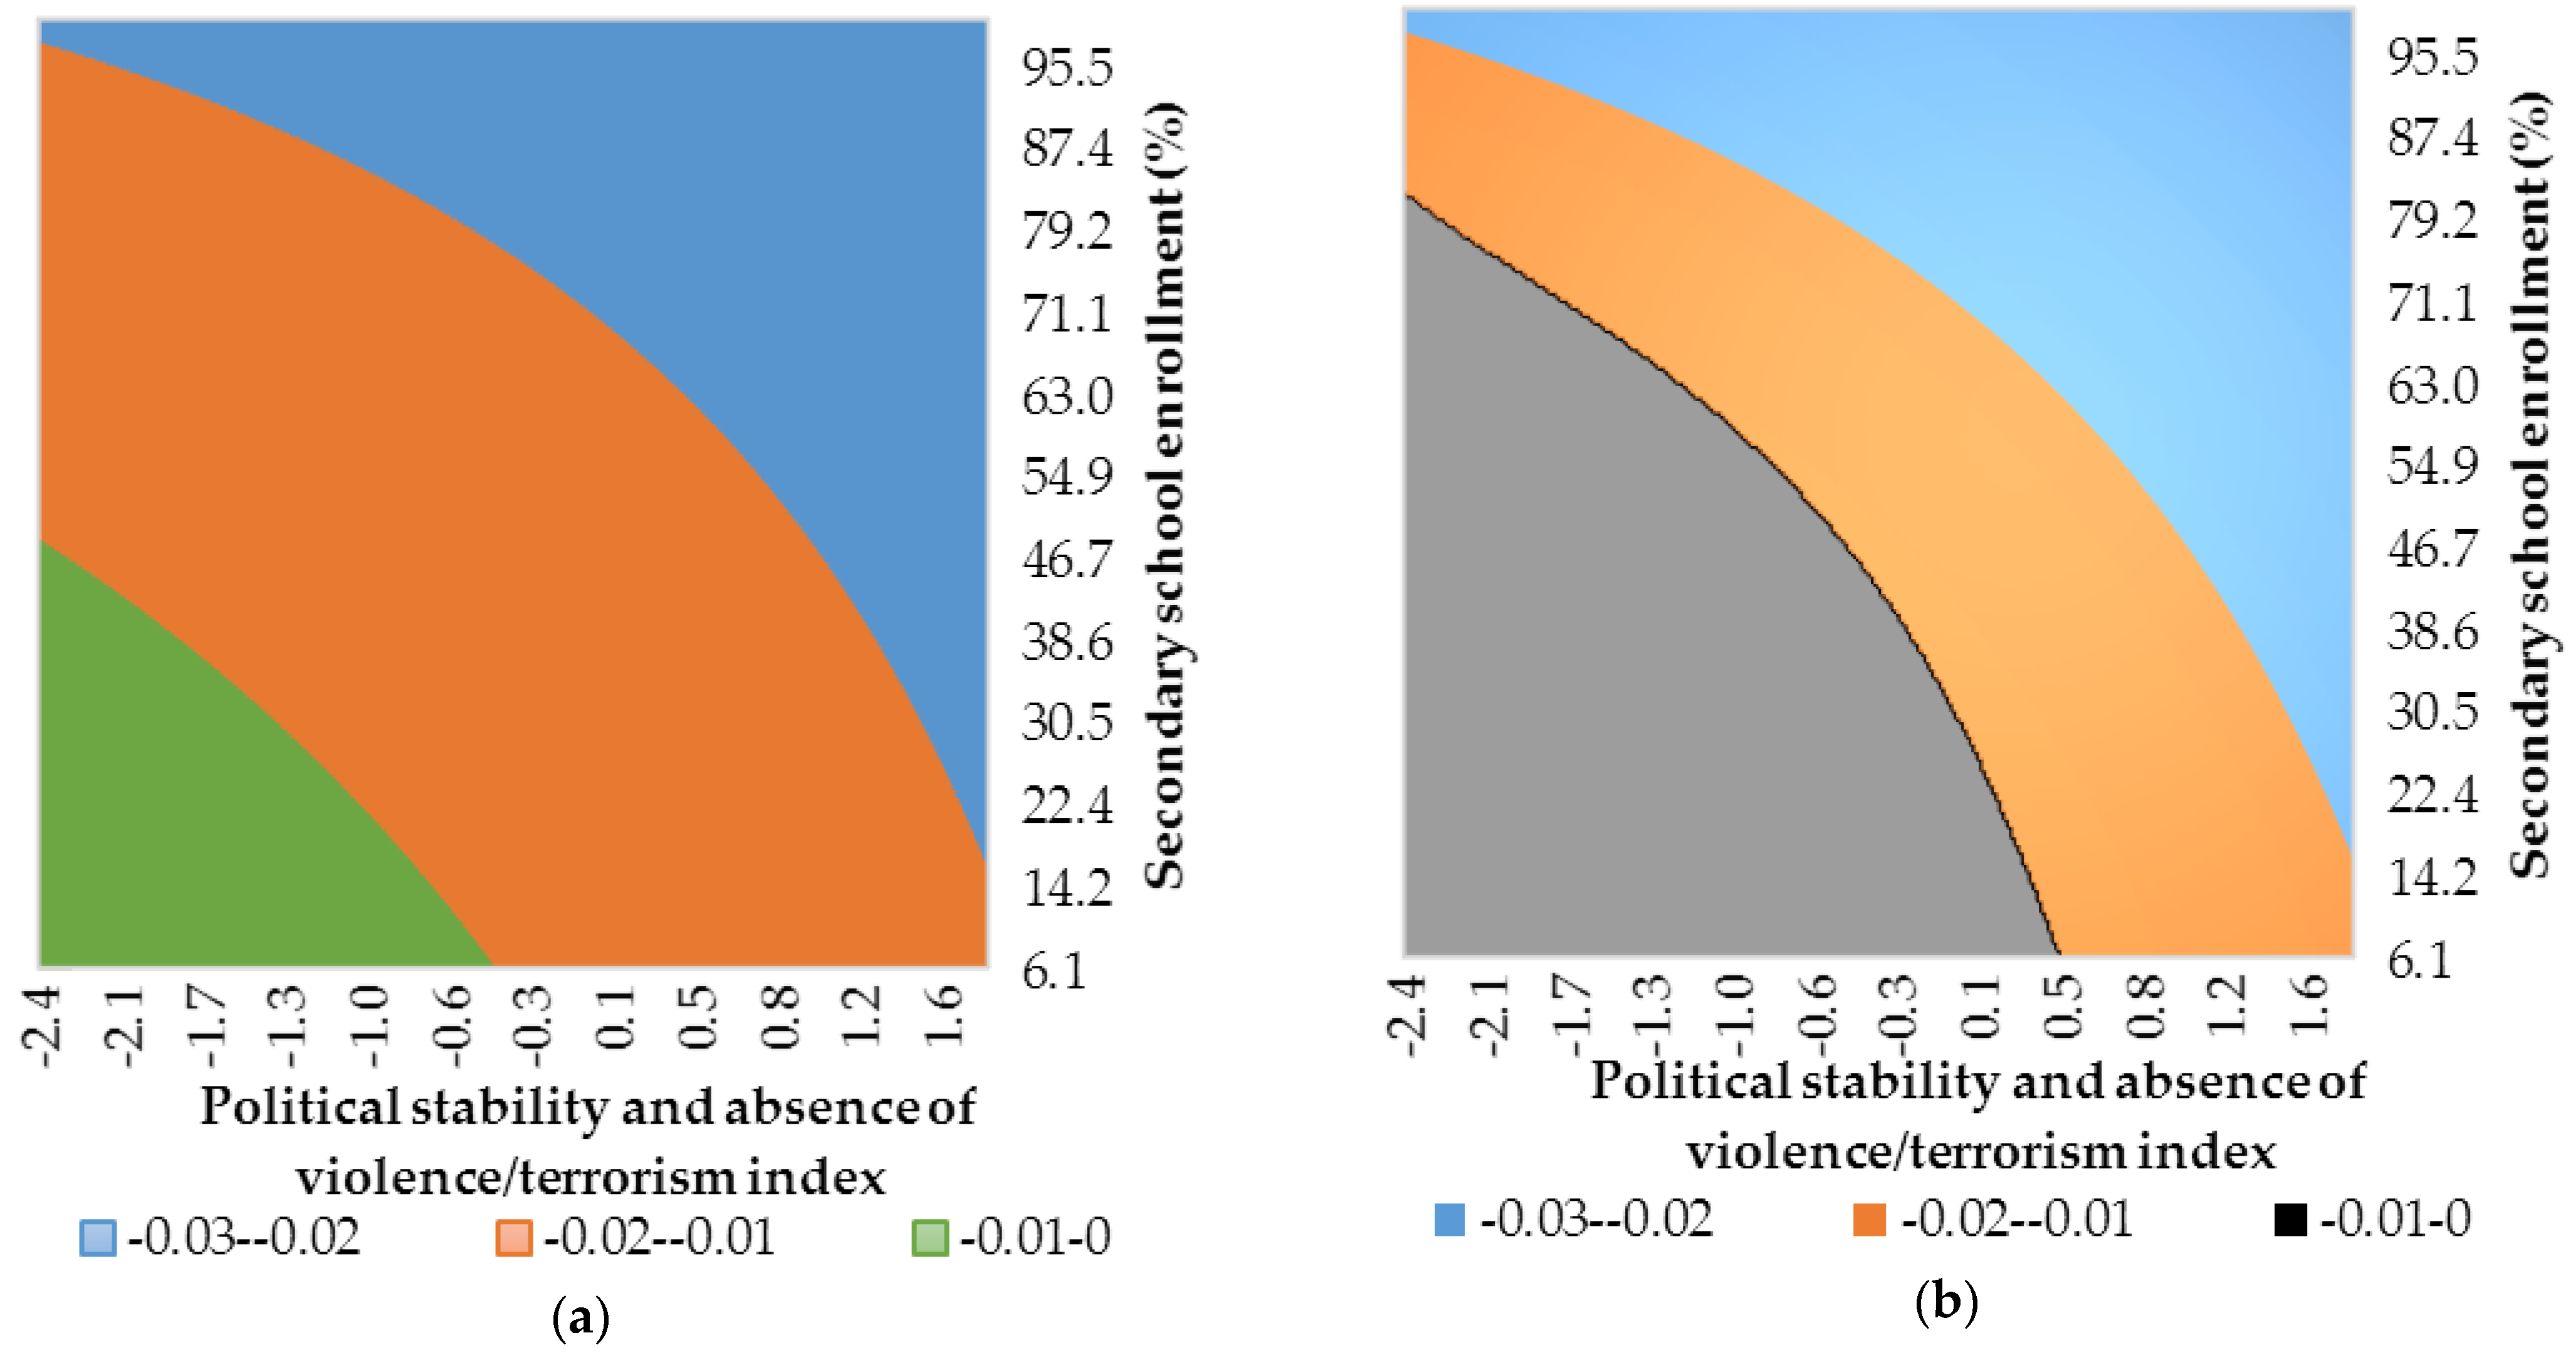
Figure A3.
Conditional effect of financialisation on growth based on Est. 3 in Table A2. (a) Estimated conditional slope coefficient over the whole range of observed values for institutional quality and development level. (b) Estimated statistically significant conditional slope coefficient. Gray represents a combination of institutional quality and development level for which effect of financialisation on growth is statistically insignificant. Source: authors’ contributions.

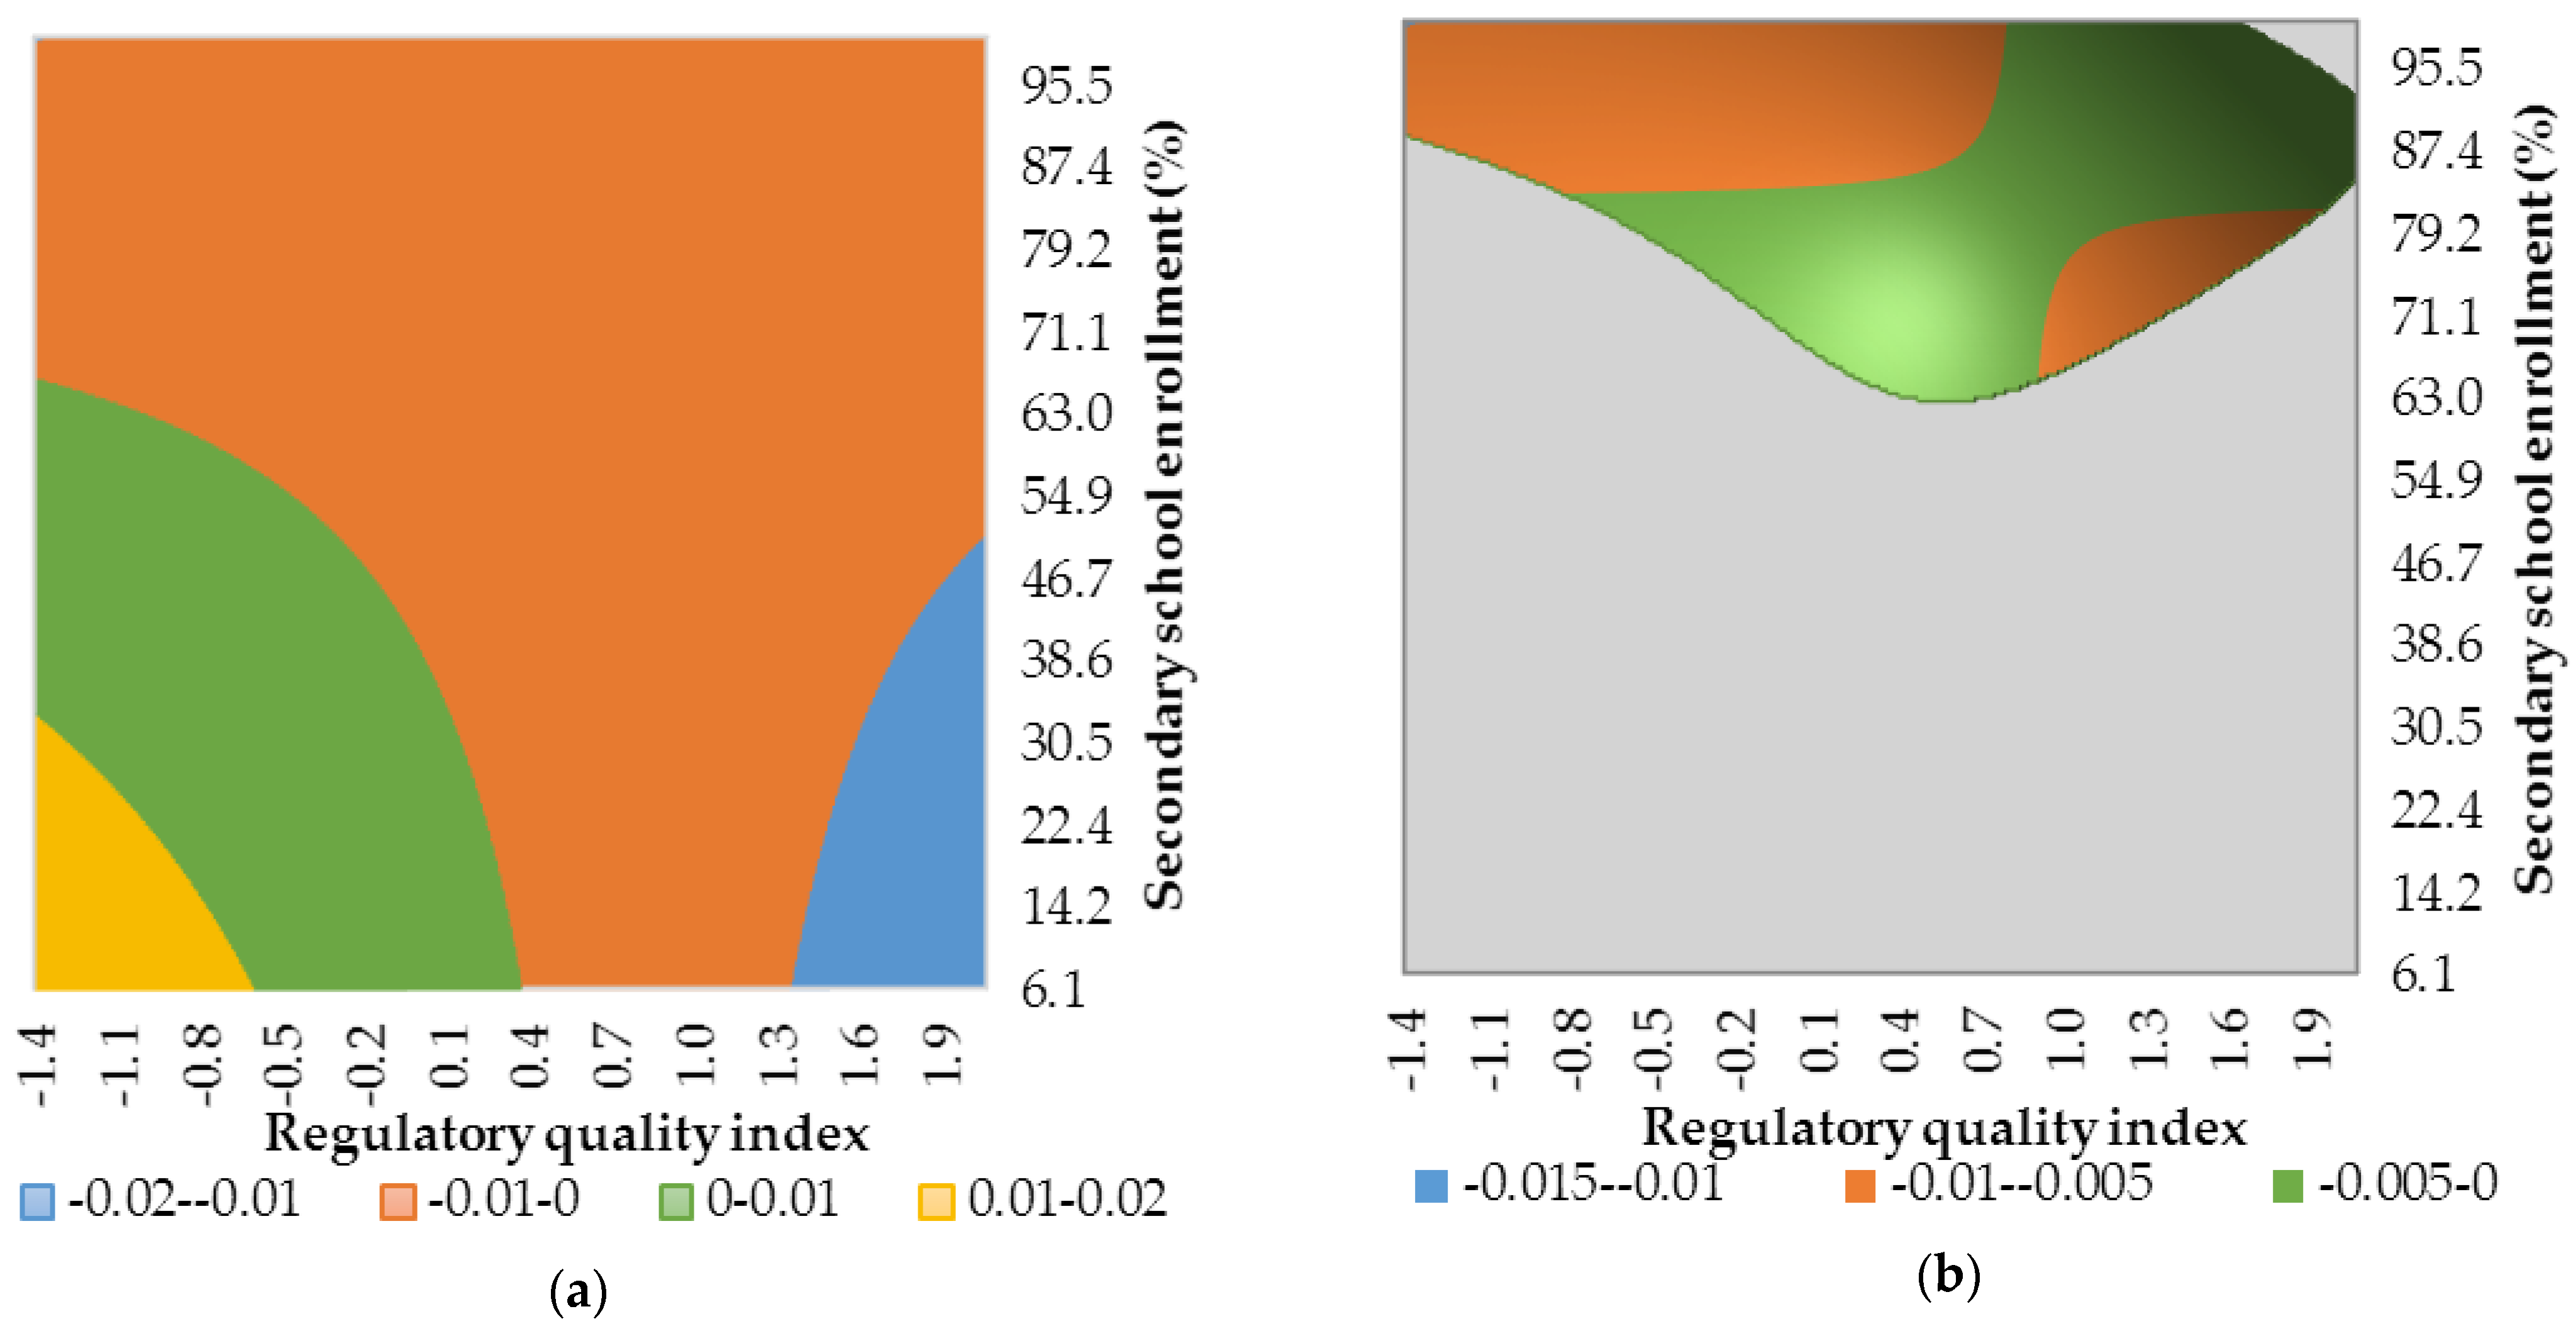
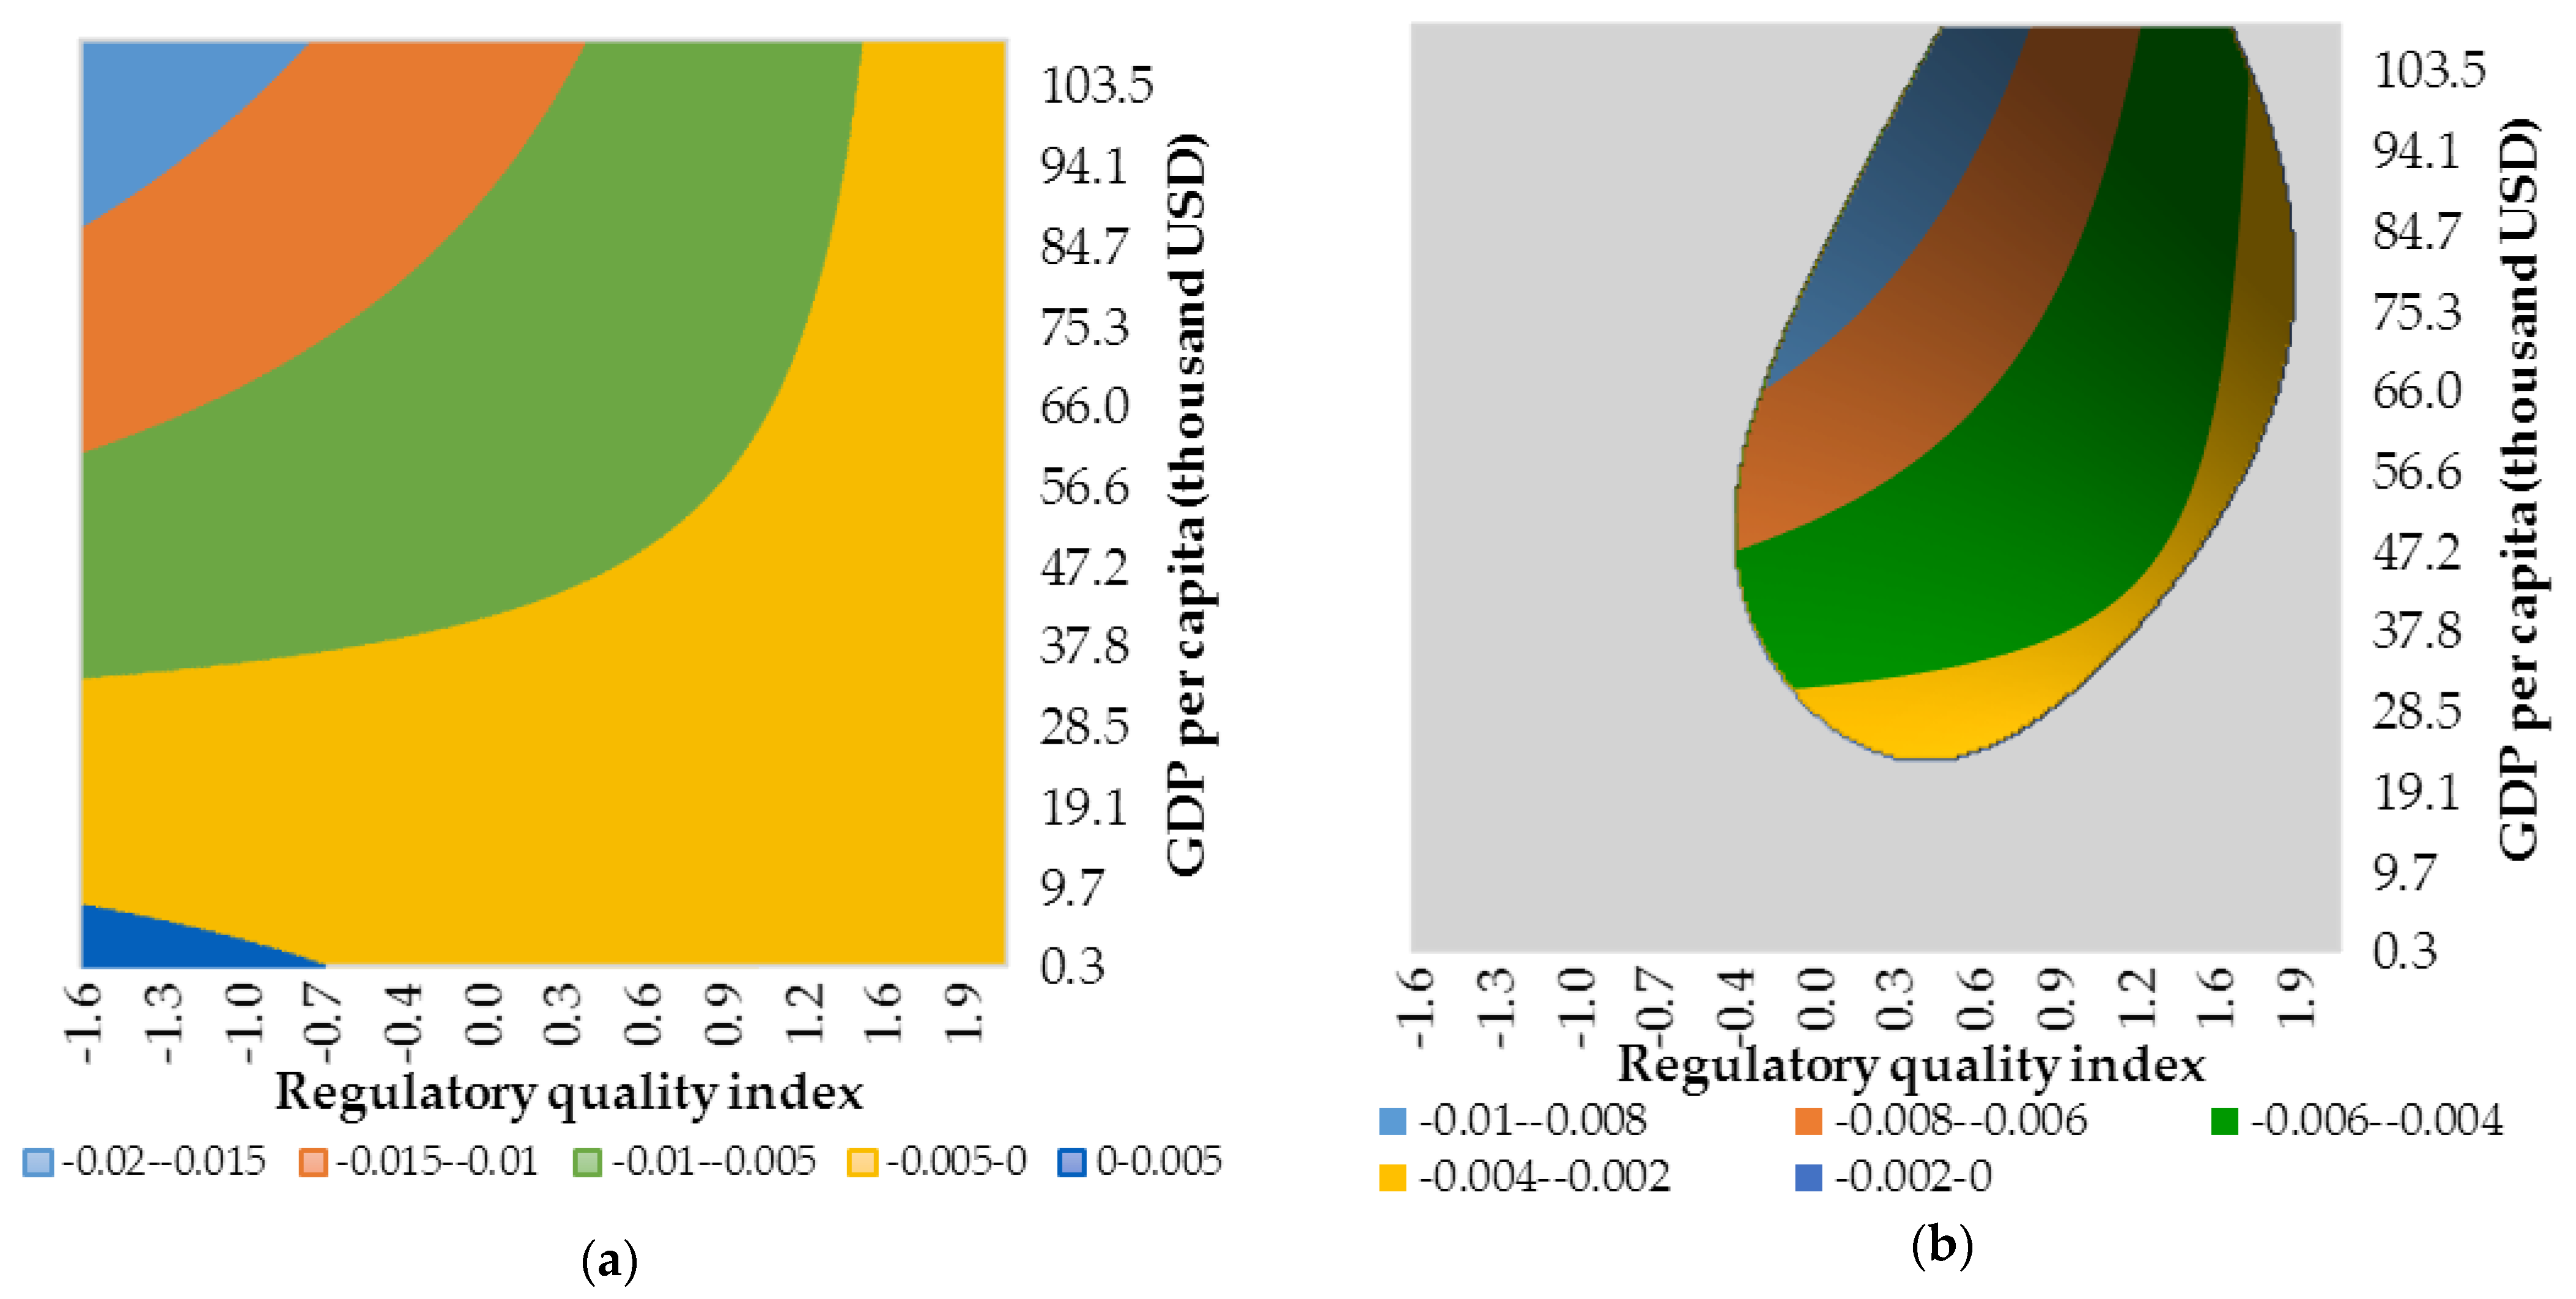
Figure A4.
Conditional effect of financialisation on growth based on Est. 4 in Table A2. (a) Estimated conditional slope coefficient over the whole range of observed values for institutional quality and development level. (b) Estimated statistically significant conditional slope coefficient. Gray represents a combination of institutional quality and development level for which effect of financialisation on growth is statistically insignificant. Source: authors’ contributions.

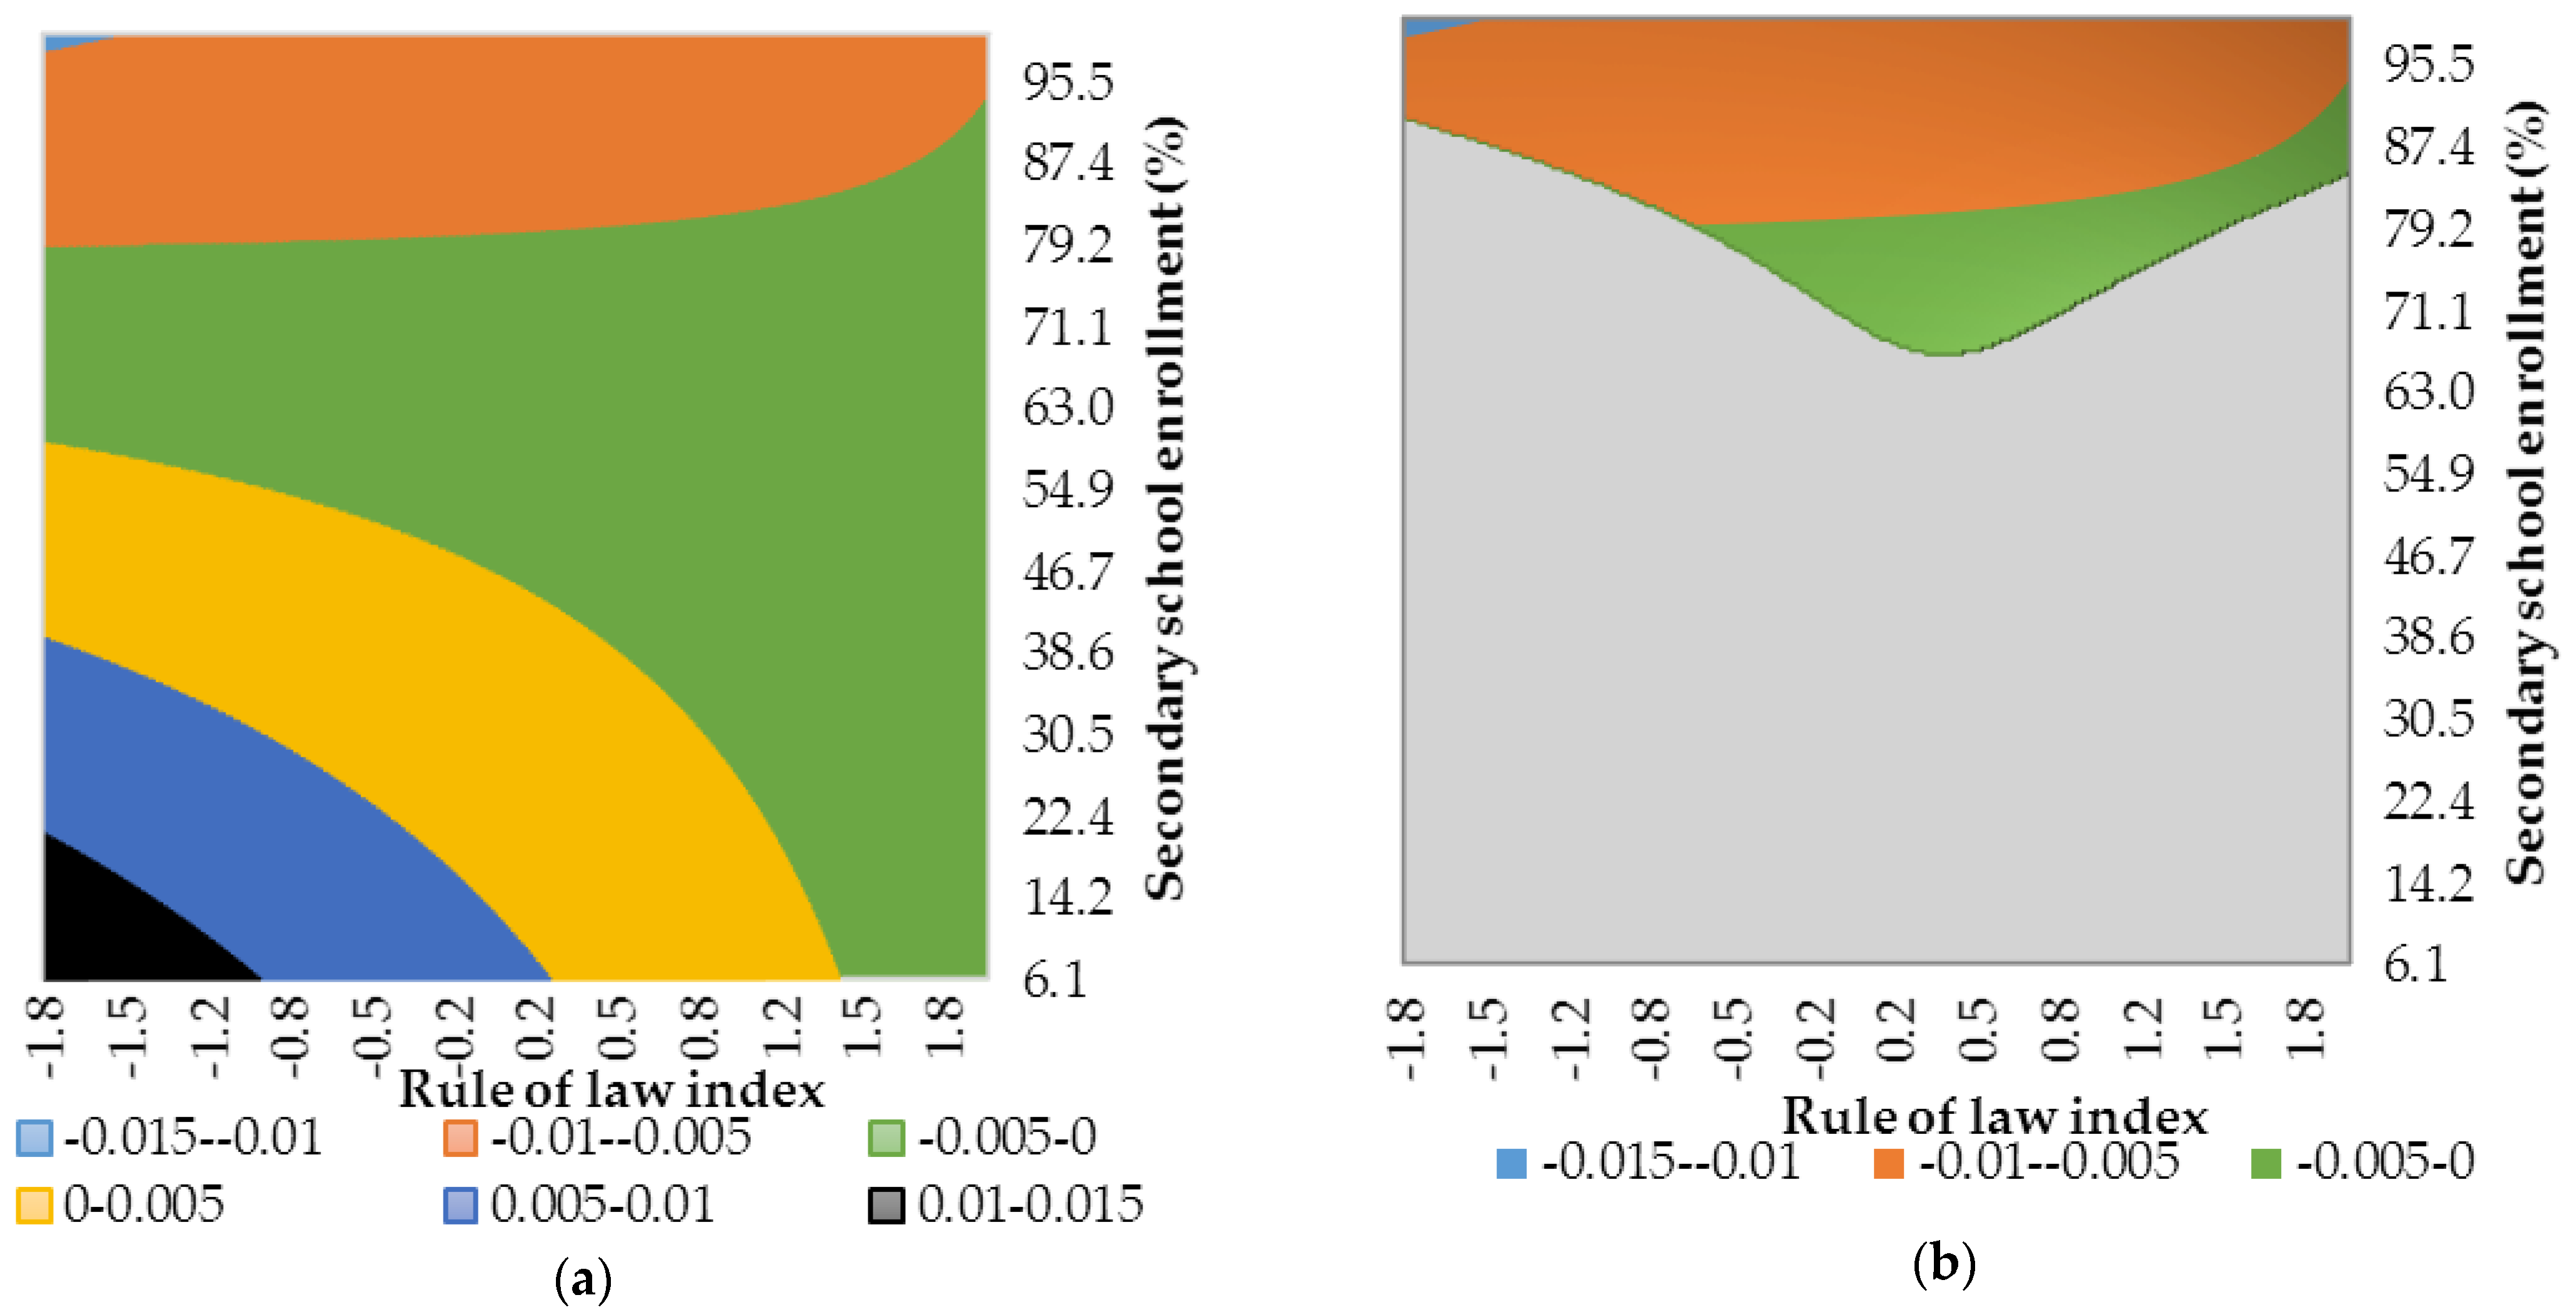
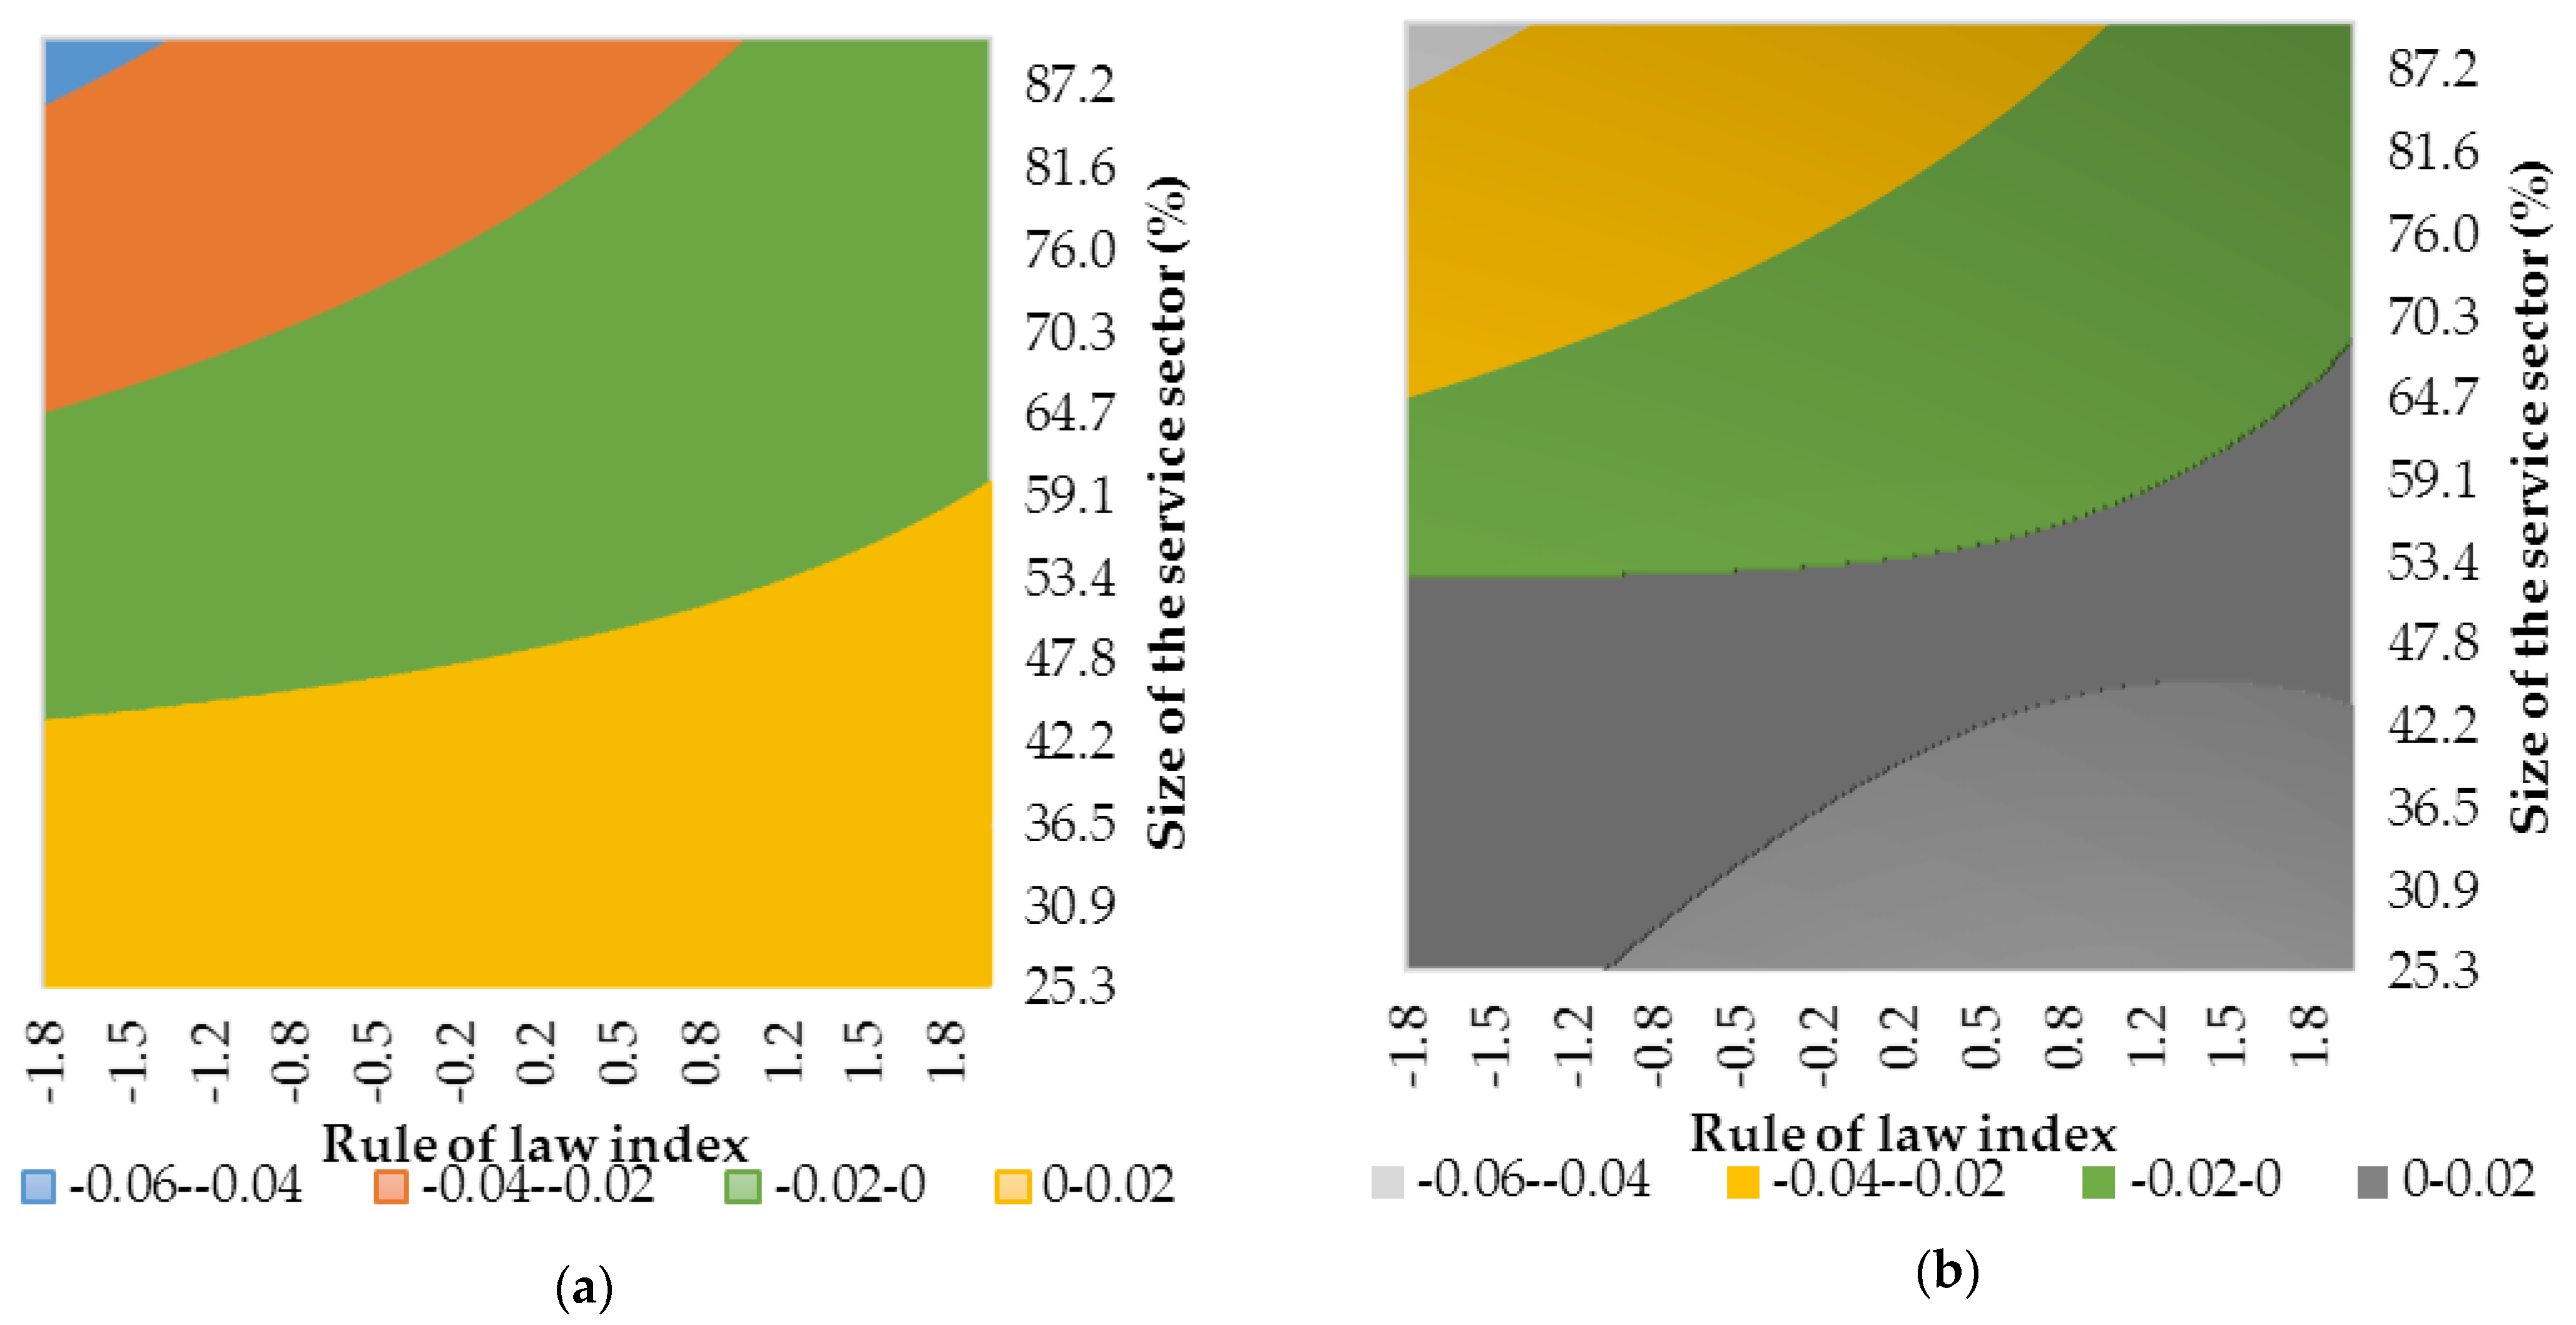
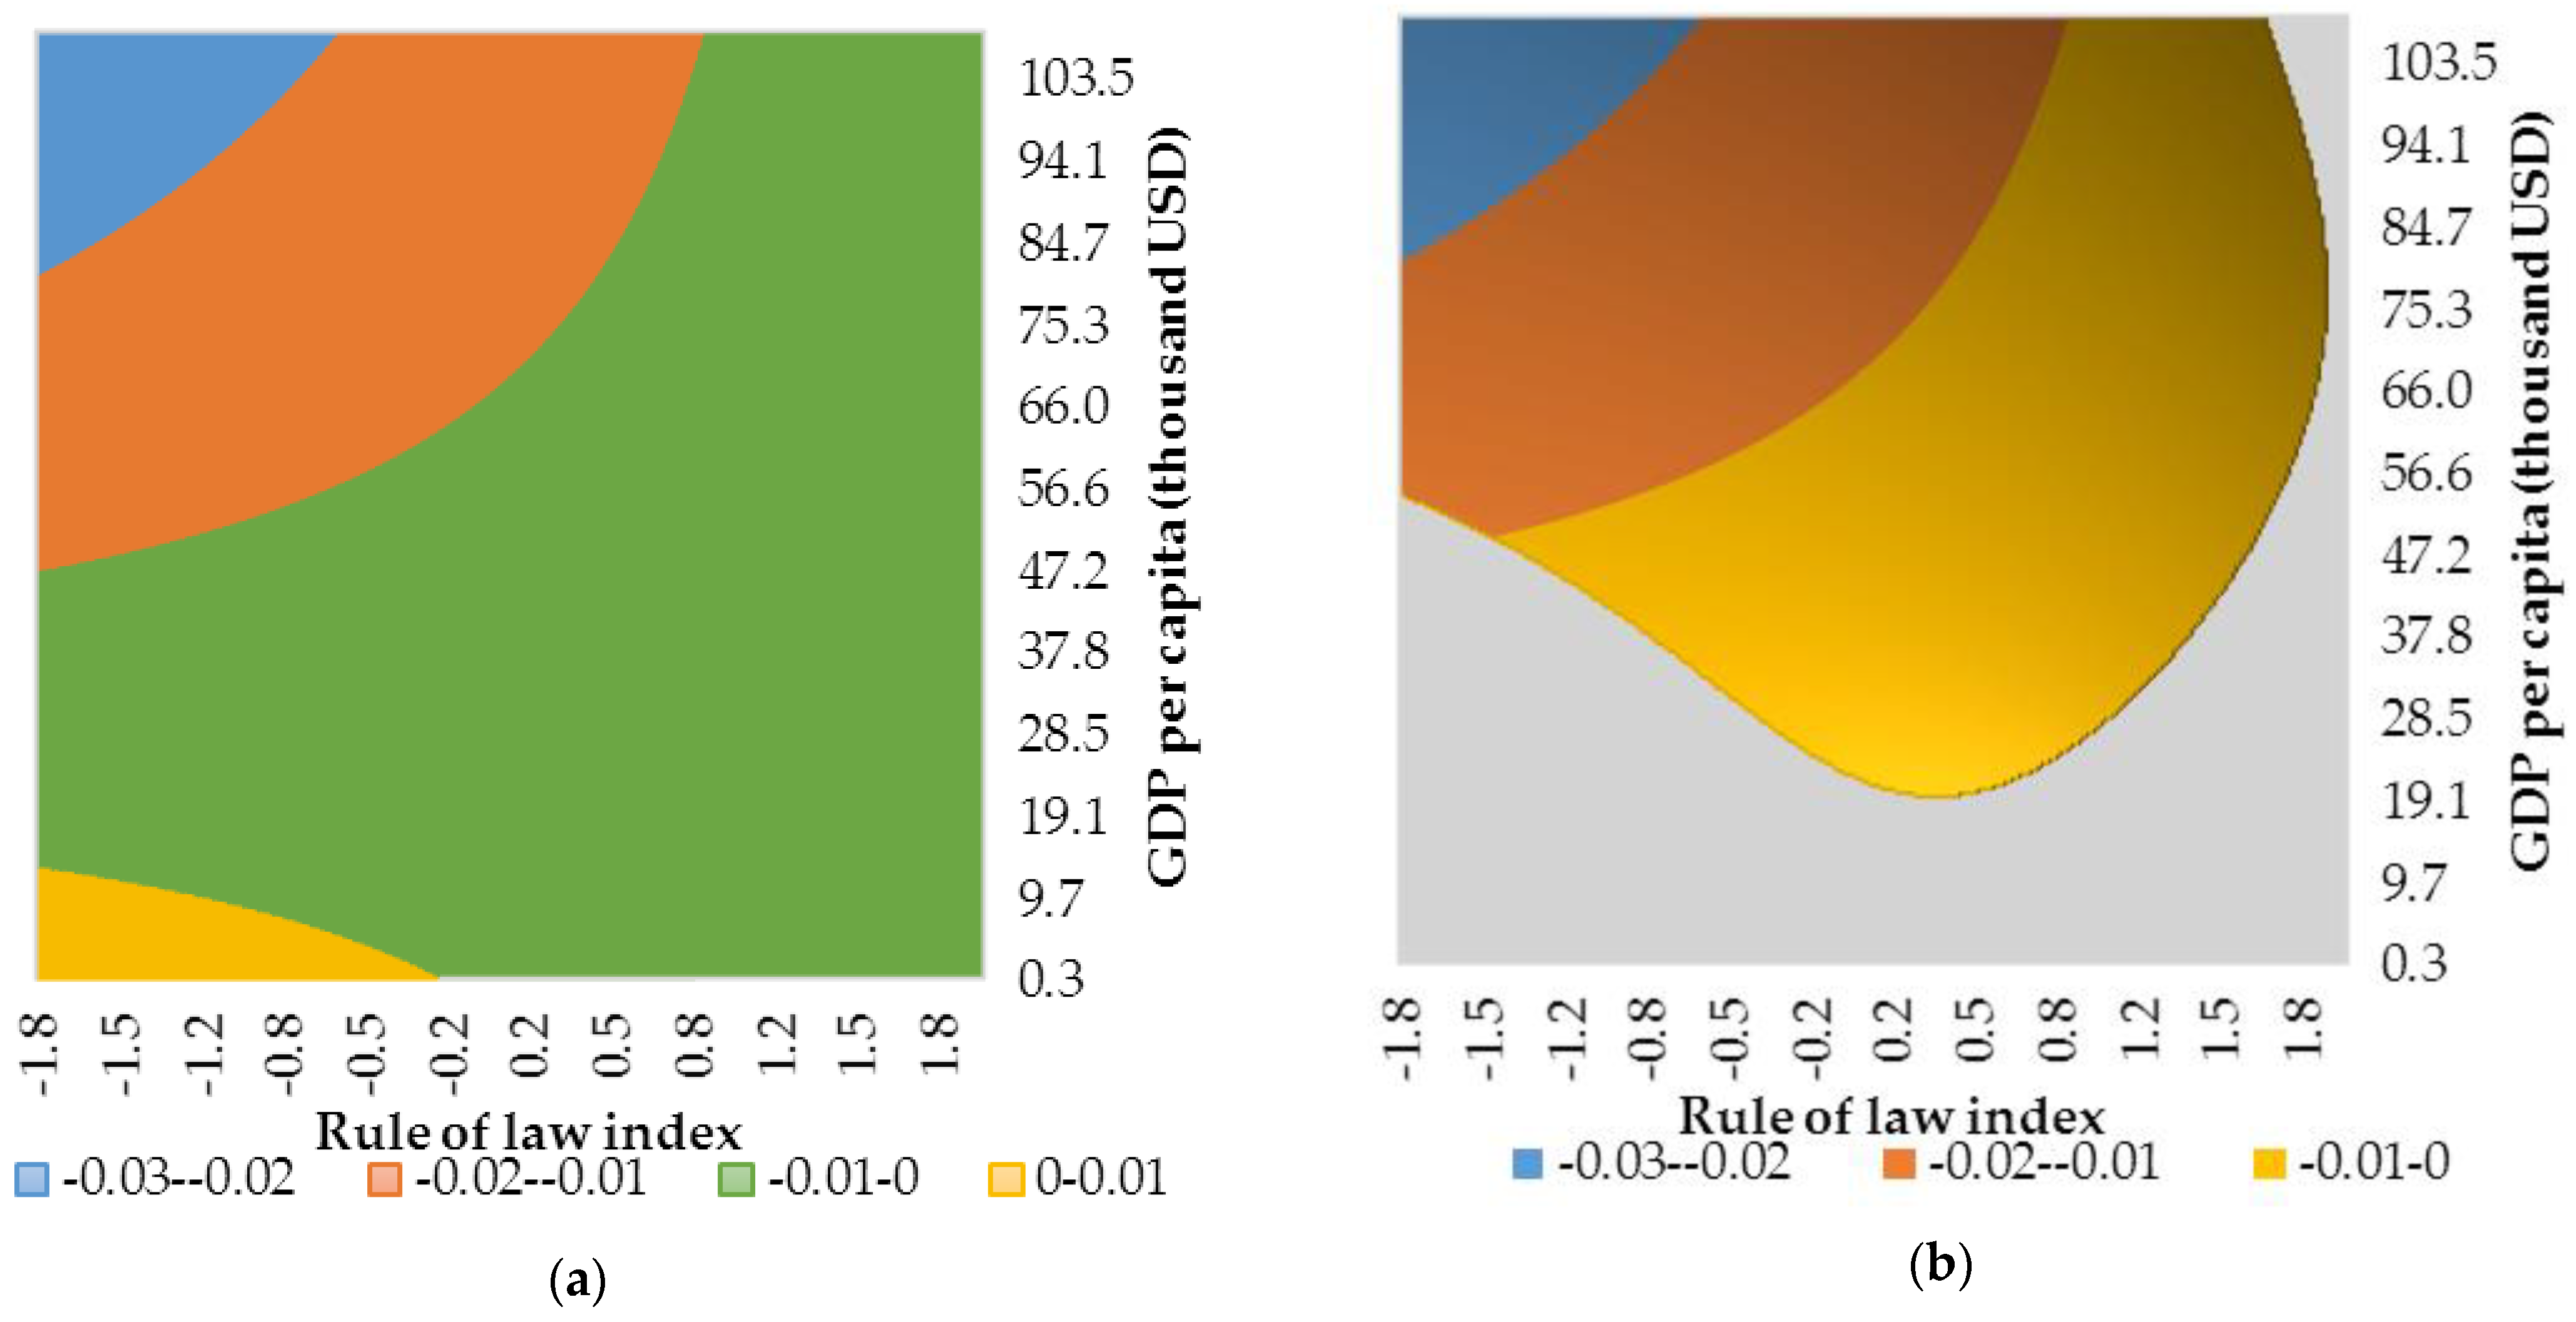
Figure A5.
Conditional effect of financialisation on growth based on Est. 5 in Table A2. (a) Estimated conditional slope coefficient over the whole range of observed values for institutional quality and development level. (b) Estimated statistically significant conditional slope coefficient. Gray represents a combination of institutional quality and development level for which effect of financialisation on growth is statistically insignificant. Source: authors’ contributions.

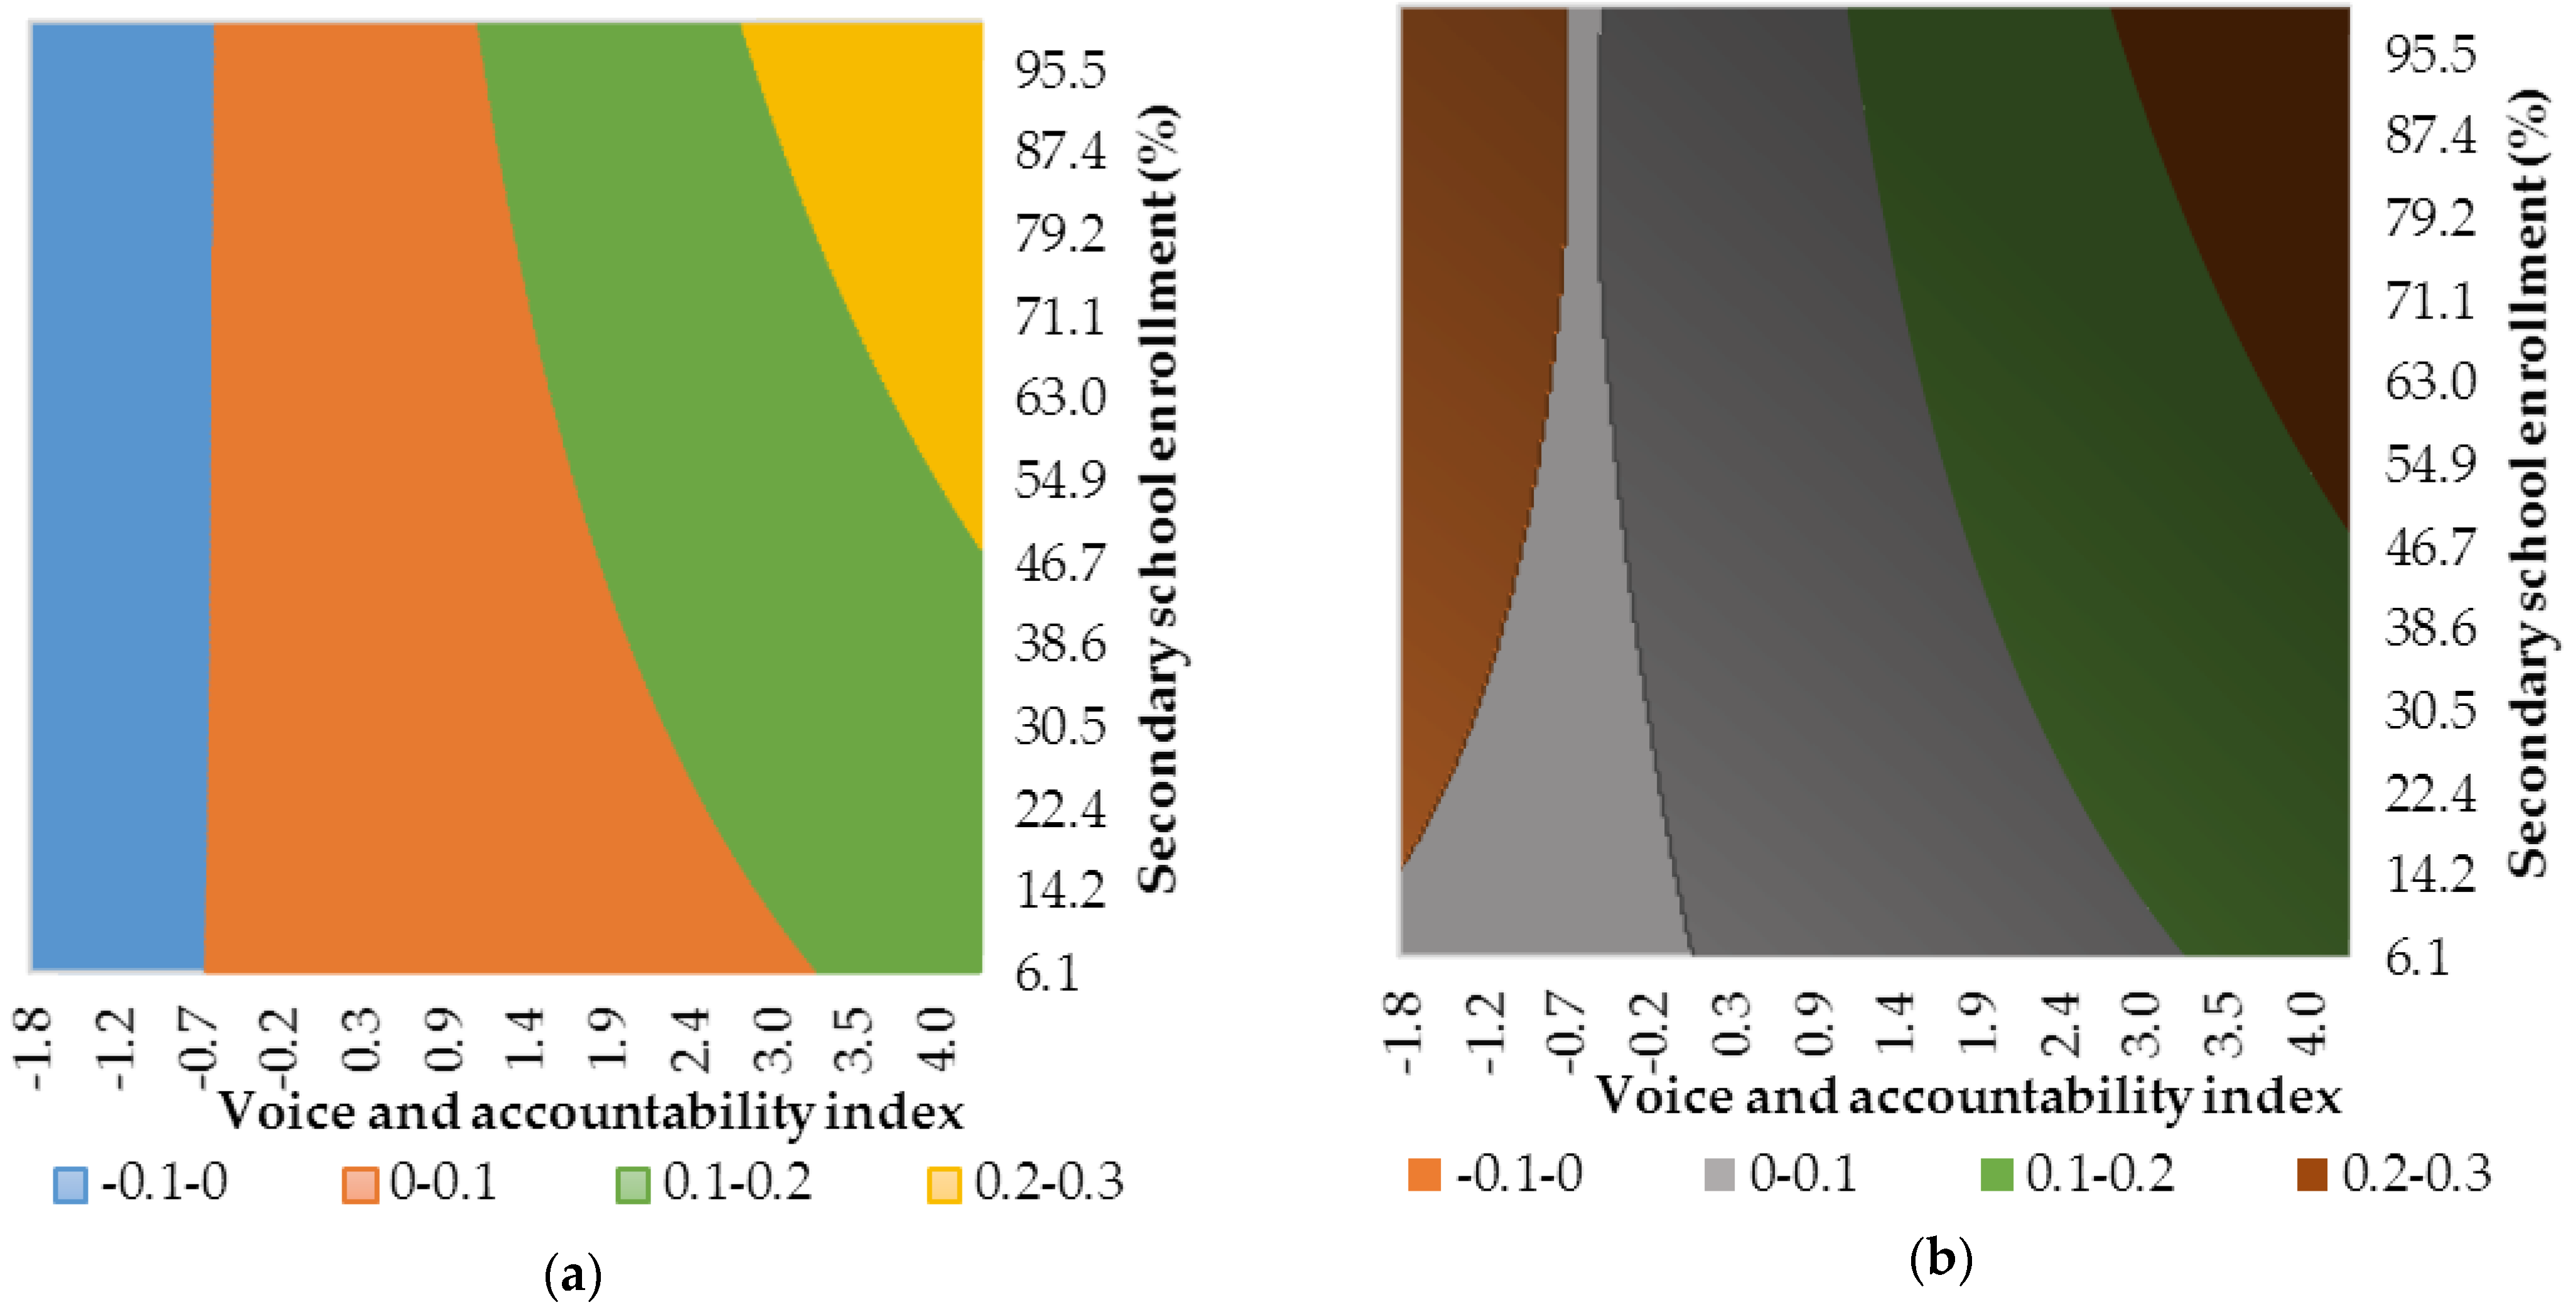
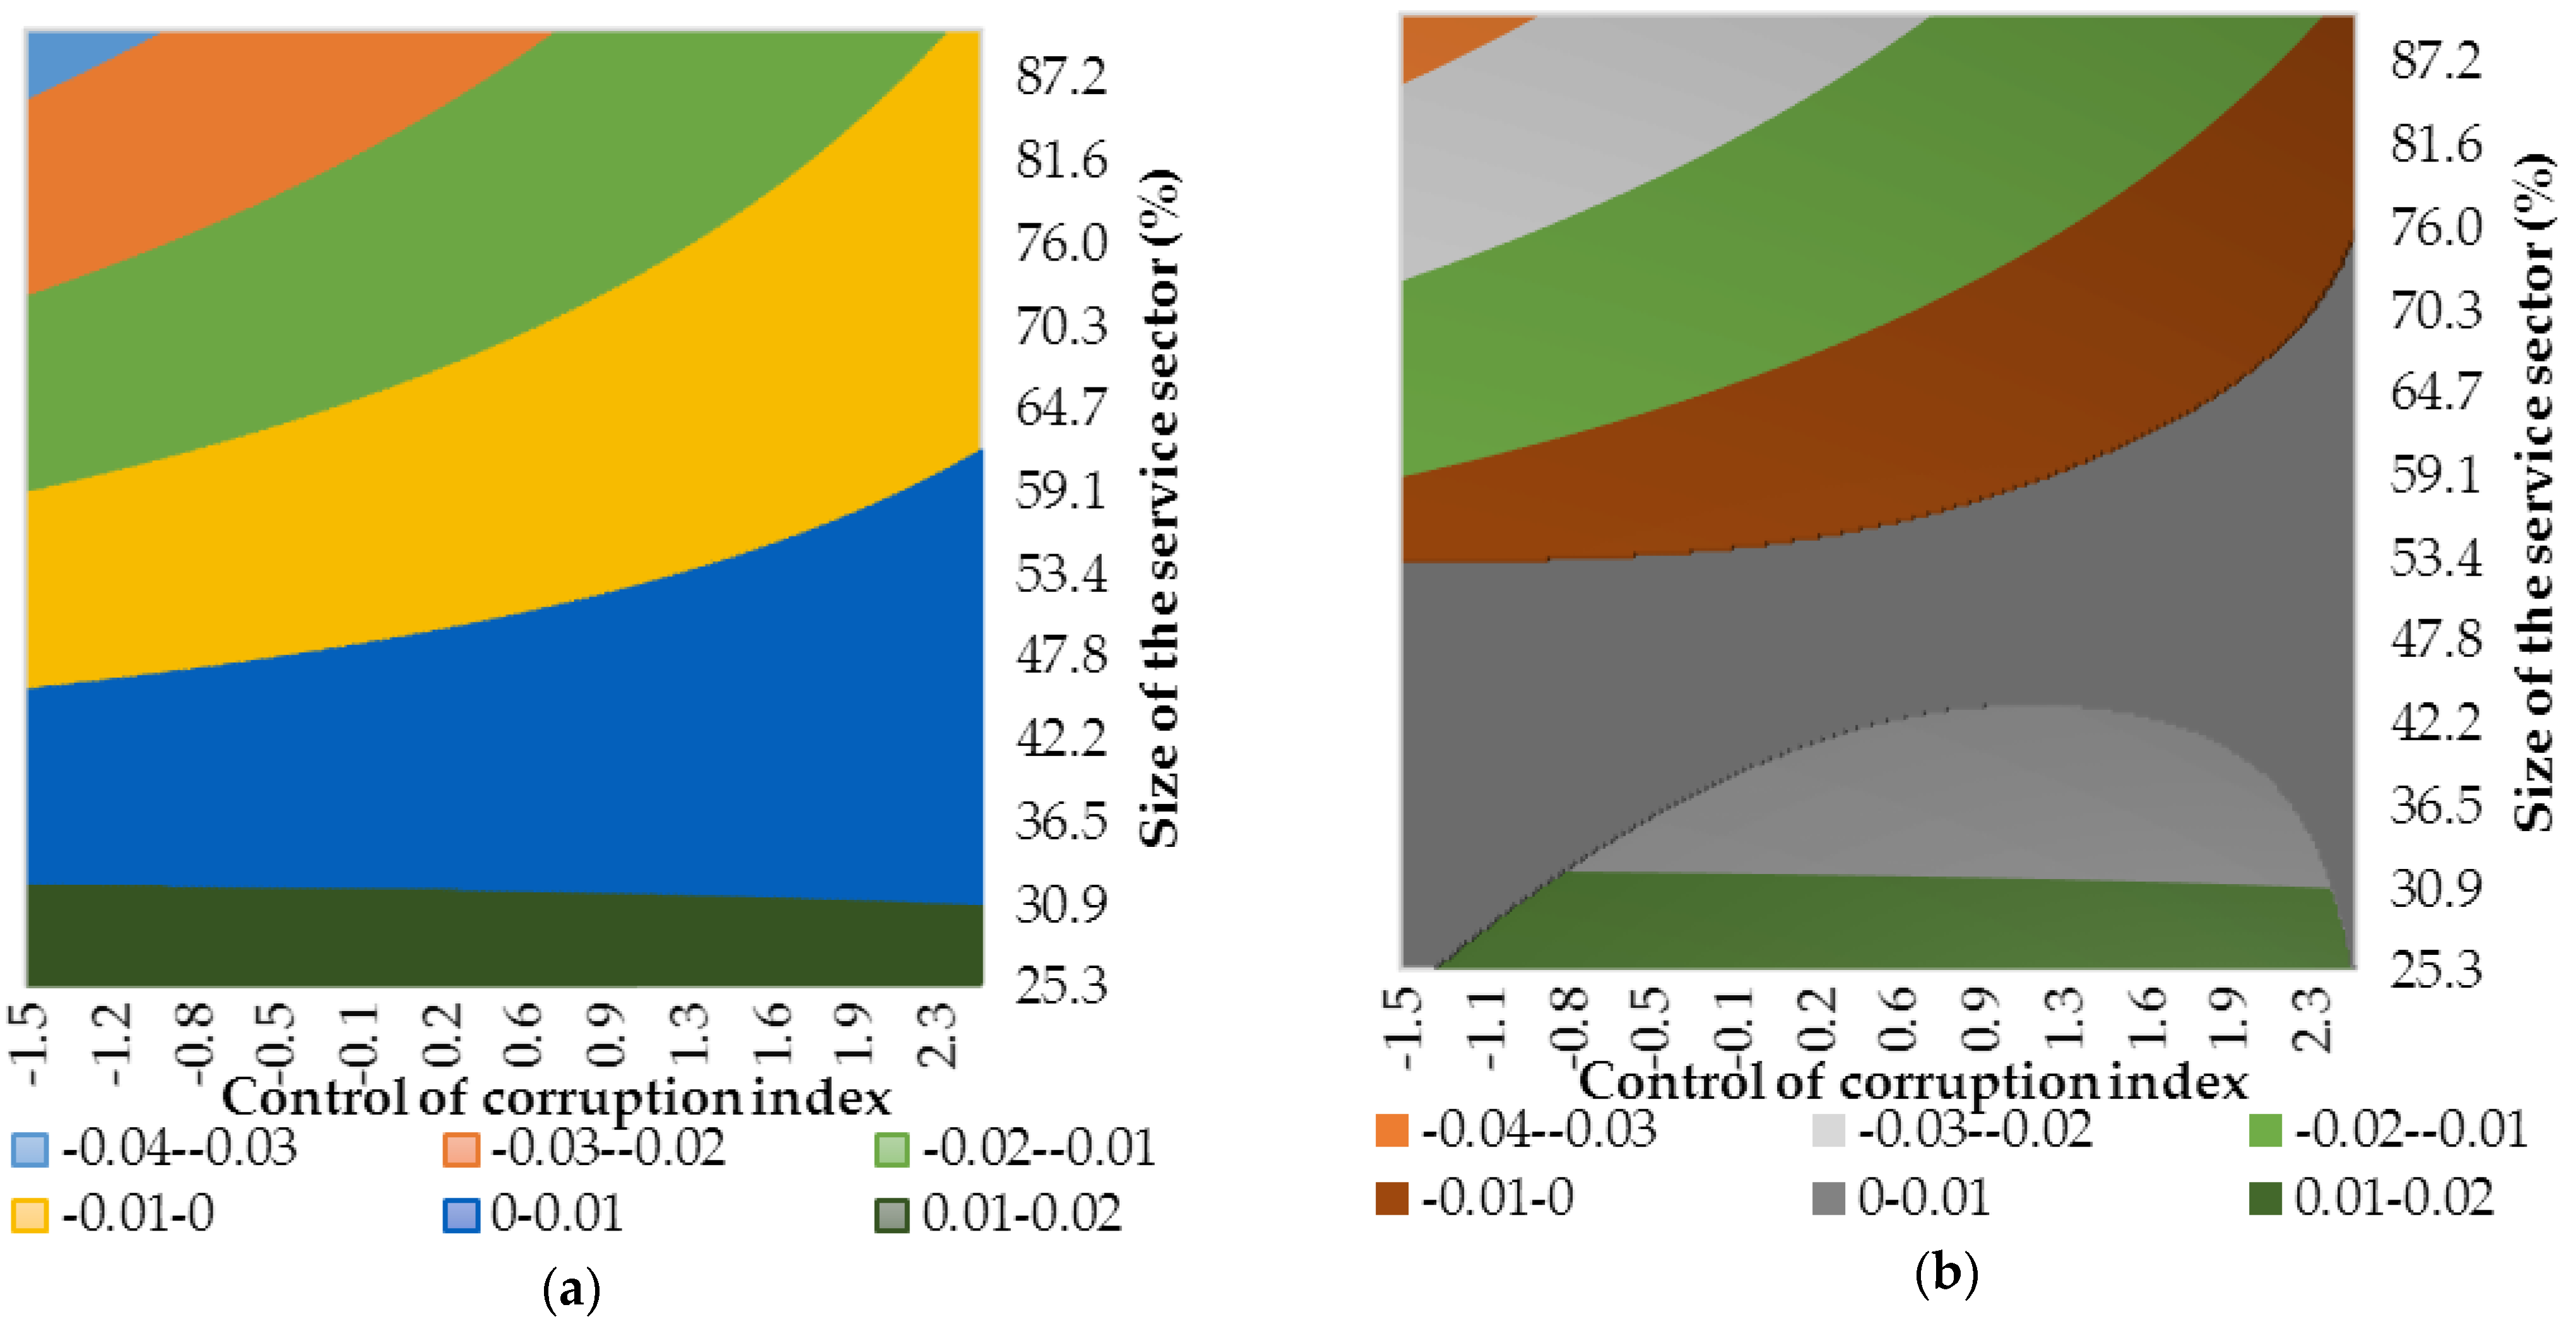
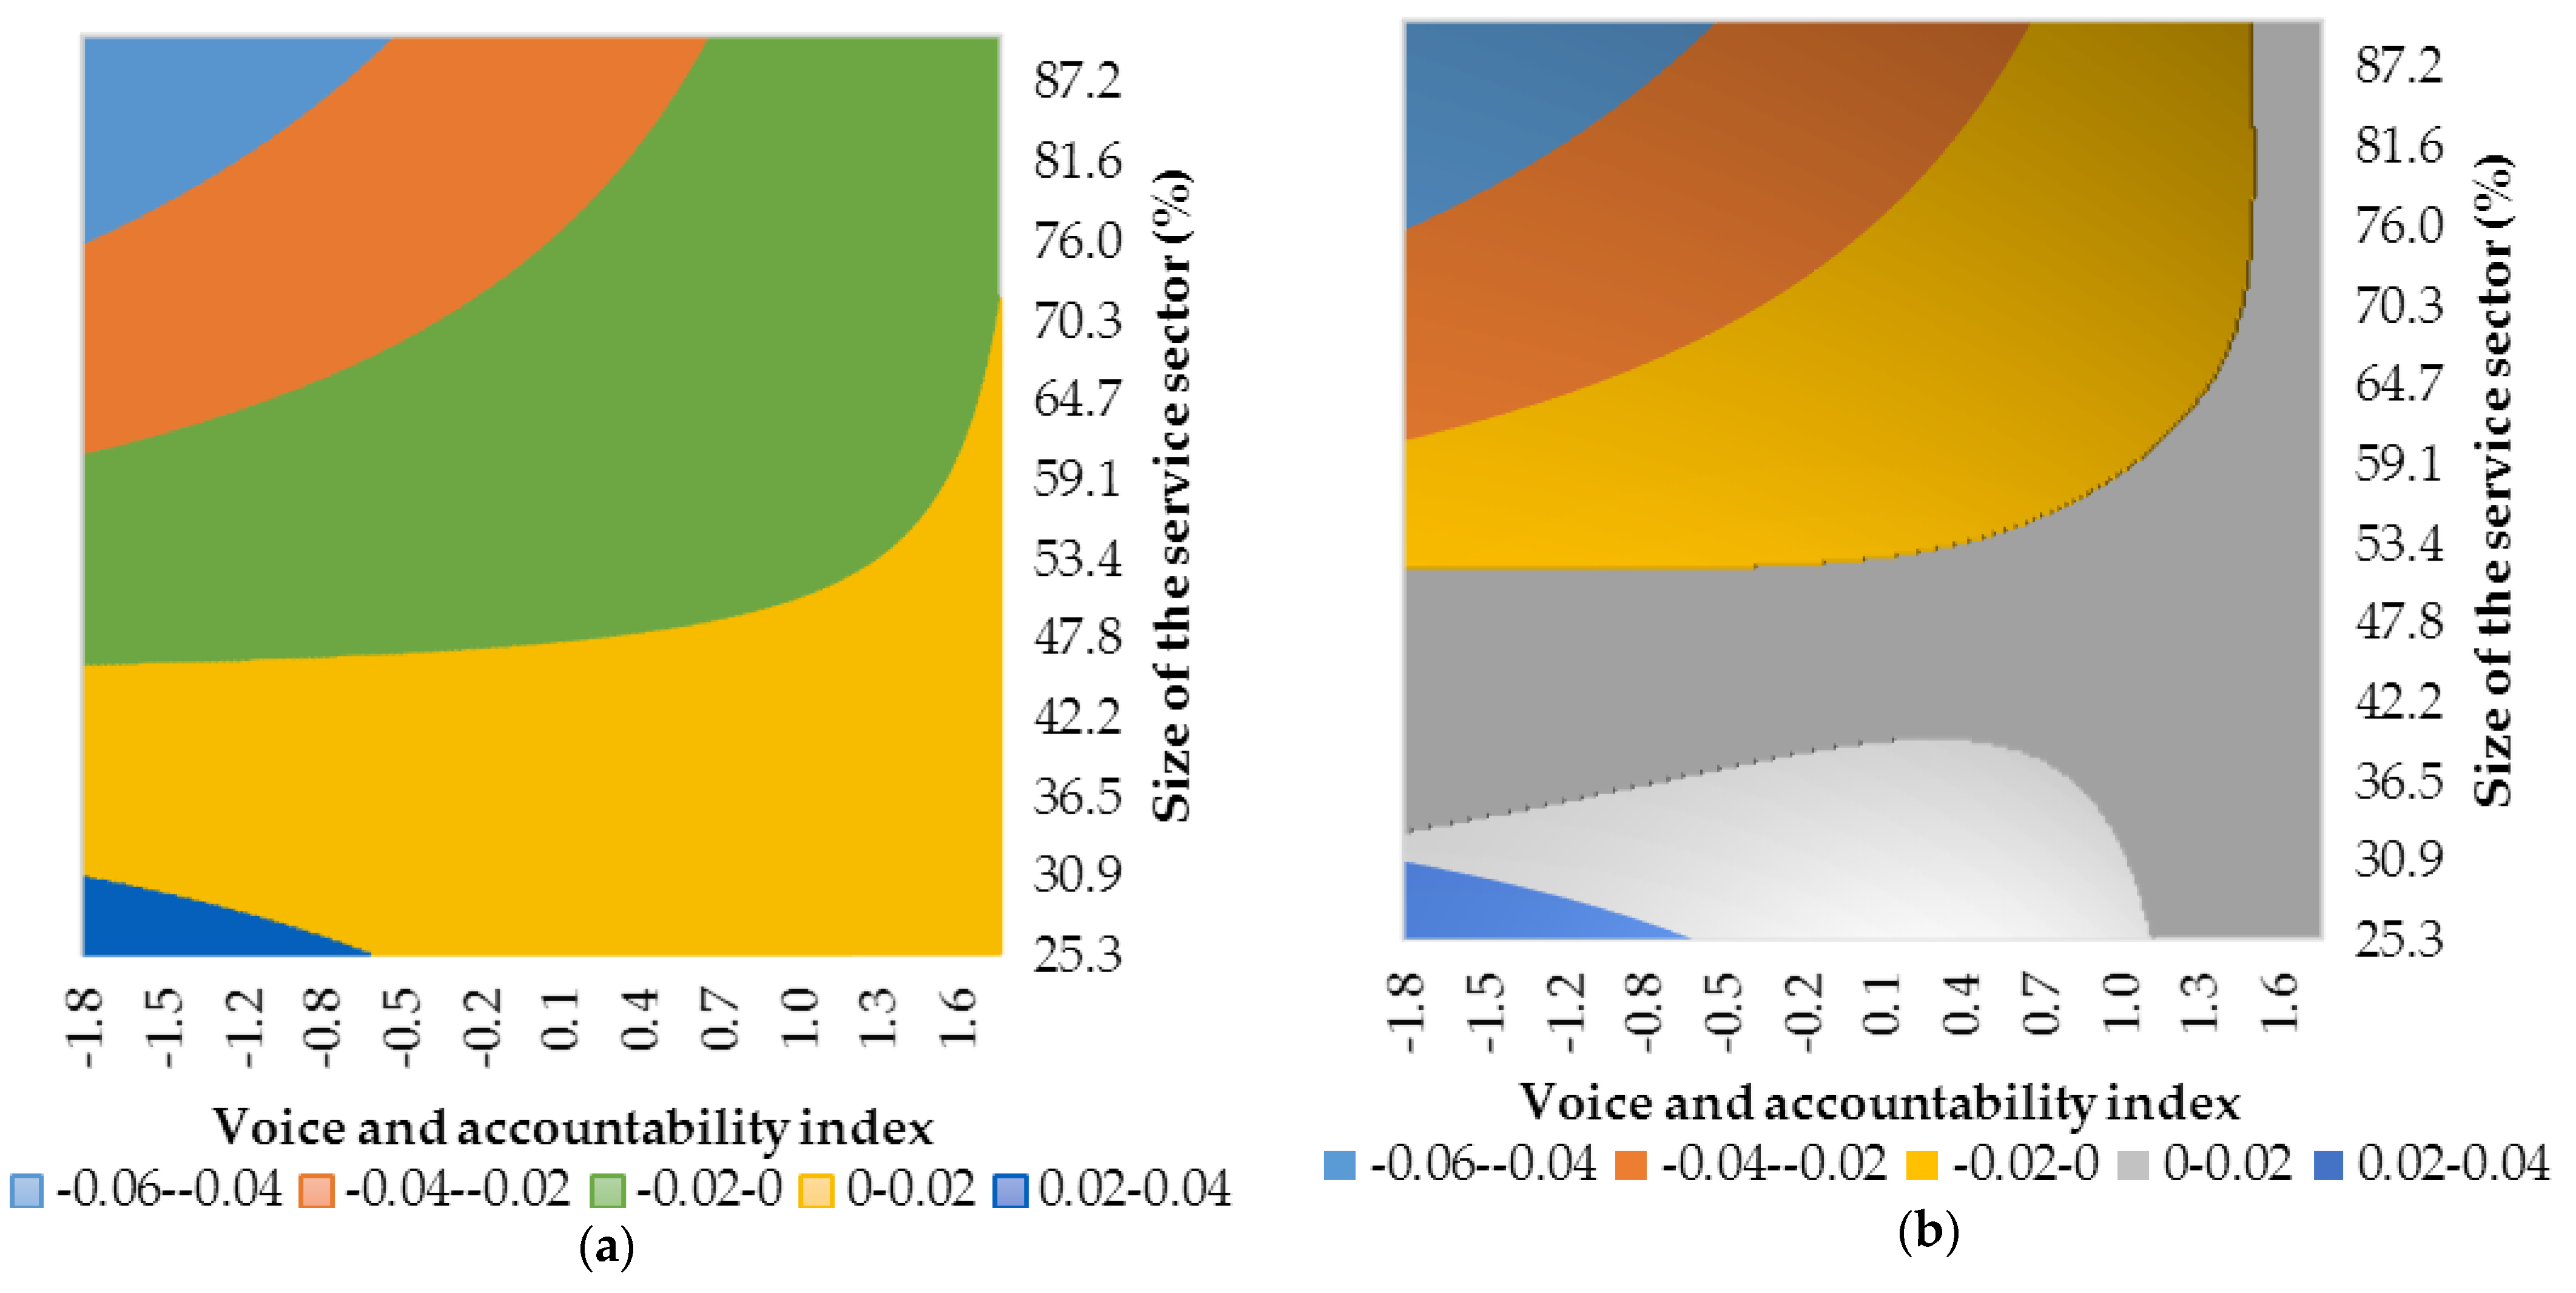
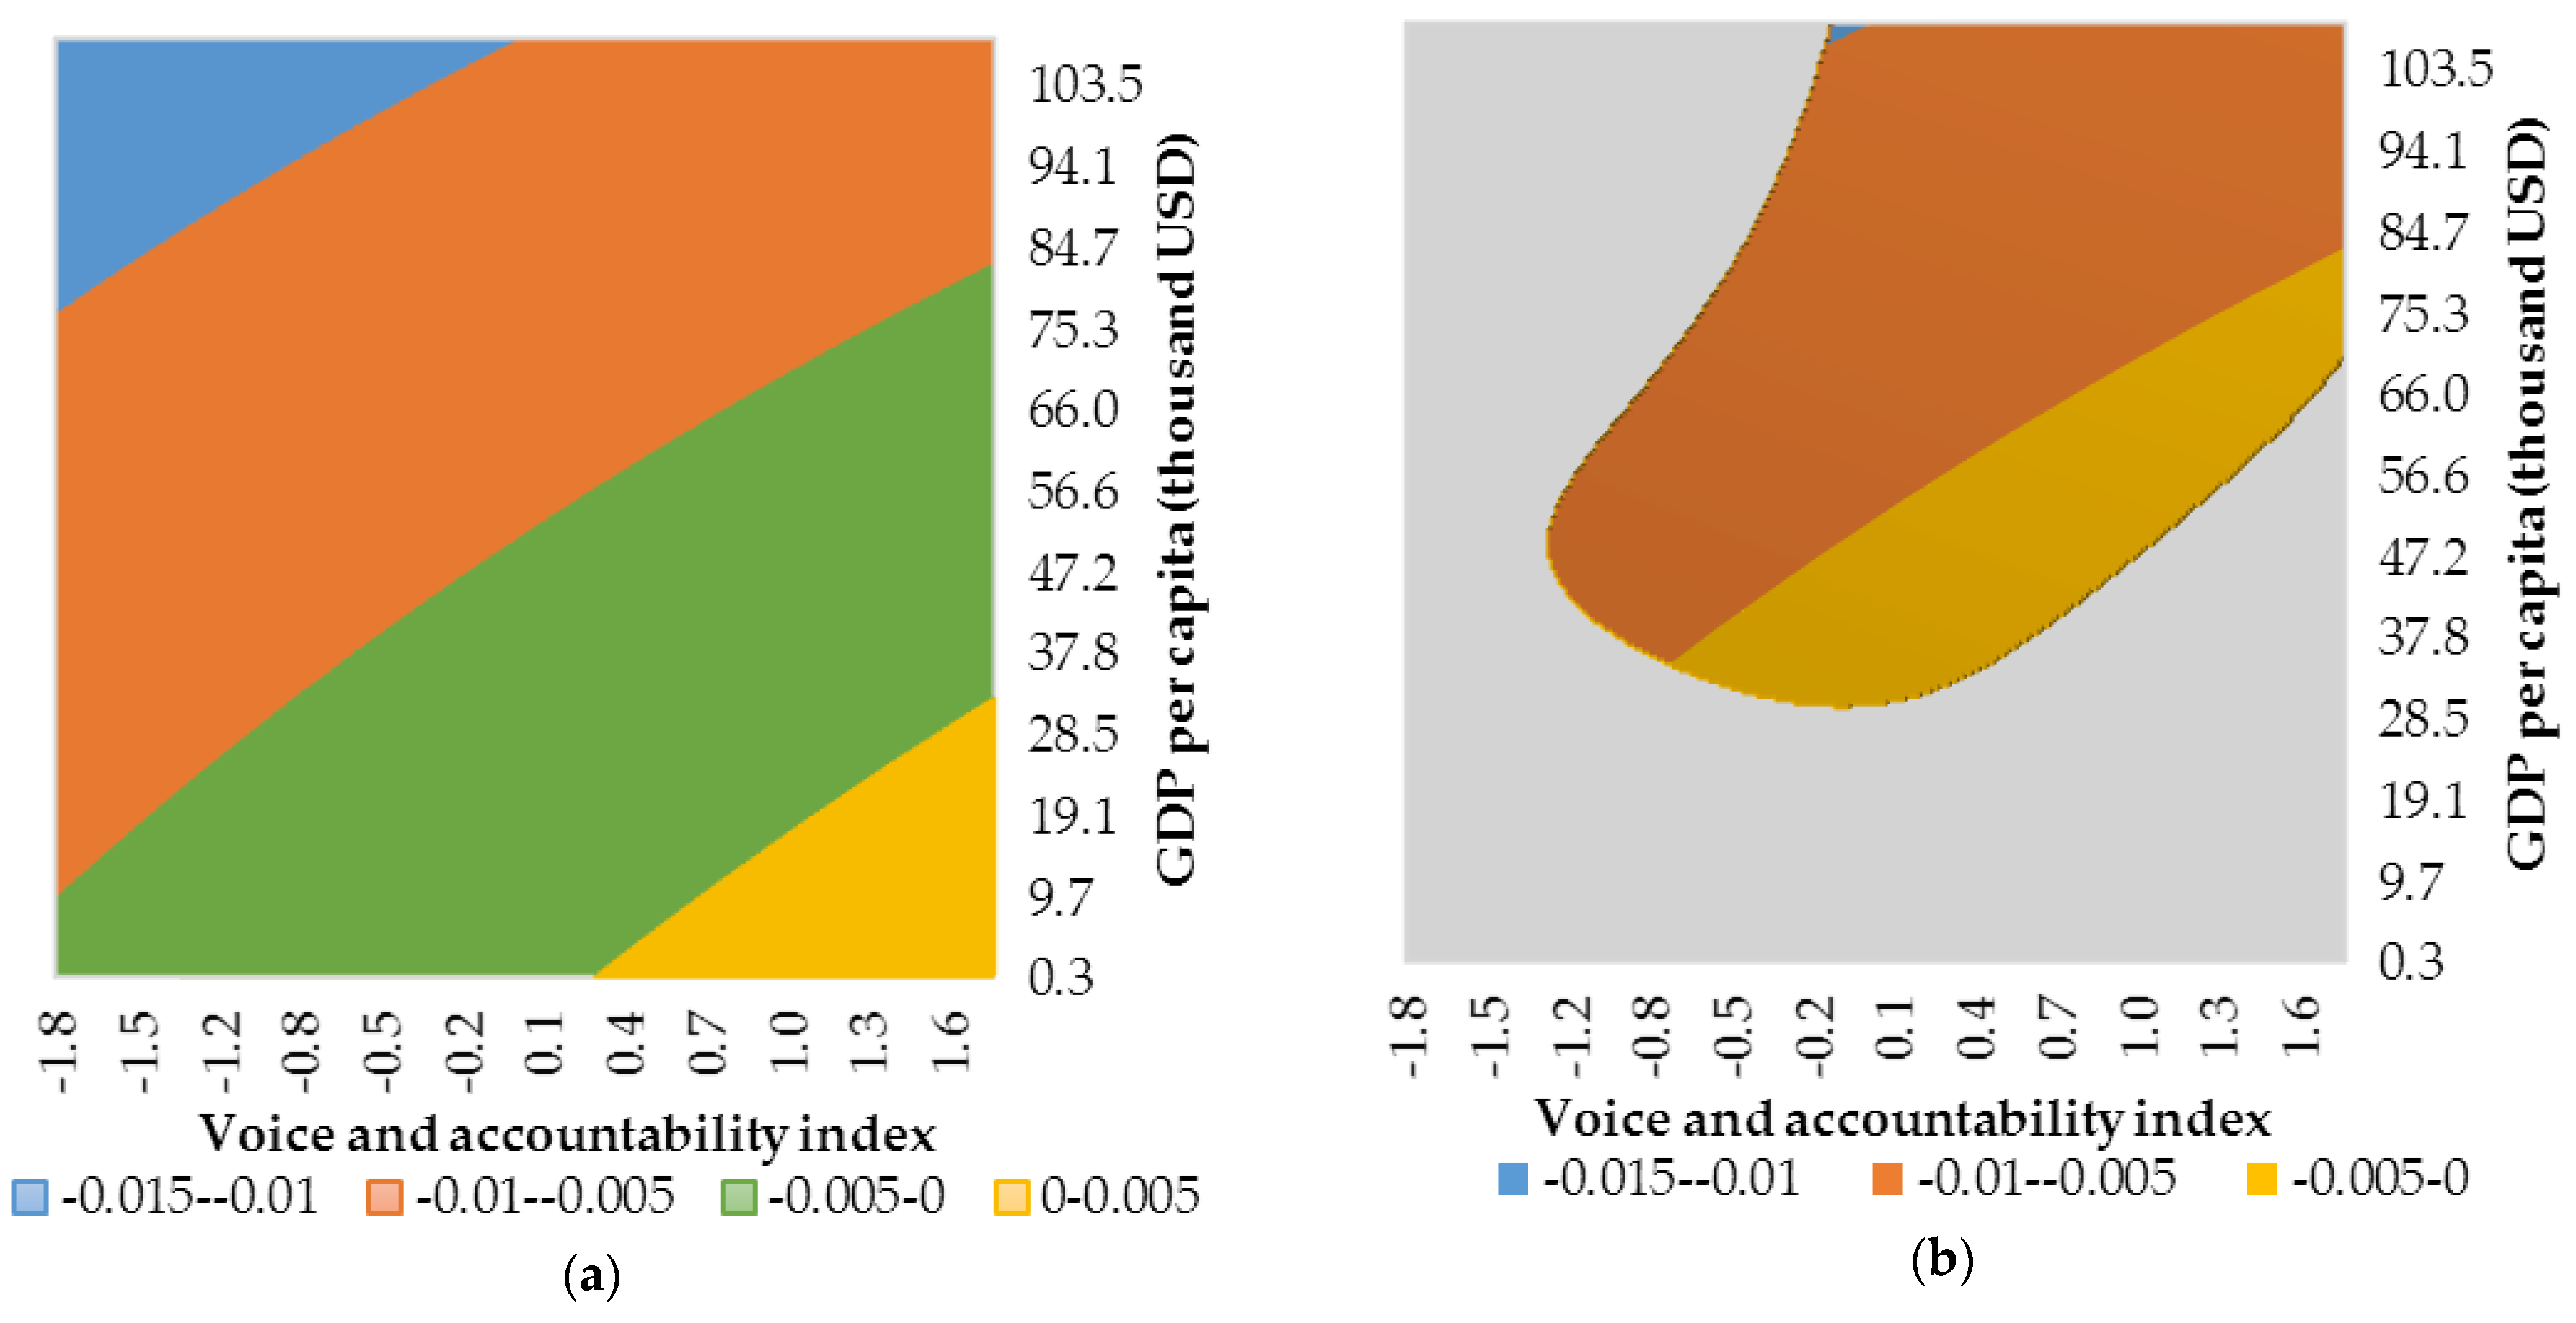
Figure A6.
Conditional effect of financialisation on growth based on Est. 6 in Table A2. (a) Estimated conditional slope coefficient over the whole range of observed values for institutional quality and development level. (b) Estimated statistically significant conditional slope coefficient. Light gray represents a combination of institutional quality and development level for which effect of financialisation on growth is statistically insignificant. Source: authors’ contributions.

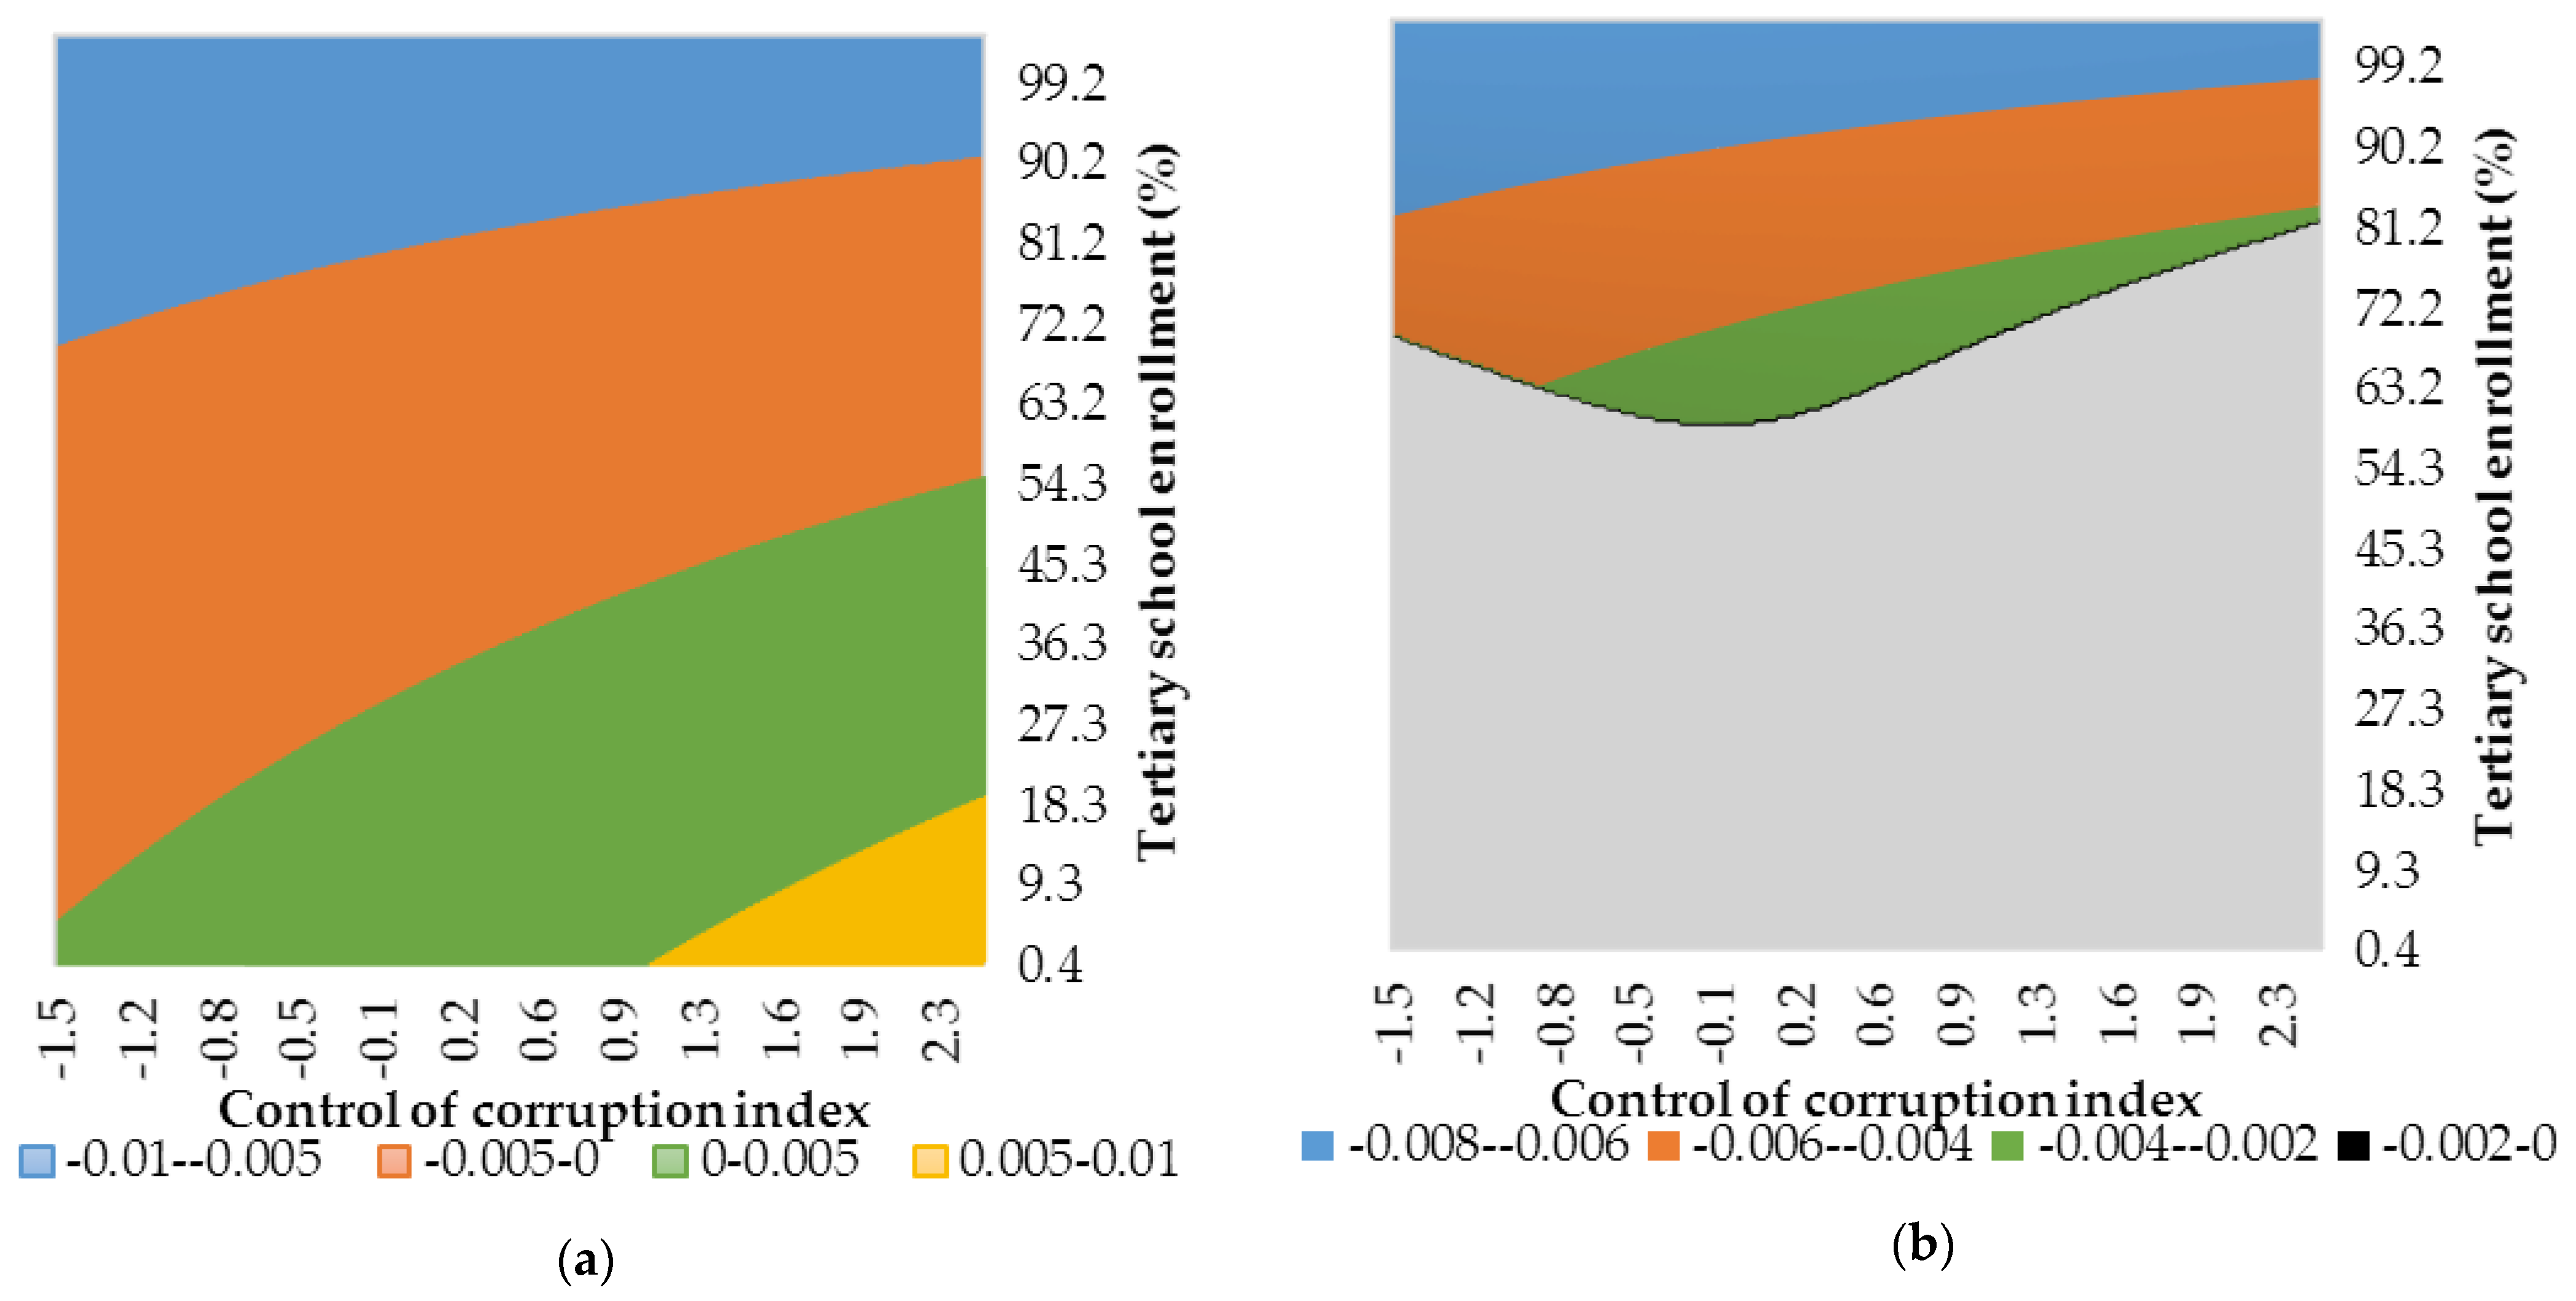
Figure A7.
Conditional effect of financialisation on growth based on Est. 7 in Table A2. (a) Estimated conditional slope coefficient over the whole range of observed values for institutional quality and development level. (b) Estimated statistically significant conditional slope coefficient. Gray represents a combination of institutional quality and development level for which effect of financialisation on growth is statistically insignificant. Source: authors’ contributions.

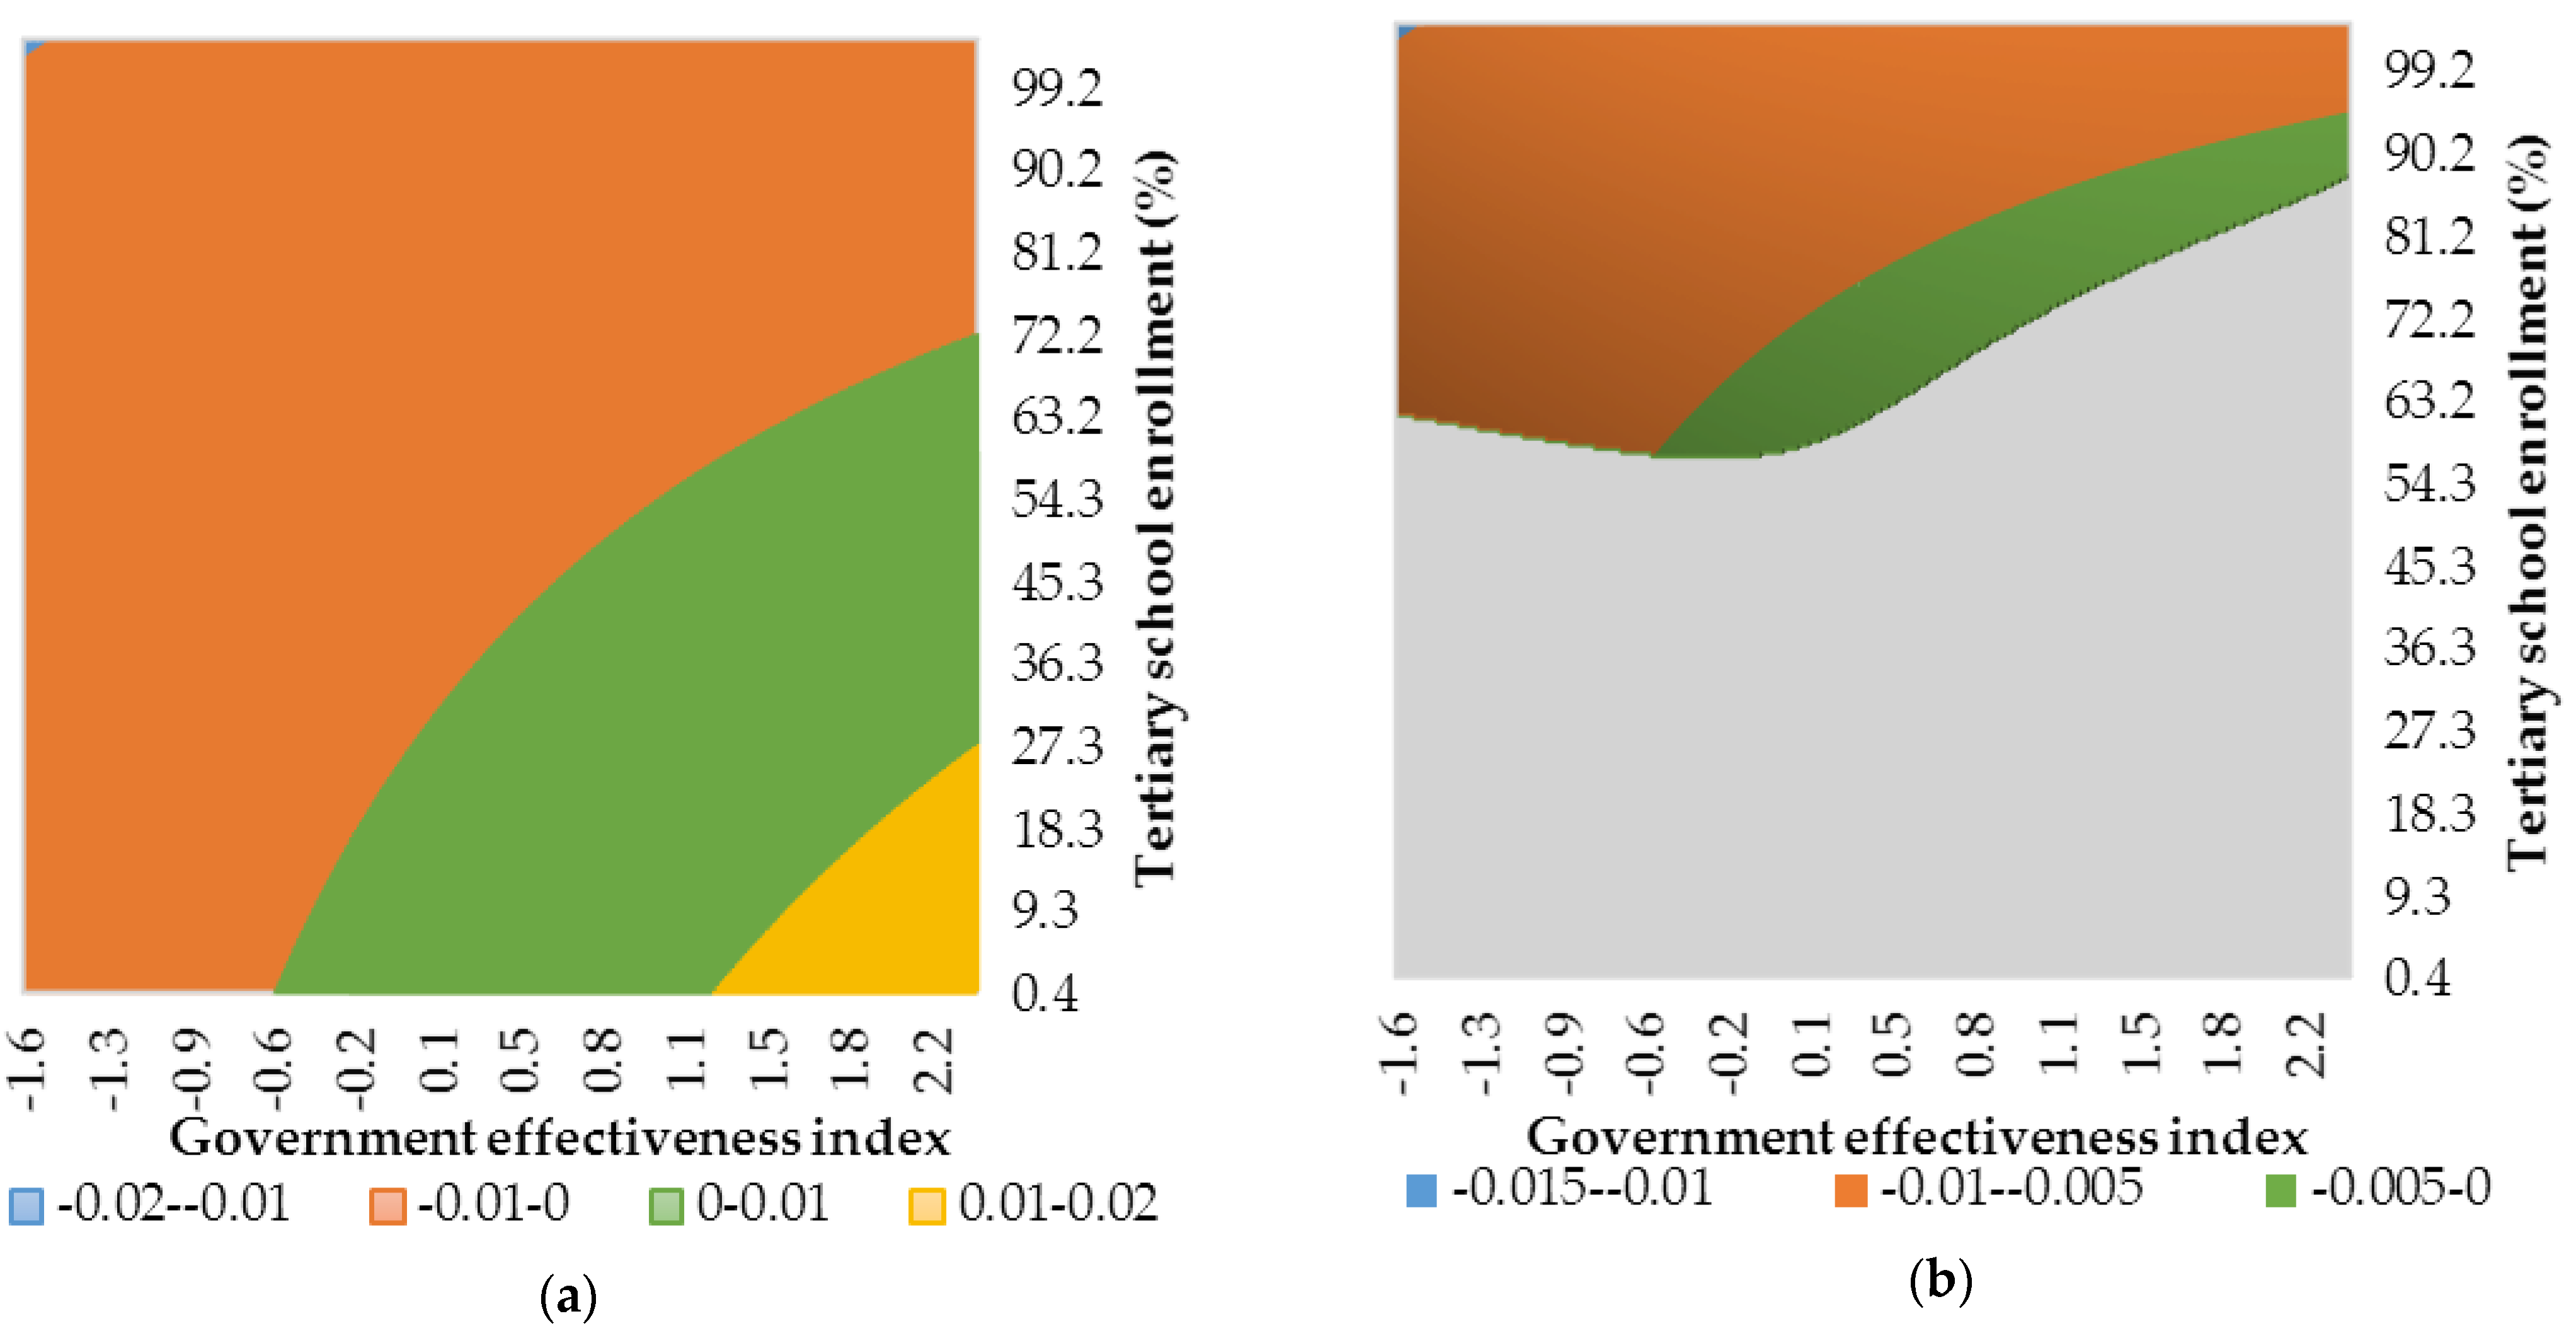
Figure A8.
Conditional effect of financialisation on growth based on Est. 8 in Table A2. (a) Estimated conditional slope coefficient over the whole range of observed values for institutional quality and development level. (b) Estimated statistically significant conditional slope coefficient. Gray represents a combination of institutional quality and development level for which effect of financialisation on growth is statistically insignificant. Source: authors’ contributions.

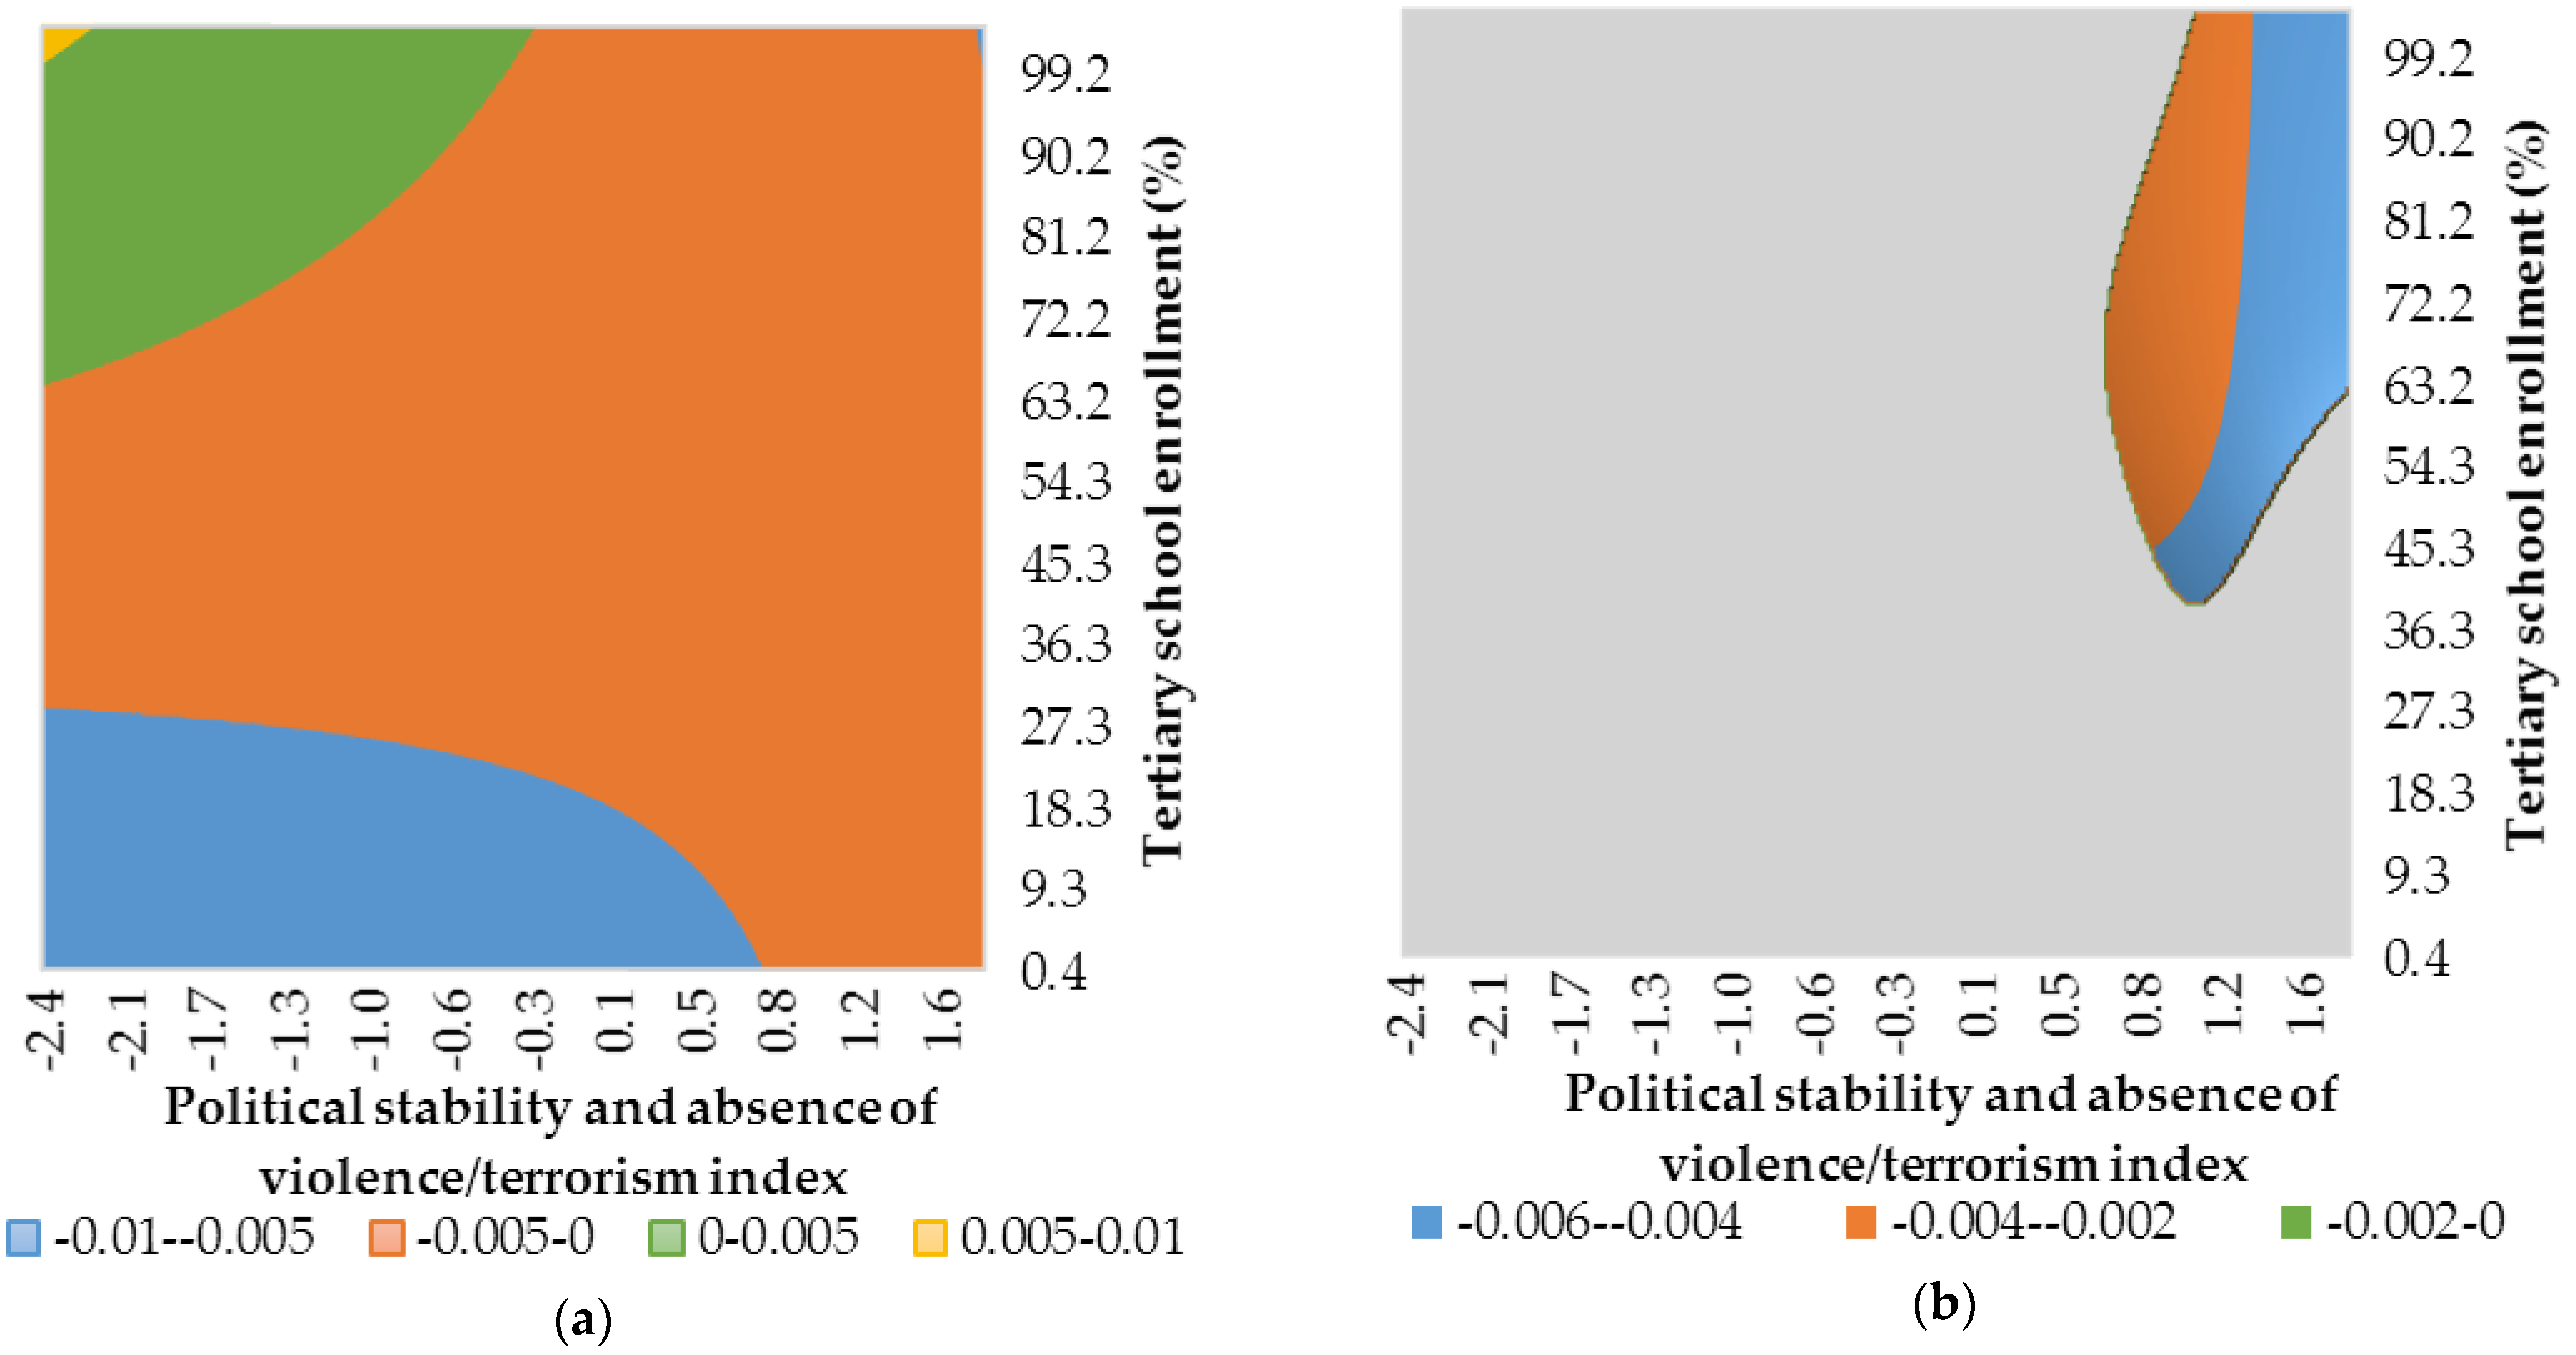
Figure A9.
Conditional effect of financialisation on growth based on Est. 9 in Table A2. (a) Estimated conditional slope coefficient over the whole range of observed values for institutional quality and development level. (b) Estimated statistically significant conditional slope coefficient. Gray represents a combination of institutional quality and development level for which effect of financialisation on growth is statistically insignificant. Source: authors’ contributions.

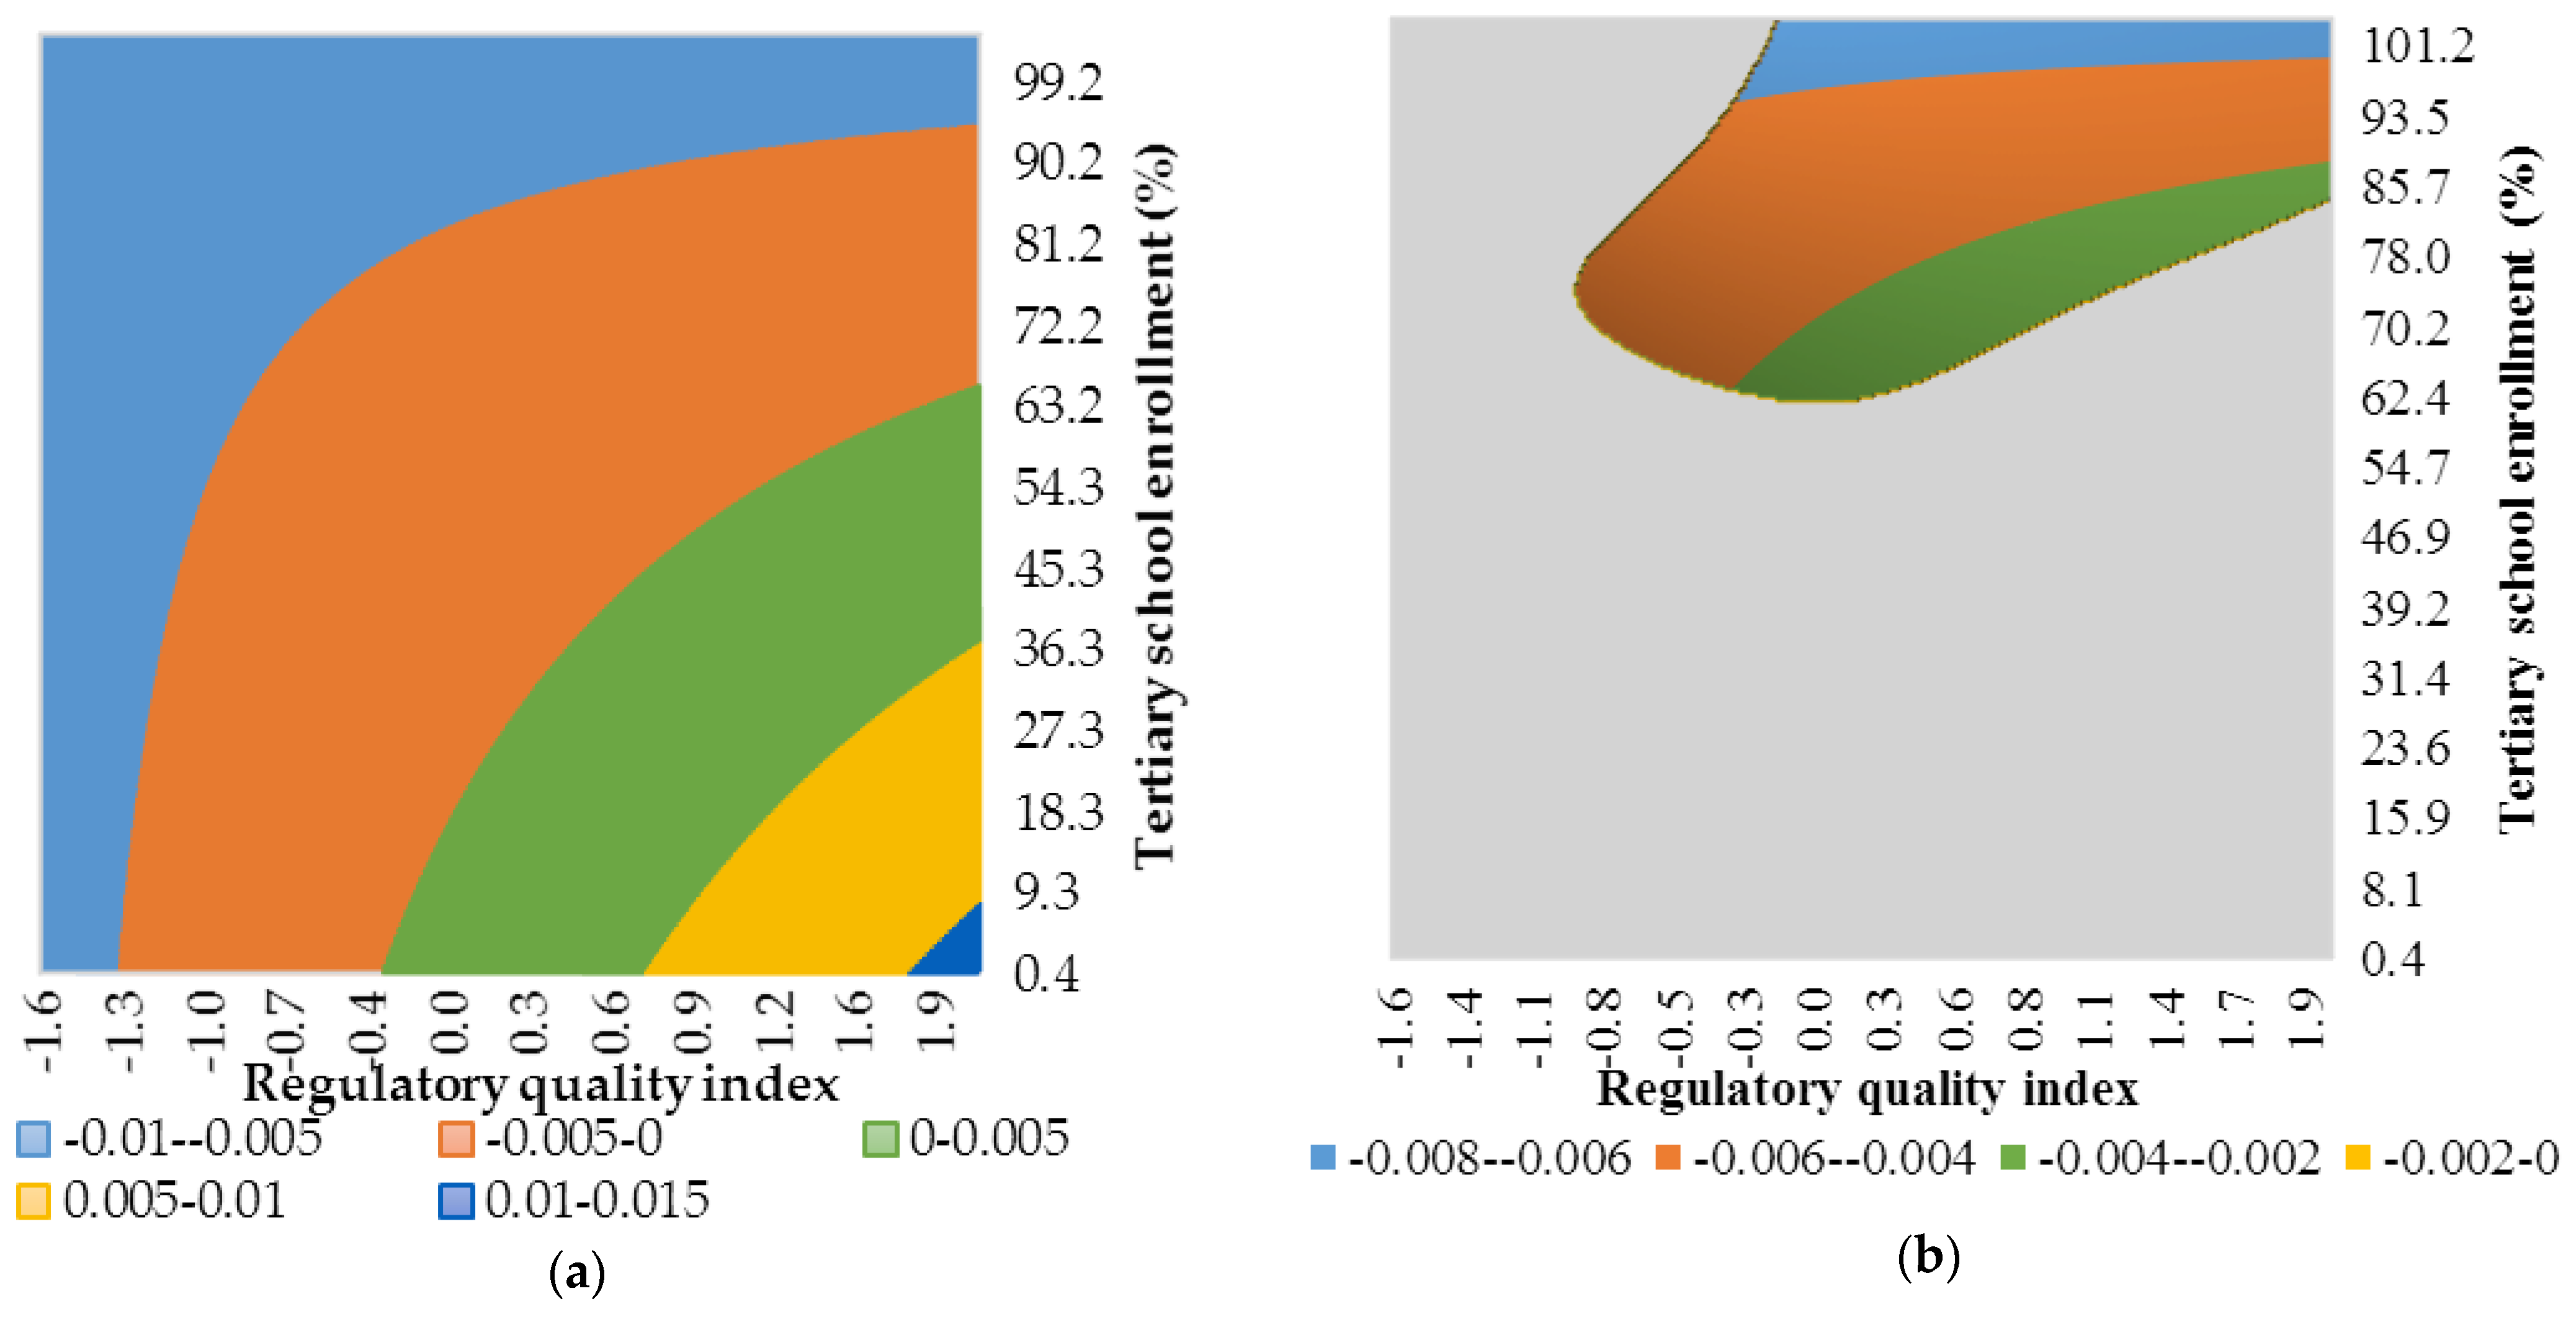
Figure A10.
Conditional effect of financialisation on growth based on Est. 10 in Table A2. (a) Estimated conditional slope coefficient over the whole range of observed values for institutional quality and development level. (b) Estimated statistically significant conditional slope coefficient. Gray represents a combination of institutional quality and development level for which effect of financialisation on growth is statistically insignificant. Source: authors’ contributions.

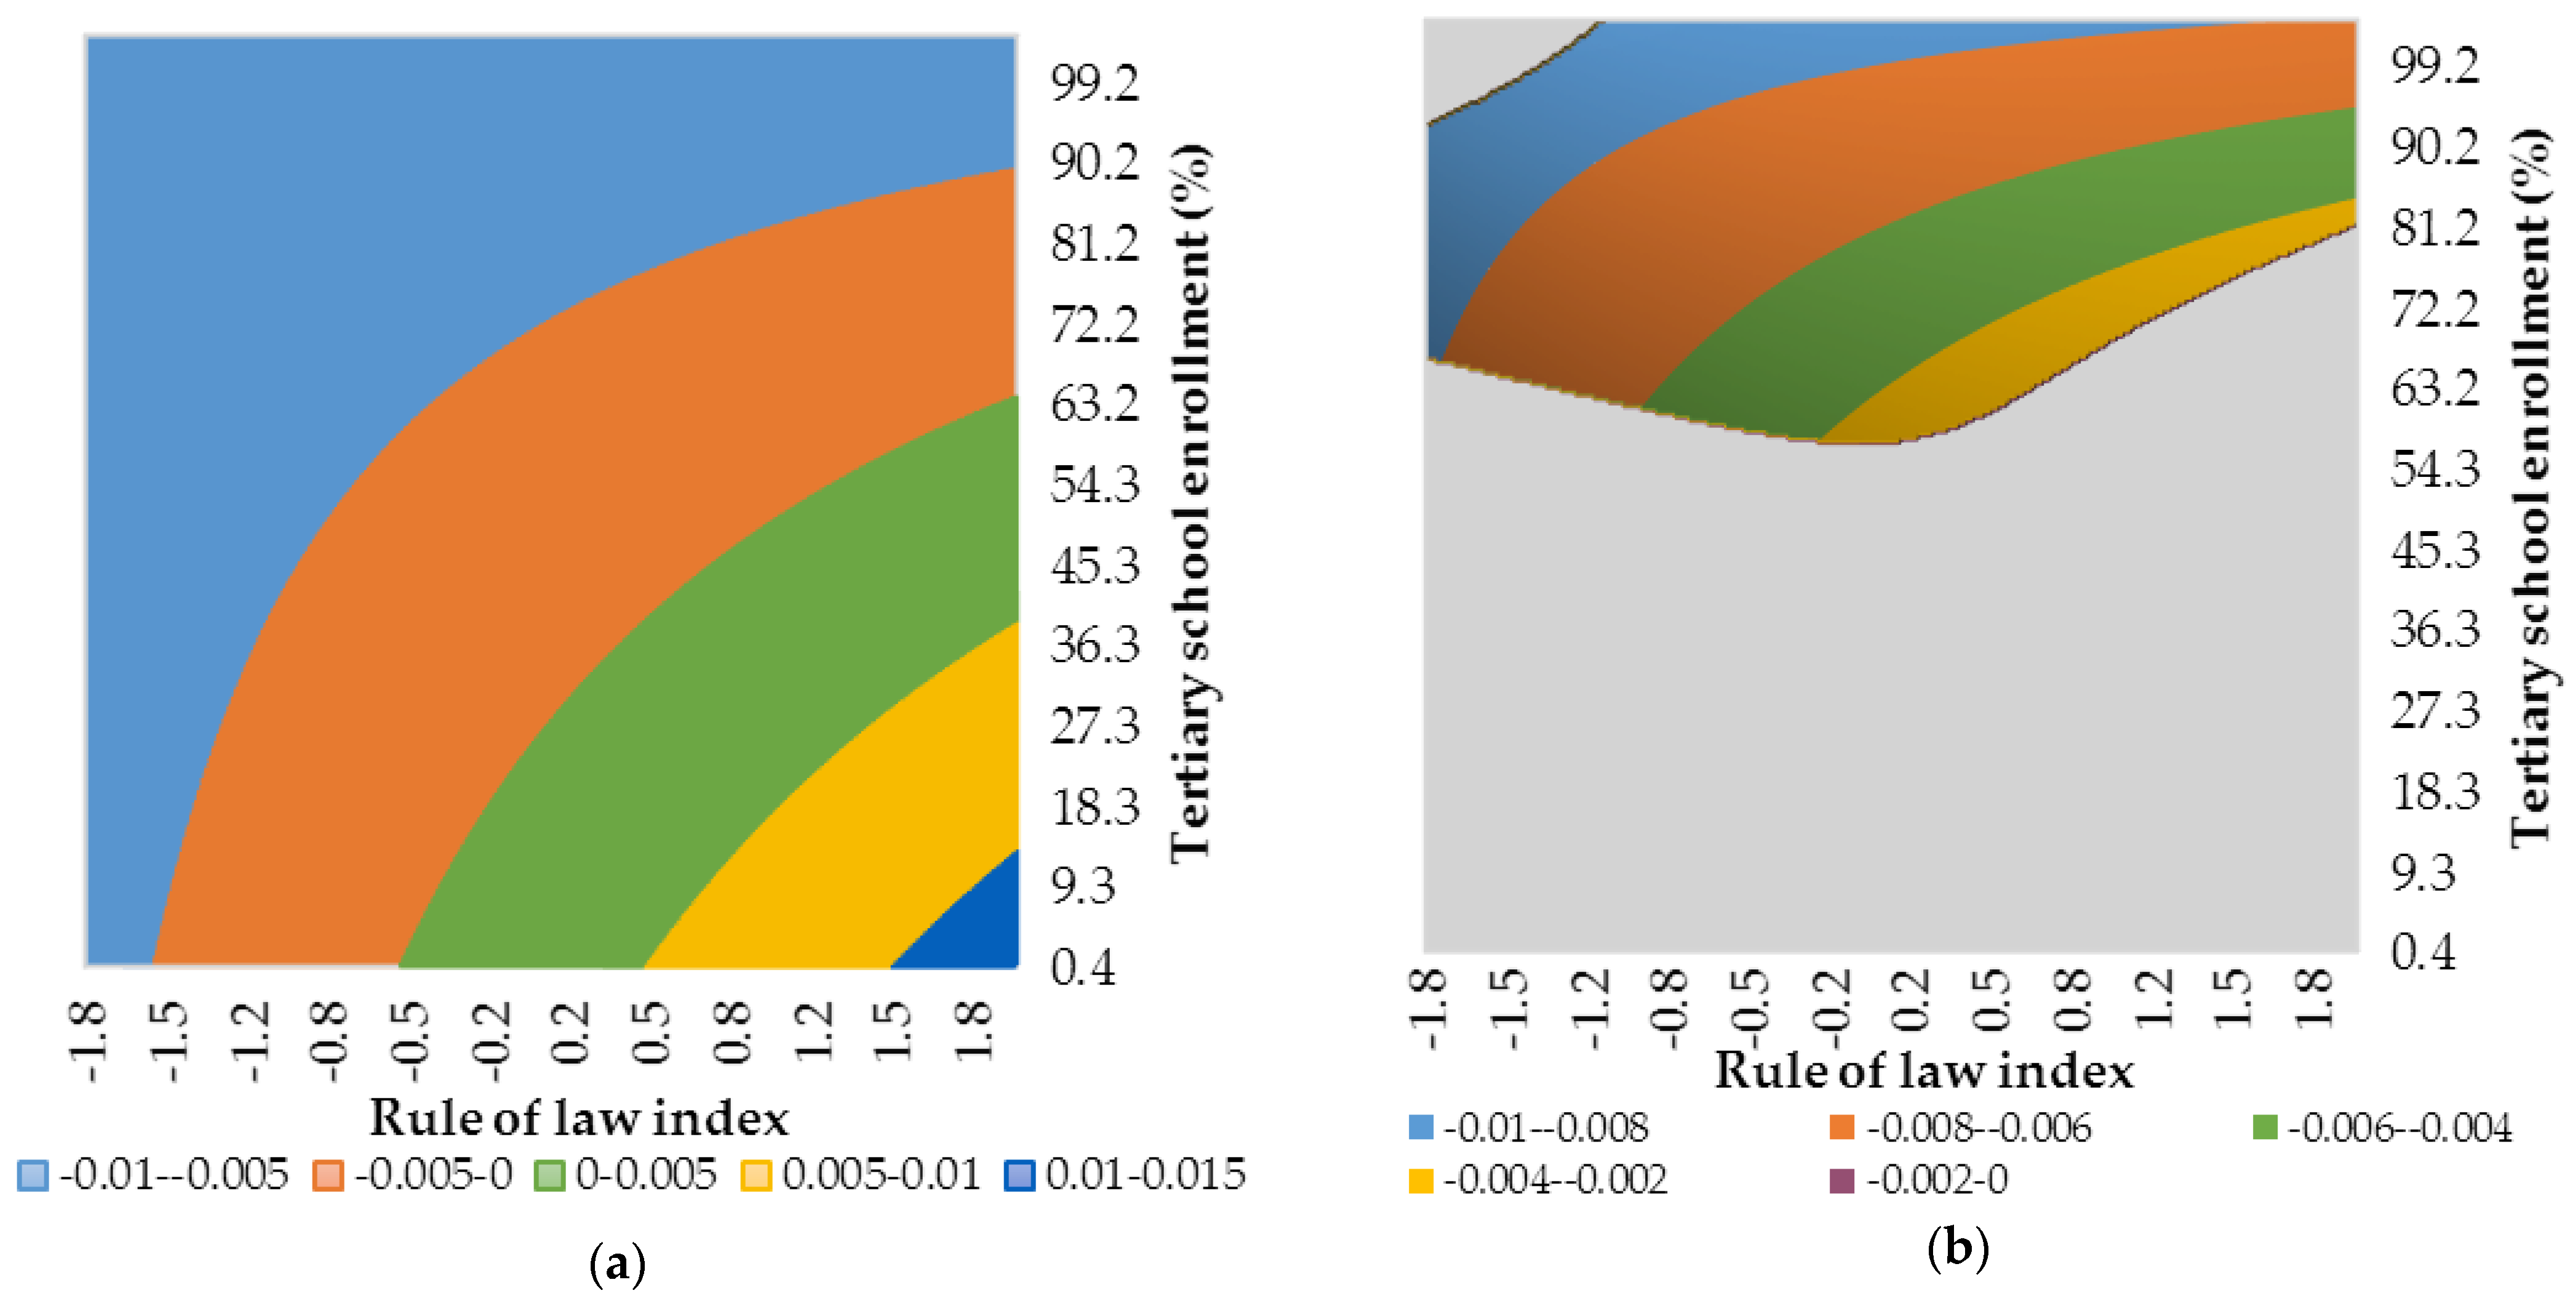
Figure A11.
Conditional effect of financialisation on growth based on Est. 11 in Table A2. (a) Estimated conditional slope coefficient over the whole range of observed values for institutional quality and development level. (b) Estimated statistically significant conditional slope coefficient. Gray represents a combination of institutional quality and development level for which effect of financialisation on growth is statistically insignificant. Source: authors’ contributions.

Figure A12.
Conditional effect of financialisation on growth based on Est. 12 in Table A2. (a) Estimated conditional slope coefficient over the whole range of observed values for institutional quality and development level. (b) Estimated statistically significant conditional slope coefficient. Light gray represents a combination of institutional quality and development level for which effect of financialisation on growth is statistically insignificant. Source: authors’ contributions.

Figure A13.
Conditional effect of financialisation on growth based on Est. 13 in Table A2. (a) Estimated conditional slope coefficient over the whole range of observed values for institutional quality and development level. (b) Estimated statistically significant conditional slope coefficient. Dark gray represents a combination of institutional quality and development level for which effect of financialisation on growth is statistically insignificant. Source: authors’ contributions.

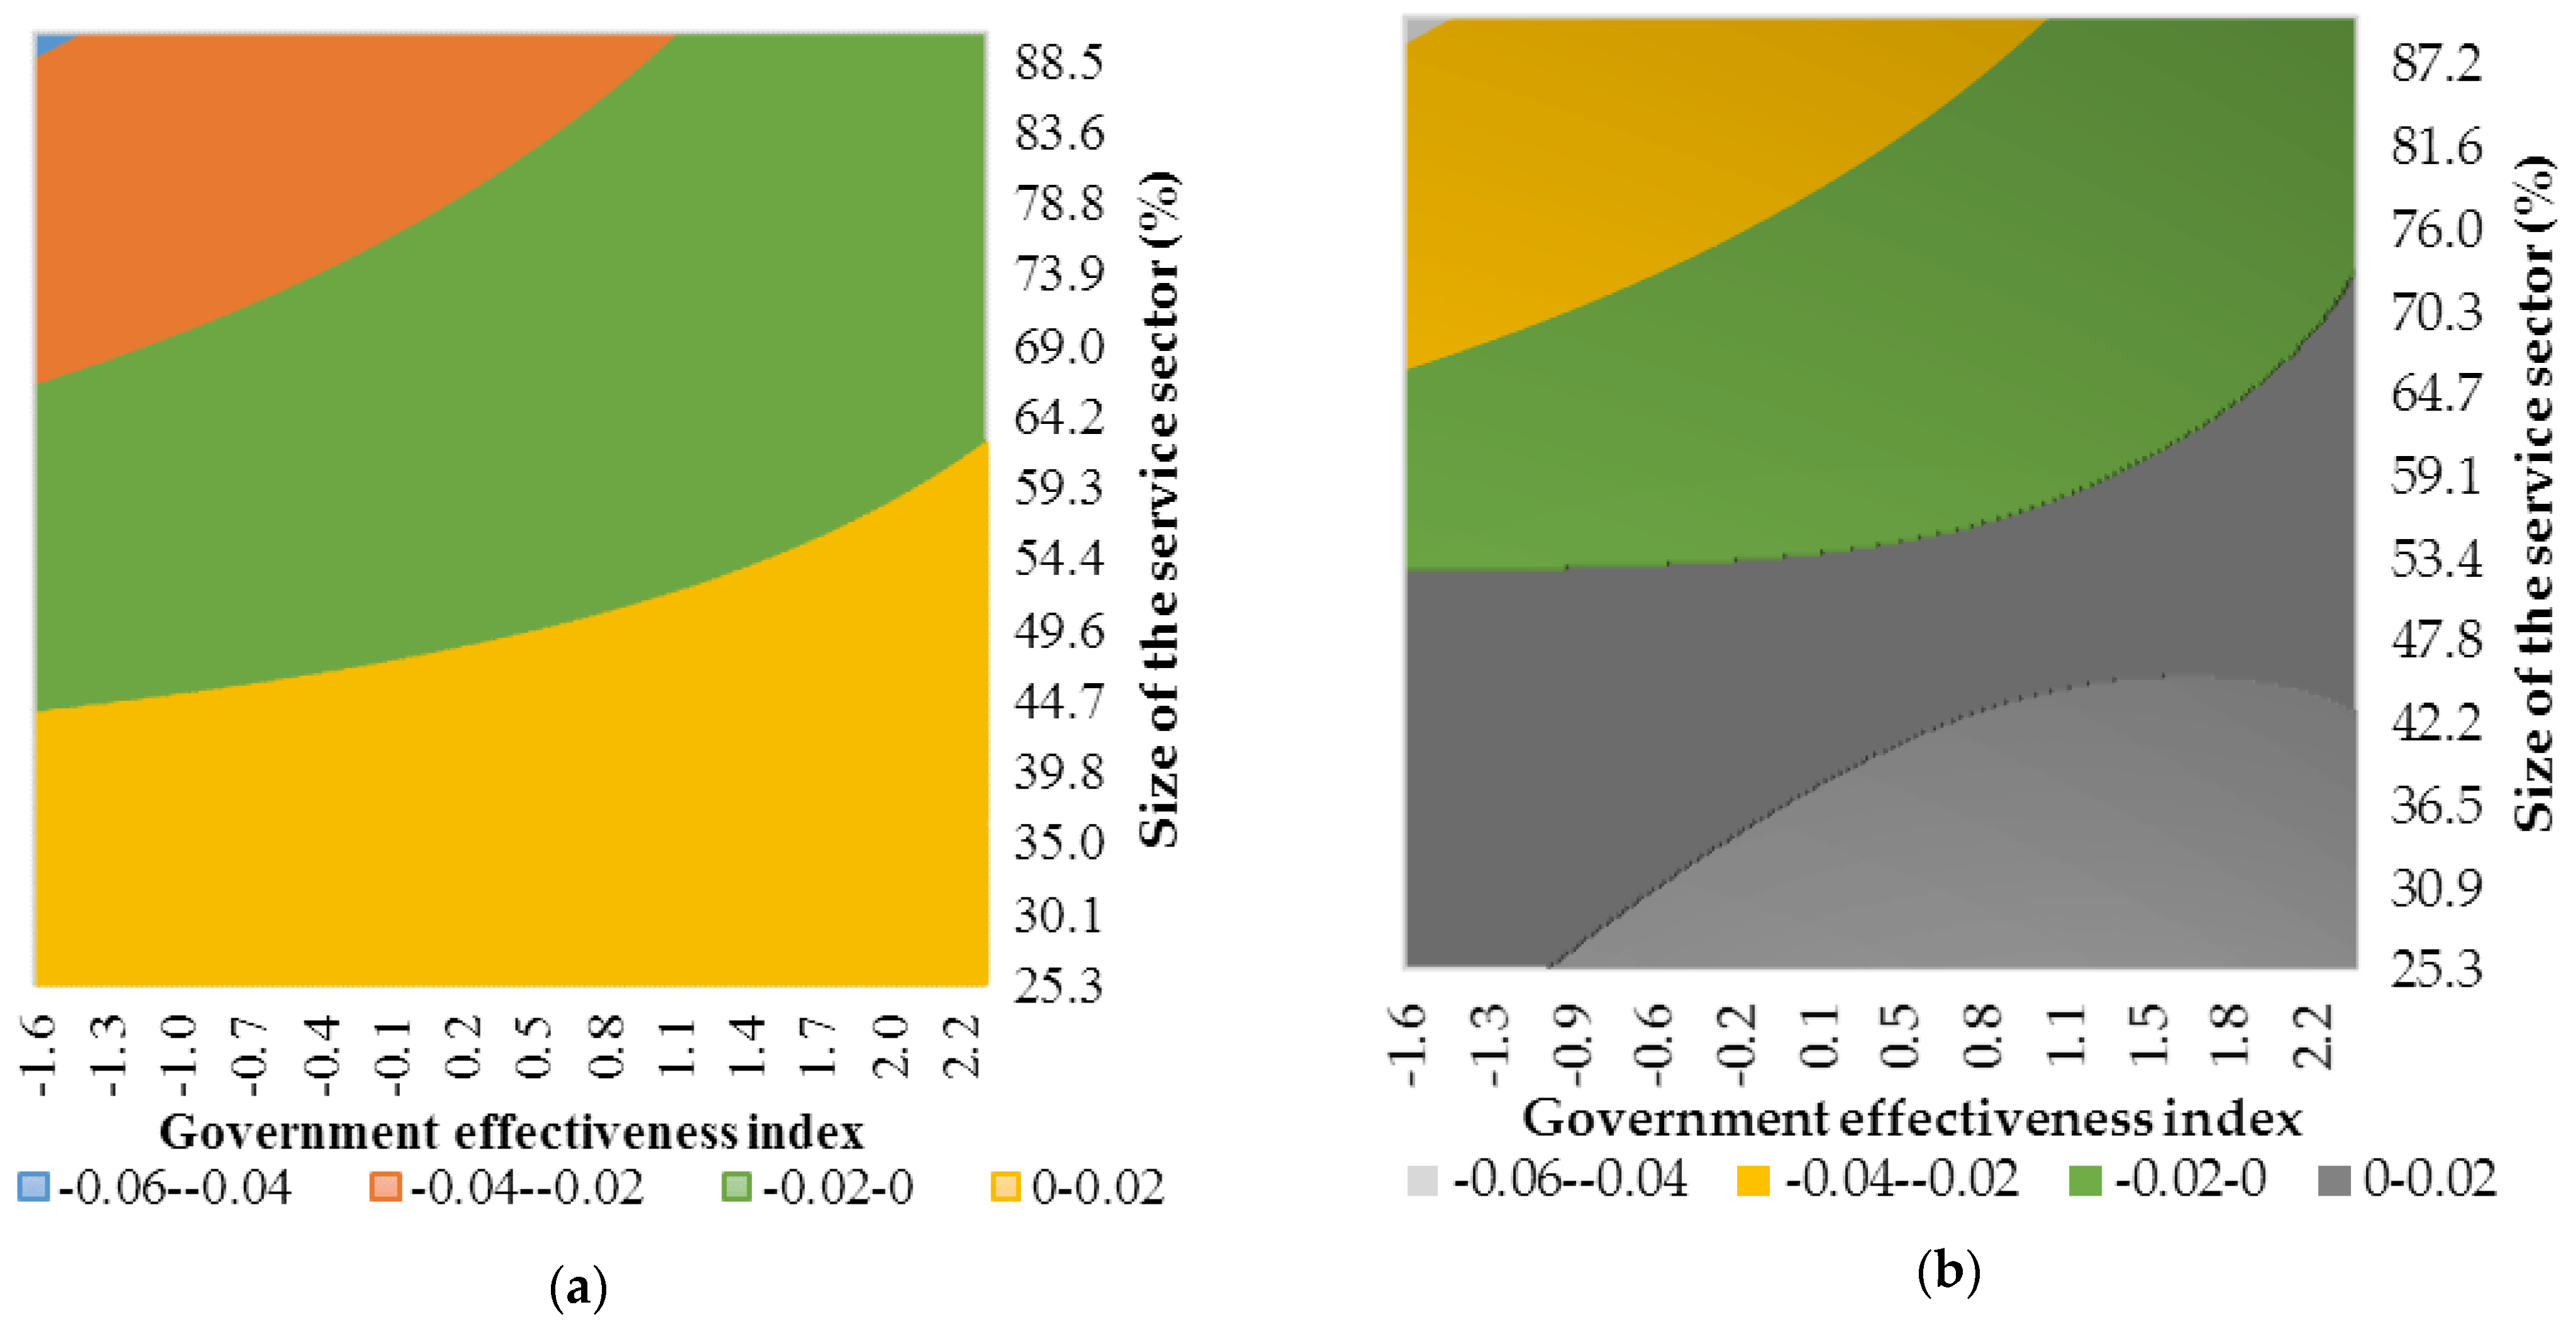
Figure A14.
Conditional effect of financialisation on growth based on Est. 14 in Table A2. (a) Estimated conditional slope coefficient over the whole range of observed values for institutional quality and development level. (b) Estimated statistically significant conditional slope coefficient. Dark gray represents a combination of institutional quality and development level for which effect of financialisation on growth is statistically insignificant. Source: authors’ contributions.

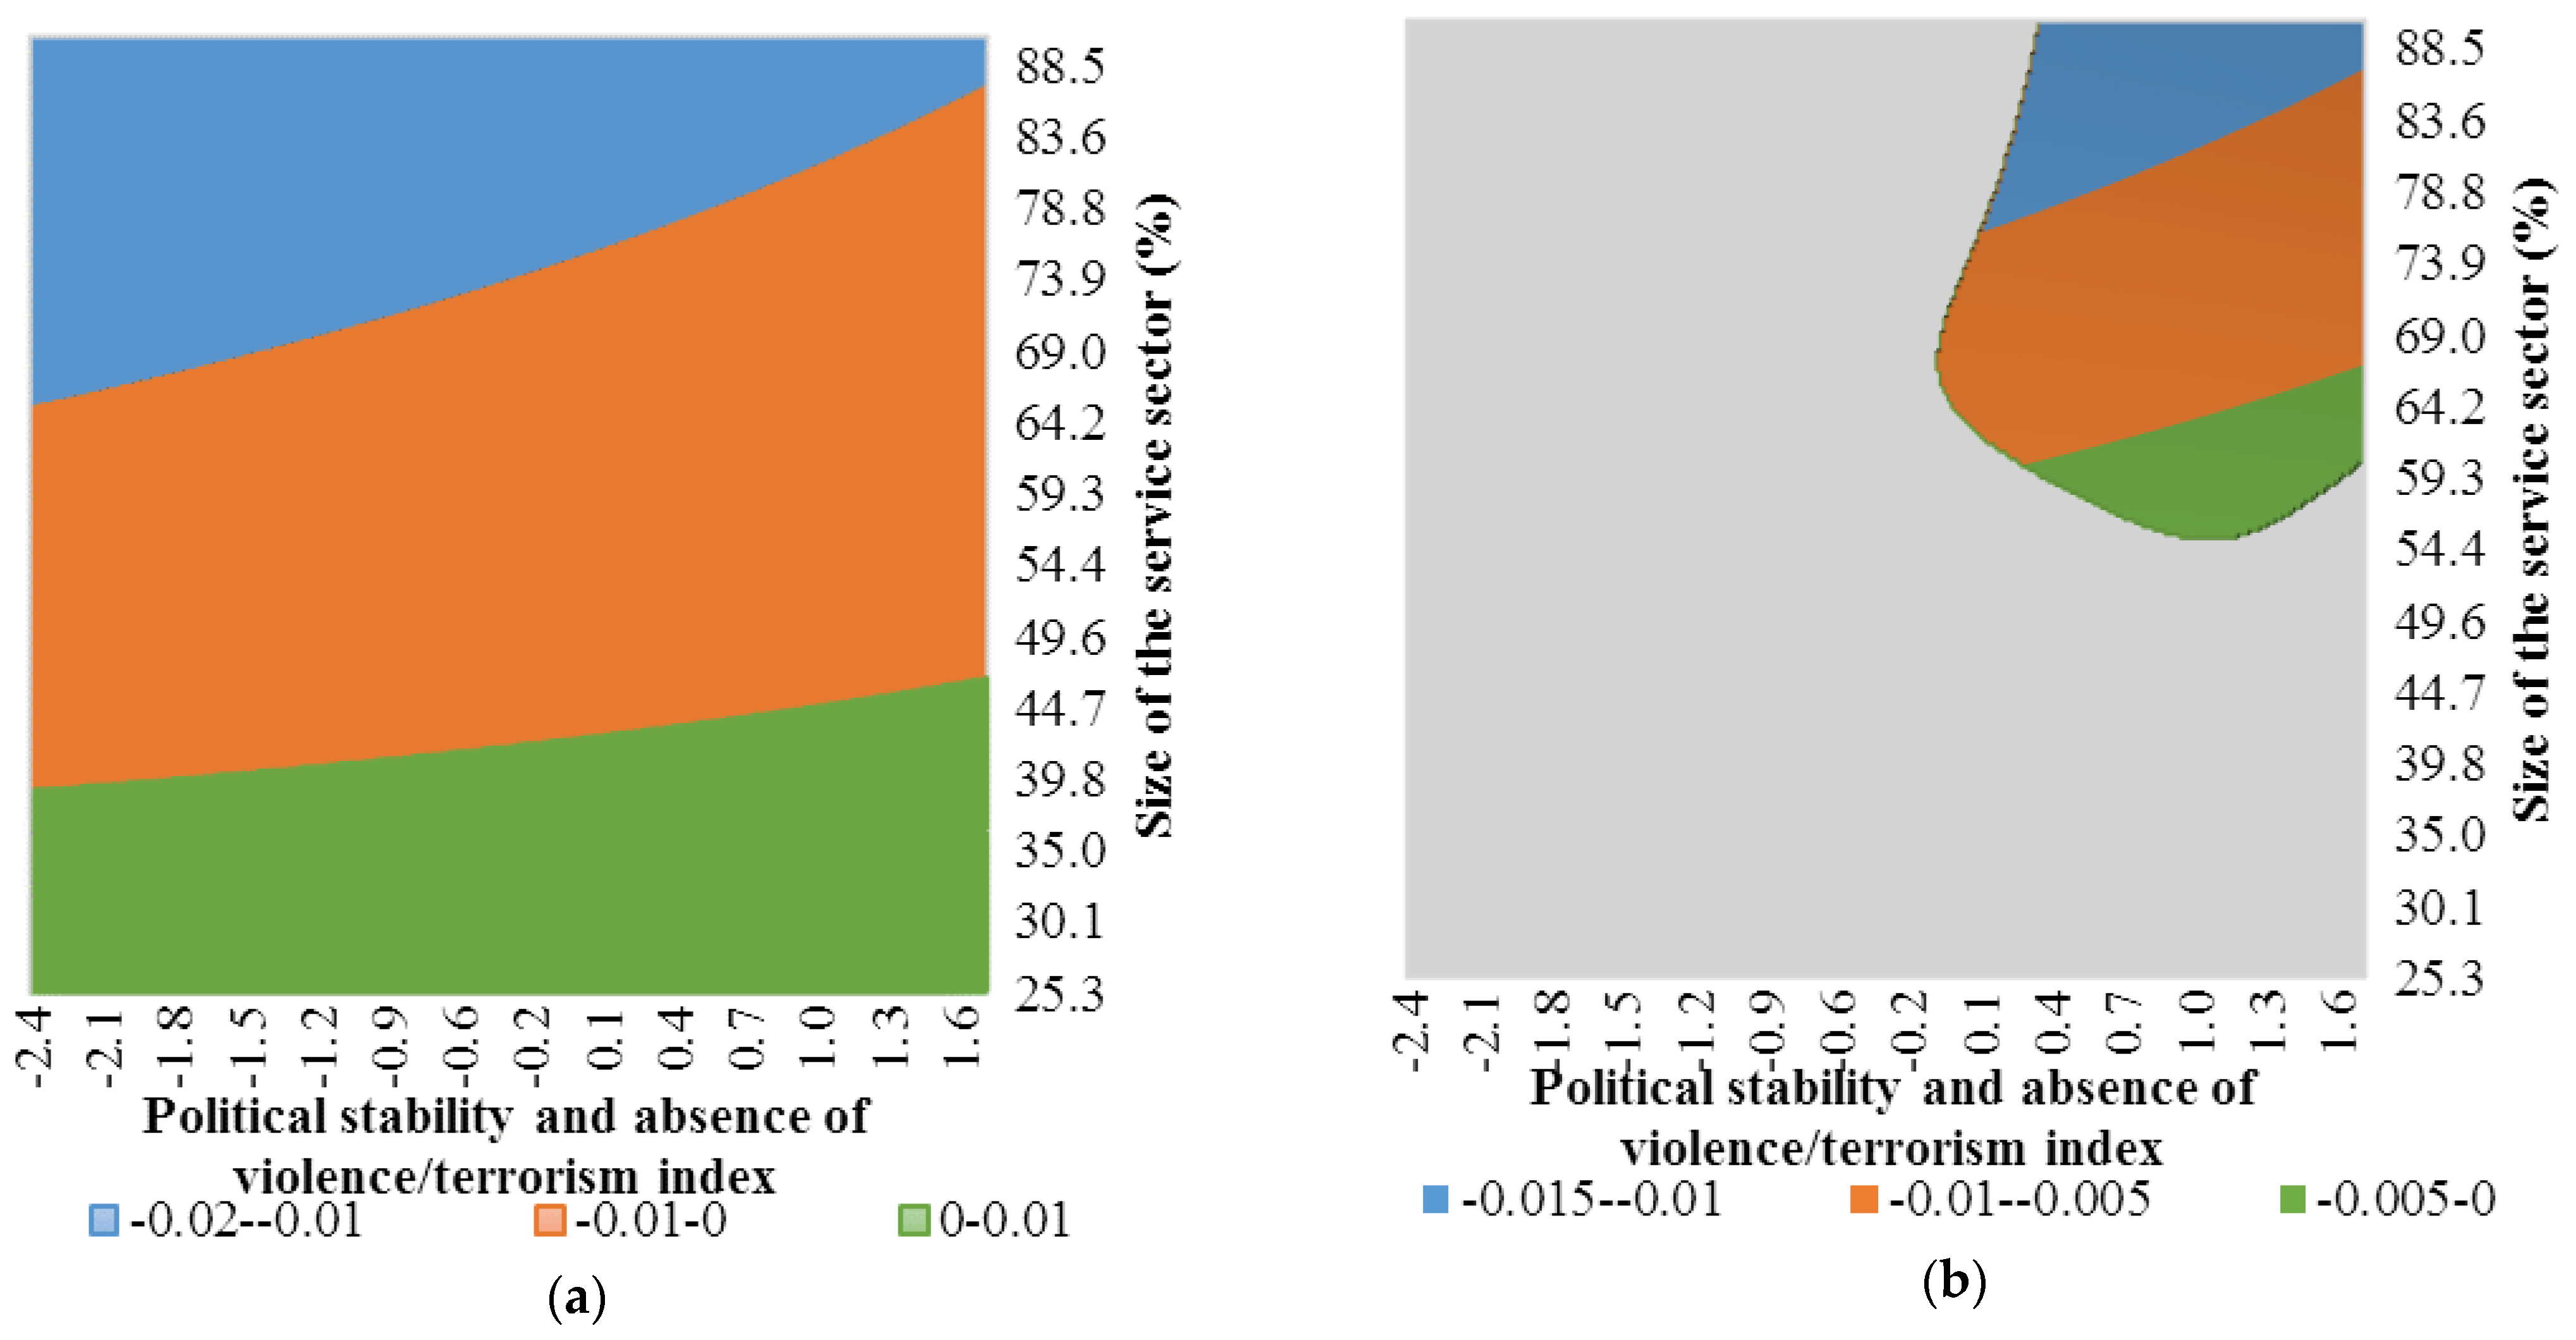
Figure A15.
Conditional effect of financialisation on growth based on Est. 15 in Table A2. (a) Estimated conditional slope coefficient over the whole range of observed values for institutional quality and development level. (b) Estimated statistically significant conditional slope coefficient. Gray represents a combination of institutional quality and development level for which effect of financialisation on growth is statistically insignificant. Source: authors’ contributions.

Figure A16.
Conditional effect of financialisation on growth based on Est. 16 in Table A2. (a) Estimated conditional slope coefficient over the whole range of observed values for institutional quality and development level. (b) Estimated statistically significant conditional slope coefficient. Dark gray represents a combination of institutional quality and development level for which effect of financialisation on growth is statistically insignificant. Source: authors’ contributions.

Figure A17.
Conditional effect of financialisation on growth based on Est. 17 in Table A2. (a) Estimated conditional slope coefficient over the whole range of observed values for institutional quality and development level. (b) Estimated statistically significant conditional slope coefficient. Dark gray represents a combination of institutional quality and development level for which effect of financialisation on growth is statistically insignificant. Source: authors’ contributions.

Figure A18.
Conditional effect of financialisation on growth based on Est. 18 in Table A2. (a) Estimated conditional slope coefficient over the whole range of observed values for institutional quality and development level. (b) Estimated statistically significant conditional slope coefficient. Dark gray represents a combination of institutional quality and development level for which effect of financialisation on growth is statistically insignificant. Source: authors’ contributions.

Figure A19.
Conditional effect of financialisation on growth based on Est. 19 in Table A2. (a) Estimated conditional slope coefficient over the whole range of observed values for institutional quality and development level. (b) Estimated statistically significant conditional slope coefficient. Gray represents a combination of institutional quality and development level for which effect of financialisation on growth is statistically insignificant. Source: authors’ contributions.

Figure A20.
Conditional effect of financialisation on growth based on Est. 20 in Table A2. (a) Estimated conditional slope coefficient over the whole range of observed values for institutional quality and development level. (b) Estimated statistically significant conditional slope coefficient. Gray represents a combination of institutional quality and development level for which effect of financialisation on growth is statistically insignificant. Source: authors’ contributions.

Figure A21.
Conditional effect of financialisation on growth based on Est. 21 in Table A2. (a) Estimated conditional slope coefficient over the whole range of observed values for institutional quality and development level. (b) Estimated statistically significant conditional slope coefficient. Gray represents a combination of institutional quality and development level for which effect of financialisation on growth is statistically insignificant. Source: authors’ contributions.

Figure A22.
Conditional effect of financialisation on growth based on Est. 22 in Table A2. (a) Estimated conditional slope coefficient over the whole range of observed values for institutional quality and development level. (b) Estimated statistically significant conditional slope coefficient. Gray represents a combination of institutional quality and development level for which effect of financialisation on growth is statistically insignificant. Source: authors’ contributions.

Figure A23.
Conditional effect of financialisation on growth based on Est. 23 in Table A2. (a) Estimated conditional slope coefficient over the whole range of observed values for institutional quality and development level. (b) Estimated statistically significant conditional slope coefficient. Gray represents a combination of institutional quality and development level for which effect of financialisation on growth is statistically insignificant. Source: authors’ contributions.

Figure A24.
Conditional effect of financialisation on growth based on Est. 24 in Table A2. (a) Estimated conditional slope coefficient over the whole range of observed values for institutional quality and development level. (b) Estimated statistically significant conditional slope coefficient. Gray represents a combination of institutional quality and development level for which effect of financialisation on growth is statistically insignificant. Source: authors’ contributions.

References
- Andini, Monica, and Corrado Andini. 2014. Finance, growth and quantile parameter heterogeneity. Journal of Macroeconomics 40: 308–22. [Google Scholar] [CrossRef]
- Arcand, Jean Louis, Enrico Berkes, and Ugo Panizza. 2015. Too much finance? Journal of Economic Growth 20: 105–48. [Google Scholar] [CrossRef]
- Barthold, Charles, Stephen Dunne, and David Harvie. 2017. Resisting financialisation with Deleuze and Guattari: The case of Occupy Wall Street. Critical Perspectives on Accounting 52: 4–16. [Google Scholar] [CrossRef] [Green Version]
- Beck, Thorsten. 2011. The Role of Finance in Economic Development: Benefits, Risks, and Politics. CentER Discussion Paper. Tilburg: Economics, vol. 141. [Google Scholar]
- Beck, Thorsten, Asli Demirguc-Kunt, and Ross Levine. 2010. Financial Institutions and Markets Across Countries and Over Time: The Updated Financial Development and Structure Database. World Bank Economic Review 24: 77–92. [Google Scholar] [CrossRef] [Green Version]
- Beck, Thorsten, and Patrick Honohan. 2007. Making Finance Work for Africa. Washington, DC: World Bank. [Google Scholar]
- Beck, Thorsten, Berrak Büyükkarabacak, Felix Rioja, and Neven T. Valev. 2012. Who Gets the Credit? And Does It Matter? Household vs. Firm Lending Across Countries. The B.E. Journal of Macroeconomics 12: 1–46. [Google Scholar] [CrossRef] [Green Version]
- Beck, Thorsten, Hans Degryse, and Christiane Kneer. 2014. Is more financing better? Disentangling intermediation and size effects of financial systems. Journal of Financial Stability 10: 50–64. [Google Scholar] [CrossRef] [Green Version]
- Berthelemy, Jean-Claude, and Aristomene Varoudakis. 1996. Models of Financial Development and Growth. A Survey of Recent Literature in Financial Development and Economic Growth, Theory and Experience from Developing Countries. Milton Park: Routledge Studies in Development Economics. [Google Scholar]
- Bezemer, Dirk, Maria Grydaki, and Lu Zhang. 2016. More mortgages, lower growth? Economic Inquiry 54: 652–74. [Google Scholar] [CrossRef]
- Butkus, Mindaugas, Alma Maciulyte-Sniukiene, and Kristina Matuzeviciute. 2020. Mediating Effects of Cohesion Policy and Institutional Quality on Convergence between EU Regions: An Examination Based on a Conditional Beta-Convergence Model with a 3-Way Multiplicative Term. Sustainability 12: 3025. [Google Scholar] [CrossRef] [Green Version]
- Büyükkarabacak, Berrak, and Neven T. Valev. 2010. The role of household and business credit in banking crises. Journal of Banking & Finance 34: 1247–56. [Google Scholar]
- Caglayan, Mustafa, Ozge Kocaaslan Kocaaslan, and Kostas Mouratidis. 2017. Financial Depth and the Asymmetric Impact of Monetary Policy. Oxford Bulletin of Economics and Statistics 79: 1195–218. [Google Scholar] [CrossRef] [Green Version]
- Caporale, Guglielmo Maria, Christophe Rault, Anamaria Diana Sova, and Robert Sova. 2015. Financial Development and Economic Growth: Evidence from 10 New European Union Members. International Journal of Finance & Economics 20: 48–60. [Google Scholar]
- Chanda, Areendam. 2005. The influence of capital controls on long run growth: Where and how much? Journal of Development Economics 77: 441–66. [Google Scholar] [CrossRef] [Green Version]
- Cheng, Si-Yin, Chia-Cheng Ho, and Han Hou. 2014. The Finance-growth Relationship and the Level of Country Development. Journal of Financial Services Research 45: 117–40. [Google Scholar] [CrossRef]
- Choong, Chee-Keong, Ahmad Zubaidi Baharumshah, Zulkornain Yusop, and Muzafar Shah Habibullah. 2010. Private capital flows, stock market and economic growth in developed and developing countries: A comparative analysis. Japan and the World Economy 22: 107–17. [Google Scholar] [CrossRef]
- Dabla-Norris, Era, Si Guo, Vikram Haksar, Minsuk Kim, Kalpana Kochhar, Kevin Wiseman, and Aleksandra Zdzienicka. 2015. The New Normal: A Sector-Level Perspective on Growth and Productivity Trends in Advanced Economies. IMF Staff Discussion Note. Washington, DC: International Monetary Fund. [Google Scholar]
- Dávila-Fernández, Marwil J., and Lionello F. Punzo. 2019. Financialisation as structural change: Measuring the financial content of things. Economic Systems Research 32: 1–23. [Google Scholar] [CrossRef]
- Davis, Leila E. 2013. Financialisation and the Non-Financial Corporation: An Investigation of Firm-level Investment Behavior in the US, 1971–2011. Department of Economics Working Paper No. 2013-08. Amherst: University of Massachusetts. [Google Scholar]
- De Gregorio, Jose, and Pablo Emilio Guidotti. 1995. Financial development and economic growth. World Development 23: 433–48. [Google Scholar] [CrossRef]
- Demetriades, Panicos O., and Peter L. Rousseau. 2016. The changing face of financial development. Economics Letters 141: 87–90. [Google Scholar] [CrossRef] [Green Version]
- Demir, Firat. 2007. The Rise of Rentier Capitalism and the Financialisation of Real Sectors in Developing Countries. Review of Radical Political Economics 39: 351–59. [Google Scholar] [CrossRef] [Green Version]
- Dore, Ronald. 2008. Financialisation of the global economy. Industrial and Corporate Change 17: 1097–112. [Google Scholar] [CrossRef]
- Durlauf, Steven N., Andros Kourtellos, and Artur Minkin. 2001. The local Solow growth model. European Economic Review 45: 928–40. [Google Scholar] [CrossRef]
- Epstein, Gerald A., ed. 2005. Financialisation and the World Economy. Cheltenham: Northampton: Edward Elgar. [Google Scholar]
- Favara, Giovanni. 2003. An Empirical Reassessment of the Relationship between Finance and Growth. IMF Working Paper, WP/03/123. Paris: IMF. [Google Scholar]
- Ferreira, Miguel A., and Paul A. Laux. 2009. Portfolio flows, volatility and growth. Journal of International Money and Finance 28: 271–92. [Google Scholar] [CrossRef]
- Fligstein, Neil. 2002. The Architecture of Markets: An Economic Sociology of Twenty-First Century Capitalist Societies. Princeton: Princeton University Press. [Google Scholar]
- Friedrich, Robert J. 1982. In Defense of Multiplicative Terms in Multiple Regression Equations. American Journal of Political Science 26: 797–833. [Google Scholar] [CrossRef]
- Fufa, Tolina, and Jaebeom Kim. 2018. Stock markets, banks, and economic growth: Evidence from more homogeneous panels. Research in International Business and Finance 44: 504–17. [Google Scholar] [CrossRef]
- Godechot, Olivier. 2016. Financialisation is marketisation! A study of the respective impacts of various dimensions of financialisation on the increase in global inequality. Sociological Science 3: 495–519. [Google Scholar] [CrossRef] [Green Version]
- Graff, Michael. 2012. Legal Origin and Financial Development: New Evidence and Old Claims. International Journal of Trade, Economics and Finance 3: 164–66. [Google Scholar] [CrossRef] [Green Version]
- Greenwood, Jeremy, and Boyan Jovanovic. 1990. Financial development, growth, and the distribution of income. Journal of Political Economy 98: 1076–107. [Google Scholar] [CrossRef] [Green Version]
- Greenwood, Robin, and David Scharfstein. 2013. The Growth of Modern Finance. Journal of Economic Perspectives 27: 3–28. [Google Scholar] [CrossRef] [Green Version]
- Guru, Biplab Kumar, and Inder Sekhar Yadav. 2019. Financial development and economic growth: Panel evidence from BRICS. Journal of Economics, Finance and Administrative Science 24: 113–26. [Google Scholar] [CrossRef] [Green Version]
- Hall, Peter A., and David Soskice. 2001. Varieties of Capitalism: The Institutional Foundations of Comparative Advantage. Oxford: Oxford University Press. [Google Scholar]
- Haque, Faizul, Thankom Arun, and Colin Kirkpatrick. 2008. Corporate governance and capital markets: A conceptual framework. Corporate Ownership and Control 5: 264–76. [Google Scholar] [CrossRef] [Green Version]
- He, Jun, Yue Zhang, Datang Zheng, and Hongyan Wan. 2019. Financial deepening, inclusive finance and economic growth: Analysis based on endogenous growth theory. Journal of Physics: Conference Series 1419: 1–6. [Google Scholar] [CrossRef]
- Hecht, Jason. 2014. Is Net Stock Issuance Relevant to Capital Formation? Comparing Heterodox Models of Firm-Level Capital Expenditures across the Advanced and Largest Developing Economies. Cambridge Journal of Economics 38: 1171–206. [Google Scholar] [CrossRef]
- Heilbron, Johan, Jochem Verheul, and Sander Quak. 2014. The Origins and Early Diffusion of “Shareholder Value” in the United States. Theory and Society 43: 1–22. [Google Scholar] [CrossRef]
- Hein, Eckhard. 2012. “Financialisation,” distribution, capital accumulation, and productivity growth in a post-Kaleckian model. Journal of Post Keynesian Economics 34: 475–96. [Google Scholar] [CrossRef] [Green Version]
- Henderson, Daniel J., Chris Papageorgiou, and Christopher F. Parmeter. 2013. Who benefits from financial development? New methods, new evidence. European Economic Review 63: 47–67. [Google Scholar] [CrossRef]
- Henry, Peter Blair. 2003. Capital-Account Liberalization, the Cost of Capital, and Economic Growth. American Economic Review 93: 91–96. [Google Scholar] [CrossRef] [Green Version]
- Ibrahim, Muazu, and Paul Alagidede. 2017. Non-linearities in Financial Development–Economic Growth Nexus: Evidence from sub–Saharan Africa. South African Journal of Economics 85: 570–88. [Google Scholar] [CrossRef]
- Ibrahim, Muazu, and Paul Alagidede. 2018. Effect of Financial Development on Economic Growth in sub-Saharan Africa. Journal of Policy Modeling 40: 1104–25. [Google Scholar] [CrossRef]
- Kane, Edward. 1993. What Lessons should Japan Learn from the US Deposit-insurance Mess? Journal of the Japanese and International Economies 7: 329–55. [Google Scholar] [CrossRef]
- Khemani, Shyam R., and Gerald Meyerman. 1998. East Asia’s Economic Crisis and Competition Policy. Global Competition Review 8: 16–18. [Google Scholar]
- King, Robert G., and Ross Levine. 1993a. Finance and growth: Schumpeter might be right. The Quarterly Journal of Economics 108: 717–38. [Google Scholar] [CrossRef]
- King, Robert G., and Ross Levine. 1993b. Finance, entrepreneurship, and growth: Theory and evidence. Journal of Monetary Economics 32: 513–42. [Google Scholar] [CrossRef]
- Klein, Michael W., and Giovanni P. Olivei. 2008. Capital account liberalisation, financial depth, and economic growth. Journal of International Money and Finance 27: 861–75. [Google Scholar] [CrossRef] [Green Version]
- Kose, Ayhan M., Eswar S. Prasad, and Marco E. Terrones. 2009. Does openness to international financial flows raise productivity growth? Journal of International Money and Finance 28: 554–80. [Google Scholar] [CrossRef] [Green Version]
- Krippner, Greta. 2005. The financialisation of the American economy. Socio-Economic Review 3: 173–208. [Google Scholar] [CrossRef]
- Lapavitsas, Costas. 2011. Theorising financialisation. Work, Employment and Society 25: 611–26. [Google Scholar] [CrossRef] [Green Version]
- Lapavitsas, Costas. 2013. The Financialisation of Capitalism: ‘Profiting without Producing’. CITY 17: 792–805. [Google Scholar] [CrossRef] [Green Version]
- Law, Siong Hook, and Nirvikar Singh. 2014. Does too much finance harm economic growth? Journal of Banking & Finance 41: 36–44. [Google Scholar]
- Lazonick, William, and Mary O’Sullivan. 2000. Maximising Shareholder Value: A New Ideology for Corporate Governance. Economy and Society 29: 13–35. [Google Scholar] [CrossRef]
- Lee, Kim-Ming, and Ching Yin Cheng. 2011. Financialisation, economic crises and social protection: The case of Hong Kong. Journal of Asian Public Policy 4: 18–41. [Google Scholar] [CrossRef]
- Leon, Florian. 2016. Enterprise Credit, Household Credit and Growth: New Evidence from 126 Countries. CREA Discussion Paper, 2016-17. Ottawa: CREA. [Google Scholar]
- Leon, Florian. 2019. Household Credit and Growth: International Evidence. CREA Discussion Paper, 19-02. Luxembourg City: Center for Research in Economic Analysis, University of Luxembourg. [Google Scholar]
- Leona, Aiken, and Stephen West. 1991. Multiple Regression: Testing and Interpreting Interactions. London: Sage. [Google Scholar]
- Levine, Ross. 2001. International financial liberalisation and economic growth. Review of International Economics 9: 688–702. [Google Scholar] [CrossRef]
- Levine, Ross. 2003. More on finance and growth: More finance, more growth? Federal Reserve Bank of St. Louis Review 85: 31–46. [Google Scholar] [CrossRef]
- Levine, Ross. 2005. Finance and growth: Theory and evidence. Handbook of Economic Growth 1: 865–934. [Google Scholar]
- Levine, Ross, Norman Loayza, and Thorsen Beck. 2000. Financial intermediation and growth: Causality and causes. Journal of Monetary Economics 46: 31–77. [Google Scholar] [CrossRef] [Green Version]
- Lim, Taejun. 2018. Growth, financial development, and housing booms. Economic Modelling 69: 91–102. [Google Scholar] [CrossRef]
- Loayza, Norman, and Romain Ranciere. 2006. Financial Development, Financial Fragility, and Growth. Journal of Money, Credit, and Banking 38: 1051–76. [Google Scholar] [CrossRef] [Green Version]
- Martin, Randy. 2003. Financialisation of Daily Life. The Journal of Sociology & Social Welfare 30: 208–10. [Google Scholar]
- Montagne, Sabine. 2006. Les Fonds de Pension: Entre Protection Sociale et Spéculation Financière. Paris: Odile Jacob. [Google Scholar]
- Nazir, Muhammad Rizwan, Yong Tan, and Muhammad Imran Nazi. 2020. Financial innovation and economic growth: Empirical evidence from China, India and Pakistan. International Journal of Finance and Economy. Available online: https://0-onlinelibrary-wiley-com.brum.beds.ac.uk/doi/full/10.1002/ijfe.2107 (accessed on 15 January 2021).
- Nguyen, Quoc Hung. 2019. Growth model with financial deepening and productivity heterogeneity. The Japanese Economic Review 70: 123–40. [Google Scholar] [CrossRef] [Green Version]
- Onaran, Ozlem, Engelbert Stockhammer, and Lucas Grafl. 2011. Financialisation, income distribution and aggregate demand in the USA. Cambridge Journal of Economics 35: 637–61. [Google Scholar] [CrossRef] [Green Version]
- Orhangazi, Ozgur. 2008. Financialisation and capital accumulation in the non-financial corporate sector: A theoretical and empirical investigation on the US economy: 1973–2003. Cambridge Journal of Economics 32: 863–86. [Google Scholar] [CrossRef] [Green Version]
- Patra, Sudip, and Sayantan Ghosh Dastidar. 2018. Finance and Growth: Evidence from South Asia. Jindal Journal of Business Research 7: 1–24. [Google Scholar]
- Petkovski, Mihail, and Jordan Kjosevski. 2014. Does banking sector development promote economic growth? An empirical analysis for selected countries in Central and South Eastern Europe. Economic Research-Ekonomska Istraživanja 27: 55–66. [Google Scholar]
- Qi, Hanying. 2019. A New Literature Review on Financialisation. Journal of Accounting, Business and Finance Research 7: 40–50. [Google Scholar] [CrossRef] [Green Version]
- Quinn, Dennis P., and A. Maria Toyoda. 2008. Does Capital Account Liberalization Lead to Growth? Review of Financial Studies 21: 1403–49. [Google Scholar] [CrossRef] [Green Version]
- Rana, Rezwanul Hasan, and Suborna Barua. 2015. Financial development and economic growth: Evidence from a panel study on South Asian countries. Asian Economic and Financial Review 5: 1159–73. [Google Scholar] [CrossRef] [Green Version]
- Rioja, Felix, and Neven Valev. 2004. Does one size fit all? A reexamination of the finance and growth relationship. Journal of Development Economics 74: 429–47. [Google Scholar] [CrossRef]
- Rousseau, Peter L., and Paul Wachtel, eds. 2017. Episodes of Financial Deepening: Credit Booms or Growth Generators? In Financial Systems and Economic Growth (Credit, Crises, and Regulation from the 19th Century to the Present). Cambridge: Cambridge University Press. [Google Scholar]
- Sassi, Seifallah, and Amira Gasmi. 2014. The effect of enterprise and household credit on economic growth: New evidence from European Union countries. Journal of Macroeconomics 39: 226–31. [Google Scholar] [CrossRef]
- Shen, Chung-Hua, and Chien-Chiang Lee. 2006. Same financial development yet different economic growth—Why? Journal of Money, Credit and Banking 38: 1907–44. [Google Scholar] [CrossRef]
- Singh, Ajit, and Bruce A. Weisse. 1998. Emerging stock markets, portfolio capital fows and long-term economic growth: Micro and macroeconomic perspectives. World Development 26: 607–22. [Google Scholar] [CrossRef]
- Song, Chang-Qing, Chun-Ping Chang, and Qiang Gong. 2021. Economic growth, corruption, and financial development: Global evidence. Economic Modelling 94: 822–30. [Google Scholar] [CrossRef]
- Streeck, Wolfgang. 2008. Re-Forming Capitalism: Institutional Change in the German Political Economy. Oxford: Oxford University Press. [Google Scholar]
- Useem, Michael. 1996. Investor Capitalism: How Money Managers Are Changing the Face of Corporate America. New York: Basic Books. [Google Scholar]
- Williams, Kevin. 2019. Do political institutions improve the diminishing effect of financial deepening on growth? Evidence from developing countries. Journal of Economics and Business 103: 13–24. [Google Scholar]
- Wright, Gerald. 1976. Linear Models for Evaluating Conditional Relationship. American Journal of Political Science 20: 349–73. [Google Scholar] [CrossRef]
Figure 1.
Dynamic of financialisation and long-run economic growth over 1996–2017. Source: all calculations are based on data from The World Bank’s World Development Indicator’s and Governance Indicator’s databases.
Figure 1.
Dynamic of financialisation and long-run economic growth over 1996–2017. Source: all calculations are based on data from The World Bank’s World Development Indicator’s and Governance Indicator’s databases.

Figure 2.
Relationships between financialisation and long-run economic growth in 1996–2017. Source: all calculations are based on data from The World Bank’s World Development Indicator’s and Governance Indicator’s databases.
Figure 2.
Relationships between financialisation and long-run economic growth in 1996–2017. Source: all calculations are based on data from The World Bank’s World Development Indicator’s and Governance Indicator’s databases.

Table 1.
Descriptive statistics of the raw data.
| Full Name of the Variable and the Measurement Unit | Short Name of the Variable | Min | Max | Mean | Median | C.V | S.D |
|---|---|---|---|---|---|---|---|
| The average yearly growth rate over a 10-year episode (ΔlnY) (1) | gr | −0.660 | 0.292 | 0.006 | 0.017 | 11.811 | 0.076 |
| Financialisation, domestic credit provided by the financial sector (% of GDP) (2) | Cfs | −114.690 | 4310.700 | 48.597 | 35.760 | 1.566 | 76.083 |
| Control of corruption (index) (3) | CC | 0.631 | 4.970 | 2.475 | 2.238 | 0.404 | 0.999 |
| Political stability and absence of violence/terrorism (index) (3) | PS | −0.815 | 4.465 | 2.478 | 2.583 | 0.404 | 1.001 |
| Regulatory quality (index) (3) | RQ | −0.145 | 4.761 | 2.473 | 2.348 | 0.043 | 0.995 |
| Rule of law (index) (3) | RL | −0.107 | 4.600 | 2.474 | 2.333 | 0.403 | 0.995 |
| Government effectiveness (index) (3) | GEf | 0.016 | 4.937 | 2.474 | 2.321 | 0.403 | 0.996 |
| Voice and accountability (index) (3) | VA | 0.187 | 4.301 | 2.481 | 2.513 | 0.403 | 1.000 |
| Secondary school enrollment (% net) (1) | E2 | 0.098 | 99.912 | 65.655 | 75.344 | 0.408 | 26.814 |
| Tertiary school enrollment (% gross) (1) | E3 | 0.013 | 136.600 | 23.971 | 16.961 | 0.977 | 23.429 |
| Size of the service sector (% of GDP) (1) | S | 4.792 | 98.614 | 50.486 | 50.481 | 0.265 | 13.390 |
| GDP per capita (constant 2010 US$) (1) | Y | 133.97 | 3.152 × 10⁵ | 19193 | 4304.7 | 2.1064 | 40,428 |
| Trade openness, sum of import and export (% of GDP) (1) | O | 0.021 | 860.800 | 79.279 | 69.198 | 0.670 | 53.102 |
| Inflation, consumer prices annual growth (%) (1) | I | −18.109 | 23773 | 25.281 | 5.076 | 13.708 | 346.560 |
| Gross fixed capital formation (% of GDP) (1) | GFCF | −2.424 | 89.386 | 22.214 | 21.728 | 0.350 | 7.782 |
| General government final consumption expenditure (% of GDP) (1) | GE | 0.911 | 135.810 | 16.087 | 15.201 | 0.4595 | 7.392 |
| Population annual growth (%) (1) | Pop_gr | −10.376 | 32.392 | 1.806 | 1.712 | 0.967 | 1.747 |
Source: (1) The World Bank’s World Development Indicator’s database; (2) The World Bank’s Global Financial Development database; (3) The World Bank’s World Governance Indicator’s database.
Table 2.
The impact of financialisation on long-run economic growth, which is mediated by institutional quality, level of development, and their interaction.
Table 2.
The impact of financialisation on long-run economic growth, which is mediated by institutional quality, level of development, and their interaction.
| Development Level | ||||||||||
| Institutional quality | Relatively low | Relatively high | ||||||||
| Relatively good | E2 | E3 | S | Y | E2 | E3 | S | Y | ||
| CC | ||||||||||
| Gef | ||||||||||
| PS | ||||||||||
| RQ | ||||||||||
| RL | ||||||||||
| VA | ||||||||||
| Relatively bad | CC | |||||||||
| Gef | ||||||||||
| PS | ||||||||||
| RQ | ||||||||||
| RL | ||||||||||
| VA | ||||||||||
Note: CC is control of corruption; GEf—government effectiveness; PS—political stability and absence of violence/terrorism; RL—the rule of law; RQ—regulatory quality; VA—voice and accountability; E2—secondary school enrolment; E3—tertiary school enrolment; S—value added in services; Y—GDP per capita. Dark red—significant negative effect; light red—insignificant negative effect; dark green—significant positive effect; light green—insignificant positive effect. Source: authors’ contributions.
Publisher’s Note: MDPI stays neutral with regard to jurisdictional claims in published maps and institutional affiliations. |
© 2021 by the authors. Licensee MDPI, Basel, Switzerland. This article is an open access article distributed under the terms and conditions of the Creative Commons Attribution (CC BY) license (https://creativecommons.org/licenses/by/4.0/).
Share and Cite
MDPI and ACS Style
Setikiene, A.; Butkus, M. The Heterogeneous Impact of Financialisation on Economic Growth in the Long Run. J. Risk Financial Manag. 2021, 14, 209. https://0-doi-org.brum.beds.ac.uk/10.3390/jrfm14050209
AMA Style
Setikiene A, Butkus M. The Heterogeneous Impact of Financialisation on Economic Growth in the Long Run. Journal of Risk and Financial Management. 2021; 14(5):209. https://0-doi-org.brum.beds.ac.uk/10.3390/jrfm14050209
Chicago/Turabian StyleSetikiene, Agne, and Mindaugas Butkus. 2021. "The Heterogeneous Impact of Financialisation on Economic Growth in the Long Run" Journal of Risk and Financial Management 14, no. 5: 209. https://0-doi-org.brum.beds.ac.uk/10.3390/jrfm14050209