Article

The Perceived Effectiveness of Blockchain for Digital Operational Risk Resilience in the European Union Insurance Market Sector

1
Department of Insurance, Faculty of Economics, Management and Accountancy, University of Malta, MSD2080 Msida, Malta
2
Department of Economics, Faculty of Economics and Administrative Sciences, Ardahan University, 75000 Ardahan, Turkey
3
Chitkara Business School, Chitkara University, Punjab 140401, India
*
Author to whom correspondence should be addressed.
J. Risk Financial Manag. 2021, 14(8), 363; https://0-doi-org.brum.beds.ac.uk/10.3390/jrfm14080363
Submission received: 8 July 2021 / Revised: 30 July 2021 / Accepted: 5 August 2021 / Published: 6 August 2021
(This article belongs to the Special Issue Blockchain and Cryptocurrencies)

Abstract

:
Due to the rise in the demand for information communication technologies (ICT), the need for operational risk resilience within the European insurance market sector has grown exponentially. This study aims to use the case of blockchain to evaluate whether the five characteristics determined from the literature to be required for effective digital risk resilience (specifically, integration, flexibility, reliability, relevance, and timeliness) have an impact on effectiveness in addressing the requirements of the European Union’s proposed Digital Operational Resilience Act (DORA). To achieve this, we developed a survey with 29 statements, which participants were required to answer using a five-point Likert scale. In total, 513 valid responses were received from participants. These were analyzed using exploratory factor analysis (EFA), confirmatory factor analysis (CFA), and structural equation modeling (SEM). Results show that in the case of blockchain, reliability, flexibility, and relevance were found to significantly relate to its effectiveness in addressing DORA’s requirements, but relationships of effectiveness with integration and timeliness were found to be insignificant. However, when the experience variable was added to the model as the moderator variable, we found that timeliness and relevance have a significant relationship with blockchain effectiveness, while integration, reliability, and flexibility do not.

1. Introduction

The importance of information communication technologies (ICT) within the financial sector has been and continues to be increasing exponentially, even more so during the current COVID-19 pandemic. In Europe alone, there has been a 72 percent increase in the use of financial ICT applications. This reliance on ICT has not gone unnoticed by criminals, and since the COVID-19 pandemic began, there has been a substantial increase of 38 percent in cyberattacks on financial service firms (European Commission 2020a). European Union national regulators and entities, whose focus and expertise were mainly occupied in other areas, are struggling to effectively address digital/cyber threats, which have been with us for some time but are mushrooming due to the increased dependence of financial services undertakings on the global web of internet-based communication, certification, and data storage. The concerns of the authorities regard how to ensure that the European financial services industry structures can withstand potential ICT disruptions.
Blockchain is a digital platform that was developed specifically for Bitcoin, which is a decentralized digital currency. It was first designed as a peer-to-peer electronic payment system for anonymous transfer of bitcoins without the need for a third-party authority such as the European Central Bank, Federal Reserve, or government in general (Corbet et al. 2019) and (Vidal-Tomás and Ibañez 2018).
For this reason, the European Commission (EC) implemented a digital finance package as of the 24th of September 2020. This includes a strategy for digital finance and proposals for legislation on crypto-assets and digital resilience (European Commission 2020b). The latter ‘legislative package’ consists of a proposal for new rules to mitigate the identified risks of this digital transformation. This is a proposal for a regulation of digital operational resilience in the financial sector (DORA) (European Commission 2020c), accompanied by a directive (European Commission 2020d).
However, the intervention by the European Union, so far, has been limited to minimum harmonization with superficial, generic, and subjective rules, which are not specific in addressing the how and when of intervention, leaving it to the discretion of national authorities and their undertakings to reach their interpretation. Moreover, this makes it very difficult to measure the DORA status, putting regulators in an unclear position regarding what to suggest or enforce and which systems to use (Grima 2020). There is a need to understand and determine the characteristics required of Information Technology (IT) systems to address the new risks.
The research community is becoming particularly active in using blockchain technology to solve challenges related to insurance problems in various sectors. Therefore, we are herein suggesting blockchain as a solution that addresses all aspects of DORA, and at the same time, we are using blockchain as a case study to create a conceptual model for testing the effectiveness of a digital system application used in the operations of the European insurance market sector in terms of DORA.

2. Literature Review

According to Grima et al. (2020), blockchain technology will revolutionize the insurance industry. They claim that it will help in facilitating and speeding up operations. They note that in the realm of information technology, blockchain technology has defined new elements. blockchain “is the very first fully functional Distributed Ledger Technology (DLT), which is an umbrella term that describes technologies that collect, store, distribute and facilitate exchanges of some value between private or public users”. It is an all-encompassing platform and decentralized ledger, which brings together different digital software applications that allow for an audit trail of all operations carried out between peers without the need for a centralized authority and exists across an entire network of computers (Grima et al. 2020; Pratap 2018).
Iansiti and Lakhani (2017) explain that “with blockchain, we can imagine a world in which contracts are embedded in digital code and stored in transparent, shared databases, where they are protected from deletion, tampering, and revision. In this world every agreement, every process, every task and every payment would have a digital record and signature that could be identified, validated, stored, and shared. Intermediaries such as lawyers, brokers, and bankers might no longer be necessary. Individuals, organisations, machines and algorithms would freely transact and interact with one another with little friction. This is the immense potential of blockchain”.
Pratap (2018) highlights the beneficial characteristics of blockchain in the context of insurance contracts and operations (better known as smart contracts and smart operations). Blockchain can ensure transparency, time-efficiency, precision, security and reliability, data storage, cost savings, and trust, and is a paperless logical tool. He concludes that blockchain is unlimited in its potential, since it can satisfy the needs of regulators and allow for proportionality in terms of risk management and compliance requirements.
Blockchain, like any other technological breakthrough, has a beneficial impact on a variety of businesses, including the financial services industry (FSI). Blockchain is attracting the attention of industry leaders and academics due to its disruptive nature and the fact that its deployment has transformed the market landscape (Collomb and Sok 2016). The impact of blockchain is growing to the point where it is laying the groundwork for a new economy.
According to experts, there are several advantages of using blockchain technology in the insurance industry: (1) data are verified and preserved so that it may be consumed several times, there is an increase in consumer engagement and satisfaction; (2) complete transparency of transactions improves the detection of fraud attempts, any deceit or fraudulence may be identified; (3) insurers may automate the claims process by integrating salespeople to prevent fraud; (4) blockchain incentivizes the creation of new insurance products relevant to improved means of exchanging sensitive documents by promoting creative solutions; (5) it implements a shared central data storage system that is managed by both parties; (6) it stores information to prevent data loss in case of an unforeseen event; (7) verification of each user is available, with no need for middlemen; (8) openness is guaranteed, allowing anybody to look up the history of states that have passed, and (9) there is immutability, which means that data cannot be changed (Crawford 2020).
Fallucchi et al. (2021) highlight the importance of blockchain use for operations and the internet of things and that countries are regulating blockchain technology to enable it to be used safely in many areas. They then provide a solution to promote digital use by government with superior transparency. To achieve this, they suggest a “framework based on the Ethereum blockchain, a smart contract and a decentralized application”.
Effectiveness is essential for any IT application to be a success. It needs to do the job it was made for, and it also needs to be able to offer excellent features and characteristics, which mostly relate to the way software uses accessible resources. Therefore, an IT application needs to be able to cater to the exact demographic and needs of the user to achieve excellent efficiency during its usage. There are plenty of IT applications on the market that cater to different industries, but there are only a handful of IT applications that can help individuals and businesses when it comes to efficiency.
For an information system to be useful to policy- and decision-makers and hence effective in addressing the needs of an IT risk management system, it must have certain characteristics and meet certain criteria. (1) It must be able to integrate with all processes and be understood by the users and receivers so that it can be interpreted/decoded correctly (Chenhall and Morris 1986; Napitupulu et al. 2016; Tan 2016; Qatanani and Hezabr 2015). (2) It must be flexible and adaptable, meaning that its functionality can be easily changed or extended to meet demands, and it can handle diverse and increasing or decreasing volumes of transactions, services, and data (Napitupulu et al. 2016; Shagari et al. 2017; Tan 2016). (3) It must be reliable—the information should be counted on to be trustworthy. It should be accurate, consistent with facts, and verifiable. Inadequate or incorrect information generally leads to decisions of poor quality. For example, sales figures that have not been adjusted for returns and refunds are not reliable. In addition, it must be able to ensure confidentiality, integrity, authorization, authentication, nonrepudiation, and cybersecurity (Napitupulu et al. 2016; Shagari et al. 2017). (4) It must be relevant, in terms of completeness, costs, and concision; meaning that it should be pertinent and meaningful to the decision- and policy-maker and should be in his/her area of responsibility. It should contain all the facts that are necessary for the decision-maker to satisfactorily solve the problem at hand using such information. Nothing important should be left out. Although information cannot always be complete, every reasonable effort should be made to obtain it. In addition, information is not desirable if the solution is more costly than the problem. The cost of gathering data and processing it into information must be weighed against the benefits derived from using such information (Markgraf 2019; Teru et al. 2017; kh Al-Dalabeeh and Al-Zeaud 2012; Abdallah 2014; Shagari et al. 2017). (5) It should be timely and available. Information may be useless if it is not readily accessible in the desired form when it is needed. Advances in technology have made information more accessible today than ever before. The information must be delivered at the right time and in the right place to the right person. Premature information can become obsolete or be forgotten by the time it is needed. Similarly, some crucial decisions can be delayed because proper and necessary information is not available in time, resulting in missed opportunities. Accordingly, the time gap between the collection of data and the presentation of the proper information to the decision-maker must be reduced as much as possible. That is, the speed with which an application can handle and perform a function should meet business requirements and expectations. In addition, it must be ready to perform its function when called upon (Chenhall and Morris 1986; Patel 2015; Shagari et al. 2017).

3. Aim and Objective

Therefore, we firstly aim to determine the characteristics that an IT application system should have to ensure its effectiveness for managing operations of the European Union insurance market sector in terms of DORA. Then, following a literature review, we herein suggest blockchain as a solution that effectively addresses the characteristics required by DORA and use it as a case study to create a conceptual effectiveness model (EM) for testing a digital system application used in the operations of the European Union insurance market sector in terms of DORA. Our focus is on European Union insurance undertakings, where we aim to determine the impact of the perceived effectiveness characteristics on the perceived effectiveness of blockchain in meeting the digital operational resilience requirements as established by our model and through a literature review.

4. Research Questions

We specifically aim to answer the following research questions:
RQ1: What are the characteristics that an IT application system should have to ensure its effectiveness for managing operations of the European insurance market sector in terms of DORA?
RQ2: What is the impact of these characteristics on the effectiveness of blockchain in meeting the requirements of DORA?
RQ3: How is this impact affected by experience with and knowledge of blockchain?

5. Methodology

5.1. Designing the Tool

To perform this study, we surveyed targeted practitioners and controllers with knowledge of IT in the area of insurance, adopting with some modifications a framework suggested by Mousmouti (2014a) for ‘effectiveness testing’ of blockchain in addressing the resilience requirements. We developed a questionnaire, which we then submitted to European Union based practitioners and controllers in European insurance undertakings. This is a logical exercise to examine the features of blockchain vis-a-vis the requirements for operational risk resilience.
Effectiveness reflects the relationship between the objectives and the real impact of a requirement. It expresses the capability to guide the behaviours and attitudes of the targeted sample to those prescribed by the policy-maker (Xanthaki 2008). Therefore, the features of blockchain should result in setting the benchmark for achieving its desired outcome, communicating to the targeted sample, and interacting with other requirements (Mousmouti 2014b).
Mousmouti (2014b) suggests that two dimensions need to be looked into: (1) a prospective dimension—at the design stage, when the application system is being formulated; and (2) a real-life dimension—when the system is implemented. The former reflects whether it is conducive to the desired effects, and the latter expresses whether the requirement has achieved the desired results.
Following the theoretical framework suggested by Yin (2014), Yazan (2015), and Stake (2005), and using the thematic analysis suggested by Braun and Clarke (2006) in the literature, we determined 7 propositions. The first 5 propositions are the required characteristics needed for a system application to be considered effective. Proposition 6 is expected to affect the perception of propositions 1 to 5, and proposition 7 is the overall perception of effectiveness (Table 1).
We then developed the following 20 statements as shown in Table 2, derived from the relevant literature as shown in Table 1, to develop our model based on the first 5 propositions.
Following this, we prepared 6 statements on blockchain effectiveness and 3 statements on experience with and knowledge of blockchain (Table 3 and Table 4, respectively), the Cronbach alphas of which are 0.77 (Mean = 3.99, min 3.55, max 4.16) and 0.56 (Mean = 4.32, min 4.125, max 4.587) respectively. The latter showed the reliability and validity of our 2 grouped variables.
The developed conceptual model is introduced in Figure 1. The independent variables are integration (I), flexibility (F), reliability (Re), relevance (R), and timeliness (T). Blockchain effectiveness (BE) is the dependent variable and experience (EX) is the moderator variable. The latter is added to determine the level of experience with and knowledge of the use of blockchain in ICT governance and risk management.
The questionnaire was divided into 2 sections. The first section related to the demographics of the participants; specifically their gender, age, educational achievement, occupation, and experience. The prospective participants would not have been allowed to participate if they fell into none of the occupation categories listed in this survey (Insurance Internal Control, Insurance Practitioner, and IT in Insurance) or had no experience with or knowledge of blockchain. The second section contained the 32 specific statements to which the participants were asked to answer on a Likert scale from 1 to 5—‘1′ being strongly disagreeing and ‘5′ strongly agreeing.
This questionnaire was designed using Qualtrics XM, and the link provided through this application software was self-administered using social networks, specifically, Facebook and Linked-In, and through email and other communication networks, such as Zoom, Skype, and MS Teams.
After looking at different options such as case studies, carrying out a literature review, and discussing with peers, we determined that a survey is the best way to gather and gain knowledge data about perception. We were aiming at assessing thoughts, opinion, and feelings about the use of blockchain in the context of DORA, and a survey satisfies this requirement better than other options. Moreover, the use of statements and Likert scales made it easier to manage and analyze data using quantitative methods as explained below (Attewell and Rule 1991; Pinsonneault and Kraemer 1993). Having said this, the survey, as one can note above, was not the only method used to arrive at our finding, since to build our conceptual model and survey, we followed a qualitative theoretical framework and analysis.

5.2. Sample

This survey was administered between January 2021 and June 2021, as noted above using social networks and verbal and online communication systems, and presented to European Union (EU) insurance associations, professional members, large corporations in the insurance industry, and selected experts in the field who were purposely selected based on experiences held, roles occupied in the industry, qualifications attained, and area of expertise. Although we used a non-probability purposive sampling method, we asked these participants to invite others to participate in this survey. We used the dedicated online application software Qualtrics® to enable us to collect the responses (Suen et al. 2014). We targeted EU participants, since the regulation we are focussing on (DORA) is an EU act. Participants from outside the EU were not allowed to participate, and this was made clear in the covering letter of the survey. We also asked participants to indicate their EU nationality in an open-ended question. The latter was used as a filter.
We received a total of 513 valid responses, which gave us the expected confidence that this is a representative sample and allowed us to proceed with our analysis. This sample size is within the required sample size of 384 required to ensure a 95% confidence level and 5% confidence interval for an unknown population (Creative Research Systems n.d.; Cochran 2007; Naderifar et al. 2017; Levy and Lemeshow 1999). The EU states represented in this survey were: Latvia (26), Estonia (31), Lithuania (22), Germany (59), France (41), Italy (27), Spain (48), the Netherlands (32), Slovenia (19), Greece (23), Belgium (74), Malta (29), Cyprus (22), Croatia (34), and Poland (26).
Based on the conceptual model in Figure 1, the following used hypotheses were developed:

5.3. Hypotheses

Hypothesis 1 (H1).
There is a significant effect of integration on BE.
Hypothesis 2 (H2).
There is a significant effect of reliability on BE.
Hypothesis 3 (H3).
There is a significant effect of flexibility on BE.
Hypothesis 4 (H4).
There is a significant effect of relevance on BE.
Hypothesis 5 (H5).
There is a significant effect of timeliness on BE.
Hypothesis 6 (H6).
Experience moderates the effect of flexibility on BE.
Hypothesis 7 (H7).
Experience moderates the effect of integration on BE.
Hypothesis 8 (H8).
Experience moderates the effect of reliability on BE.
Hypothesis 9 (H9).
Experience moderates the effect of timeliness on BE.
Hypothesis 10 (H10).
Experience moderates the effect of relevance on BE.

5.4. Data Analysis

The quantitative data were inputted into the SPSS application software (version 23). The items of all constructs were coded to facilitate the data analysis. The first stage of analysis was to explore the respondents’ demographic information. Descriptive statistics such as mean and standard deviation were used to analyze the data. Reliability tests were conducted including Cronbach’s alpha for internal consistency and Kaiser–Meyer–Olkin and Bartlett’s tests for checking the adequacy of the data for the next analysis, such as exploratory factor analysis (EFA). AMOS was utilized for data analysis on a total of 513 responses to develop the structural equation model (SEM). We then used confirmatory factor analysis (CFA) for the development of the measurement model. This method is a process to create a latent variable (factor) based on observed (measured) variables through a predetermined or constructed model (Bayram 2010). CFA is used to test the suitability of factors determined by exploratory factor analysis (EFA) to factor structures determined by the hypothesis. While EFA is used to test which variable groups are highly correlated with which factor, CFA is used to determine whether the variable groups contributing to the determined ‘k’ number of factors are adequately represented by these factors (Aytaç and Öngen 2012).

6. Findings and Analysis

6.1. Participants’ Demographics

513, valid responses were received. 163 (31.80%) were male, 345 (67.3%) female, and 4 (8%) other. The largest groups of participants were from ages 18 to 30 years (177—34.5%) and 31 to 40 years (135—26.3%), and the smallest group of participants included those above the age of 71 years (43—8.4%), with 56 participants between 41 to 50 years, 45 participants between 51–61 years, and 57 participants between 61 to 70 years. Their education level varied, with 176 (34.3%) being participants at bachelor degree level, 158 (30.80) being at post-graduate degree level, 175 (34.1%) being at or below certification/diploma level, and only 4 (0.8%) being participants with no formal schooling. Most participants worked in information technology (234—45.6%), others worked in insurance and internal Controls (187—36.5% and 92—17.9%, respectively), and most of them noted that they had a very high level of experience with and knowledge of blockchain 334 (65.1%). 92 (17.90%) noted that they have a high level of experience with and knowledge of blockchain, 77 (15%) expressed a medium level of knowledge, and only 10 (2%) expressed that their knowledge and experience with blockchain was on the low side.

6.2. Exploratory Factor Analysis

The data of the respondents were inputted into IBM SPSS® (Version 20) and subjected to statistical analysis, specifically exploratory factor analysis (EFA). This was used to determine and group themes into perceived effectiveness of blockchain use, based on the factor variables in insurance undertakings’ operations in line with the requirements of DORA.
For exploratory factor analysis, the promax rotation (orthogonal rotation) was used via principal components extraction and with Kaiser normalization. The Kaiser–Meyer–Olkin (KMO) statistic is a measure of sampling adequacy for the appropriateness of applying factor analysis and fell within the acceptable range (above 0.6), with a value of 0.800. This further supported the continuance of factor analysis.
Exploratory factor analysis loaded the best on 5 factors and 20 statements, which in combination explained 55% of the variance. Table 5 shows the statements that are grouped under each of the five factor variables. Factor 1, integration (I), explains 22.78% of the variance and comprises four items. Factor 2, reliability (Re), explains 11.02% of the total variance and comprises four items. Factor 3, flexibility (F), explains 8.37% of the total variance and comprises five items. Factor 4, relevance (R), explains 7.19% of the total variance and comprises four items, and Factor 5, timeliness (T), explains 6.20% of the total variance and comprises three items (Hair 1998).
Cronbach’s alpha was used to evaluate the reliability of the exploratory factor analysis. When taken as a whole, the Cronbach’s alpha coefficient of this scale was calculated as 0.812. Cronbach’s alpha coefficients of the sub-dimensions are between 0.65–0.79, as shown in Table 6. Cronbach’s alpha results must be greater than 0.6 to be acceptable. Hinton et al. (2004) argue that, as a general rule, a Cronbach’s alpha value shows moderate reliability between 0.50 and 0.70 and high reliability between 0.70 and 0.90. Therefore, it can be said that this scale is reliable (Taber 2016, Hulin et al. 2001, Netemeyer and Cudeck 2001).
In this study, a model was created based on the items of the factors obtained as a result of EFA. At this stage of the study, EFA was applied to the data. Analysis results are given in Table 5.

6.3. Confirmatory Factor Analysis

In the second stage of the study, CFA was used to test the compatibility of the factors determined by EFA with the factor structures determined by the hypotheses. Measurement models aim to reveal how and to what extent a group of observable variables (as a measurement tool) explain the latent variables called factors. By creating a first-level CFA model, the latent factors and the interdependent effects between these factors were tested in the IBM AMOS V16 program.
Various indices are used to test the model fit. The most used fit indices are: χ2/df, goodness of fit index (GFI), root mean square residual (RMR), and root mean square of approximate errors (RMSEA). A perfect fit is indicated by 0 ≤ χ2/df ≤ 2, and 2 ≤ χ2/df ≤ 3 indicates an acceptable fit. In this study, the χ2/df value was found to be 2.42. A GFI of 0.95 ≤ GFI ≤ 1.00 indicates perfect fit, and 0.90 ≤ GFI ≤ 0.95 indicates an acceptable fit. In this study, the GFI value was calculated as 0.92; therefore, the fit is an acceptable one. A CFI of 0.95 ≤ CFI ≤ 1.00 indicates a perfect fit, and 0.90 ≤ CFI ≤ 0.95 indicates an acceptable fit. In this study, the CFI value was calculated as 0.91, indicating an acceptable fit. An RMSEA of 0 ≤ RMSEA ≤ 0.05 indicates a perfect fit, and 0.05 ≤ RMSEA ≤ 0.08 indicates an acceptable fit. In this study, the RMSEA value was calculated as 0.05, indicating an acceptable fit. As a result, these fit indices revealed that the model had a good fit. It has been determined that the values of the model obtained as a result of CFA are within acceptable limits. Therefore, the five-factor structure was confirmed.

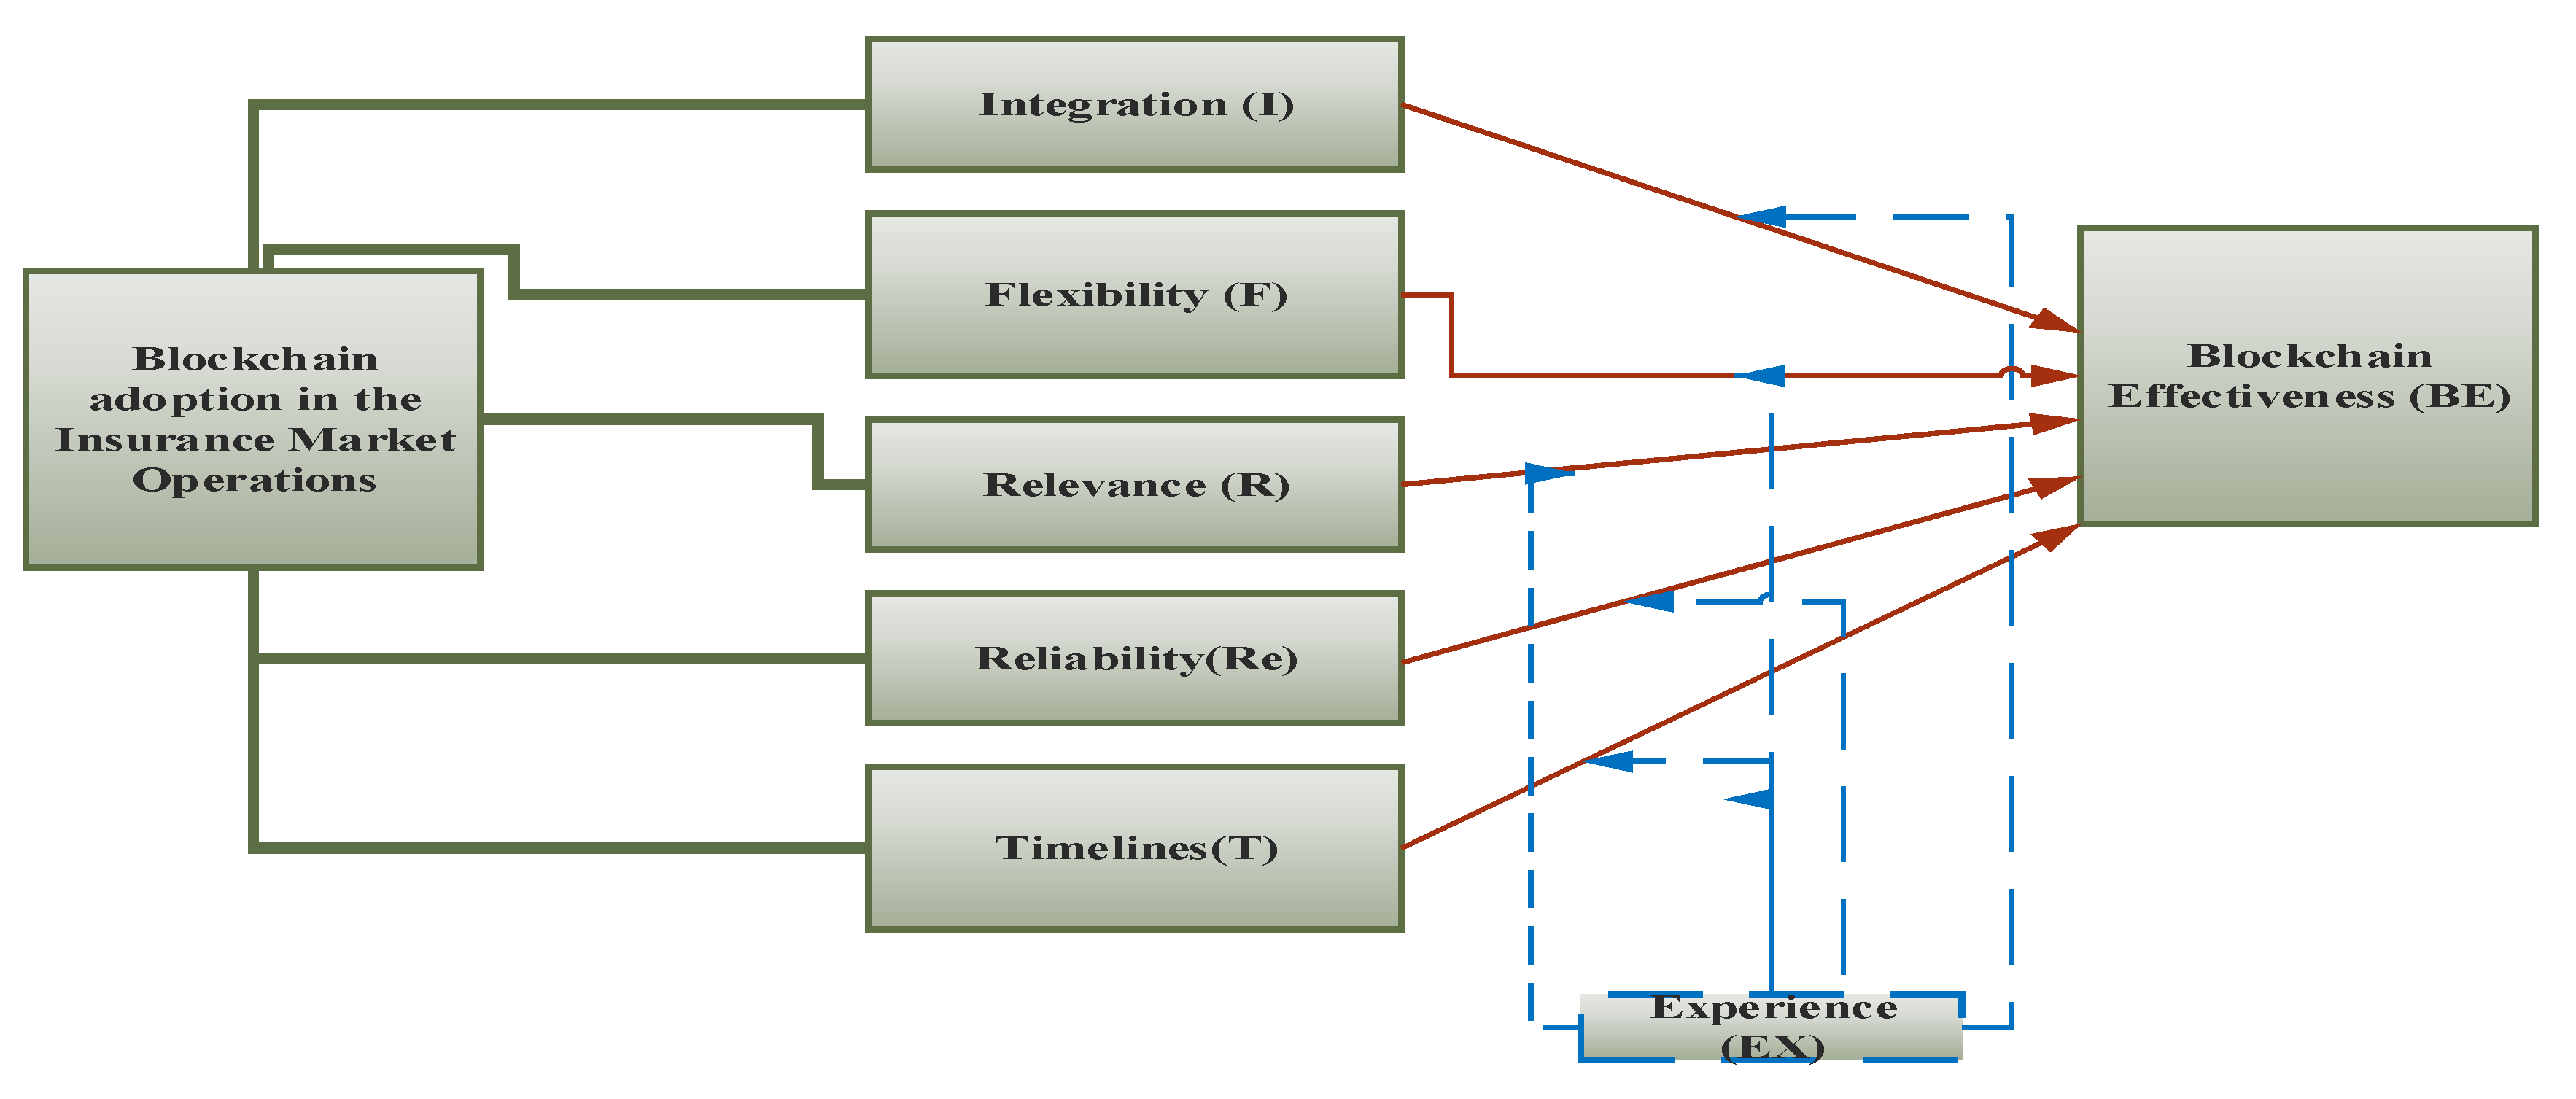
6.4. Structural Model

As a first step, the measurement models of the items were evaluated. Although the fit values in the measurement models were within the desired limits, these items were excluded from the analysis because the standardized coefficients of some items were below 0.5.
Both standardized and unstandardized versions of the obtained path coefficients are presented in Table 7.
In the measurement model, the standardized coefficients of the F variable vary between 0.549 and 0.629, and the R2 values vary between 0.296 and 0.400. The standardized coefficients of the I variable vary between 0.650 and 0.833, and the R2 values vary between 0.437 and 0.697. The standardized coefficients of the Re variable vary between 0.584 and 0.736, and the R2 values vary between 0.336 and 0.540. The standardized coefficients of the T variable vary between 0.520 and 0.730, and the R2 values vary between 0.268 and 0.534. The standardized coefficients of the R variable vary between 0.521 and 0.687, and the R2 values vary between 0.224 and 0.490. The standardized coefficients of the BE variable vary between 0.692 and 0.720, and the R2 values vary between 0.473 and 0.523.
In the structural model, the standardized coefficients were between -0.134 and 0.568. The R2 value of the model was calculated as 0.428.
In the structural model, basically, five hypotheses were examined. These were:
H1:
There is a significant effect of integration on BE.
H2:
There is a significant impact of reliability on BE.
H3:
There is a significant impact of flexibility on BE.
H4:
There is a significant impact of relevance on BE.
H5:
There is a significant impact of timeliness on BE.
According to the results obtained in the created model, the model is compatible and fits index values; Chi-square is calculated as 463.063, df = 191, p-value = 0.000, cmin/df = 2.424, CFI = 0.92, GFI = 0.91, and RMSEA = 0.05. Model fit values are between desired values.
Figure 2 shows the structural equation with standardized coefficients. In the structural equation model:
  • A statistically significant relationship was found between reliability and BE (B = −0.134, p < 0.05).
  • A statistically significant relationship was found between flexibility and BE (B = 0.179, p < 0.05).
  • A statistically significant relationship was found between relevance and BE (B = 0.568, p < 0.01).
  • A statistically insignificant relationship was found between integration and BE (B = 0.024, p > 0.05).
  • A statistically insignificant relationship was found between timeliness and BE (B = 0.115, p > 0.05).
Therefore, hypotheses H2, H3, and H4 were confirmed. Hypotheses H1 and H5 could not be confirmed.

6.5. Moderation Effect of Experience

Moderation models were used to test the moderating hypotheses of experience. Table 8 shows the models and hypotheses and whether they were rejected or not.
When the research hypotheses were tested, according to the Bootstrap results, the indirect effect of F (β = 0.042, ZT 95%, −0.061–0.143), I (β = 0.050, ZT 95%, −0.034–0.142), and Re (β = 0.063, ZT 95%, −0.017–0.155) on BE could not be supported through experience. The results are not statistically significant, as the relevant confidence intervals value is ‘0′. Therefore, the hypotheses were rejected.
The indirect effect of T (β = 0.090, ZT 95%, 0.019–0.179) and R (β = 0.274, ZT 95%, 0.122–0.512) on BE was supported through experience. The results are not statistically significant, as the relevant confidence intervals do not contain the value ‘0′. Therefore, the hypotheses were accepted.

7. Discussions and Conclusions

We show, using blockchain as our case study, that as per our propositions, IT application system should have the following five characteristics to ensure its effectiveness for managing operations of the European insurance market sector in terms of DORA: (1) integration; (2) flexibility; (3) reliability; (4) relevance; and (5) timeliness. We develop a conceptual model for an IT system application’s effectiveness in addressing the DORA requirements and find the impact of these characteristics on blockchain’s effectiveness in a European Insurance Sector to address the requirements of DORA.
Results show that in the case of blockchain, reliability, flexibility, and relevance were found to significantly relate to its effectiveness in addressing DORA’s requirements, but relationships of effectiveness to integration and timeliness were insignificant. However, when the experience variable was added to the model as the moderator variable, we saw that timeliness and relevance have a significant relationship with blockchain effectiveness, while integration, reliability, and flexibility do not. This shows that there is a difference in perception of what variable significantly influences blockchain’s effectiveness in addressing the requirements of DORA, between those respondents with more experience and knowledge of blockchain application systems and those with less experience and knowledge.
These results contribute to the literature on the use and applicability of blockchain to use in operations and to ensure resilience to risks faced, in this case by insurance undertakings. In addition, we provide an effectiveness model for assessing whether an IT system application is effective for addressing the proposed DORA requirements. Moreover, it contributes to the literature on the DORA proposal published in September 2020, which is still at the discussion and consultation phase. The final regulations are expected to be published towards the end of 2022, with a date for compliance and additional technical standards 12–18 months later.

Author Contributions

Conceptualization, S.G.; methodology, M.K. and S.G.; software, M.K. and S.G.; validation, M.K., S.G., and M.E.; formal analysis, M.K. and S.G.; investigation, M.K. and S.G.; resources, M.K. and S.G.; data curation, M.K. and S.G.; writing—original draft preparation, M.K., S.G., and K.S.; writing—review and editing, M.K., S.G., and K.S.; visualization, S.G.; supervision, S.G.; project administration, S.G. All authors have read and agreed to the published version of the manuscript.

Funding

This research received no external funding.

Institutional Review Board Statement

The study was conducted according to the guidelines of the Declaration of Helsinki and Ethical review and approval were waived for this study, due to it not being necessary in terms of the requirements and it being anonymous and anonymized and not asking for any details that make them identifyable. The Ethics and data protection form was however sent for filing to the FEMA Ethics Committee of the University of Malta (Form ID: 9433-30072021).

Informed Consent Statement

Participants were free to decide whether to participate in the study since it was an anonymous online survey and by participating they gave consent to use the data from the survey.

Data Availability Statement

Data are available in the paper itself.

Conflicts of Interest

The authors declare no conflict of interest.

References

  1. Abdallah, Ahmad Adel Jamil. 2014. The impact of using accounting information systems on the quality of financial statements submitted to the income and sales tax department in Jordan. European Scientific Journal 9. [Google Scholar] [CrossRef]
  2. Al-Dalabeeh, Abed El. Rahman, and Hussein Ali Al-Zeaud. 2012. Accounting information systems and their role in the measurement and cost thrifting in public shareholding industrial companies in Jordan. International Journal of Business and Management 7: 97. [Google Scholar] [CrossRef] [Green Version]
  3. Altawalbeh, Mohammad Abdullah Fayad, Firas Na’elRawhi Hashem, and Khalid Ali Ahmad Alduneibat. 2017. The Role of Accounting Information Systems in Activating the Role of the Responsibility in the Jordanian Industrial Companies. Journal of Modern Accounting and Auditing 13: 1–7. [Google Scholar]
  4. Alzeban, Abdulaziz, and David Gwilliam. 2014. Factors affecting the internal audit effectiveness: A survey of the Saudi public sector. Journal of International Accounting, Auditing and Taxation 23: 74–86. [Google Scholar] [CrossRef]
  5. Attewell, Paul, and James B. Rule. 1991. Survey and other methodologies applied to IT impact research: Experiences from a comparative study of business computing. In The Information Systems Research Challenge: Survey Research Methods. Edited by Kenneth L. Kraemer. Cambridge: Harvard Business School Press, vol. 3, pp. 299–316. [Google Scholar]
  6. Aytaç, Mustafa, and Burcu Öngen. 2012. Examining the construct validity of the new environmental paradigm scale with confirmatory factor analysis. Journal of Statisticians. (Doğrulayıcıfaktöranaliziileyeniçevreselparadigmaölçeğininyapıgeçerliliğininincelenmesi, İstatistikçilerDergisi) 5: 14–22. [Google Scholar]
  7. Bayram, Nuran. 2010. Introduction to Structural Equation Modeling. Bursa: Ekin Publishing House; YapısalEşitlikModellemesineGiriş. [Google Scholar]
  8. Braun, Virginia, and Victoria Clarke. 2006. Using thematic analysis in psychology. Qualitative Research in Psychology 3: 77–101. [Google Scholar] [CrossRef] [Green Version]
  9. Chenhall, Robert H., and Deigan Morris. 1986. The impact of structure, environment, and interdependence on the perceived usefulness of management accounting systems. Accounting Review 61: 16–35. [Google Scholar]
  10. Cochran, William G. 2007. Sampling Techniques. Hoboken: John Wiley and Sons. [Google Scholar]
  11. Collomb, Alexis, and France Klara Sok. 2016. Blockchain/Digital Ledger Technology (DLT): What impact on the financial sector? Digiworld Economic Journal 103: 93. [Google Scholar]
  12. Corbet, Shaen, Brian Lucey, Andrew Urquhart, and Larisa Yarovaya. 2019. Cryptocurrencies as a financial asset: A systematic analysis. International Review of Financial Analysis 62: 182–99. [Google Scholar] [CrossRef] [Green Version]
  13. Crawford, Bridget J. 2020. Blockchain Wills. Indiana Law Journal 95: 735. [Google Scholar]
  14. Creative Research Systems. n.d. Sample Size Calculator. Available online: https://www.surveysystem.com/sscalc.htm (accessed on 6 July 2021).
  15. European Commission. 2020a. A Digital Finance Strategy for Europe. Digital Finance EU. September. Available online: https://ec.europa.eu/info/sites/default/files/business_economy_euro/banking_and_finance/200924-digital-finance-factsheet_en.pdf (accessed on 6 July 2021).
  16. European Commission. 2020b. Digital Finance Package. September. Available online: https://ec.europa.eu/info/publications/200924-digital-finance-proposals_en#_blank (accessed on 6 July 2021).
  17. European Commission. 2020c. The European Commission: Proposal for a Regulation of the European Parliament and of the Council on Digital Operational Resilience for the Financial Sector and Amending Regulations (EC) No 1060/2009, (EU) No 648/2012, (EU) No 600/2014 and (EU) No 909/2014. com/2020/595 Final. Available online: https://eur-lex.europa.eu/legal-content/EN/TXT/?uri=CELEX%3A52020PC0595 (accessed on 6 July 2021).
  18. European Commission. 2020d. Proposal for a Directive of the European Parliament and of the Council Amending Directives 2006/43/EC, 2009/65/EC, 2009/138/EU, 2011/61/EU, EU/2013/36, 2014/65/EU, (EU) 2015/2366 and EU/2016/2341. com/2020/596 Final. Available online: https://eur-lex.europa.eu/legal-content/EN/TXT/?uri=CELEX%3A52020PC0596 (accessed on 6 July 2021).
  19. Fallucchi, Francesca, Marco Gerardi, Michele Petito, and Ernesto William De Luca. 2021. Blockchain Framework in Digital Government for the Certification of Authenticity. Timestamping and Data Property. Paper presented at 54th Hawaii International Conference on System Sciences, Kauai Island, HI, USA, January 5–8; pp. 1–10. [Google Scholar]
  20. Grima, Simon. 2020. The Perceived Effectiveness by Insurers of the EIOPA Guidelines on ICT Governance Systems. Paper presented at 21st AIDA Serbia Conference, Sabac, Serbia, April 3–5. [Google Scholar]
  21. Grima, Simon. 2020. A Steep framework analysis of the key factors impacting the use of blockchain technology in the insurance industry. The Geneva Papers on Risk and Insurance Issues and Practices 45: 398–425. [Google Scholar] [CrossRef]
  22. Hair, Joseph F. 1998. Multivariate Data Analysis. Upper Saddle River: Prentice-Hall. [Google Scholar]
  23. Herda, David N., and Kasey A. Martin. 2016. The effects of auditor experience and professional commitment on acceptance of underreporting time: A moderated mediation analysis. Current Issues in Auditing 10: A14–A27. [Google Scholar] [CrossRef] [Green Version]
  24. Hinton, Perry R., Brownlow Charlotte, Isabella Mcmurray, and Cozens Bob. 2004. SPSS Explained, 2nd ed. London and New York: Routledge. [Google Scholar]
  25. Hulin, Charles, Robert Cudeck, Richard G. Netemeyer, Dillon R. William, and Mc Donald Roderick. 2001. Measurements. Journal of Consumer Psychology 10: 55–69. [Google Scholar] [CrossRef]
  26. Iansiti, Marco, and Karim R. Lakhani. 2017. The Truth About Blockchain. Harvard Business Review. Technology. Available online: https://hbr.org/2017/01/the-truth-about-blockchain (accessed on 30 July 2021).
  27. Levy, Paul S., and Stanley Lemeshow. 1999. Sampling of Populations: Methods and Applications, 3rd ed. New York: John Wiley and Sons. [Google Scholar]
  28. Markgraf, Bert. 2019. Characteristics of a Good Management Information System. CHRON Newsletters. March 5. Available online: https://smallbusiness.chron.com/characteristics-good-management-information-system-59060.html (accessed on 30 July 2021).
  29. Mousmouti, Maria. 2014a. The “effectiveness test” as a tool for law reform. IALS Student Law Review 2: 4–8. [Google Scholar] [CrossRef]
  30. Mousmouti, Maria. 2014b. ‘Effectiveness as an Aid to Legislative Drafting’. The Loophole 17: 1–61. [Google Scholar]
  31. Naderifar, Mahin, Hamideh Goli, and Fereshteh Ghaljaie. 2017. Snowball Sampling: A Purposeful Method of Sampling in Qualitative Research. Strides in Development of Medical Education 14: 1–6. [Google Scholar] [CrossRef] [Green Version]
  32. Napitupulu, Ilham Hidayah, Sri Mahyuni, and Jojor Lisbet Sibarani. 2016. The impact of internal control effectiveness to the quality of management accounting information system: The survey on State-Owned Enterprises (SOEs). Journal of Theoretical and Applied Information Technology 88: 358–66. [Google Scholar]
  33. Netemeyer, Richard, and Robert Cudeck. 2001. Can a Reliability Coefficient Be Too High? Journal of Consumer Psychology 10: 55–58. [Google Scholar]
  34. Patel, F. 2015. Effects of accounting information system on Organizational Profitability. IJRAR–International Journal of Research and Analytical Reviews 2: 72–76. [Google Scholar]
  35. Pinsonneault, Alain, and Kenneth L. Kraemer. 1993. Survey Research Methodology in Management Information Systems: An Assessment. Journal of Management Information Systems 10: 75–105. [Google Scholar] [CrossRef] [Green Version]
  36. Pratap, Mayank. 2018. Everything You Need to Know about Smart Contracts: A Beginner’s Guide. August 27. Available online: https://hackernoon.com/everything-you-need-to-know-about-smart-contracts-a-beginners-guide-c13cc138378a (accessed on 30 July 2021).
  37. Qatanani, Khaled M., and Abdulqawi A. Hezabr. 2015. The effect of using accounting information systems to improve the value chain in the business organizations-empirical study. European Journal of Accounting Auditing and Finance Research 3: 1–11. [Google Scholar]
  38. Shagari, Shamsudeen Ladan, Akilah Abdullah, and Rafeah Mat Saat. 2017. Contributory Factors of Accounting Information Systems Effectiveness in Nigerian Banking Sector. Asian Journal of Multidisciplinary Studies 151. Available online: https://www.academia.edu/35004033/Asian_Journal_of_Multidisciplinary_Studies_Contributory_Factors_of_Accounting_Information_Systems_Effectiveness_in_Nigerian_Banking_Sector (accessed on 6 July 2021).
  39. Stake, Robert E. 2005. Qualitative Case Studies. In The Sage Handbook of Qualitative Research. Edited by Norman K. Denzin and Yvonna S. Lincoln. Washington, DC: Sage Publications Ltd., pp. 443–66. [Google Scholar]
  40. Suen, Lee-Jen Wu, Hui-Man Huang, and Hao-Hsien Lee. 2014. A Comparison of Convenience Sampling and Purposive Sampling. Bethesda: PubMed. [Google Scholar]
  41. Taber, Keith S. 2016. The Use of Cronbach’s Alpha When Developing and Reporting Research Instruments in Science Education. Research in Science Education 48: 1–24. [Google Scholar] [CrossRef]
  42. Tan, Ömer Faruk. 2016. Impact of Accounting Information Systems on Internal Auditors in Turkey. ÖneriDergisi 12: 245–60. [Google Scholar] [CrossRef]
  43. Teru, Susan Peter, Innocent Idoku, and Jane Tinyang Ndeyati. 2017. A Review of the Impact of Accounting Information System for Effective Internal Control on Firm Performance. Indian Journal of Finance and Banking 1: 52–59. [Google Scholar] [CrossRef]
  44. Toth, Zsuzsanna. 2012. The current role of accounting information systems. Theory, Methodology, Practice 8: 91. [Google Scholar]
  45. Vidal-Tomás, David, and Ana Ibañez. 2018. Semi-strong efficiency of Bitcoin. Finance Research Letters 27: 259–65. [Google Scholar] [CrossRef]
  46. Xanthaki, Helen. 2008. On Transferability of Legislative Solutions: The Functionality Test. In Drafting Legislation. A Modern Approach. Edited by Constantin Stefanou and Helen Xanthaki. Aldershot: Ashgate. [Google Scholar]
  47. Yazan, Bedrettin. 2015. Three approaches to case study methods in education. In The Qualitative Report. Edited by Yin Merriam and Stake. Fort Lauderdale: Nova Southeastern University (NSU), vol. 20, pp. 134–52. Available online: https://nsuworks.nova.edu/cgi/viewcontent.cgi?article=2102&context=tqr (accessed on 6 August 2021).
  48. Yin, Rober K. 2014. Case Study Research: Design and Methods. Thousand Oaks: Sage. [Google Scholar]
Figure 1. The conceptual model (Source: authors’ compilation).
Jrfm 14 00363 g001
Figure 2. Confirmatory factor analysis (Source: Authors 2021). (Source: authors’ compilation).
Jrfm 14 00363 g002
Table 1. Constructs and items adopted from (Source: authors’ compilation).
PrepositionConstructNumber of ItemsSources
1Integration (I)4 (Statements 2 to 5)Chenhall and Morris (1986); Napitupulu et al. (2016); Tan (2016); Qatanani and Hezabr (2015)
2Flexible (F)4 (Statements 10 to 13)Napitupulu et al. (2016); Shagari et al. (2017); Tan (2016)
3Reliability (Re)5 (Statements 6 to 9 and statement 1)Napitupulu et al. (2016); Shagari et al. (2017)
4Relevance (R)4 (Statements 14 to 17)Teru et al. (2017); Al-Dalabeeh and Al-Zeaud (2012); Abdallah (2014); Shagari et al. (2017); Markgraf (2019)
5Timeliness (T)3 (Statements 18 to 20)Chenhall and Morris (1986); Patel (2015); Shagari et al. (2017)
6Experience (EX)3Toth (2012); Altawalbeh et al. (2017); Herda and Martin (2016)
7Effectiveness6Alzeban and Gwilliam (2014)
Table 2. List of statements on the perceived effectiveness model (Source: authors’ compilation).
STATEMENT
1Blockchain can improve the accuracy of data and information management
2Blockchain includes internal controls which can help to reduce the cases of fraud in the accounting data
3The integration of Blockchain can improve the internal control effectiveness
4Blockchain encourages the spirit of creativity and innovation among all employees
5The information contained in the reports issued by Blockchain are credible and transparent
6Blockchain can provide information that reduces errors during work
7There is trust in the quality of Blockchain
8The reliability of Blockchain outputs is important for decision-makers
9Blockchain in my organization can help in complementing the formal procedures
10Blockchain can adapt to modern legislation and laws
11The flexibility of can increase the internal control effectiveness
12Blockchain can provide information capable of correcting previous events
13Blockchain provides various options for selection
14Blockchain can provide efficient and relevant information to serve any purpose
15Blockchain can provide operational reports related to the current operations of the organization
16Blockchain can provide relevant information supporting organization strategy
17Blockchain can provide relevant information for decision making
18Blockchain can ensure that requested information is created immediately upon request
19Blockchain can ensure that correct and consistent information is provided on time when required
20Blockchain can ensure that data is available regularly enough to influence management decisions
Table 3. List of statements on blockchain perceived effectiveness (Source: authors’ compilation). I. Dependent Variable Blockchain Effectiveness.
No.Statement
1BE1. With Blockchain the internal controls and governance and performance are improved
2BE2. With Blockchain the internal controls, governance and operations to ascertain that results are consistent with organization goals are improved
3BE3. With Blockchain the accuracy and reliability improved
4BE4. With Blockchain the compliance with policies, plans, laws and regulations are improved
5BE5. With Blockchain the effectiveness of risk management is improved
6BE6. With Blockchain the internal controls, governance, and operations to ascertain that results are consistent with organization goals are improved
Table 4. List of statements on blockchain experience and knowledge (Source: authors’ compilation). II. Moderator Variable Experience.
No.Statement
1E1. Employee training to increase their skill and knowledge in Blockchain helps in the use of the application
2E2. Experience and Knowledge of Blockchain and Insurance helps to achieve consistent, and quality results
3E3. The experience and knowledge of Blockchain and Insurance helps controllers to use Blockchain in an efficient manner
Table 5. Exploratory factor analysis (Source: IBM SPSS® authors’ compilation).
F1F2F3F4F5
BV5. Blockchain can improve the accuracy of data and information management0.859
BV2. Blockchain includes internal controls which can help to reduce the cases of fraud in the accounting data0.842
BV3. The integration of Blockchain can improve the internal control effectiveness0.769
BV4. Blockchain encourages the spirit of creativity and innovation among all employees0.555
BV12. The information contained in the reports issued by Blockchain are credible and transparent 0.793
BV13. Blockchain can provide information that reduces errors during work 0.771
BV11. There is trust in the quality of Blockchain 0.661
BV10. The reliability of Blockchain outputs is important for decision makers 0.621
BV1. Blockchain in my organization can help in complementing the formal procedures 0.754
BV7. Blockchain can adapt to modern legislation and laws 0.709
BV9. The flexibility of Blockchain can increase the internal control effectiveness 0.610
BV8. Blockchain can provide information capable of correcting previous events 0.600
BV6. Blockchain provides various options for the selection 0.595
BV14. Blockchain can provide efficient and relevant information to serve any purpose 0.738
BV15. Blockchain can provide operational reports related to the current operations of the organization 0.738
BV16. Blockchain can provide relevant information supporting the organization strategy 0.720
BV17. Blockchain can provide relevant information for decision making 0.682
BV20. Blockchain can ensure that requested information is created immediately upon request 0.815
BV19. Blockchain can ensure that correct and consistent information is provided on time when required 0.787
BV18. Blockchain can ensure that data is available regularly enough to influence management decisions 0.679
Table 6. Cronbach alpha values (Source: IBM SPSS® authors’ compilation).
FactorName of FactorItemMeanMin-MaxCronbach Alpha
Factor 1 (F1) Integration43.5393.413–3.7290.79
Factor 2 (F2) Reliability44.1033.916–4.1810.71
Factor 3 (F3)Flexibility53.5023.361–3.6570.70
Factor 4 (F4)Relevance44.0023.986–4.3100.70
Factor 5 (F5)Timeliness33.4173.409–3.4230.65
Table 7. Standardized and unstandardized versions of the obtained path coefficients (Source: authors’ compilation).
β0β1S.E.C.R.R2p
Measurement Model
BV1<---F0.5811 0.337
BV6<---F0.5490.9380.1058.9150.296***
BV7<---F0.6171.1230.1179.5670.383***
BV9<---F0.6291.1790.1229.6720.400***
BV5<---I0.6501 0.437
BV3<---I0.7541.0160.07713.2690.518***
BV2<---I0.8331.1840.08713.5640.697***
BV11<---Re0.5840.8210.07910.3740.336***
BV12<---Re0.7361.0060.08911.3340.540***
BV13<---Re0.7181 0.522
BV20<---T0.7301 0.534
BV19<---T0.6170.8310.0988.4830.381***
BV18<---T0.5200.7120.0888.0570.268***
BV17<---R0.5821 0.490
BV16<---R0.5210.930.1019.2280.396***
BV15<---R0.687Oca.160.1229.4950.284***
BV14<---R0.6281.0940.1189.2420.224***
BE2<---BE0.6441 0.416
BE3<---BE0.7011.1980.09912.1490.492***
BE5<---BE0.6921.1080.09212.0530.473***
BE6<---BE0.7201.1730.09512.3410.523***
Structural Model
BE<---I0.0240.0220.0660.3290.4280.742
BE<---Re−0.134−0.1230.062−1.987**
BE<---F0.1790.2070.1032.003**
BE<---R0.5680.5260.0856.164***
BE<---T0.1150.1130.0621.8350.067
β0 standardized coefficients, β1 unstandardized coefficients, *** p < 0.001, ** p < 0.05.
Table 8. Moderation effect of experience.
Moderation EffectsStandardized Indirect Effect (β)Bootstrap Lower–Upper Bounds TZ %95Hypothesis Decision
BE<---EX<---F0.042−0.061–0.143Reject
BE<---EX<---I0.050−0.034–0.142Reject
BE<---EX<---Re0.063−0.017–0.155Reject
BE<---EX<---T0.0900.019–0.179Accept
BE<---EX<---R0.2740.122–0.512Accept
Bootstrap refresh sample = 5000 (Source: authors’ compilation).
Publisher’s Note: MDPI stays neutral with regard to jurisdictional claims in published maps and institutional affiliations.

