
Why the Operating Performance of Post-IPO Firms Decreases: Evidence from China


1
Business School, Wuchang University of Technology, Wuhan 430223, China
2
International College, Krirk University, Bangkok 10220, Thailand
*
Author to whom correspondence should be addressed.
J. Risk Financial Manag. 2021, 14(9), 424; https://0-doi-org.brum.beds.ac.uk/10.3390/jrfm14090424
Submission received: 19 July 2021
/
Revised: 26 August 2021
/
Accepted: 2 September 2021
/
Published: 5 September 2021
(This article belongs to the Special Issue Corporate Finance)
Abstract
:Based on a database of 200 listed firms from the Growth Enterprise Market of China, this paper employs regression models to investigate the significance of IPO capital expenditure to firms’ operating performance. It suggests that a vast majority of pre-IPO money is spent on business development to promote operating performance in order to meet IPO requirements. After the IPO, most of the money is transferred to equity investments in order to increase the firms’ market value quickly, which leads to operating performance decline and deterioration.
1. Introduction
An IPO is considered a milestone in the life cycle of a developing firm, which facilitates the acquisition of a variety of business resources, particularly capital-related inputs (Celikyurt et al. 2010). For instance, Maksimovic and Pichler (2001) suggest that the IPO is a strategy to secure “first-mover advantage” in a product market, which may attract more attention and confidence from their prospective investors, customers, creditors, and other business partners, thereby adding value to the firm. Chemmanur and He (2011) reveal that IPO is a marketing strategy for a firm to restrain its industrial competitors and deter new entrants to the industry. Rajan (1992) documents that an IPO may enhance an issuer’s financial capability, its bargaining power with bankers, and consequently increase its financial credit. In addition, IPO is an effective and efficient strategy for mergers and acquisitions (Hsieh et al. 2011). Therefore, IPO firms have access to more capital inputs and other business resources, and can thereby perform better than before.
However, research shows that an increasing number of IPO firms under-perform in the years after going public (Jin et al. 2017; Pastusiak et al. 2016; Mikkelson et al. 1997); this phenomenon also exists in the Chinese stock markets (Gao et al. 2021; Gui and Lai 2005), which is what stimulated our research interest. Gao et al. (2021), based on the data from the Growth Enterprise Market of China (GEMC), showed that IPO firms have no contributions to income- and profit-related performance because the majority of these IPO firms are unable to spend IPO capital on operating performance. Our research is a study that further investigates how IPO firms spend their IPO money.
This study concentrates on two key issues:
- How do IPO firms use their IPO fund?
- How do the different money management strategies in the period pre- and post-IPO impact on firm performance?
Previous research shows that post-IPO performance decreases (Gao et al. 2021; Jin et al. 2017; Pastusiak et al. 2016), with some research attributing it to various factors such as ownership structure (Peng et al. 2021), political connections (Bao et al. 2016), and government involvement (Cumming and Johan 2016). Few studies attribute it to strategies for management of IPO capital. This study bridges this gap by investigating why firm performance decreases from the perspective of cash flow. As IPO firms have different ways of spending their IPO money, and there is an association between capital input and firm performance (Jiang et al. 2006), the performance of different firms thus vary due to their different expenditure strategies, namely where IPO money goes in terms of cash flow.
This study, which samples the performance data of IPO firms from the GEMC, finds that these firms have different expenditure policies between pre- and post-IPO. Before going public, IPO firms spend the majority of their money on promoting the firm’s operating performance to decrease their debt rates and show their growth potential, in order to meet the listing requirements. On the contrary, most of the IPO money is spent on capitalization-based activities such as mergers and acquisitions to promote firm market value after going public. These firms are keen on taking advantage of the IPO to leverage their debt in order to raise more money, but very little is dedicated to operating performance.
The most significant contribution of this study is partly to account for the phenomenon documented by previous studies (Gao et al. 2021; Jin et al. 2017; Pastusiak et al. 2016; Mikkelson et al. 1997), which suggest that the post-IPO performance of most firms decreases but the companies have no further responses to it. In addition, this study has some practical implications. (1) For managers, it suggests that only ongoing inputs are able to remain major business and accordingly support sustainable firm growth. (2) For investors, it suggests that good operating performance in the long run is a foundation for the favorable market performance of stock prices. (3) For policy makers, it suggests that more policies supporting industrial innovation means more sustainable operating performance.
2. Literature Review and Hypotheses
There are various advantages for IPO firms. Bancel and Mittoo (2009) show that listed firms in the US present more robust growth potential annually than non-listed firms in terms of assets, market capitalization, and employee recruitment. Rajan (1992) suggests that going public can also strengthen a firm’s credit and negotiation power with bankers and financial creditors, enhance its financial flexibility, and consequently reduce its fund-raising costs. Therefore, IPO firms have more advantages than before, and they are expected to have better performance and maintain this performance after going public.
However, some literature reveals that firm performance declines and even deteriorates (Jin et al. 2017; Pastusiak et al. 2016). Firm performance is determined by a variety of factors such as industry-specific, firm size-related, policy-oriented, and economy-based factors. Firm performance is associated with industry interactions (Meyer-Stamer 1999). However, little literature have shed light on this research question from the perspective of IPO capital expenditure. This study is going to bridge this gap.
In addition, a wide range of research shows that IPO motivations vary significantly depending on the firms, countries, and legal characteristics concerned such as raising money, reducing the cost of capital-raising, leveraging mergers and acquisitions, promoting firm reputation, and expanding product markets (Ragozzino et al. 2017; Chemmanur and He 2011; Bancel and Mittoo 2009; Brau and Fawcett 2006; Hsieh et al. 2011; Pagano et al. 1998). For example, Bancel and Mittoo (2009) showed that US public firms have stronger growth potential than private firms and suggested two reasons for going public: to promote firm reputation and to expand product markets, because an IPO acts as an advertisement that promotes both the firm and product prestige. Pagano et al. (1998) revealed that Italian firms go public to de-leverage or re-balance their financial structure rather than having to finance prospective investment and growth. Rajan (1992) showed that American IPOs may enhance the issuers’ financial capability, their bargaining power with bankers, and accordingly increase their financial credit. Meanwhile, IPOs help issuers raise a large amount of money for their prospective mergers and acquisitions in order to expand business quickly (Brau et al. 2003). Similarly, Hsieh et al. (2011) argued that an IPO is an effective and efficient way to achieve mergers and acquisitions. Based on a database of IPO firms from the UK, Chemmanur and He (2011) found that IPO is a marketing strategy, allowing a firm to expand its product market share or to restrain its industrial competitors and deter new entrants to the industry. Based on these various motivations, it can thus be said that IPO firms spend their IPO capital mainly in three ways: spending on prospective business development, financing mergers and acquisitions for market value, and de-leveraging their debts.
Due to various motivations and different ways of spending post-IPO capital, the three hypotheses below have been formulated.
Hypothesis 1a (H1a).
In order to keep firm growth sustainable, IPO firms spend the majority of IPO money on their main business.
Hypothesis 1b (H1b).
In order to promote stock market performance, IPO firms invest in mergers and acquisitions to maximize their market value.
Hypothesis 1c (H1c).
In order to reduce financial costs, IPO firms use IPO money for their debt repayment and to re-balance their financial structure.
China’s IPO application mechanism is different from those in developed countries. Long and Zhang (2014) documented that the Chinese IPO examination mechanism is affected by administrative factors. IPO candidates have to meet a range of rigorous listing requirements on operating performance, which is assessed by the governmental institution China Securities Regulatory Commission (CSRC), rather than being an exchange. Additionally, Guo and Liu (2020) argued that the CSRC members mainly pay attention to the operating performance of the main business, with particular focus on revenues, profits, and growth potentials. As such, the IPO candidates have to concentrate on their main business development and show their outstanding performance in operating the main business in order to meet the listing requirements. Chen et al. (2010) pointed out that the Chinese entrepreneurial firms have very limited capital resources due to their small credit. However, they step into a new development period after their IPO, so they are able to access more capital and industrial resources from outside for their firm’s further development (Maksimovic and Pichler 2001). Facing this new development opportunity from the stock market, these IPO firms have various options. Because of the different circumstances between the pre- and post-IPO period, these firms accordingly have different strategies for money expenditure.
Furthermore, unlike private firms, public firms are supervised by the CSRC and public investors, and they have to remain transparent in the management of their business. Stulz (2009) showed that information asymmetry between the public firms and their investors may be reduced in a stock market with stringent supervisions and strict listing standards. This finding is in line with results found by Doidge et al. (2004). As a consequence, post-IPO firms have to spend IPO money as a standard but in an efficient manner. As discussed, the second hypothesis is proposed.
Hypothesis 2 (H2).
There are different strategies for money expenditure between the pre- and post-IPO periods.
Lev and Thiagarajan (1993) asserted that capital input and management are significant factors in forecasting a firm’s profits and investment returns. Jiang et al. (2006) showed a positive association between capital input and firm performance, but Titman et al. (2004) found a negative relation between them. That is to say, each company has its different expenditure strategy, which leads to firm performance that is different from others.
Generally speaking, IPO firms have more money to do more things than before such as financing research and design (Liao and Lin 2017), expanding to a new product market (Chemmanur and He 2011), promoting the firm’s reputation (Bancel and Mittoo 2009), and merging quality assets for business expansion (Hsieh et al. 2011). The future firm performance accordingly varies due to these different expenditure approaches. A vast majority of research shows that the more capital is spent on R&D, the more outstanding the firm’s performance is, which implies that capital input into R&D may contribute to a firm’s profit capacity and market value in the future (Liao and Lin 2017; Oriani and Sobrero 2008; Hall and Oriani 2006). Jin et al. (2017) confirmed this point of view. On the other hand, out-performance in firm scale, firm income and profit, and product innovation may attract more capital inputs from outside investors, which consequently promotes the firm’s market value (Pindado et al. 2010; Cannolly and Hirschey 2005) and accordingly, the firm’s access to a virtuous cycle.
On the contrary, inappropriate expenditure approaches with unfavorable IPO motivations may decrease the operating performance of post-IPO firms. Zingales (1995) explained that the IPO purpose for some entrepreneurs is to maximize firm’s market value and then sell out their equities for high returns rather than raise money for further development. Similarly, Ang and Brau (2003) revealed that some entrepreneurs are keen on having their firms go public in order to cash out as quickly as possible. Black and Gilson (1998) suggested that some firms go public at an incorrect time due to the pressures from their early-stage investors who are eager to exit from the projects, which is unfavorable to firm performance. In addition, Jensen (1986) documented that some managers do not have capability to efficiently manage a huge amount of IPO money, and thus spend rashly and even waste the capital when they have no a clear business plan for the future development of the firm. As Jin et al. (2017) documented, the more the new capital is raised by firms through IPO, the worse their operating performance will be. Xu et al. (2020) argued that this kind of phenomenon is very visible in the Chinese stock market, with many IPO firms raising more money than expected. Some Chinese IPO firms even disregard their statements in the IPO prospectus and transit the capital to other purposes after going public. Based on the discussion above, the unfavored expenditure of IPO money may lead to a decrease in firm operating performance. Accordingly, the third hypothesis comes out.
Hypothesis 3 (H3).
Operating performance of post-IPO firms varies in different expenditure approaches.
3. Data
Our database consists of 200 IPO firms from the Growth Enterprise Market of China. In order to examine post-IPO performance sustainability, we collected the time-series data of each firm’s post-IPO operating performance from 2015 to 2019. Panel data were also collected to test IPO significance to firm performance in regression models such as each firm’s income (IN), net profit (NP), total assets (TAst), equities (Eqty) during this period, and its growth rates as well as the dependent variable: IPO volume (IPO). All these kinds of data are publicly available on the official website of the Shenzhen Stock Exchange (http://www.szse.cn/www/disclosure/listed/fixed/ (accessed on 5 April 2021).
Apart from the firms’ endogenous data, exogenous factors that potentially influence the firms’ performance were hand-collected from some official departments such as GDP in the IPO year, industrial sectors (Ind), and firm location (Loc). Both IPO volume and IPO price (IPOP) were collected from the firms’ IPO prospectuses. Investor sentiment (Senti) as measured by the Shanghai stock composite index was gathered from the Shanghai Stock Exchange.
4. Research Framework and Methodology
4.1. Research Framework
This study was conducted in four main steps. Firstly, we investigated whether the IPO money was invested in operating the business. To do so, this study tried to find out where the IPO money went and how the expenditure affected operating performance. Prior research has shown that one of the purposes of the IPO is to raise money for future growth (Bancel and Mittoo 2009) and performance promotion (Ragozzino et al. 2017), while some literature have suggested that the operating performance of IPO firms with large amounts of capital decreases because these firms do not use the money appropriately and even waste it (Jensen 1986). Thus, post-IPO performance may reflect the IPO firms’ capability to manage money.
Secondly, we investigated further how these firms spent money before going public in order to compare the two kinds of operating performance with different expenditure strategies; as Levesque et al. (2012) suggested, firm performance varies depending on the capability of to manage money.
Thirdly, we examined whether the investment returns from sources other than the main business was higher than those from their main business. If IPO firms used IPO money for other investments, this means that these investment projects had attractive profits; otherwise, they would not do so. Lastly, we investigated further whether these investments would increase IPO firms’ market value since according to Brau et al. (2003), public firms are keen on utilizing IPO leverage for mergers and acquisitions to maximize firm value quickly. Therefore, these four steps of analysis would clearly exhibit how the IPO firms manage their IPO money and how this would result in their performance.
4.2. Methodology
4.2.1. Methods for Operating Performance
This study measured operating performance with five indicators, including ROA, ROE, ROS, SOA, and DOA, which have been employed by prior research as seen below.

| Related Literature on Firm Performance Measurements | ||
|---|---|---|
| Indicators | Literature | Measurements |
| ROA | Pastusiak et al. (2016); Peng et al. (2021) | |
| ROE | Pastusiak et al. (2016) | |
| ROS | Alipour and Pejman (2015); Alanazi et al. (2011) | |
| SOA | Alipour and Pejman (2015) | |
| DOA | Ahmed and Bhuyan (2020) | |
As research has shown, there is an association between firm performance and the capability of manage money (Levesque et al. 2012). Following this research, this study employed regression models to investigate what the IPO firms spent on each year in the three years after going public. As mentioned earlier in the discussion for Hypothesis 1, IPO money (IPOV) is usually utilized for three purposes: business development, equity investment, and debt repayment, which can be measured by assets (AST), equity (EQT), and debt (DEBT), respectively. The association among them can be denoted as:
where, IPOV means IPO volume.
Y(IPOi) = f(ASTi,t, EQTi,t, DEBTi,t)
This equation is specified by the regression model below:
To investigate where the IPO money flows, this study, based on Bharat et al. (2013), employed a regression model to explore the relationship between cash flow (CFL) as a dependent variable and the dependent variables. If the cash flowed to AST, this meant that the firm used the majority of its money for daily business operation. If it flowed to EQT, this implied that most of the money was utilized for equity investment rather than the main business. If it went with DEBT, this indicated that the firm utilized the money for its debt repayment. Thus, this study adopted this approach to analyze cash flow each year in the last three years before going public in order to compare the differences of money management strategies between the pre-IPO and post-IPO periods.
Accordingly, this cash flow regression model was developed as follows:
Having the evidence from the two models, this study was able to analyze the differences in operating performance between pre- and post-IPOs, which resulted from the different money management strategies and cash flows.
4.2.2. Methods for Market Value
Brau et al. (2003) suggested that IPO firms like to employ IPO leverage to merge with and acquire other quality assets in order to maximize their firm value quickly. Thus, these IPO firms preferred to spend the majority of their money on EQT for this purpose. On this basis, this study further examined the question of whether this money strategy would work in the Chinese stock market.
A firm’s market value (V) was determined by two key factors: its operating performance (Liao and Lin 2017) and growth potential (Lazar 2016), which can be expressed as follows:
V = f(Perf, Grth)
Perf and Grth stand for operating performance and growth potential, respectively.
The dependent variable V is measured by Tobin’s Q, which has been widely used by prior studies (Singh et al. 2018; Wernerfelt and Montgomery 1988). Following these studies, this paper investigated whether mergers and acquisitions by EQT were able to increase firm market value. Additionally, based on Lazar (2016) and Asimakopoulos et al. (2009), the independent variable (Perf) could be measured by firm assets (TAst), firm scale (Size), net profit (NP), and investment returns (INV); growth potential (Grth) may be calculated by each growth rate of these variables. Meanwhile, market value was also determined by some control variables such as the macro economy as measured by GDP (Espenlaub et al. 2015; Burger et al. 2017) and investor sentiment—SENT (Baker and Wurgler 2007). As a result, a regression model for market value was developed:
where investment returns are calculated by annual cash flow from investments. Investor sentiment (SENT) is computed by annual Shanghai securities composite index on average. This study employed the dimension reduction process by algorithm of ln to ensure the sensibility of the dependent variables to TobQ.
The dependent variable TobQ is calculated by annual market value on average, divided by book value on average. Market value is calculated by annual stock price on average (, multiplied by annual stock volume on average (). The specific formula is expressed as follows:
where t = 0 and t = 1 represent the initial and year-end figures, respectively.
5. Results and Discussions
Table 1 shows the operating performance by industrial sectors in the year before going public and the three years after going public. Overall, these indicators of operating performance overwhelmingly show a descending trend after IPO; in particularly, these profit-related indicators (ROA, ROE, and ROS) declined significantly. ROE declined in total from 0.551 to 0.071, followed by ROS in total, which dropped from 0.215 to 0.091, although it increased in the first IPO year. This under-performance was also observed in SOA, while DOA dropped by half.
Meanwhile, these kinds of performance from different industrial sectors vary. The firms from public utilities (Publ.) showed their sustainability after IPO, particularly in terms of ROS and DOA. IT firms showed a strong growth trend in the first IPO years, but this trend did not remain in the following two years. Unfortunately, the firms from the business service sector (Busi.) lacked growth potential and even deteriorated, especially in ROS (−0.139) with a negative rate in the third year after going public. Noticeably, the bio-medicine firms had a remarkable debt rate (24.56) before their IPO, but this rate was adjusted to a common level and declined in the future. By contrast, the firms from other sectors had an increase in debt rate.
These results indicate that IPO firms obtain large amounts of IPO capital from public investors, but also acquire a certain amount of debt. However, these firms did not spend the money on operating their business because their operating performance declined dramatically. Apart from bio-medicine firms that repaid their debts, where did the capital flow to?
Table 2 accounts for this question. The coefficient (T + 1) of EQT in the first year (0.723) states that the majority of IPO money was utilized by the IPO firms for their mergers and acquisitions, but this contribution decreased in the following years (0.288 and 0.124). This finding is in line with that of Celikyurt et al. (2010), who demonstrated a high incidence of IPO firms pursuing equity investments such as mergers and acquisitions, the average of which was substantially greater than other expenditures.
The DEBT coefficient (0.225) showed that some of the money was used for their debt repayment, which increased to 0.652 and 0.541, respectively, in the next two years. The Sig. value (0.880) of AST shows that there is no significant association between capital expenditure and AST, indicating that these firms spent less money on business development in the first year of going public. However, the coefficient is −0.361 and −0.308, respectively, at very significant sig. levels in the next years, which means that these IPO firms spent less money on business development and even transferred AST money to EQT investment.
Therefore, these results in Table 1 account for the reasons why these IPO firms under-performed. It is because these firms put a lot of money on mergers and acquisitions, but less on business development. These results support the hypothesis H1b and reject H1a and H1c.
Let us look further into the flow of money by industrial sector. Table 3 describes the variations of capital flows in each year of the three years after going public. In terms of equity investment (EQT), IPO firms have over 0.591 growth in general. Particularly, IT firms have the highest rate of 0.76, especially in the first years (T + 1); these firms have a growth rate of 1.22, followed by public utilities (Pub.) with 0.743. Agricultural firms have the lowest rate of 0.218.
In terms of business expenditure (), these IPO firms have the growth rate of 0.448 in total, and this rate decreases dramatically from 0.802 to 0.29 and 0.253 for each of the three years, respectively. This is significantly demonstrated by the firms from the public utility sector, whose rate declined from 0.997 in the first year to 0.285 in the third year. The following sector is the manufacturing sector, with 0.526 in total. On the contrary, firms from the agricultural sector lacked expenditure for the development of the main business, having 0.174 in the first year and −0.164 and −0.361 in the next two years. Remarkably, bio-medicine firms compared to others have sustainable inputs in business development at around 40% for each year of the three years.
As for debt variations (), these firms managed to deleverage their debts from 0.848 to 0.583 after IPO. The firms from the public utility sector had the highest debt rate (0.732) in total, followed by agricultural firms with 0.696. On the contrary, bio-medicine firms generally had the lowest debt rate (0.246).
The analysis above suggests that these IPO firms obtain a certain amount of IPO money along with debt capital. This money is spent on equity investments and debt repayment, while a very limited amount of money is used for business development. However, firms from different industrial sectors have different expenditure strategies. IT and public utility firms prefer to put money on equity investment, while manufacturing and bio-medicine firms focus on business development. These money management strategies do not show that IPO may contribute to operating performance development, which is also shown in Table 1.
How differently do these firms manage their money in the pre- and post-IPO periods?
Table 4 responds to this question. The AST beta for pre-IPO is 1.17, 0.812, and 0.903 at a very significant level (Sig. = 0.000), which means that most of the money flows into AST through the years. This is because these firms spend the majority of their capital on business development to achieve good operating performance in order to meet IPO listing standards. In terms of EQT, there are negative associations between cash flows and EQT investments (Beta −0.056 and −0.10) which means that they reduce EQT investments before going public. This result is different from that observed post-IPO. In terms of BEBT in the years (T − 3, T − 2), there are also negative associations, which then it becomes positive in the last year before its IPO. The evidence shows that these firms rely on debt financing when they lack money for business development, and vice versa. However, a positive association (Beta = 0.012, sig. = 0.762) in the last year (T − 1) shows that some of these firms have access to other kinds of capital, which accordingly provides these firms with more credits for debt financing. Therefore, these firms manage their post-IPO money differently from pre-IPO ones, as most of the money is spent on operating the business before its IPO, but on equity investment after IPO.
How do the money management strategies influence operating performance of firms pre-IPO?
Table 5 accounts for this question. Pre-IPO operating performance by industrial sectors remains sustainable in each indicator. For instance, SOA remains between 0.916 and 1.02, ROE stays at 0.344–0.386, and ROS sustains growth from 0.176 to 0.216, while DOA decreases from 2.11 to 1.74. These kinds of performance are different from those from post-IPO as most indicators perform better than post-IPO ones. For instance, pre-IPO SOA at 0.965 in total is much higher than its post-IPO indicator at 0.165; similarly, Pre-IPO ROE at 0.362 is greater than post-IPO at 0.098, and debt leverage is 1.91, much greater than 0.690. Therefore, the business-dominated expenditure of these firms was better for pre-IPO operating performance than for post-IPO.
As discussed above, post-IPO expenditure contributes less to operating performance; hence, why are these firms keen on equity investments? Do these firms have higher returns from these investments? This study further investigates the profits from the main business in the three years after going public, and investment returns in the five years after IPO (due to the lag of investment return, a longer period is chosen).
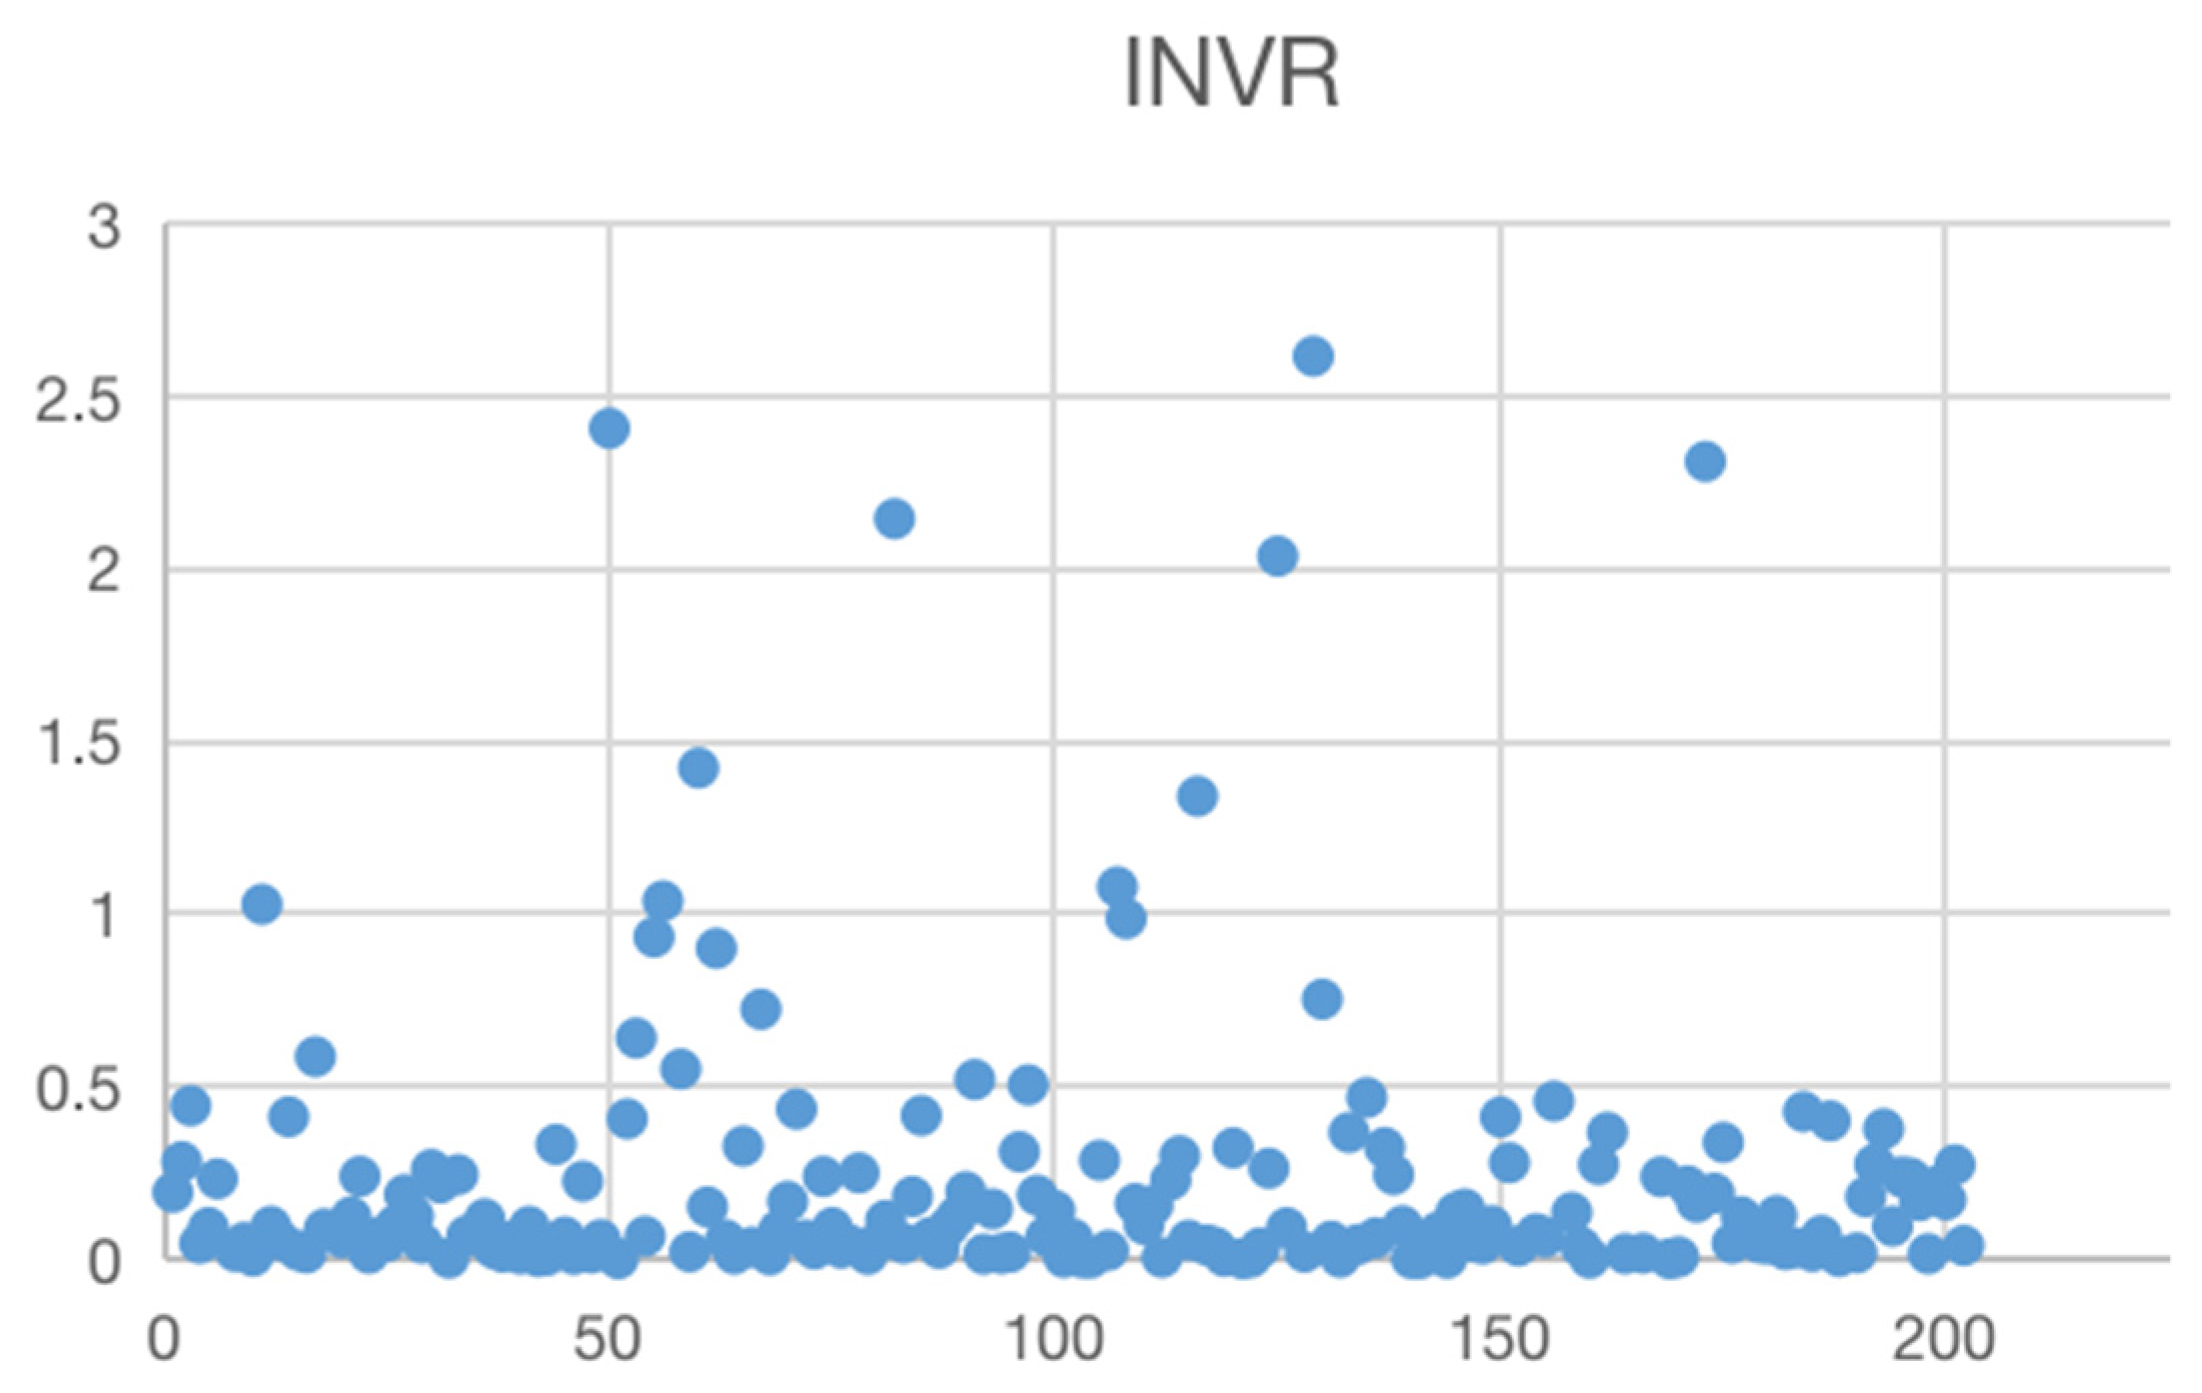
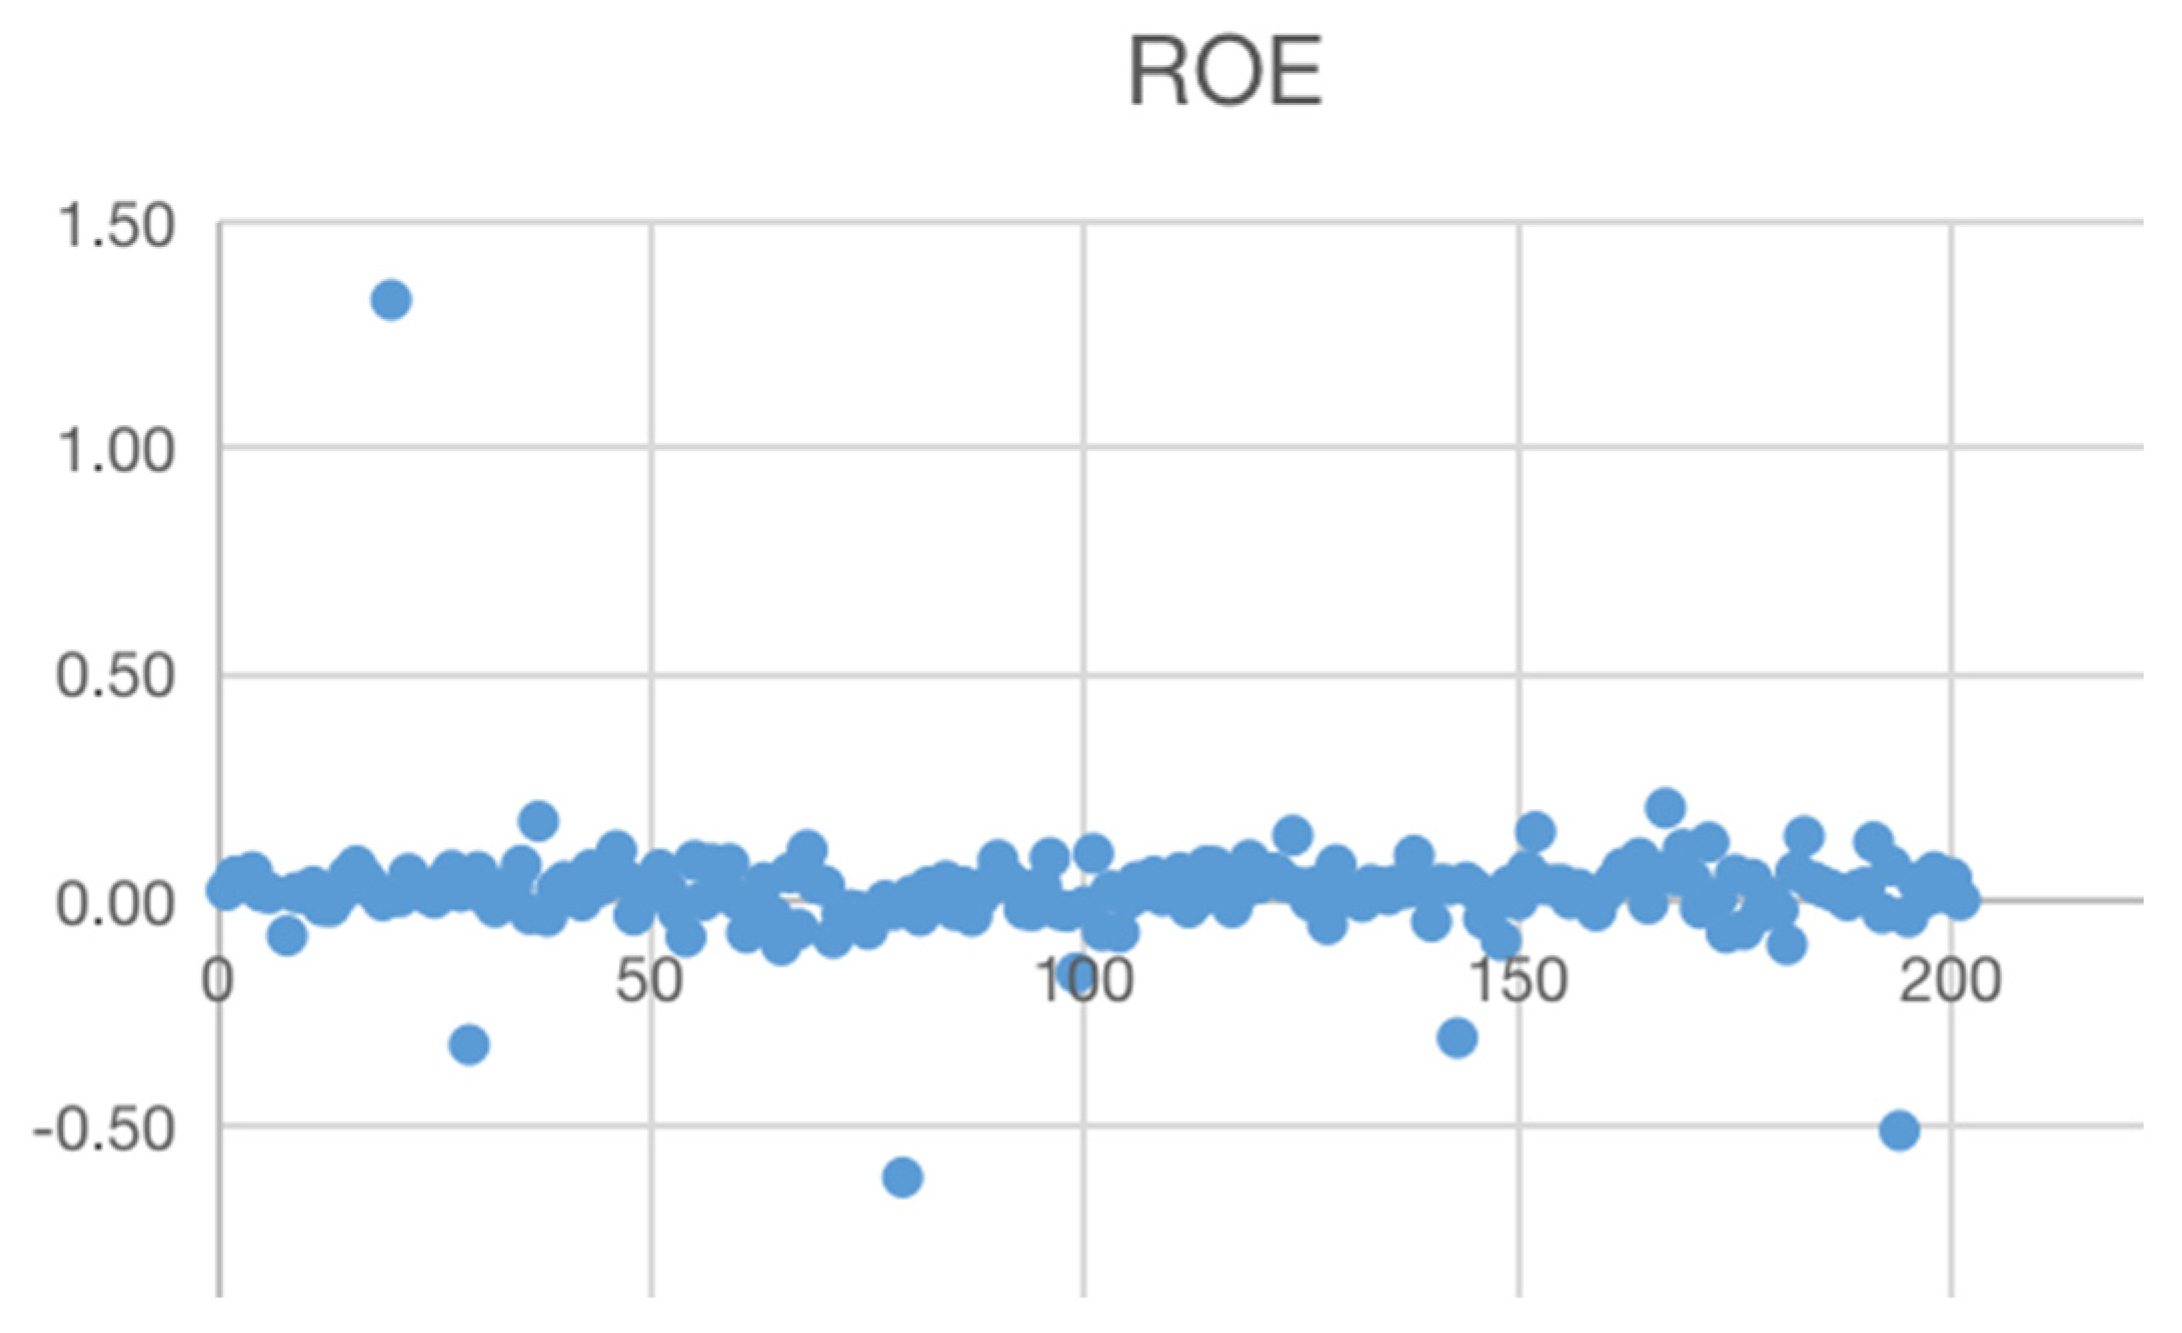
Table 6 shows that annual rate of investment returns on average is 23.7%, much higher than the rate of business profits at 9.8%. A majority of firms have around 9.1% investment return rate, while their business profits are approximately 2.3%. Figure 1 and Figure 2 exhibit the distributions of the two kinds of benefits. Most of the firms distribute at 0–0.5 and even higher in terms of investment returns, whereas most assemble around 0–0.2 in terms of business profits, and some are even in the negative. Therefore, it is understandable why these firms are keen on equity investments.
The main purpose of spending most of the money on equity investment is not only to chase high investment returns, but actually to pursue a huge potential increase of market value. This statement is confirmed by the evidence in Table 7, which shows a positive association between investment performance and market value.
This study selected the two biggest samples of manufacturing and IT firms (other samples were too small to have significance). There was a positive association between INVR3 and TbQ3 in the third year, which means investment performance may contribute to market value significantly. This finding is consistent with prior literature (van Bommel and Vermaelen 2003), which suggested that post-IPO capital expenditures are positively correlated with market performance. This significance is strong with manufacturing firms with a beta coefficient of 0.571, and less with IT firms with a beta coefficient of 0.146. However, this association is not significant in the first two years due to the lagged effect of investment.
Another significant feature is that firm market value is determined by other factors such as investor sentiment (SENT) and GDP. However, there are also firm-specific factors, including firm assets (TAset), firm size (SIZE), net profits (NP), and their growth rates. Therefore, it is understandable why the firms prefer to invest in equity rather than business development.
These findings account for the second question proposed in the introduction, and confirm both hypotheses H2 and H3. A vast majority of the money is used for main business development before IPO, which maintains the growth of operating performance. However, after IPO, most of the money is used for mergers and acquisitions in order to increase market value, resulting in operating performance decline.
IPO motivations vary and include factors such as the rebalancing of financial structures (Mun and Jang 2019), debt repayment (McGuinness 2019), working capital (Ahmad-Zaluki and Badru 2021), and mergers and acquisitions (Hsieh et al. 2011). Our findings suggest that IPO firms have strong motivations to pursue mergers and acquisitions in the first year of going public, but are keen on repaying their debts in the coming two years. Interestingly, Chen et al. (2017) showed that second-time IPO firms, upon returning to the IPO market, have strong motivations to grow and expand through R&D and capital expenditure for the main business, because these two kinds of expenditures benefit firm performance in the long run.
In contrast, the returning IPO firms show significantly lower post-IPO acquisition activity as compared to the first-time IPO firms (Chen et al. 2017), proving that the firms that preferred R&D and capital expenditure have better post-IPO performance than the merger and acquisition-motivated firms, which accounts for our research question of why post-IPO firms’ performance decreases. Another possible reason accounting for the research question was suggested by Jensen (1986), which stated that managers intend to misuse IPO capital.
6. Conclusions
Based on the database of 200 IPO firms from GEMC, this research investigated the reason why the firms’ operating performance decreased three years after going public. It is because these firms preferred to spend their money on the main business to promote operating performance in order to meet listing requirements before IPO. However, they transferred the money to merger equities in order to promote market value quickly after their IPO. These different money strategies resulted in operating performance decline. Another reason was that the investment returns were much higher than business profits, which attracted managers to put more money on equity investments even though it was not sustainable, because operating performance had a very limited contribution to market value. In fact, the significance of promoting market value by equity investments was not as favorable as expected, which shows that these managers lack practical experience in running capitalization projects in emerging markets.
As for the practical implication of this research, IPO firms are advised that only business-based investments can maximize the firm’s market value in long run, otherwise it is unsustainable. The firms’ main business is a basis for their sustainable development in both operating performance and market value.
There are two limitations that come with this paper. The first one is a short period of Tobin’s Q data, as only two years of data were available. It was thus hard to comprehensively investigate firm market value. The second is investigating the research question sampling only from the Growth Enterprise Market of China. Further research is expected to examine the government-involved firms in the Chinese Main-board Stock Market or the Chinese firms listed in overseas stock markets, which should produce some different findings.
Author Contributions
Conceptualization, X.L. and Y.C.; methodology, H.L.; software, Y.C.; validation, Y.C. and X.L.; formal analysis, H.L. and Y.C.; investigation, X.L. and Y.C.; resources, X.L.; data curation, X.L. and Y.C.; writing—original draft preparation, H.L.; writing—review and editing, H.L.; visualization, X. Lin; supervision, H.L.; project administration, H.L.; funding acquisition, H.L. All authors have read and agreed to the published version of the manuscript.
Funding
This research is funded by Wuchang University of Technology.
Institutional Review Board Statement
Not applicable.
Informed Consent Statement
Not applicable.
Conflicts of Interest
The authors declare no conflict of interest.
References
- Ahmad-Zaluki, Nurwati A., and Bazeet Olayemi Badru. 2021. Intended Use of IPO Proceeds and Initial Returns. Journal of Financial Reporting and Accounting 19: 184–210. [Google Scholar] [CrossRef]
- Ahmed, Rafiuddin, and Rafiqul Bhuyan. 2020. Capital Structure and Firm Performance in Australian Service Sector Firms: A Panel Data Analysis. Journal of Risk and Financial Management 13: 214. [Google Scholar] [CrossRef]
- Alanazi, Ahmed S., Benjamin Liu, and John Forster. 2011. The financial performance of Saudi Arabian IPOs. International Journal of Islamic and Middle Eastern Finance and Management 4: 146–57. [Google Scholar] [CrossRef]
- Alipour, Mohammad, and Mohammad Ebrahim Pejman. 2015. The impact of performance measures, leverage and efficiency on market value added: Evidence from Iran. Global Economics and Management Review 20: 6–14. [Google Scholar] [CrossRef]
- Ang, James S., and James C. Brau. 2003. Concealing and Confounding Adverse Signals: Insider Wealth Maximizing Behavior in the IPO Process. Journal of Financial Economics 67: 149–72. [Google Scholar] [CrossRef]
- Asimakopoulos, Loannis, Aristeidis Samitas, and T. Papadogonas. 2009. Firm-specific and Economy Wide Determinants of Firm Profitability: Greek Evidence using Panel Data. Managerial Finance 35: 930–39. [Google Scholar] [CrossRef]
- Baker, Malcolm, and Jeffrey Wurgler. 2007. Investor Sentiment in the Stock Market. Journal of Economic Perspectives 21: 129–52. [Google Scholar] [CrossRef] [Green Version]
- Bancel, Frank, and Usha R. Mittoo. 2009. Why do European Firms Go Public? European Financial Management 15: 844–84. [Google Scholar] [CrossRef]
- Bao, Xiaolu, Sofia Johan, and Kenji Kutsuna. 2016. Do Political Connections Matter in Accessing Capital Markets? Evidence from China. Emerging Markets Review 29: 24–41. [Google Scholar] [CrossRef]
- Bharat, A. Jain, Joanne Li, and Yingying Shao. 2013. Governance, Product Market Competition and Cash Management in IPO Firms. Journal of Banking & Finance 37: 2052–68. [Google Scholar]
- Black, Bernard S., and Ronald J. Gilson. 1998. Venture Capital and the Structure of Capital Markets: Banks versus Stock Markets. Journal of Financial Economics 47: 243–77. [Google Scholar] [CrossRef]
- van Bommel, Jos, and Theo Vermaelen. 2003. Post-IPO Capital Expenditures and Market Feedback. Journal of Banking and Finance 27: 275–305. [Google Scholar] [CrossRef]
- Brau, James C., and Stanley E. Fawcett. 2006. Initial Public Offerings: An Analysis of Theory and Practice. Journal of Finance 61: 399–436. [Google Scholar] [CrossRef]
- Brau, James C., Bill Francis, and Ninon Kohers. 2003. The Choice of IPO versus Takeover: Empirical Evidence. Journal of Business 76: 583–612. [Google Scholar] [CrossRef] [Green Version]
- Burger, Anze, Joze P. Damijan, Crt Kostevc, and Matija Rojec. 2017. Determinants of Firm Performance and Growth during Economic Recession: The Case of Central and Eastern European countries. Economic Systems 41: 569–90. [Google Scholar] [CrossRef] [Green Version]
- Cannolly, Robert A., and Mark Hirschey. 2005. Firm Size and the Effect of R&D on Tobin’s Q. R&D Management 35: 217–23. [Google Scholar]
- Celikyurt, Ugur, Merih Sevilir, and Anil Shivdasani. 2010. Going Public to Acquire? The Acquisition Motivation in IPOs. Journal of Financial Economics 96: 345–63. [Google Scholar] [CrossRef]
- Chemmanur, Thomas J., and Jie He. 2011. IPO Waves, Market Competition, and the Going Public Decision: Theory and Evidence. Journal of Financial Economics 101: 382–412. [Google Scholar] [CrossRef] [Green Version]
- Chen, Gaole, Ninon Sutton, and Jianping Qi. 2017. From Setback to Comeback: Motivations for Withdraw IPO Firms to Return. The Quarterly Review of Economics and Finance 66: 259–64. [Google Scholar] [CrossRef]
- Chen, Xiaohong, Xiaoding Wang, and Desheng Dash Wu. 2010. Credit Risk Measurement and Early Warning of SMEs: An Empirical Study of Listed SMEs in China. Decision Support System 49: 301–10. [Google Scholar] [CrossRef]
- Cumming, Douglas, and Sofia Johan. 2016. Venture’s Economic Impact in Australia. The Journal of Technology Transfer 41: 25–59. [Google Scholar] [CrossRef]
- Doidge, Craig, G. Andrew Karolyi, and Rene M. Stulz. 2004. Why are Foreign Firms Listed in the US: Worth More? Journal of Financial Economics 71: 205–38. [Google Scholar] [CrossRef] [Green Version]
- Espenlaub, Susanne, Arif Khurshed, and Abdulkadir Mohamed. 2015. Venture Capital Exits in Domestic and Cross-Border Investments. Journal of Banking & Finance 53: 215–32. [Google Scholar]
- Gao, Qian, Hai Long, and Jianzhi Zhao. 2021. Are IPO Significant to Firm Performance in an Emerging Stock Market: Evidence from China. South African Journal of Business Management. coming soon. [Google Scholar]
- Gui, Hefa, and Dejian Lai. 2005. IPO and Firm Performance: Theory and Practice Analysis. Contemporary Finance and Economics 243: 29–41. (In Chinese). [Google Scholar]
- Guo, Lihong, and Fengjun Liu. 2020. Relationship with the Listing Commission, Performance Dressing and IPO Examinations. Reform 312: 102–15. (In Chinese). [Google Scholar]
- Hall, Bronwyn H. Hall, and Raffaele Oriani. 2006. Does the Market Value R&D Investment by European Firms? Evidence from a Panel of Manufacturing Firms in France, Germany, and Italy. International Journal of Industrial Organization 24: 971–93. [Google Scholar]
- Hsieh, Jim, Evgeny Lyandres, and Alexei Zhdanov. 2011. A Theory of Merger-driven IPOs. Journal of Financial and Quantitative Analysis 46: 1367–405. [Google Scholar] [CrossRef] [Green Version]
- Jiang, Ching-Hai, Hsiang-Lan Chen, and Yen-Sheng Huang. 2006. Capital Expenditures and Corporate Earnings: Evidence from the Taiwan Exchange. Managerial Finance 32: 853–61. [Google Scholar] [CrossRef]
- Jensen, Michael C. 1986. Agency Costs of Free Cash Flow, Corporate Finance, and Takeovers. American Economic Review 76: 323–29. [Google Scholar]
- Jin, Chuntai, Tianze Li, Steven Xiaofan Zheng, and Ke Zhong. 2017. The New Capital Raised in IPOs. Managerial Finance 43: 966–81. [Google Scholar] [CrossRef]
- Lazar, Sebastian. 2016. Determinants of Firm Performance: Evidence from Romanian Listed Companies. Review of Economic & Business Studies 9: 53–69. [Google Scholar]
- Lev, Baruch, and S. Ramu Thiagarajan. 1993. Fundamental Information Analysis. Journal of Accounting Research 31: 190–215. [Google Scholar] [CrossRef]
- Levesque, Moren, Nitin Joglekar, and Jane Davies. 2012. A Comparison of Revenue Growth at Recent-IPO and Established Firms: The Influence of SG&A, R&D and COGS. Journal of Business Venturing 27: 47–61. [Google Scholar]
- Liao, Tsai-LLing, and Wen-Chun Lin. 2017. Corporate Governance, Product Market Competition, and the Wealth Effect of R&D Spending Changes. Financial Management 46: 717–42. [Google Scholar]
- Long, Hai, and Zhaoyong Zhang. 2014. The Chinese IPO Examination Mechanism Affected by Administrative Factors. Journal of Economic Research 19: 171–96. [Google Scholar]
- Maksimovic, Vojislav, and Pegaret Pichler. 2001. Technological Innovation and IPOs. Review of Financial Studies 14: 459–94. [Google Scholar] [CrossRef]
- McGuinness, Paul B. 2019. Risk Factor and Use of Proceeds Declarations and Their Effects on IPO Subscription, Price Fixings, Liquidity and After-Market Returns. The European Journal of Finance 25: 1122–46. [Google Scholar] [CrossRef]
- Meyer-Stamer, Jorg. 1999. From Industrial Policy to Regional and Local Location Policy: Experience from Santa Catarina/Brazil. Bulletin of Latin American Research 18: 451–68. [Google Scholar] [CrossRef]
- Mikkelson, Wayne H., M. Megan Partch, and Kshitij Shah. 1997. Ownership and Operating Performance of Companies that Go Public. Journal of Financial Economics 44: 281–307. [Google Scholar] [CrossRef]
- Mun, Sung Gyun, and SooCheong Jang. 2019. Restaurant Firms’ IPO Motivations and Post-IPO Performance:Staying Public, Being Delisted or Merged? International Journal of Contemporary Hospitality Management 31: 3484–502. [Google Scholar] [CrossRef]
- Oriani, Rafaele, and Maurizio Sobrero. 2008. Uncertainty and the Market Valuation of R&D within a Real Options Logic. Strategic Management Journal 29: 343–61. [Google Scholar]
- Pagano, Marco, Fabio Panetta, and Luigi Zingales. 1998. Why do Companies Go Public? An Empirical Analysis. Journal of Finance 53: 27–65. [Google Scholar] [CrossRef] [Green Version]
- Pastusiak, Radostaw, Monika Bolek, Maciej Malaczewski, and Marta Kacprzyk. 2016. Company Profitability before and after IPO. Is It a Window Dressing or Equity Dilution Effect? Prague Economic Papers 25: 112–24. [Google Scholar] [CrossRef]
- Peng, Kang-Lin, Hanqin Qiu, Pearl M. C. Lin, and Wai Ching Au. 2021. Ownership Structure and Performance of China’s A-Share-Listed Benchmark Hotels. Journal of China Tourism Research. [Google Scholar] [CrossRef]
- Pindado, Julio, Valdoceu D. Queiroz, and Chabela De La Torre. 2010. How Do Firm Characteristics Influence the Relationship between R&D and Firm Value? Financial Management 39: 757–82. [Google Scholar]
- Ragozzino, Roberto, Kourosh Shafi, and Dane P. Blevins. 2017. The Effect of Pre-IPO Corporate Activity on Newly-public Firms’ Growth. Long Range Planning 51: 219–33. [Google Scholar] [CrossRef]
- Rajan, Raghuram G. 1992. Insiders and Outsiders: The Choice between Informed and Arm’s-length Debt. Journal of Finance 47: 1367–400. [Google Scholar] [CrossRef]
- Singh, Satwinder, Naeem Tabassum, Tamer K. Darwish, and Georgios Batsakis. 2018. Corporate Governance and Tobin’s Q Measure of Organizational Performance. British Journal of Management 29: 171–90. [Google Scholar] [CrossRef] [Green Version]
- Stulz, Rene M. 2009. Securities Laws, Disclosure, and National Capital Markets in The Age of Financial Globalization. Journal of Accounting Research 47: 349–90. [Google Scholar] [CrossRef] [Green Version]
- Titman, Sheridan, K.C. John Wei, and Feixue Xie. 2004. Capital Investments and Stock Returns. Journal of Financial and Quantitative Analysis 39: 677–700. [Google Scholar] [CrossRef] [Green Version]
- Wernerfelt, Birger, and Cynthia A. Montgomery. 1988. Tobin’s q and the Importance of Focus in Firm Performance. The American Economic Review 78: 246–50. [Google Scholar]
- Xu, Hui, Bing Zhou, and Xiaohua Zhou. 2020. Over-raising IPO Capital and Research and Development: Advantages or Disadvantages? Business Research 62: 36–44. (In Chinese). [Google Scholar]
- Zingales, Luigi. 1995. Insider Ownership and the Decision to Go Public. Review of Economic Studies 62: 425–48. [Google Scholar] [CrossRef]
Figure 1.
Distribution of investment returns.

Figure 2.
Distribution of main business profits.

Table 1.
Statistics of pre- and post-IPO operating performance by industrial sectors.
| Test Value = 0 | ||||||||
|---|---|---|---|---|---|---|---|---|
| Indexes | Years | Bio. | Busi. | IT | Manu. | Publ. | Total | Sig. (2-Tailed) |
| ROA | T − 1 | 0.152 | 0.122 | 0.174 | 0.191 | 0.136 | 0.180 | 0.000 |
| T + 1 | 0.074 | 0.022 | 0.417 | 0.036 | 0.044 | 0.119 | 0.149 | |
| T + 2 | 0.051 | 0.028 | 0.036 | 0.039 | 0.040 | 0.036 | 0.000 | |
| T + 3 | 0.058 | 0.011 | 0.025 | 0.036 | 0.154 | 0.042 | 0.000 | |
| ROE | T − 1 | 0.255 | 0.281 | 10.39 | 0.310 | 0.286 | 0.551 | 0.042 |
| T + 1 | 0.115 | 0.038 | 0.603 | 0.048 | 0.086 | 0.171 | 0.156 | |
| T + 2 | 0.079 | 0.059 | 0.047 | 0.059 | 0.079 | 0.053 | 0.000 | |
| T + 3 | 0.088 | 0.025 | 0.037 | 0.052 | 0.464 | 0.071 | 0.000 | |
| ROS | T − 1 | 0.211 | 0.184 | 0.218 | 0.227 | 0.154 | 0.215 | 0.000 |
| T + 1 | 0.188 | 0.042 | 1.10 | 0.090 | 0.115 | 0.311 | 0.145 | |
| T + 2 | 0.156 | 0.084 | 0.111 | 0.111 | 0.115 | 0.104 | 0.000 | |
| T + 3 | 0.145 | −0.139 | 0.061 | 0.074 | 0.365 | 0.091 | 0.003 | |
| SOA | T − 1 | 0.713 | 0.900 | 0.882 | 0.874 | 0.861 | 0.911 | 0.000 |
| T + 1 | 0.477 | 0.294 | 0.339 | 0.381 | 0.390 | 0.371 | 0.000 | |
| T + 2 | 0.392 | 0.264 | 0.311 | 0.418 | 0.359 | 0.394 | 0.000 | |
| T + 3 | 0.437 | 0.296 | 0.414 | 0.434 | 0.375 | 0.433 | 0.000 | |
| DOA | T − 1 | 24.56 | 0.533 | 0.346 | 0.442 | 0.527 | 1.53 | 0.161 |
| T + 1 | 0.658 | 0.513 | 0.419 | 0.641 | 0.960 | 0.587 | 0.000 | |
| T + 2 | 0.731 | 0.822 | 0.599 | 0.686 | 0.970 | 0.698 | 0.000 | |
| T + 3 | 0.516 | 0.849 | 0.595 | 0.854 | 1.58 | 0.785 | 0.106 | |
Table 2.
Statistics of IPO capital expenditure.
| T + 1 | T + 2 | T + 3 | |||||||
|---|---|---|---|---|---|---|---|---|---|
| Standardized Coefficients | t | Sig. | Standardized Coefficients | t | Sig. | Standardized Coefficients | t | Sig. | |
| Beta a | Beta a | Beta a | |||||||
| (Constant) | 0.627 | 0.532 | 1.602 | 0.111 | 3.020 | 0.003 | |||
| EQT | 0.723 | 14.417 | 0.000 | 0.288 | 4.103 | 0.000 | 0.124 | 1.342 | 0.181 |
| AST | −0.015 | −0.151 | 0.880 | −0.361 | −2.383 | 0.018 | −0.308 | −3.738 | 0.000 |
| DEBT | 0.225 | 2.190 | 0.030 | 0.652 | 4.243 | 0.000 | 0.541 | 4.897 | 0.000 |
| Adjusted R2 | 0.670 | 0.273 | 0.287 | ||||||
| ANOVA | 0.000 | 0.000 | 0.000 | ||||||
| No. 200 | |||||||||
a. dependent variable: IPOV.
Table 3.
Statistics of variations in EQT, AST, and DEBT in the three years after going public.
| IND. | T + 1 | T + 2 | T + 3 | Mean | T + 1 | T + 2 | T + 3 | Mean | T + 1 | T + 2 | T + 3 | Mean |
|---|---|---|---|---|---|---|---|---|---|---|---|---|
| Agr. | 0.108 | 0.068 | 0.477 | 0.218 | 0.174 | −0.164 | −0.361 | −0.117 | 1.46 | −0.114 | 0.742 | 0.696 |
| Bio. | 0.129 | 0.462 | 0.129 | 0.240 | 0.390 | 0.427 | 0.411 | 0.409 | −0.003 | 0.278 | 0.462 | 0.246 |
| Busi. | 0.454 | 0.488 | −0.002 | 0.313 | 0.293 | 0.429 | 0.169 | 0.297 | 0.806 | 0.500 | 0.744 | 0.683 |
| IT | 1.22 | 0.423 | 0.637 | 0.760 | 0.617 | 0.129 | 0.243 | 0.330 | 0.822 | 0.376 | 0.430 | 0.543 |
| Manu. | 0.360 | 0.762 | 0.242 | 0.454 | 0.953 | 0.326 | 0.298 | 0.526 | 0.928 | 0.659 | 0.407 | 0.665 |
| Pub. | 0.623 | 0.814 | 0.793 | 0.743 | 0.997 | 0.496 | 0.285 | 0.593 | 0.998 | 0.946 | 0.251 | 0.732 |
| Total | 0.548 | 0.637 | 0.589 | 0.591 | 0.802 | 0.290 | 0.253 | 0.448 | 0.848 | 0.561 | 0.583 | 0.664 |
| N | 135 | 152 | 178 | 135 | 152 | 178 | 135 | 152 | 178 | |||
Table 4.
Statistics of cash flow of pre-IPO firms.
| T − 3 | T − 2 | T − 1 | |||||||
|---|---|---|---|---|---|---|---|---|---|
| Model | Standardized Coefficients | t | Sig. | Standardized Coefficients | t | Sig. | Standardized Coefficients | t | Sig. |
| Beta a | Beta b | Beta c | |||||||
| (Constant) | 0.830 | 0.408 | 1.530 | 0.128 | 2.562 | 0.011 | |||
| AST | 1.17 | 10.02 | 0.000 | 0.812 | 11.106 | 0.000 | 0.903 | 19.366 | 0.000 |
| DEBT | −0.658 | −2.88 | 0.004 | −0.055 | −0.881 | 0.379 | 0.012 | 0.303 | 0.762 |
| EQT | 0.411 | 2.78 | 0.006 | −0.056 | −0.952 | 0.342 | −0.100 | −2.167 | 0.031 |
| Adjusted R2 | 0.826 | 0.548 | 0.719 | ||||||
| ANOVA | 0.000 | 0.000 | 0.000 |
a. Dependent Variable: Cash Flow (T − 3), b. Dependent Variable: Cash Flow (T − 2), c. Dependent Variable: Cash Flow (T − 1).
Table 5.
Comparisons of operating performance between pre-IPO and post-IPO, by sector.
| IND. | SOA | ROS | DOA(LEV) | ROE | ||||||||||||
|---|---|---|---|---|---|---|---|---|---|---|---|---|---|---|---|---|
| Pre-IPO Operating Performance | ||||||||||||||||
| T − 3 | T − 2 | T − 1 | Mean | T − 3 | T − 2 | T − 1 | Mean | T − 3 | T − 2 | T − 1 | Mean | T − 3 | T − 2 | T − 1 | Mean | |
| Agr. | 0.639 | 0.714 | 0.805 | 0.719 | 0.181 | 0.212 | 0.201 | 0.198 | 1.71 | 1.73 | 1.61 | 1.68 | 0.198 | 0.261 | 0.260 | 0.240 |
| Bio. | 0.784 | 0.794 | 0.761 | 0.779 | 0.148 | 0.210 | 0.211 | 0.189 | 2.34 | 1.93 | 1.79 | 2.02 | 0.272 | 0.322 | 0.287 | 0.293 |
| Busi. | 1.10 | 0.942 | 0.900 | 0.980 | 0.182 | 0.191 | 0.184 | 0.185 | 2.53 | 2.60 | 2.33 | 2.48 | 0.507 | 0.468 | 0.386 | 0.453 |
| IT | 1.27 | 1.41 | 0.882 | 1.19 | 0.187 | 0.203 | 0.218 | 0.202 | 1.79 | 1.59 | 1.53 | 1.63 | 0.425 | 0.455 | 0.294 | 0.391 |
| Manu. | 0.813 | 0.870 | 0.878 | 0.853 | 0.180 | 0.204 | 0.228 | 0.204 | 2.12 | 1.93 | 1.75 | 1.93 | 0.310 | 0.343 | 0.350 | 0.334 |
| Publ. | 1.06 | 1.09 | 0.861 | 1.00 | 0.127 | 0.159 | 0.154 | 0.146 | 2.75 | 1.98 | 2.21 | 2.31 | 0.370 | 0.343 | 0.293 | 0.335 |
| Total | 0.959 | 1.02 | 0.916 | 0.965 | 0.176 | 0.200 | 0.216 | 0.197 | 2.11 | 1.89 | 1.74 | 1.91 | 0.356 | 0.386 | 0.344 | 0.362 |
| Post-IPO Operating Performance | ||||||||||||||||
| T + 1 | T + 2 | T + 3 | Mean | T + 1 | T + 2 | T + 3 | Mean | T + 1 | T + 2 | T + 3 | Mean | T + 1 | T + 2 | T + 3 | Mean | |
| Agr. | 0.401 | 0.547 | 0.501 | 0.483 | −0.090 | −0.143 | 00.11 | −0.041 | 0.603 | 0.793 | 0.711 | 0.702 | −0.038 | −0.131 | 0.014 | −0.052 |
| Bio. | 0.477 | 0.392 | 0.437 | 0.435 | 0.188 | 0.156 | 0.145 | 0.163 | 0.658 | 0.731 | 0.516 | 0.635 | 0.115 | 0.079 | 0.088 | 0.094 |
| Busi. | 0.294 | 0.264 | 0.296 | 0.285 | 0.042 | 0.084 | −0.139 | −0.004 | 0.513 | 0.822 | 0.849 | 0.728 | 0.038 | 0.059 | 0.025 | 0.041 |
| IT | 0.339 | 0.311 | 0.414 | 0.355 | 0.109 | 0.111 | 0.061 | 0.094 | 0.419 | 0.599 | 0.595 | 0.538 | 0.603 | 0.047 | 0.037 | 0.229 |
| Manu. | 0.381 | 0.418 | 0.434 | 0.411 | 0.090 | 0.111 | 0.074 | 0.092 | 0.641 | 0.686 | 0.854 | 0.727 | 0.048 | 0.059 | 0.052 | 0.053 |
| Publ. | 0.390 | 0.359 | 0.375 | 0.375 | 0.115 | 0.115 | 0.365 | 0.198 | 0.960 | 0.970 | 10.59 | 1.17 | .086 | 0.079 | 0.464 | 0.210 |
| Total | 0.371 | 0.053 | 0.071 | 0.165 | 0.311 | 0.104 | 0.091 | 0.169 | 0.587 | 0.698 | 0.785 | 0.690 | 0.171 | 0.053 | 0.071 | 0.098 |
Table 6.
Comparisons of investment returns and business profits on average.
| Investment return (INVR) is measured by cash inflow of investment in five years, which may be calculated by the rate of the average amount of cash inflow divided by IPO volume (IPOV). It is expressed as: | ||||||||||
| Investment Returns on Average | Business Profits on Average | |||||||||
| IND. | Mean | Median | Min. | Max. | Sig. (2-tailed) | Mean | Median | Min. | Max. | Sig. (2-tailed) |
| Agr. | 0.057 | 0.044 | 0.010 | 0.116 | 0.020 | −0.052 | −0.030 | −0.319 | −0.000 | 0.048 |
| Bio. | 0.392 | 0.190 | 0.004 | 2.31 | 0.023 | 0.094 | 0.034 | −0.097 | 0.128 | 0.035 |
| Busi. | 0.100 | 0.054 | 0.003 | 0.326 | 0.030 | 0.041 | −0.019 | −0.612 | 0.036 | 0.050 |
| IT | 0.285 | 0.094 | 0.000 | 2.40 | 0.001 | 0.229 | 0.018 | −0.098 | 10.32 | 0.000 |
| Manu. | 0.227 | 0.086 | 0.000 | 2.61 | 0.000 | 0.053 | 0.026 | −0.509 | 0.204 | 0.000 |
| Publ. | 0.151 | 0.093 | 0.030 | 0.434 | 0.003 | 0.210 | 0.027 | −0.015 | 0.175 | 0.010 |
| Total | 0.237 | 0.091 | 0.000 | 2.61 | 0.000 | 0.098 | 0.023 | −0.612 | 1.33 | 0.027 |
Table 7.
Investment contributions to market value of manufacturing and IT firms in the three years after IPO.
Table 7.
Investment contributions to market value of manufacturing and IT firms in the three years after IPO.
| Models | Standardized Coefficients | ||||||
|---|---|---|---|---|---|---|---|
| Manu. | IT | ||||||
| Beta | t | Sig. | Beta | t | Sig. | ||
| 1 a | (Constant) | −0.612 | 0.543 | −1.262 | 0.222 | ||
| INVR1 | 0.157 | 0.367 | 0.715 | −0.678 | −1.731 | 0.100 | |
| SENTI | 0.182 | 1.529 | 0.131 | 0.402 | 1.882 | 0.075 | |
| GDP1 | 0.158 | 1.291 | 0.201 | 0.429 | 2.174 | 0.043 | |
| TAset1 | −0.090 | −0.552 | 0.583 | −0.414 | −1.424 | 0.171 | |
| TAsetGrth1 | −0.059 | −0.442 | 0.660 | −0.181 | −0.989 | 0.335 | |
| SIZE1 | −0.222 | −0.486 | 0.628 | 0.684 | 1.530 | 0.143 | |
| SizeGrth1 | 0.006 | 0.048 | 0.962 | 0.274 | 1.221 | 0.237 | |
| NP1 | −0.132 | −1.084 | 0.282 | −0.157 | −0.721 | 0.480 | |
| NPGrth1 | −0.042 | −0.303 | 0.763 | −0.249 | −0.974 | 0.342 | |
| Adjusted R2 | 0.008 | 0.318 | |||||
| 2 b | |||||||
| (Constant) | −1.486 | 0.142 | −10.786 | 0.087 | |||
| INVR2 | −0.037 | −0.425 | 0.672 | −0.034 | −0.137 | 0.892 | |
| SENT2 | 0.556 | 6.034 | 0.000 | 0.725 | 60.383 | 0.000 | |
| GDP2 | 0.078 | 0.830 | 0.409 | 0.099 | 0.880 | 0.388 | |
| TAset2 | −0.287 | −1.763 | 0.082 | −0.416 | −10.380 | 0.180 | |
| TAsetGrth2 | 0.103 | 1.100 | 0.275 | −0.157 | −10.261 | 0.219 | |
| SIZE2 | 0.047 | 0.269 | 0.789 | 0.131 | 0.469 | 0.643 | |
| SizeGrth2 | 0.060 | 0.664 | 0.509 | 0.215 | 10.179 | 0.250 | |
| NP2 | −0.039 | −0.301 | 0.764 | 0.187 | 0.781 | 0.442 | |
| NPGrth2 | −0.013 | −0.139 | 0.889 | −0.043 | −0.330 | 0.744 | |
| Adjusted R2 | 0.393 | 0.660 | |||||
| 3 c | |||||||
| (Constant) | −1.365 | 0.176 | −10.206 | 0.237 | |||
| INVR3 | 0.571 | 1.318 | 0.191 | 0.146 | 0.683 | 0.499 | |
| SENT3 | 0.631 | 7.566 | 0.000 | 0.586 | 40.311 | 0.000 | |
| GDP3 | 0.110 | 1.372 | 0.173 | 0.132 | 10.070 | 0.293 | |
| TAset3 | −0.361 | −1.856 | 0.067 | −0.303 | −0.962 | 0.343 | |
| TAsetGrth3 | 0.070 | 0.690 | 0.492 | 0.120 | 0.705 | 0.486 | |
| SIZE3 | −0.397 | −0.880 | 0.381 | 0.080 | 0.310 | 0.758 | |
| SizeGrth3 | −0.197 | −2.035 | 0.045 | −0.145 | −0.790 | 0.436 | |
| NP3 | −0.145 | −1.359 | 0.177 | −0.126 | −0.632 | 0.532 | |
| NPGrth3 | 0.064 | 0.790 | 0.431 | −0.117 | −0.944 | 0.352 | |
| Adjusted R2 | 0.442 | 0.462 | |||||
a. Dependent Variable: TobQ1; b. Dependent Variable: TobQ2; c. Dependent Variable: TobQ3.
Publisher’s Note: MDPI stays neutral with regard to jurisdictional claims in published maps and institutional affiliations. |
© 2021 by the authors. Licensee MDPI, Basel, Switzerland. This article is an open access article distributed under the terms and conditions of the Creative Commons Attribution (CC BY) license (https://creativecommons.org/licenses/by/4.0/).
Share and Cite
MDPI and ACS Style
Long, H.; Lin, X.; Chen, Y. Why the Operating Performance of Post-IPO Firms Decreases: Evidence from China. J. Risk Financial Manag. 2021, 14, 424. https://0-doi-org.brum.beds.ac.uk/10.3390/jrfm14090424
AMA Style
Long H, Lin X, Chen Y. Why the Operating Performance of Post-IPO Firms Decreases: Evidence from China. Journal of Risk and Financial Management. 2021; 14(9):424. https://0-doi-org.brum.beds.ac.uk/10.3390/jrfm14090424
Chicago/Turabian StyleLong, Hai, Xiaochen Lin, and Yu Chen. 2021. "Why the Operating Performance of Post-IPO Firms Decreases: Evidence from China" Journal of Risk and Financial Management 14, no. 9: 424. https://0-doi-org.brum.beds.ac.uk/10.3390/jrfm14090424