
The Impact of Oil Price Shocks on Oil-Dependent Countries’ Currencies: The Case of Azerbaijan and Kazakhstan


1
Department of Econometrics and Statistics, Institute of Economics and Finance, Warsaw University of Life Science, Nowoursynowska 166, 02-787 Warsaw, Poland
2
Institute of Finance and International Economic Relations, Doctoral School in Economics, University of Szeged, Kálvária Sgt. 1, 6722 Szeged, Hungary
3
Centre for Studies on European Economy (AIM), Azerbaijan State University of Economics (UNEC), Istiglaliyyet Str. 6, Baku 1001, Azerbaijan
*
Author to whom correspondence should be addressed.
J. Risk Financial Manag. 2021, 14(9), 431; https://0-doi-org.brum.beds.ac.uk/10.3390/jrfm14090431
Submission received: 28 July 2021
/
Revised: 3 September 2021
/
Accepted: 4 September 2021
/
Published: 9 September 2021
(This article belongs to the Special Issue Energy Economics, Finance and Sustainability)
Abstract
:The paper aims to assess the relationship between Azerbaijani and Kazakhstani exchange rates and crude oil prices volatility. The study applies the structural vector autoregressive (SVAR) model. The paper concentrates on Azerbaijan and Kazakhstan, the post-Soviet countries considered as some of the most oil-dependent countries in the Caspian Sea region. The impulse response functions suggest that the rise of crude oil prices is associated with the exchange rates decrease and thus with an Azerbaijani manat and Kazakhstani tenge appreciation against the U.S. dollar. Moreover, the results suggest that an oil price increase leads to the rise of Azerbaijani international reserves. However, the results are insignificant for the Kazakhstani foreign exchange reserves. Additionally, the study reveals a negative and significant relationship between crude oil prices and USD/KZT in both pre-crisis and the COVID-19 crisis periods. We reveal that the correlation has been stronger during the COVID-19 pandemic. However, the relationship is not significant in the case of the Azerbaijani manat. The USD/AZN exchange rate has been stable since 2017, and the first phase of the COVID-19 pandemic has not caused a change in the exchange rate and a weakening of the Azerbaijani currency, despite significant drops in crude oil prices.
1. Introduction
Crude oil plays a significant role in the economic development of countries all over the world. Oil price volatility affects the exchange rates of oil-importing and oil-exporting countries. There are two main approaches in theory on this issue. The first approach is related to the wealth transfer and assumes that the oil prices affect exchange rates through a reallocation of wealth between oil-exporting and oil-importing countries (Golub 1983; Krugman 1983). An oil prices increase leads to a wealth transfer from oil importers to oil exporters. It may trigger the depreciation of the currencies of oil importers and appreciation of the oil exporters’ currencies when the oil importer demand for oil is inelastic (Golub 1983). According to Krugman (1983), the relationship between oil prices and exchange rates may be either positive or negative. The sign depends on the countries’ trade balance, trade elasticities, capital flows, and the scale of speculative transactions in the financial market. The second approach is related to the transmission channel and assumes that the oil prices affect exchange rates through the terms of trade (Chen and Rogoff 2003; Chen and Chen 2007). Chen and Chen (2007) show that, for G7 countries’ exchange rates related to the U.S. dollar, the increase in oil prices decreases the real exchange rates in the long run. This stems from the fact that the increase in real oil prices may increase the prices of tradable goods relative to non-tradable goods in both the domestic countries and the USA. If the domestic country is more dependent on imported oil than the USA, the increase of tradables to non-tradables prices ratio may exceed the ratio in the USA and thus leads to depreciation of the domestic currency against the U.S. dollar.
According to Adam Smith and David Ricardo, countries rich with natural resources perform economically better than those without natural resources (Letiche 1960). This theory was questioned in the late 1970s when the so-called Dutch desease was found to have occurred. The term was introduced in 1977 by “The Economist” and described the crisis in the Netherland driven by discoveries of vast gas deposits in the North Sea in 1959 (Badeeb et al. 2017). Corden and Neary (1982) and Corden (1984) were the first researchers that presented the Dutch disease phenomenon. The phenomenon applies to all negative effects driven by resource discoveries such as factor reallocations and deindustralisation (Magud and Sosa 2013). Furthermore, Dutch disease is often characterised by the substantial appreciation of the resource-rich country’s currency.
The paper focuses on the relationship between oil price and exchange rates of oil net-exporting countries. Lizardo and Mollick (2010) find that oil price changes significantly affect net oil-exporter currencies’ value. They show that the currencies of Canada, Mexico, and Russia appreciated against the U.S. dollar due to rising oil prices. Akram (2004) examines the relationship between oil prices and Norwegian exchange rates. He reports a significant impact of an oil price increase on the Norwegian currency’s appreciation. Chen et al. (2016), based on the monthly data for 16 OECD countries, show that the U.S. dollar exchange rates response to oil price shocks depend on whether oil price changes result from changes in supply or demand. Volkov and Yuhn (2016) find that the reaction of exchange rates to oil price changes depends more on financial market efficiency than on the relevance of oil revenues in the economy. Malik and Umar (2019) find that oil price shocks driven by demand changes and risk significantly affect exchange rates volatility. They conduct their research on currencies of major oil-exporting and oil-importing countries such as the Brazilian Real, Canadian Dollar, Chinese Yuan, Indian Rupee, Japanese Yen, Mexican Peso, and Russian Ruble. Moreover, they show that the strength of the relationship between oil price shocks and exchange rates has significantly increased since the global financial crisis. Reboredo (2012) shows that the relationship between oil prices and exchange rates is stronger for oil-exporting countries than oil-importing ones. Furthermore, he reveals that the co-movement is rather weak in pre-crisis periods and stronger in crisis periods.
Driven by the global financial crisis (2008–2009), sharp oil price decreases in the international commodity market (2014–2015), the COVID-19 pandemic outbreak, and conflicts over oil prices, the oil revenue decreases have challenged the monetary system of oil-dependent countries. This paper focuses on the exchange rate of oil-exporting countries from the Caspian Sea region. The region is one of the oldest oil-producing areas in the world. Kazakhstan, Russia, Azerbaijan, Iran, and Turkmenistan share the shores of the Caspian Sea. The paper concentrates on Azerbaijan and Kazakhstan, the post-Soviet countries considered as some of the region’s most oil-dependent countries (Czech 2018).
Bresser-Pereira (2013) argue that the exchange rate affects the national economy more than other macroeconomic variables such as the interest rate, profit rate, wage rate, and inflation. According to a Center for Economic and Social Development (CESD 2019) study on Azerbaijan, Russia, and Kazakhstan, oil price shocks in 2015 substantially hampered these countries’ economic growth, mainly through the exchange rate channel. Aleksandrova (2016) has noted that, during the collapse of oil prices, the economies of Azerbaijan, Kazakhstan, Turkmenistan, and Russia underperformed from a macroeconomic perspective compared to during the oil boom period.
Oil prices heavily impact the leading macroeconomic indicators in Azerbaijan (Humbatova et al. 2019; Niftiyev and Namazova 2020). Several papers study the Dutch disease phenomenon in Azerbaijan (Gahramanov and Fan 2002; Bayramov and Conway 2010; Hasanov 2013). Oil price fluctuations affect the Azerbaijani economy mainly through the exchange rate channel. Hasanov (2010) studies the impact of oil price changes on the value of Azerbaijani currency and finds that the real effective exchange rate of the Azerbaijani manat appreciates by approximately 0.7 percentage points when there is a one percentage point increase in oil prices.
Like other post-Soviet resource-rich economies, Kazakhstan experienced a transition from a command economy and built its economy on extractive industriies since gaining independence. Kazakhstan achieved fast growth and improved competitiveness around 2010 (Macerinskiene and Sakhanova 2011), implemented substantial financial sector reforms (Akimov and Dollery 2008), and reduced poverty as government revenue increased thanks to increased oil extraction and mineral revenues (Agrawal 2007). Economic prosperity was resource-based, as mineral exports increased and high oil prices provided a golden opportunity to recover from the collapsed economy and policy errors (Pomfret 2005). As in the case of Azerbaijan, this led to a situation where oil prices extensively influenced the national economy, which indicates a dependency on external economic conditions and oil-led economic growth (Petrenko et al. 2016).
Gronwald et al. (2009) documented a strong, negative, and significant relationship between oil price decreases and macroeconomic variables in the Kazakhstani economy. Similar results were found in the paper of Kose and Baimaganbetov (2015). As a result, the Dutch disease hypothesis in the Kazakhstani economy was intensively studied by Kutan and Wyzan (2005), Egert and Leonard (2008), and Aliev (2015). Dikkaya and Doyar (2017) illustrated a one-way causality from oil prices to the exchange rate and unidirectional causality from the exchange rate to GDP in Kazakhstan. In this case, the authors evaluated the freely floating exchange rate regime that the Kazakhstani government had started to apply since 2015 to optimise and stabilise monetary policy. Moreover, Kretzschmar and Nurmakhanova (2010) find that oil prices directly impacted the exchange rate in Kazakhstan but indirectly influenced real GDP.
The paper aims to assess the relationship between Azerbaijani and Kazakhstani exchange rates, international reserves, and crude oil prices. Our contribution is that by applying the structural vector autoregressive models, we assessed the reaction of Azerbaijani and Kazakhstani exchange rates to oil price and international reserves changes. There is still little research in the literature on the effect of oil price changes on the Caspian Sea region’s most oil-dependent economies. In addition, similarly to Reboredo (2012), we used Spearman’s rank correlation coefficient to test the relationship between oil price and exchange rate changes during the pre-crisis and crisis period. However, in contrast to most similar studies, we conducted the research, not for the global financial crisis 2008–2009 but for another crisis period, i.e., the COVID-19 pandemic. The paper is organised as follows. Section 2 describes methods and data applied in the study. Section 3 presents research results. Section 4 summarises and concludes.
2. Materials and Methods
The initial graphical analysis was carried out based on the monthly data from January 2000 to May 2020. Monthly spot exchange rates of Kazakhstan tenge to U.S. dollar (USD/KZT) and Azerbaijani manat to U.S. dollar (USD/AZM) were applied as the country’s official nominal exchange rates data. Monthly WTI crude oil prices (in USD per bushel) were used as the oil prices in the model. Data were obtained from Refinitiv Datastream. Additionally, the analysis includes monthly data about the international reserves, excluding gold held by the central bank in Azerbaijan and Kazakhstan. Data on international reserves were obtained from Macrobond. We checked data stationarity based on the Augmented Dickey–Fuller test.
The quantitative analysis was carried out for monthly data from December 2015, i.e., when both countries officially changed the currency system to floating, until May 2020. The end of the time frame results from the availability of data on foreign exchange reserves. We applied the structural vector autoregressive (SVAR) model to study the relationship between the crude oil prices and the value of Azerbaijani and Kazakhstani currencies. Following Sims (1980), the SVAR models have been applied by many researchers. Aleisa and Dibooĝlu (2002), Benhabib et al. (2014), Brahmasrene et al. (2014), Obioma, and Eke Charles (2015) among others use the SVAR model to study the relationship between oil prices and exchange rates of oil-exporting and oil-importing countries. The general form of the SVAR model is as follows:
where is a vector of model variables, are the model’s coefficients, and is a serially uncorrelated error term. The reduced form corresponding to the structural from (1) was obtained by pre multiplying with :
Model (2) can be represented by:
where , and . To identify the structural form parameters, restrictions were placed on the parameter matrices. It was assumed that the shocks affect a subset of variables directly within the current period, while another subset of variables is affected with a time lag only. Sims (1980) proposed recursive (triangular) identification, one of the most popular identification schemes. In the recursive identification, we assumed that the shocks enter the equations successively so that the additional shocks of the equation do not affect the variable explained by the first equation simultaneously (Lütkepohl and Krätzig 2004). The order of endogenous variables determines the connection between innovations. Usually, we place the variable by the timeline of its occurrence. A variable that is assumed to occur first is set first in the vector of endogenous variables. Here, we placed oil prices as a first variable. Then, we assumed that oil shocks affect foreign exchange reserves, and USD/AZN and USD/KZT exchange rates are affected both by oil prices and international reserves shocks. The order of variables in the model was set based on Aizenman and Riera-Crichton (2008), Kasman and Ayhan (2008), Aizenman et al. (2012), and Habib et al. (2016). The assumptions can be summarised in Equation (4) that links the reduced-form errors to the structural shocks:
where OIL is the price of WTI crude oil, I.R. is the international reserves (excluding gold) of the central bank in Azerbaijan (AIR), and Kazakhstan (KIR) and E.R. are the USD/AZN and USD/KZT exchange rates for Azerbaijan and Kazakhstan, respectively.
We studied the relationship between oil prices, international reserves, and the selected exchange rates based on the impulse response functions and forecast error variance decompositions. An impulse response function depicts the effect of an analysed shock of one variable on the other variables in the model. The forecast error variance decomposition analysis reflects the relative importance of each shock to one variable in affecting another one. We applied the Cholesky decomposition with OIL, I.R., and E.R. ordering.
Furthermore, we supplemented our study with a quantitative analysis of the correlation between oil price and exchange rate changes in the pre-crisis and crisis period. Similarly to Reboredo (2012), we used Spearman’s rank correlation coefficient to test the strength and significance of the analysed relationship. As a pre-crisis period, we set the period from December 2015 to December 2019. As a crisis period, we set the period of the first phase of the COVID-19 pandemic, i.e., from January 2020 to September 2020. We applied daily data on WTI crude oil changes and USD/AZN and USD/KZT spot exchange rate returns. Data came from Refinitiv Datastream. Due to the lack of daily data on the countries’ international reserves, the analysis related to the COVID-19 crisis period does not include that variable.
3. Results
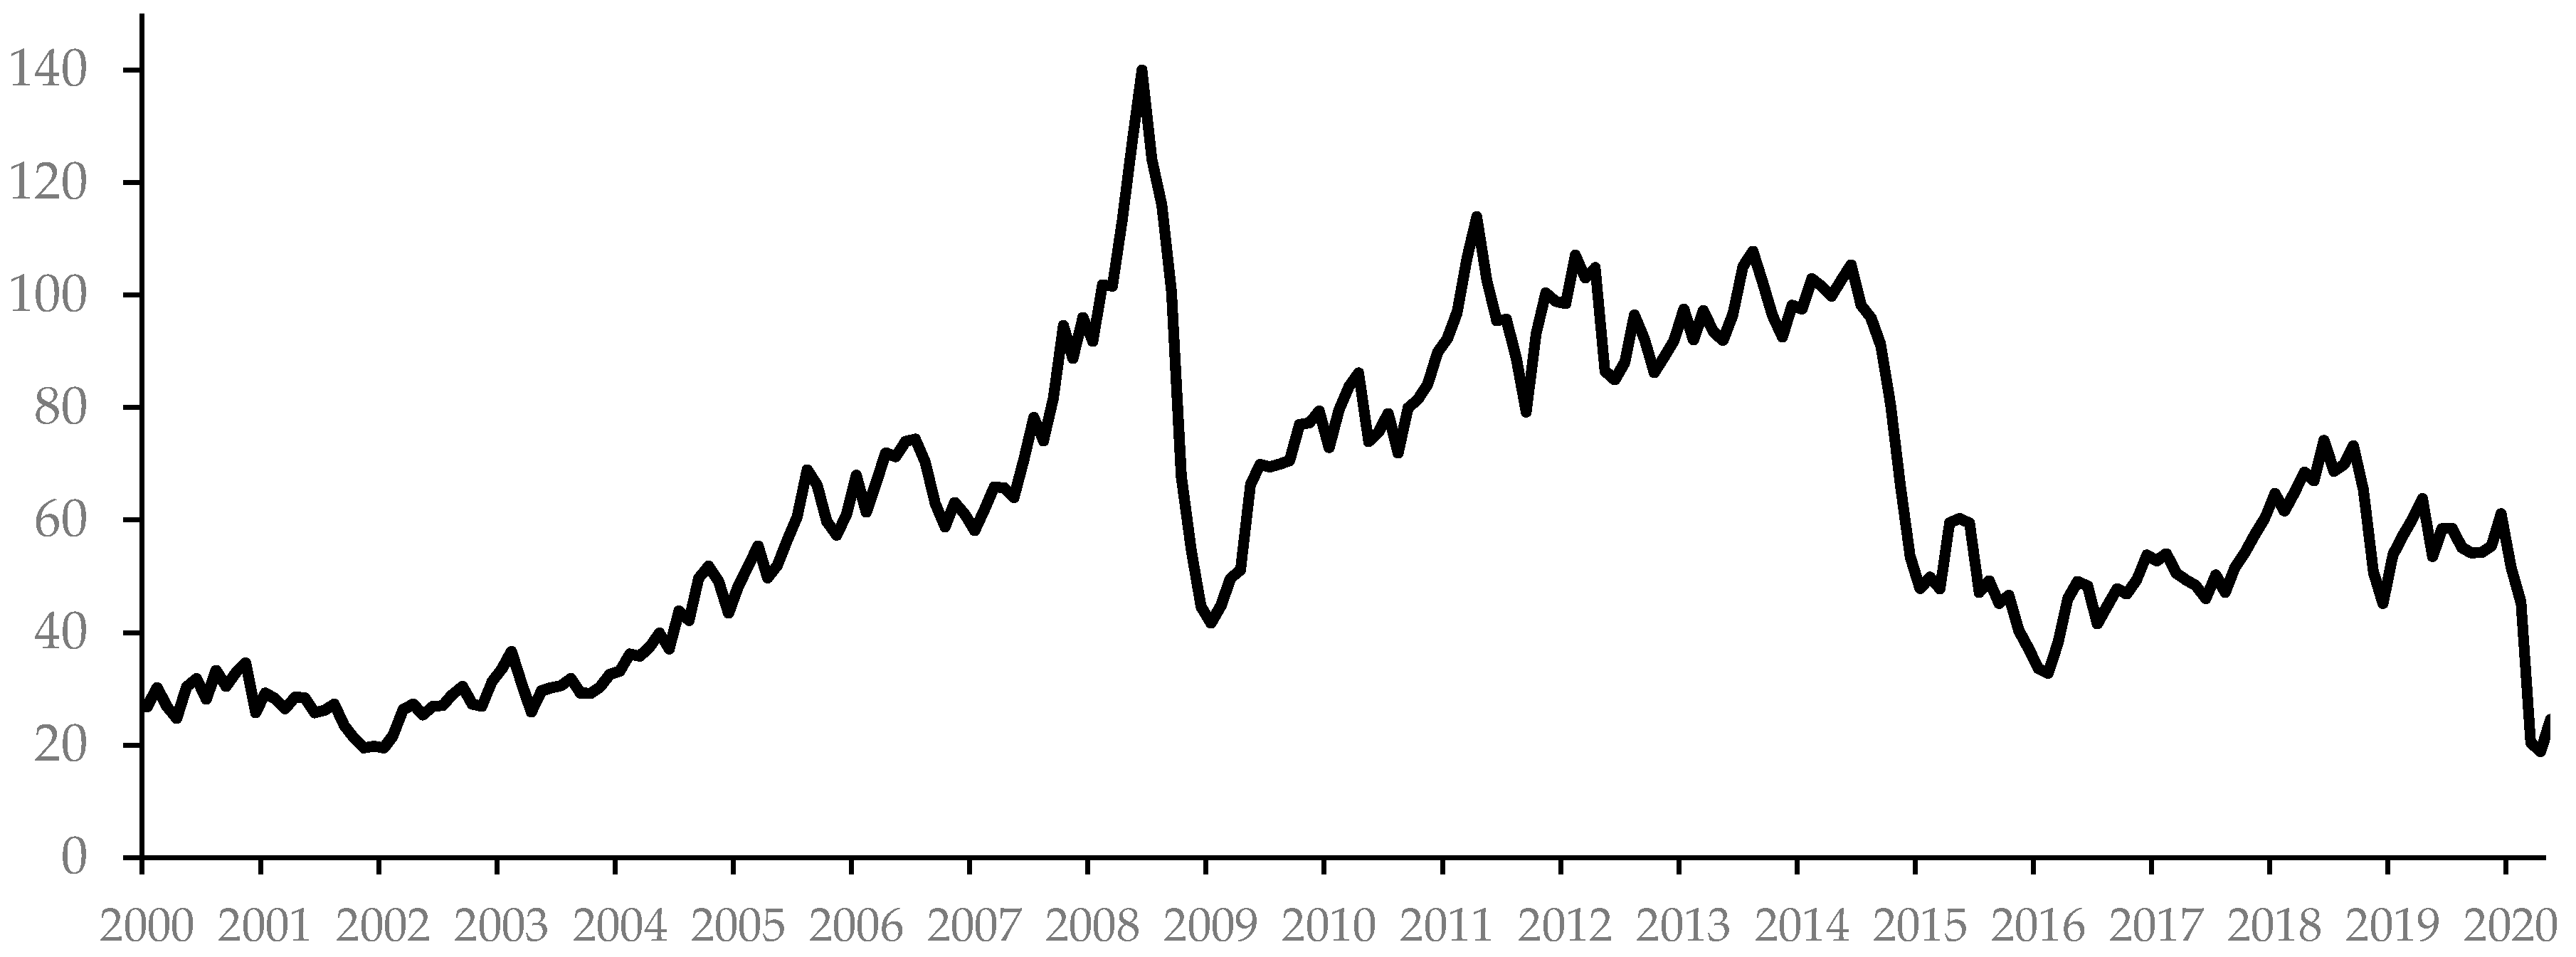
Oil is one of the most important energy sources in the world. Figure 1 presents the monthly crude oil prices from January 2000 until May 2020. Oil prices have recorded significant increases between January 2007 and July 2008 and between January 2009 and May 2011. In the period 2011–2014, oil prices maintained a high level. The situation changed rapidly in 2014. Between August 2014 and January 2016, oil prices plunged more than 75 per cent. Oil exporters encountered many challenges after the 2014 oil price collapse. It led to broad-based and adverse effects on their economies. Most of them experienced a sharp fall in private consumption and investment. Nearly 70 per cent of oil-exporting emerging markets and developing countries registered a significant decline in the GDP growth rate (World Bank 2018). From February 2018 until January 2020, crude oil prices ranged from 33 to 74 USD/Bbl. Another considerable drop in oil prices could be observed in March and April 2020, which resulted from the COVID-19 pandemic. At that time, oil prices fell to around 20 USD/Bbl, reaching levels even lower than in 2009 and 2016.
Oil prices changes have a significant impact on the oil-exporting countries economy. The paper shows the impact of oil price changes on oil-exporting countries’ exchange rates and their international reserves. It should be stressed that most of the adverse effects of oil price decline concern primary countries that highly depend on oil income. The paper focuses on Azerbaijan and Kazakhstan, the economies representing the former Soviet Union states of the Caspian Sea region and are among the world’s top 15 oil-dependent countries (Czech 2018).
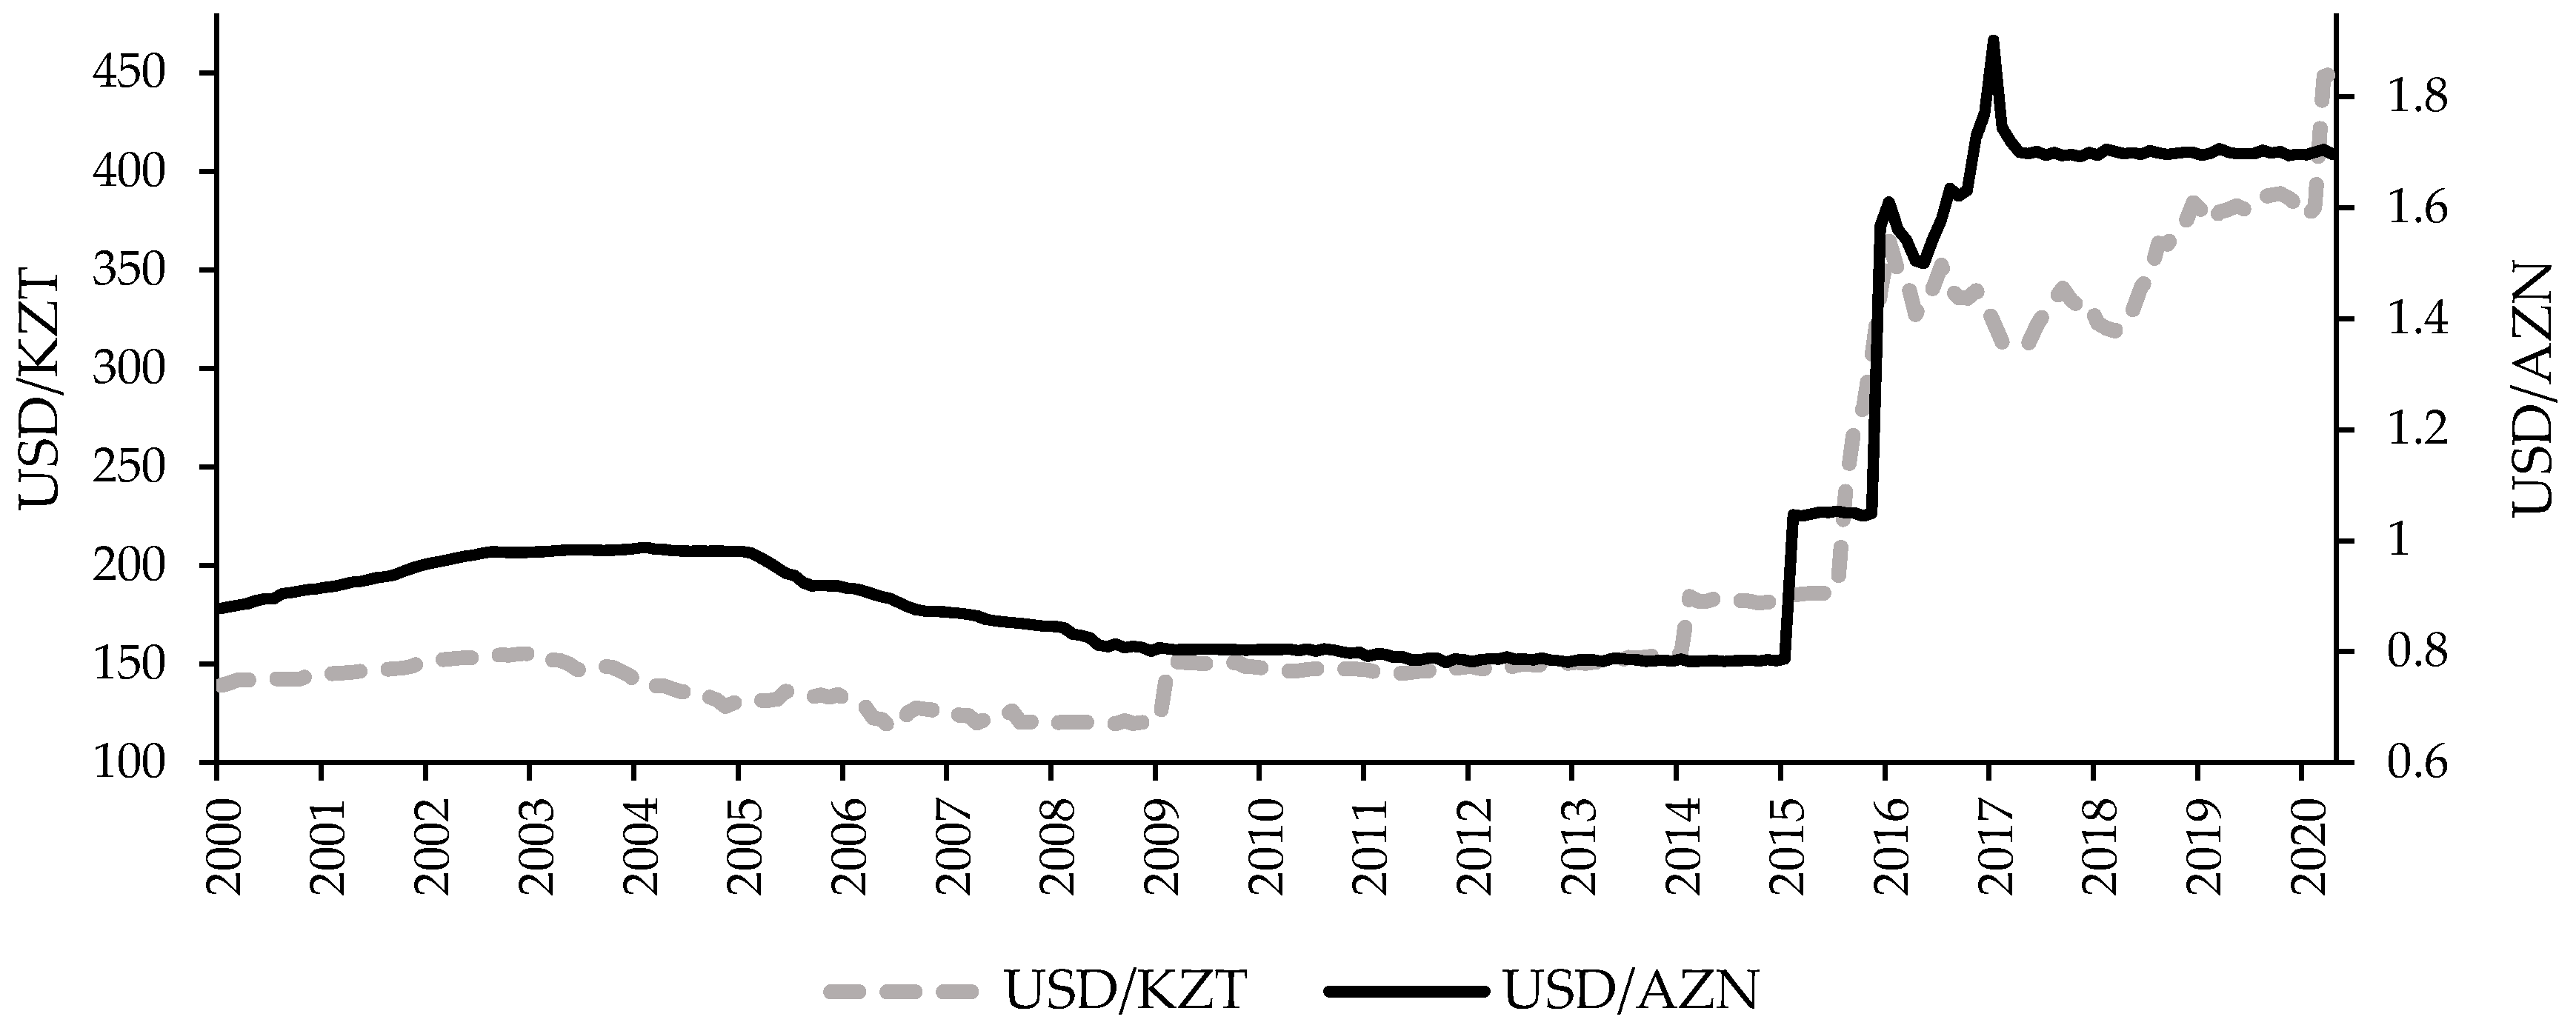
Figure 2 presents the volatility of USD/AZN and USD/KZT exchange rates from January 2000 until May 2020. It can be observed that in the period from January 2000 to January 2015, the value of the Kazakhstani tenge and Azerbaijani manat to the U.S. dollar remained at a stable level. The situation changed rapidly in 2015 when the Azerbaijani and Kazakhstani currencies depreciated against the USD dollar. The USD/KZT exchange rate increased from 180 to 334, and USD/AZN rose from 0.79 to 1.57. A sharp depreciation of the Kazakhstani tenge against the U.S. dollar in 2015 was the main reason to introduce a floating exchange rate and shift the monetary policy in Kazakhstan to an inflation-targeting regime. As far as Azerbaijan is concerned, it suffered double devaluation in 2015. Similarly to Kazakhstan, the central bank in Azerbaijan decided to switch the exchange rate regime from a currency peg to a floating exchange rate in December 2015. Figure 2 shows a sharp increase in the USD/AZN and USD/KZT exchange rates in 2015. It illustrates the sharp decline in the value of both countries’ currencies.
Moreover, Figure 2 indicates that the USD/KZT exchange rate has become more volatile since the transition to a floating currency regime; however, in the case of USD/AZN, the exchange rate still seems to be stable, mainly since 2017. Azerbaijan is not, however, a unique case. Levy-Yeyati and Sturzenegger (2005) point out that many countries that theoretically have a floating exchange rate often intervene in the foreign exchange market. In practice, their exchange rate resembles a fixed exchange rate, not a floating one.
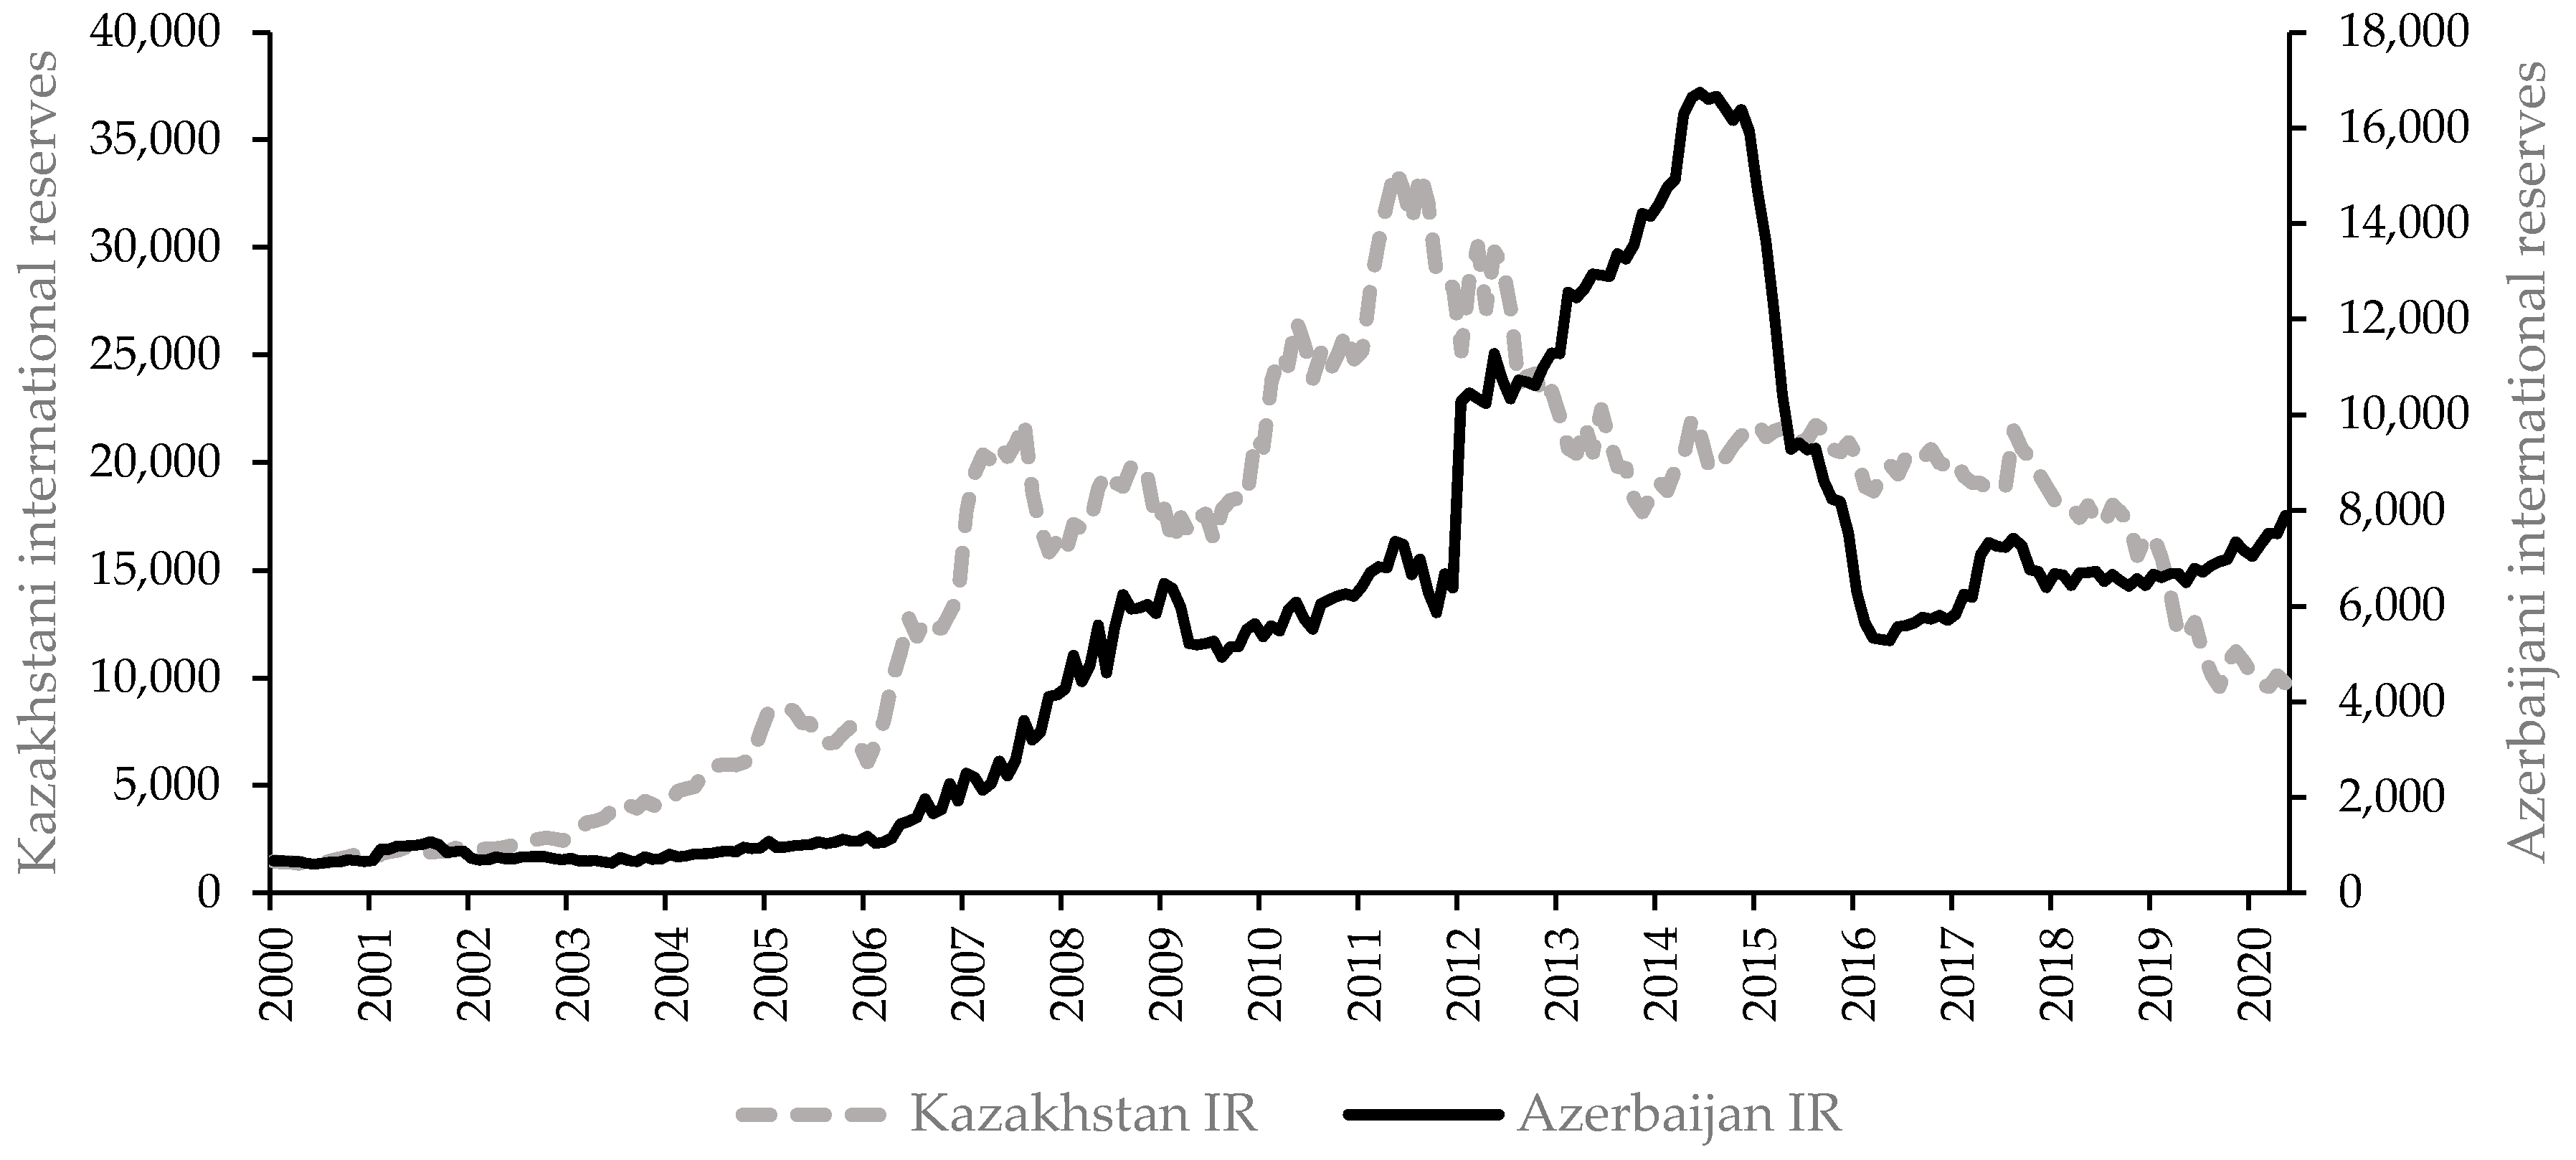
The central bank of a country with a fixed currency regime must constantly monitor the supply and demand of the currency and manage the cash flow to avoid spikes in the demand or supply of its currency. These spikes can cause the currency to deviate from the pegged price. This means that the central bank must maintain large foreign exchange reserves to counteract exchange rate fluctuations. Figure 3 depicts the changes in international reserves excluding gold held by the central bank in Azerbaijan and Kazakhstan. In Azerbaijan, the substantial decrease in the reserves is observed in 2014 and 2015, when the falling oil prices triggered a deficit in the balance of payments of Azerbaijan and led to a substantial decrease in the international reserves, which in turn brought about a currency devaluation and a move to a floating exchange rate. From 2016 to 2020, the level of foreign exchange reserves, similarly to the Azerbaijani manat exchange rate, was characterised by low volatility. According to Levy-Yeyati and Sturzenegger (2005), if neither the nominal exchange rate nor reserves move, then the exchange rate regime that the country is implementing is not apparent. As far as Kazakhstan is concerned, both the exchange rates and reserves have been quite volatile since 2016. This may be associated with the dirty floating exchange rate regime (Levy-Yeyati and Sturzenegger 2005).
The paper applies the SVAR model to study the relationship between oil prices (OIL), international reserves excluding gold held by the central bank in Azerbaijan (AIR) and Kazakhstan (KIR) and USD/AZN and USD/KZT exchange rates. The model is built based on monthly data from December 2015, i.e., when both countries officially changed the currency system to floating, until May 2020. To avoid any spurious inferences, the variables were tested for stationarity. The most frequently applied unit root test is based on the augmented Dickey–Fuller (ADF) test (Dickey and Fuller 1979). The ADF test results are presented in Table 1.
The Augmented Dickey–Fuller test was applied to the level and first difference. The ADF tests indicate that the hypothesis of a non-stationary level cannot be rejected for all analysed series. However, the results for the first difference show that the null hypothesis of a unit root is rejected at the 1% significance level. Based on the ADF test, the analysed series needs to be differenced once to generate a stationary series (are integrated of the order one). Thus, all data are expressed as the first difference of their logarithm value.
The optimal lag length of the VAR estimation was selected based on the Akaike Information Criterion (AIC). The VAR Model (4) for USD/AZN obtained the lowest AIC for 3 lags (AIC = −7.26). The VAR model for Kazakhstani exchange rates has the lowest AIC for 1 lag (AIC = −8.45). The Lagrange Multiplier test results suggest that the residuals are not serially correlated. In the VAR model for the Azerbaijani exchange rate, the L.M. statistics for three lag equal 9.20 with the corresponding p-value of 0.42. In the VAR model for the Kazakhstani exchange rate, the L.M. statistics for one lag equals 8.62 with the corresponding p-value of 0.47. Therefore, based on the following results, we cannot reject the null hypothesis that there is no serial correlation in the residuals. Moreover, the estimated model is stable. All of the roots have a modulus of less than one and lie inside the unit A.R. roots circle.
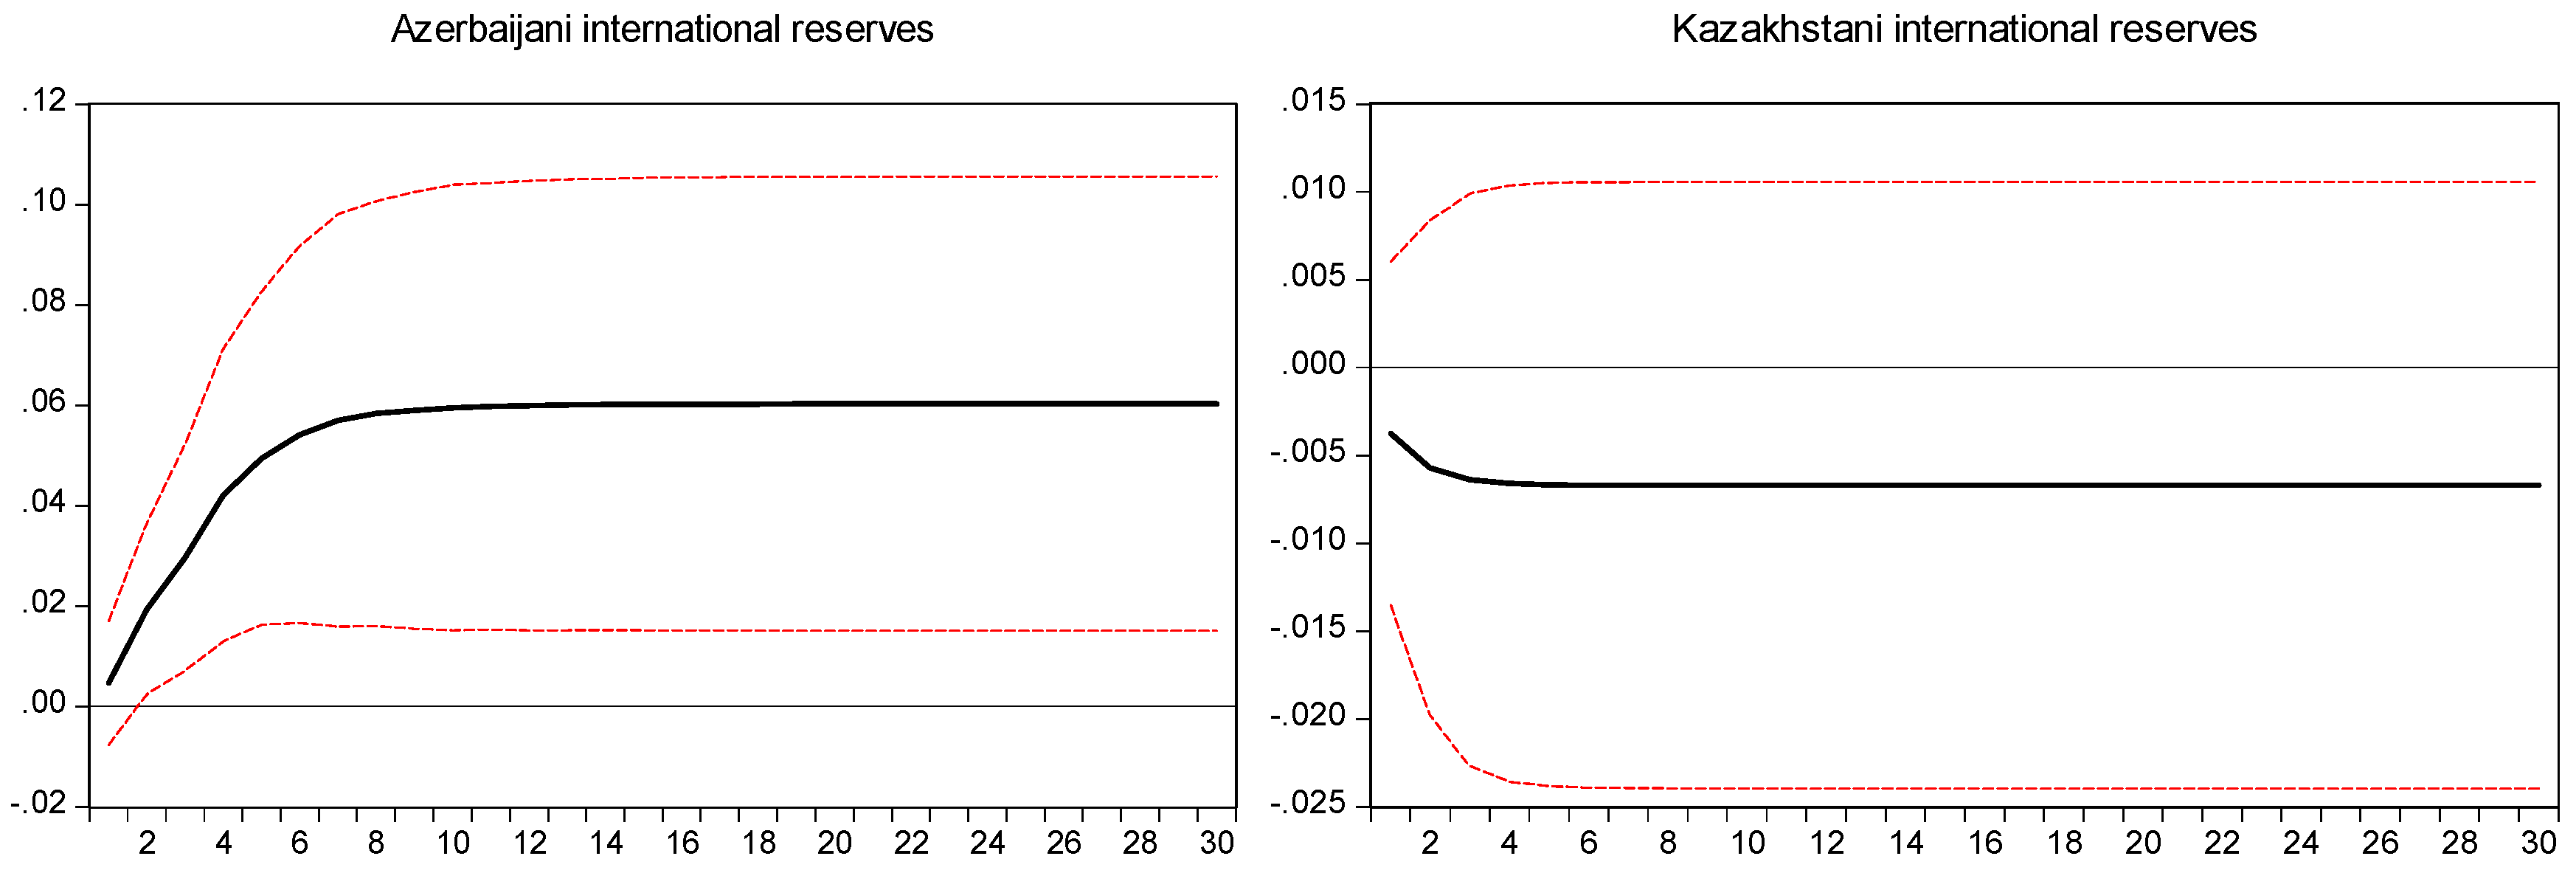
We applied the impulse response functions to assess how and to what extent oil price shocks influence Azerbaijani and Kazakhstani international reserves and the USD/AZN and USD/KZT exchange rates. Figure 4 displays the Azerbaijani and Kazakhstani international reserves’ response to a positive oil price shock over the 30-month range. The figure includes a black line that depicts the mean reaction function and red lines that reflect the confidence interval of two standard deviations around the mean.
The results suggest that oil price increases lead to a change of international reserves (excluding gold) both in Azerbaijan and in Kazakhstan. As far as the Azerbaijani international reserves are concerned, their reaction to the oil price shock is positive and significant from the second month after the shock. For the first month, the confidence interval consists of zero. The reaction of Kazakhstani foreign exchange reserves is statistically insignificant in the entire analysed period after the shock. The standard error band crosses the zero axes.
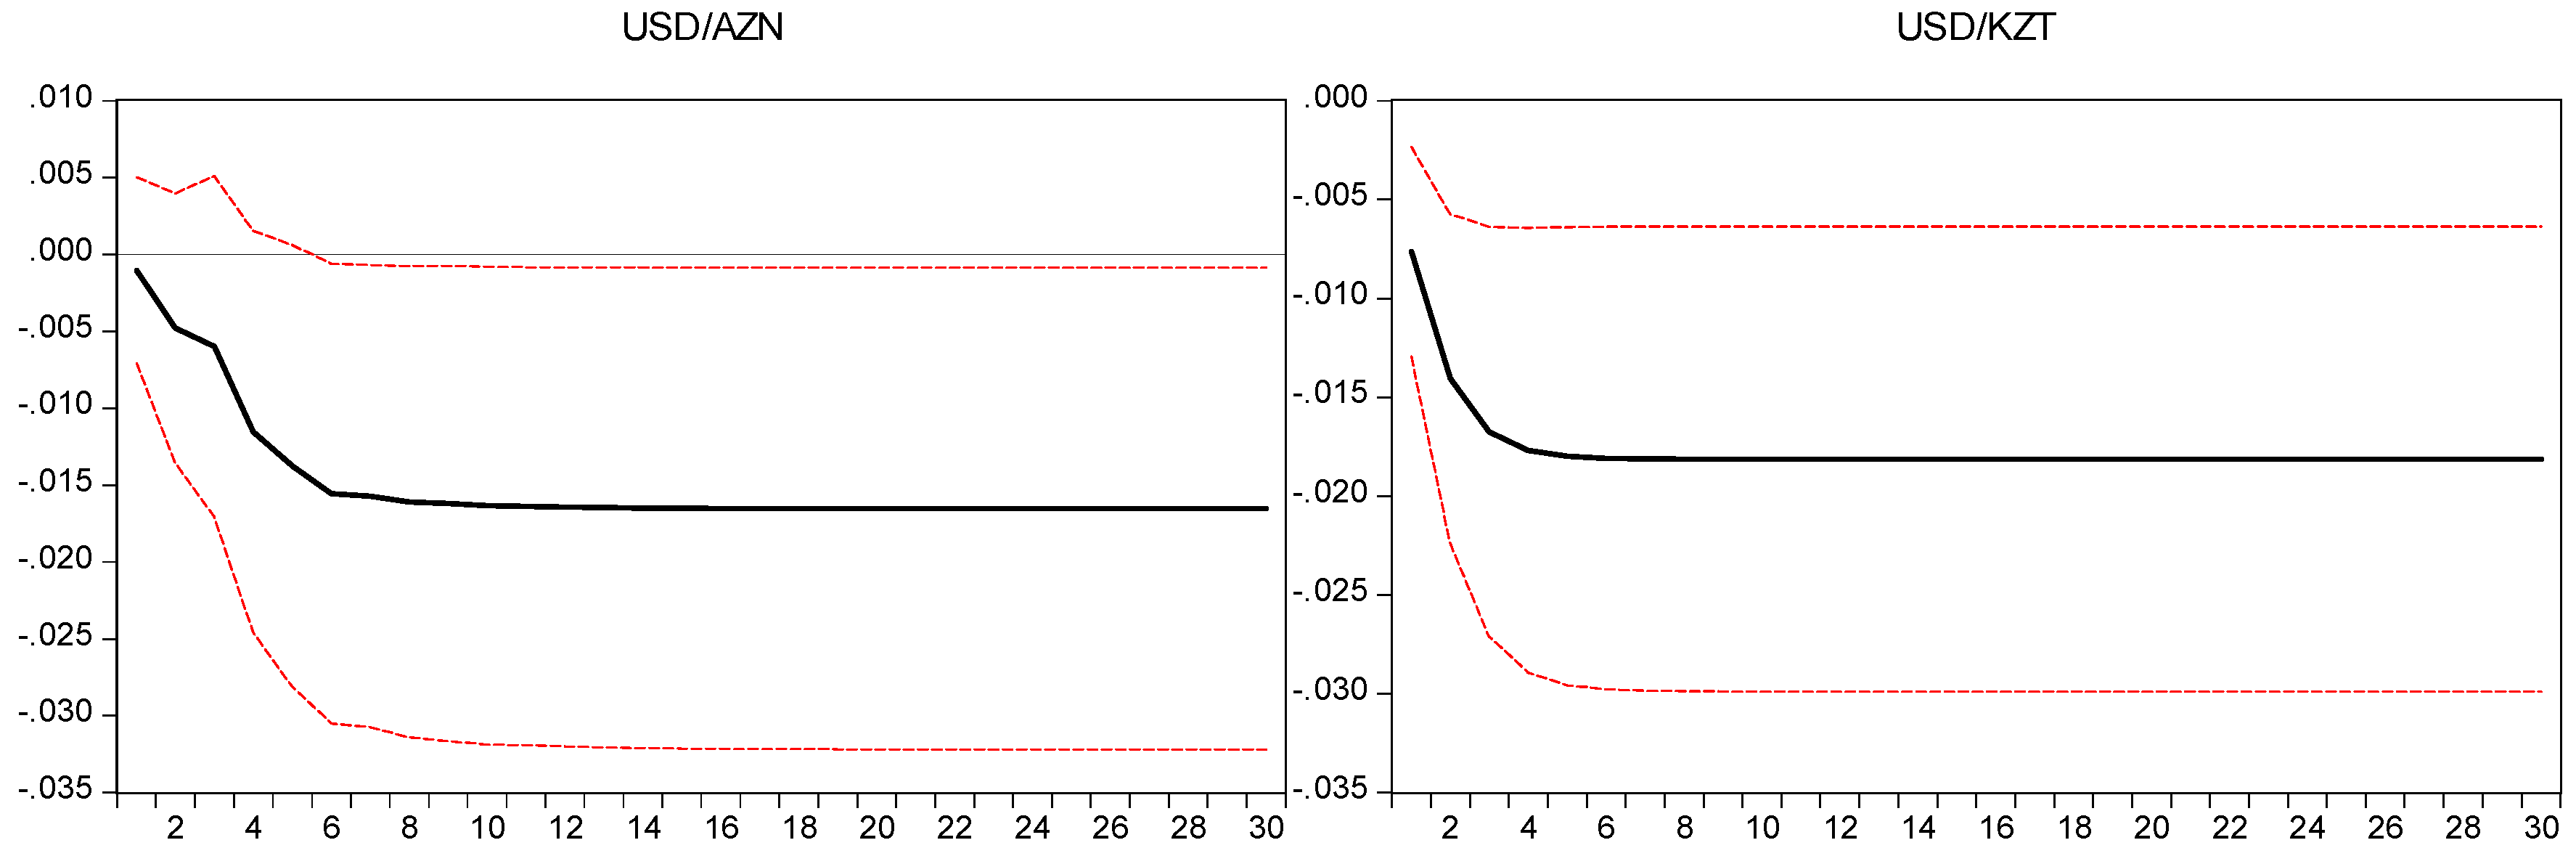
Figure 5 presents the USD/AZN and USD/KZT exchange rates response to positive oil price shock over the 30-month range with ± 2 standard error bands. The results suggest that the oil price increase is associated with a decrease in USD/AZN and USD/KZT exchange rates. The decline occurs in the first four to five months, stabilising at lower than the initial level. It means that the rise in oil prices leads to both Azerbaijani manat and Kazakhstani tenge appreciation against the U.S. dollar. In the case of the USD/KZT exchange rate, its response to oil price shock is statistically significant, while the reaction of USD/AZN is significant from the fifth month after the shock. During the first four months after an oil price shock, the confidence interval contains zero.
The analysis of impulse response functions shows that the rise in oil prices leads to the appreciation of both Kazakhstani and Azerbaijani currencies against the U.S. dollar. The results are in line with Kutan and Wyzan (2005), Lizardo and Mollick (2010), Reboredo (2012), Volkov and Yuhn (2016), among others. Kutan and Wyzan (2005) examine the vulnerability of Kazakhstan to the Dutch disease. They indicate that the oil price increase contributes to Kazakhstan currency appreciation. Lizardo and Mollick (2010) show that the increase of oil prices leads to a significant appreciation of net oil exporters’ currencies against the U.S. dollar. Similar results were obtained by Reboredo (2012) and Volkov and Yuhn (2016). Moreover, Reboredo (2012) shows that the correlation between oil prices and exchange rates is rather weak in pre-crisis periods and stronger in crisis periods. He assumed the 2008–2009 financial crisis as the crisis period.
Table 2 depicts the forecast error variance decomposition results. It reflects the relative importance of each random shock of selected variables in affecting the analysed exchange rates. We listed the forecast error variance decomposition of USD/AZN and USD/KZT on the 30-month horizon. The USD/AZN exchange rate results show that during the first three months, the US dollar to Azerbaijani exchange rate returns are driven mainly by its own innovations, around 1% by changes in oil prices and 10% by changes in international reserves. Meanwhile over a period of more than 6 months, 3% of exchange rates changes are attributed to oil price shocks and 10% to international reserves changes. The results for USD/KZT exchange rate returns show that in the first month after the shock, the exchange rate changes are driven in around 5% by oil price changes and 28.5% by international reserves changes. After 3 months, the share of oil price changes increases to 8%, and the share of international reserves decreases to 26.4%. When the time horizon increases, the share of each endogenous variable in the volatility of USD/AZN and USD/KZT exchange rates remains at the same level. This proves the model’s stability.
In the paper, we supplemented the research with the analysis of the correlation between oil price changes and exchange rates returns in the pre-crisis and crisis periods. We set as a crisis period the period of the first phase of the COVID-19 pandemic. During the ne coronovirus pandemic, we observed a significant drop in oil prices (Dutta et al. 2020; Salisu et al. 2020). The article presents a preliminary assessment of how this fall in crude oil prices affected the USD/AZN and USD/KZT exchange rates and, additionally, whether the COVID-19 pandemic leads to an increase in the value of the correlation coefficient between oil price changes and Azerbaijani and Kazakhstani exchange rate returns. Similarly to Reboredo (2012), we applied Spearman’s rank correlation test. Table 3 presents the test results.
Measuring the correlation between two or more variables requires knowledge of their joint distribution. The Shapiro–Wilk test results imply that the joint distribution is not normal; thus, the relationship between variables is calculated based on Spearman’s rank correlation coefficient (Table 3). The estimated Spearman’s rank correlation coefficients for USD/AZN exchange rate are insignificant in both pre-crisis and crisis periods. We cannot reject the null hypothesis that the relationship between Azerbaijani manat and crude oil equals zero (the p-value equals 0.772 and 0.489 for pre-crisis and crisis periods, respectively). The USD/AZN exchange rate has been stable since 2017, and so far, the COVID-19 pandemic has not caused a change in the exchange rate and a weakening of the Azerbaijani currency, despite significant drops in crude oil, a raw material on which the economy of this country is primarily based. The results are in line with the initial graphical analysis, which shows that from 2016 to 2020, the Azerbaijani manat exchange rate and the level of foreign exchange reserves were characterised by low volatility. According to Levy-Yeyati and Sturzenegger (2005), if neither the nominal exchange rate nor reserves move, then the exchange rate regime that the country is implementing is not apparent. Thus, it seems obvious that in the case of a fixed exchange rate, there is no significant correlation between the change in the oil price at time t and the change in the rate of return on the exchange rate at time t. The results presented in Table 3 show, however, that there is a negative and statistically significant relationship between crude oil prices and USD/KZT in both the pre-crisis and the crisis periods. The estimated Spearman’s rank correlation coefficient in the pre-crisis period equals −0.13 and is lower than in crisis period (−0.17). The results are in line with Reboredo (2012). It implies that an oil price drop in 2020 was associated with a depreciation of the Kazakhstan tenge against the U.S. dollar.
4. Conclusions
As the oil-dependent economies, Azerbaijan and Kazakhstan are sensitive to the movements in global crude oil prices. Countries usually experience a favourable trade balance, foreign reserves increase, and currency appreciation during high oil price periods. The mentioned macroeconomic peculiarities of resource-rich economies impose a considerable challenge to design proper monetary and exchange rate policies to maintain inflation and exchange rate stability. Therefore, the relationship between oil prices and the exchange rate reflects the most fundamental issue in the macroeconomy of resource-rich countries.
The paper shows a negative reaction of the USD/AZN and USD/KZT exchange rates to oil price increases. The impulse response functions suggest that crude oil price increases are associated with an Azerbaijani manat and Kazakhstani tenge appreciation against the U.S. dollar. However, the reaction of USD/AZN is significant only from the fifth month after the shock. Moreover, we reveal that the reaction of Azerbaijani international reserves to the oil price increase is positive and significant. The results are insignificant for the Kazakhstani foreign exchange reserves.
Furthermore, we analyse the relationship between daily oil price changes and exchange rate returns in pre-crisis and crisis periods. As a pre-crisis period, we set the period from December 2015, i.e., when both countries officially changed the currency system to floating, to December 2019. As a crisis period, we set the period of the first phase of the COVID-19 pandemic, i.e., from January 2020 to September 2020. The study reveals a negative and significant relationship between crude oil prices and USD/KZT in both analysed periods. Furthermore, we reveal that the correlation is stronger during the COVID-19 pandemic. However, the relationship is not significant in the case of the Azerbaijani manat. The USD/AZN exchange rate has been stable since 2017, and the first phase of the COVID-19 pandemic has not caused a change in the exchange rate and a weakening of the Azerbaijani currency, despite significant drops in crude oil prices. It should be stressed that although Azerbaijan officially changed its exchange rate to a floating one in 2015, the preliminary data analysis indicates that the Azerbaijani exchange rate was kept at a stable level for most of the analyzed period. This constitutes a limitation of the study. Moreover, the research only examines the most oil-dependent countries from the Caspian Sea region. Investigating the response of other oil-dependent countries currencies to the COVID-19 pandemic is a challenge for future research.
The research results are in line with the majority of studies. Most of the researchers report that the currencies of oil-exporting countries are positively correlated with commodity prices. The increase in oil prices leads to their significant appreciation. This, in turn, may suggest that these countries are at risk of experiencing Dutch disease, as the phenomenon is related mainly to the strong appreciation of resource-rich countries’ currencies triggered by a rise in commodity prices. An appreciation of the national currency decreases the country’s export competitiveness while reducing the possibilities of diversifying the national economy to be less dependent on the price changes of raw materials. In this context, exchange rate management should be at the centre of attention for the central banks of Azerbaijan and Kazakhstan and related policymakers.
Author Contributions
Conceptualization, K.C. and I.N.; methodology, K.C.; software, K.C.; validation, K.C., I.N.; formal analysis, K.C. and I.N.; investigation, K.C. and I.N.; resources, K.C.; data curation, K.C.; writing—original draft preparation, K.C. and I.N.; writing—review and editing, K.C. and I.N.; visualization, K.C.; supervision, K.C.; project administration, K.C.; All authors have read and agreed to the published version of the manuscript.
Funding
This research received no external funding.
Data Availability Statement
Not applicable.
Conflicts of Interest
The authors declare no conflict of interest.
References
- Agrawal, Pradeep. 2007. Economic Growth and Poverty Reduction: Evidence from Kazakhstan. Asian Development Review 24: 90–115. [Google Scholar]
- Aizenman, Joshua, and Daniel Riera-Crichton. 2008. Real Exchange Rate and International Reserves in an Era of Growing Financial and Trade Integration. Review of Economics and Statistics 90: 812–15. [Google Scholar] [CrossRef] [Green Version]
- Aizenman, Joshua, Sebastian Edwards, and Daniel Riera-Crichton. 2012. Adjustment Patterns to Commodity Terms of Trade Shocks: The Role of Exchange Rate and International Reserves Policies. Journal of International Money and Finance 31: 1990–2016. [Google Scholar] [CrossRef] [Green Version]
- Akimov, Alexandr, and Brian Dollery. 2008. Financial System Reform in Kazakhstan from 1993 to 2006 and Its Socioeconomic Effects. Emerging Markets Finance and Trade 44: 81–97. [Google Scholar] [CrossRef]
- Akram, Qaisar Farooq. 2004. Oil Prices and Exchange Rates: Norwegian Evidence. The Econometrics Journal 7: 476–504. [Google Scholar] [CrossRef]
- Aleisa, Eisa A., and Sel Dibooĝlu. 2002. Sources of Real Exchange Rate Movements in Saudi Arabia. Journal of Economics and Finance 26: 101–10. [Google Scholar] [CrossRef]
- Aleksandrova, Svetlana. 2016. Impact of Oil Prices on Oil Exporting Countries in the Caucasus and Central Asia. Economic Alternatives 4: 447–60. [Google Scholar]
- Aliev, Timur M. 2015. Kazakhstan: Resource Curse or Dutch Disease? Problems of Economic Transition 57: 1–28. [Google Scholar] [CrossRef]
- Badeeb, Ramez Abubakr, Hooi Hooi Lean, and Jeremy Clark. 2017. The Evolution of the Natural Resource Curse Thesis: A Critical Literature Survey. Resources Policy 51: 123–34. [Google Scholar] [CrossRef]
- Bayramov, Gubad, and Patrick Conway. 2010. The Azerbaijan Producers Survey: Dutch Disease and Financial Crisis. Baku: Economic Research Center, Available online: http://www.erc.az/files/reports/Bayramov_Conway_Azerbaijan.pdf (accessed on 15 September 2020).
- Benhabib, Abderrezak, Mohammed Kamel, and Samir Maliki. 2014. The Relationship between Oil Price and the Algerian Exchange Rate. Topics in Middle Eastern and African Economies 16: 127–41. [Google Scholar]
- Brahmasrene, Tantatape, Jui-Chi Huang, and Yaya Sissoko. 2014. Crude Oil Prices and Exchange Rates: Causality, Variance Decomposition and Impulse Response. Energy Economics 44: 407–12. [Google Scholar] [CrossRef]
- Bresser-Pereira, Luiz Carlos. 2013. The Value of the Exchange Rate and the Dutch Disease. Revista de Economia Política 33: 371–87. [Google Scholar] [CrossRef] [Green Version]
- CESD. 2019. Social Consequences of the Oil Price Shock in the Resource Rich Post-Soviet Countries. Center For Economic and Social Development. Baku. Azerbaijan. Available online: http://cesd.az/new/wp-content/uploads/2020/05/CESD_Social_Cost_Paper.pdf (accessed on 16 September 2020).
- Chen, Shiu-Sheng, and Hung-Chyn Chen. 2007. Oil Prices and Real Exchange Rates. Energy Economics 29: 390–404. [Google Scholar] [CrossRef]
- Chen, Yu-Chin, and Kenneth Rogoff. 2003. Commodity Currencies. Journal of International Economics 60: 133–60. [Google Scholar] [CrossRef]
- Chen, Hongtao, Li Liu, Yudong Wang, and Yingming Zhu. 2016. Oil Price Shocks and U.S. Dollar Exchange Rates. Energy 112: 1036–48. [Google Scholar] [CrossRef] [Green Version]
- Corden, W. M. 1984. Booming Sector and Dutch Disease Economics: Survey and Consolidation. Oxford Economic Papers 36: 359–80. [Google Scholar] [CrossRef]
- Corden, W. Max, and J. Peter Neary. 1982. Booming Sector and De-Industrialisation in a Small Open Economy. The Economic Journal 92: 825. [Google Scholar] [CrossRef] [Green Version]
- Czech, Katarzyna. 2018. Oil Dependence of Post-Soviet Countries in the Caspian Sea Region: The Case of Azerbaijan and Kazakhstan. Acta Scientiarum Polonorum. Oeconomia 17: 5–12. [Google Scholar] [CrossRef]
- Dickey, David A., and Wayne A. Fuller. 1979. Distribution of the Estimators for Autoregressive Time Series with a Unit Root. Journal of the American Statistical Association 74: 427–431. [Google Scholar]
- Dikkaya, Mehmet, and Bayram Doyar. 2017. Causality Among Oil Prices, GDP and Exchange Rate: Evidence from Azerbaijan and Kazakhstan. Bilig 83: 79–98. [Google Scholar]
- Dutta, Anupam, Debojyoti Das, R. K. Jana, and Xuan Vinh Vo. 2020. COVID-19 and Oil Market Crash: Revisiting the Safe Haven Property of Gold and Bitcoin. Resources Policy 69: 101816. [Google Scholar] [CrossRef]
- Egert, Balazs, and Carol S. Leonard. 2008. Dutch Disease Scare in Kazakhstan: Is It Real? Open Economies Review 19: 147–65. [Google Scholar] [CrossRef]
- Gahramanov, Emin, and Liang-Shing Fan. 2002. The “Dutch Disease” in Caspian Region: The Case of Azerbaijan Republic. Economic Studies 5: 9–30. [Google Scholar]
- Golub, Stephen S. 1983. Oil Prices and Exchange Rates. The Economic Journal 93: 576. [Google Scholar] [CrossRef]
- Gronwald, Malc, Johannes Mayr, and Sultan Orazbayev. 2009. Estimating the Effects of Oil Price Shockson the Kazakh Economy. Leibniz Institute for Economic Research Working Papers 81: 1–22. [Google Scholar]
- Habib, Maurizio Michael, Sascha Bützer, and Livio Stracca. 2016. Global Exchange Rate Configurations: Do Oil Shocks Matter? IMF Economic Review 64: 443–70. [Google Scholar] [CrossRef] [Green Version]
- Hasanov, Fakhri. 2010. The Impact of Real Oil Price on Real Effective Exchange Rate: The Case of Azerbaijan. DIW Berlin Discussion Papers 1041: 1–26. [Google Scholar] [CrossRef]
- Hasanov, Fakhri. 2013. Dutch Disease and the Azerbaijan Economy. Communist and Post-Communist Studies 46: 463–80. [Google Scholar] [CrossRef]
- Humbatova, Sugra Ingilab, Ragif Kh. Gasimov, and Natig Gadim-Oglu Hajiyev. 2019. The Impact of Oil Factor on Azerbaijan Economy. International Journal of Energy Economics and Policy 9: 381–87. [Google Scholar] [CrossRef]
- Kasman, Adnan, and Duygu Ayhan. 2008. Foreign Exchange Reserves and Exchange Rates in Turkey: Structural Breaks, Unit Roots and Cointegration. Economic Modelling 25: 83–92. [Google Scholar] [CrossRef]
- Kose, Nezir, and Sabit Baimaganbetov. 2015. The Asymmetric Impact of Oil Price Shocks on Kazakhstan Macroeconomic Dynamics: A Structural Vector Autoregression Approach. International Journal of Energy Economics and Policy 5: 1058–64. [Google Scholar]
- Kretzschmar, Gavin, and Mira Nurmakhanova. 2010. Kazakhstan—The Real Currency and Growth Challenge for Commodity Producing Countries. Available online: https://ssrn.com/abstract=1662346 (accessed on 10 October 2020).
- Krugman, Paul. 1983. Oil Shocks and Exchange Rate Dynamics. In Exchange Rates and International Macroeconomics. Chicago: University of Chicago Press, pp. 259–84. Available online: http://www.nber.org/books/fren83-1 (accessed on 19 August 2020).
- Kutan, Ali M., and Michael L. Wyzan. 2005. Explaining the Real Exchange Rate in Kazakhstan, 1996–2003: Is Kazakhstan Vulnerable to the Dutch Disease? Economic Systems 29: 242–55. [Google Scholar] [CrossRef]
- Letiche, John M. 1960. Adam Smith and David Ricardo on Economic Growth. In The Punjab University Economist. Punjab: Department of Economics, University of the Punjab, vol. 1, pp. 7–35. [Google Scholar]
- Levy-Yeyati, Eduardo, and Federico Sturzenegger. 2005. Classifying Exchange Rate Regimes: Deeds vs. Words. European Economic Review 49: 1603–35. [Google Scholar] [CrossRef] [Green Version]
- Lizardo, Radhamés A., and André V. Mollick. 2010. Oil Price Fluctuations and U.S. Dollar Exchange Rates. Energy Economics 32: 399–408. [Google Scholar] [CrossRef]
- Lütkepohl, Helmut, and Markus Krätzig. 2004. Applied Time Series Econometrics. Cambridge: Cambridge University Press. [Google Scholar]
- Macerinskiene, Irena, and Gaughar Sakhanova. 2011. National Economy Competitiveness of Kazakhstan Republic. Engineering Economics 22: 292–99. [Google Scholar] [CrossRef] [Green Version]
- Magud, Nicolás, and Sebastián Sosa. 2013. When and Why Worry about Real Exchange Rate Appreciation? The Missing Link between Dutch Disease and Growth. Journal of International Commerce, Economics and Policy 4: 1350009. [Google Scholar] [CrossRef]
- Malik, Farooq, and Zaghum Umar. 2019. Dynamic Connectedness of Oil Price Shocks and Exchange Rates. Energy Economics 84: 104501. [Google Scholar] [CrossRef]
- Niftiyev, Ibrahim, and Natavan Namazova. 2020. Analysis of Cyclicality in the Azerbaijan Economy: Results of the Chi-Square Test. Academic Journal of Economic Studies 6: 122–34. [Google Scholar]
- Obioma, B., and N. Eke Charles. 2015. An Empirical Analysis of Crude Oil Price, Consumer Price Level and Exchange Rate Interaction in Nigeria: A Vector Autoregressive (VAR) Approach. American Journal of Economics 5: 385–93. [Google Scholar] [CrossRef]
- Petrenko, Elena, Anna Shevyakova, Zhanibek Zhartay, and Olefirenko Oleg. 2016. Towards Economic Security through Diversification: Case of Kazakhstan. Journal of Security & Sustainability 5: 509–18. [Google Scholar]
- Pomfret, Richard. 2005. Kazakhstan’s Economy since Independence: Does the Oil Boom Offer a Second Chance for Sustainable Development? Europe-Asia Studies 57: 859–76. [Google Scholar] [CrossRef]
- Reboredo, Juan C. 2012. Modelling Oil Price and Exchange Rate Co-Movements. Journal of Policy Modeling 34: 419–40. [Google Scholar] [CrossRef]
- Salisu, Afees A., Godday U. Ebuh, and Nuruddeen Usman. 2020. Revisiting Oil-Stock Nexus during COVID-19 Pandemic: Some Preliminary Results. International Review of Economics & Finance 69: 280–94. [Google Scholar] [CrossRef]
- Sims, Christopher A. 1980. Macroeconomics and Reality. Econometrica 48: 1. [Google Scholar] [CrossRef] [Green Version]
- Volkov, Nikanor I., and Ky-hyang Yuhn. 2016. Oil Price Shocks and Exchange Rate Movements. Global Finance Journal 31: 18–30. [Google Scholar] [CrossRef]
- World Bank. 2018. Commodity Markets Outlook. Oil Exporters: Policies and Challenges. Commodity Markets Outlook. Available online: https://www.worldbank.org/en/research/commodity-markets (accessed on 17 September 2020).
Figure 1.
Monthly crude WTI oil prices in the period from January 2000 until May 2020 (USD/Bbl).

Figure 2.
Monthly USD/AZN and USD/KZT exchange rates in the period from January 2000 until May 2020.
Figure 2.
Monthly USD/AZN and USD/KZT exchange rates in the period from January 2000 until May 2020.

Figure 3.
Monthly international reserves excluding gold in Azerbaijan and Kazakhstan, in the period from January 2000 until May 2020 (in billion U.S. dollars).
Figure 3.
Monthly international reserves excluding gold in Azerbaijan and Kazakhstan, in the period from January 2000 until May 2020 (in billion U.S. dollars).

Figure 4.
The impulse response function of Azerbaijani and Kazakhstani international reserves to oil price shocks.
Figure 4.
The impulse response function of Azerbaijani and Kazakhstani international reserves to oil price shocks.

Figure 5.
Impulse response function of USD/AZN and USD/KZT exchange rates to oil price shocks.


Table 1.
Augmented Dickey–Fuller test results.
| Variables | Intercept | Intercept and Trend | ||
|---|---|---|---|---|
| Level | First Difference | Level | First Difference | |
| USD/AZN | −0.04 | −14.77 *** | −1.05 | −14.84 *** |
| USD/KZT | 1.37 | −11.67 *** | −0.53 | −11.99 *** |
| AIR | −1.52 | −6.02 *** | −1.83 | −6.02 *** |
| KIR | −1.52 | −14.85 *** | −0.31 | −15.06 *** |
| OIL | −2.27 | −12.46 *** | −2.05 | −12.49 *** |
Note: *** H0 of a unit root is rejected at the 1%, ** 5%, and * 10% significance level.
Table 2.
Forecast error variance decomposition of the USD/AZN and USD/KZT exchange rates.
| Azerbaijan | ||||
| Horizons | Standard Error | Oil Prices | International Reserves | USD/AZN |
| 1 | 0.11 | 0.07 | 7.09 | 92.84 |
| 2 | 0.11 | 0.94 | 10.93 | 88.13 |
| 3 | 0.12 | 1.07 | 10.94 | 87.99 |
| 6 | 0.12 | 3.28 | 10.94 | 85.78 |
| 12 | 0.12 | 3.29 | 10.96 | 85.75 |
| 18 | 0.12 | 3.29 | 10.96 | 85.75 |
| 24 | 0.12 | 3.29 | 10.96 | 85.75 |
| 30 | 0.12 | 3.29 | 10.96 | 85.75 |
| Kazakhstan | ||||
| Horizons | Standard Error | Oil Prices | International Reserves | USD/KZT |
| 1 | 0.11 | 4.70 | 28.53 | 66.77 |
| 2 | 0.11 | 7.46 | 26.64 | 65.90 |
| 3 | 0.11 | 7.94 | 26.44 | 65.61 |
| 6 | 0.11 | 8.01 | 26.42 | 65.57 |
| 12 | 0.11 | 8.01 | 26.42 | 65.57 |
| 18 | 0.11 | 8.01 | 26.42 | 65.57 |
| 24 | 0.11 | 8.01 | 26.42 | 65.57 |
| 30 | 0.11 | 8.01 | 26.42 | 65.57 |
Table 3.
The relationship between USD/AZN and USD/KZT spot exchange rate returns and crude oil price changes during the pre-crisis period and crisis period.
Table 3.
The relationship between USD/AZN and USD/KZT spot exchange rate returns and crude oil price changes during the pre-crisis period and crisis period.
| Variable | Shapiro–Wilk Test Statistic | p-Value | Spearman’s Rank Correlation Coefficient | p-Value |
|---|---|---|---|---|
| pre-crisis period (December 2015-December 2019) | ||||
| USD/AZN | 0.24 | <0.001 | −0.01 | 0.772 |
| USD/KZT | 0.83 | <0.001 | −0.13 | <0.001 |
| crisis period (January 2020–September 2020) | ||||
| USD/AZN | 0.79 | <0.001 | 0.05 | 0.489 |
| USD/KZT | 0.68 | <0.0 | −0.17 | 0.015 |
Publisher’s Note: MDPI stays neutral with regard to jurisdictional claims in published maps and institutional affiliations. |
© 2021 by the authors. Licensee MDPI, Basel, Switzerland. This article is an open access article distributed under the terms and conditions of the Creative Commons Attribution (CC BY) license (https://creativecommons.org/licenses/by/4.0/).
Share and Cite
MDPI and ACS Style
Czech, K.; Niftiyev, I. The Impact of Oil Price Shocks on Oil-Dependent Countries’ Currencies: The Case of Azerbaijan and Kazakhstan. J. Risk Financial Manag. 2021, 14, 431. https://0-doi-org.brum.beds.ac.uk/10.3390/jrfm14090431
AMA Style
Czech K, Niftiyev I. The Impact of Oil Price Shocks on Oil-Dependent Countries’ Currencies: The Case of Azerbaijan and Kazakhstan. Journal of Risk and Financial Management. 2021; 14(9):431. https://0-doi-org.brum.beds.ac.uk/10.3390/jrfm14090431
Chicago/Turabian StyleCzech, Katarzyna, and Ibrahim Niftiyev. 2021. "The Impact of Oil Price Shocks on Oil-Dependent Countries’ Currencies: The Case of Azerbaijan and Kazakhstan" Journal of Risk and Financial Management 14, no. 9: 431. https://0-doi-org.brum.beds.ac.uk/10.3390/jrfm14090431