Article

Development of Risk Index and Risk Governance Index: Application in Indian Public Sector Undertakings

by
Suneel Maheshwari
1,*,
Vasudha Gupta
2 and
Deepak Raghava Naik
3
1
Department of Accounting and IS, Indiana University of Pennsylvania, Indiana, PA 15705, USA
2
Press Information Bureau Government of India, Delhi 110001, India
3
Department of Management Studies, Ramaiah Institute of Technology, Bangalore 560054, India
*
Author to whom correspondence should be addressed.
J. Risk Financial Manag. 2022, 15(5), 225; https://0-doi-org.brum.beds.ac.uk/10.3390/jrfm15050225
Submission received: 18 November 2021 / Revised: 29 April 2022 / Accepted: 11 May 2022 / Published: 20 May 2022
(This article belongs to the Special Issue Emerging Markets)

Abstract

:
The purpose of the paper is to develop a risk measure in the form of a risk index and a governance index as an indicator of the quality of governance structure. Using the Delphi technique, two indices are developed (risk index and corporate governance index (CGI)); subsequently, using the 10-year (2005–2015) data of top Indian Public Sector Undertakings (PSUs) and diff-GMM regression (to deal with endogeneity), indices have been validated. Though the data set may appear old, it has only been used to test the risk index and analyze the results. Empirical evidence on indices indicates that Indian PSUs have ‘moderate’ risk levels and ample scope for improvement in their governance structure. Further, a positive relation between governance index and returns and negative relation between risk index and returns lend credence to the indices developed in the study. Notably, the governance index appears to be a moderating variable in the relationship between risk and return. It is perhaps the first study to put forth a comprehensive measure of risk to measure risk levels of PSUs and prescribe a measure of the quality of governance structure. While constructing the CGI, certain non-compliances were observed, even in terms of mandatory requirements, such as the proportion of PSUs may take independent directors. The new datasets may further check for compliance and its effect on the results. Such infringements call for stringent penal provisions and better monitoring of PSUs. Further, if the normative frameworks are adhered to as per the study by the Securities and Exchange Board of India (SEBI) and Ministry of Corporate Affairs (MCA), more effective and efficient decisions with lower risks, and hassle-free management resulting in better return on assets and return on equity.

1. Introduction

Public sector undertakings (PSUs) are not mere profit-maximizing economic units but a thread that seamlessly ties together the social fabric, forms the cornerstone of economic development, and facilitates self-reliance (Pollitt 2017). Consequently, the performance measurement and management of PSUs assume paramount importance. However, ambiguous objectives (Pollanen 2005), lack of robust governance structures (Almqvist et al. 2013; Hughes 2017), and ineffective control systems in PSUs (Burkert et al. 2011) have been causes of concern for researchers and practitioners alike. These chronic causes called for ‘new’ public management practices (Hood 1991).
New public management (NPM) started to gain currency in Asian markets in the aftermath of the 1997 Asian financial crisis. Widespread reforms in terms of privatization, ‘agencification’, decentralization, and performance management were observed across Asian countries, such as Indonesia, Japan, Malaysia, China, etc. (Koike 2013).
Though, owing to the limitations of NPM, particularly those related to the effectiveness of governance (Christensen and Laegreid 2007), post-NPM reforms came into being. Post-NPM reforms improved governance repertoire by providing governance frameworks to govern inter-organizational actions more effectively (Christensen 2012). It also led to the emergence of ‘New Public Governance’ (NPG) (Almqvist et al. 2013). Core of these propositions is a greater emphasis on common values, the increased involvement of PSUs, and the provision of general frameworks for self-governance to improve cooperation in regard to public goals (Ling 2002; Nabatchi et al. 2010; Sørensen and Triantafillou 2009). Yet, a few emerging economies (‘unfamiliar diners’) (Turner 2002) such as India failed to take cues from these reforms and continued to bear the burden of loss-making and inefficient Public Sector Undertakings (PSUs) (Ramaswamy and Renforth 1996).
After independence, India pursued the path of development in which the public sector would play a vital role. Unfortunately, public sectors manifested themselves into loss-making enterprises with low-capacity utilization, overcapitalization due to severe cost overruns, and an inability to innovate and compete with global players. Rather than augmenting government resources, PSUs started to become a cost center consuming capital resources for their survival (Khumawala 1997). With increasing constraints on resources and budgets, the Indian government has finally begun to ‘divest’ the so called state-owned ‘assets’, which have become more of a ‘liability’.
The Indian government started disinvestment in the public sector in 1991, and the amount of disinvestment has been steadily increasing. Initially, the private sector did not find it attractive to invest. Between 2001–2004, there was disinvestment worth $2.8 billion US $. This was possible due to a change in stance of the government policy by going for strategic sales with either transfer of control or sale of stake to the public, but still retaining control of the management. Companies noteworthy to be mentioned during the period include India Tourism Development Corporation Ltd. (ITDC), New Delhi, India; Modern Food Industries (India) Ltd. (MFIL), Gurgaon, Haryana, India; Paradeep Phosphates Ltd., Bhubaneswar, Odisha, India; Hindustan Zinc Ltd., Udaipur, Rajasthan, India; Bharat Aluminium Co., Ltd., New Delhi, India, etc. The public offer of Life Insurance Corporation (LIC) Ltd. and sale of the ailing national carrier Air India to the Tata Group is one important milestone towards privatization. From 2016 and 2017 and 2020 and 2021, the government of India collected over US $36 billion from the sale of stake in public sector undertakings (http://www.bsepsu.com/historical-disinvestment.asp accessed on 24 February 2022).
The importance of PSUs in one of the prominent Asian economies, i.e., India, cannot be overemphasized (Büge et al. 2013). Indian PSUs have a complete monopoly in nuclear power generation. Indian PSUs also have a major market share in the coal, petroleum, power generation, telecommunication, and fertilizer sectors besides strong international presence (KPMG 2012). In 2014 and 2015, the PSU sector had a gross turnover of US $261.62 billion in comparison to US $270.81 billion in 2013 and 2014, showing a decrease of 3.4%. Along the same lines, the profit of PSUs also showed a fall of 12.9% from US $19.61 billion in 2013 and 2014 to US $17.1 billion in 2014 and 2015. Amongst the various sectors, PSUs from petroleum (refinery and marketing), coal, crude oil, steel, electricity (power generation), and trading and marketing services contributed the most to the country’s GDP. In view of the magnitude of PSUs in terms of their overall contribution (not limited to employment and development) to the Indian economy, it seems imperative to take all necessary steps to improve their performance (Mansi et al. 2017). They are the building blocks of the Indian economy and play a vital role in the country’s socio-economic development (Mansi et al. 2017). As government-owned enterprises, these organizations have additional commitments for economic and social well-being; these commitments need to be reflected in their risk-taking (Mishra 2011), decision-making, and governance structures.
Further, companies’ responsibility for their direction and supervision ultimately vests with the board (Shleifer and Vishny 1997). Like most Anglo-Saxon countries, India has a system of one-tier boards (Van Thiel 2015). However, owing to the presence of non-executive members, these boards seem to have a mixed combination (type I and type II) (Van Thiel 2015). These boards assume greater importance as they are one of the instruments that principals can use to monitor the agent’s performance (Beasley et al. 2006). In addition, the view based on stewardship theory highlights the role of the board as a partner to help improve the organization’s performance (Davis et al. 1997). Further, in the democracy perspective, the board represents society and the general interest. Another model based on stakeholder theory assumes that board members represent specific interests. In the most widely acknowledged model, board members are nominated to help the organization by importing knowledge, contacts, and other important resources that the organization can use to further its goals (Cornforth 2003). Accordingly, the quality of governance structure appears to be a pertinent factor in the performance management of PSUs (Van Thiel 2015). It is essential to have a governance structure that not only exudes integrity, fairness, impartiality, and expertise (Higgs Report (Higgs 2003)) but is also diverse, independent, and pragmatic (Davies Report 2011). Recognizing the significance of robustness of governance for efficient performance management, we suggest a governance index for the quality of governance structure.
Further, in view of the strategic importance of PSUs in the Indian economy, it appears pertinent to have a comprehensive measure of their risk levels, which can serve as a guide in their performance measurement and management (Power 2004). Therefore, the paper puts a risk index to gauge the exposure levels of companies, which has been tested and validated using the data of Indian PSUs. In the process, it was observed that a few Indian PSUs have contingent liabilities to the tune of 510 million US dollars. Being an off-balance sheet item, they are often neglected, but if materialized, they could jeopardize the operations and endanger the very survival of the firm. As a result, a new ratio has been developed in the paper to deal with contingent liabilities. Similarly, the defensive interval ratio tends to neglect the interest obligations, but Indian PSUs tend to be highly leveraged, and as such, a ‘modified defensive interval ratio’ is warranted and has been put forth in the paper.
Based on diff-GMM regression, the empirical evidence suggests that PSUs that do well in terms of indices perform better and are able to generate higher returns. Specifically, when risky PSUs have better governance structures (as per the governance index), they tend to be more efficient in the use of their resources. Such results lend credence to the indices suggested in the study. Accordingly, these indices may serve as benchmarks for performance evaluation, facilitate identification of critical areas, aid the auditors, and may serve as reference points for regulators to develop a Basel-like framework for PSUs. In addition, the quality of governance structure, as demonstrated by the governance index, may be taken as a signal of efficiency, accountability and transparency exercised in the PSU (Alexius and Örnber 2015).
In the next section, a theoretical discussion of the performance management of PSUs is presented. In the Section 3, both indices have been developed, followed by a description of data and methodology. Empirical analysis and discussion have been presented in subsequent sections. Finally, the paper concludes with implications and scope for future research.

2. Theoretical Discussion

The efforts to ‘reinvent the public sector’ led to the emergence of New Public Management (NPM). NPM primarily revolves around performance management practices (Hood 1991). These practices mainly include goal setting, decision rights allocation, and performance measurement and evaluation. However, the movement to improve the performance of PSUs started to gain momentum in the early 2000s (Fryer et al. 2009). The effects were apparent across the globe, though in varying degrees. Yet, an emerging economy like India, which was founded on the principles of a mixed economy (Jain et al. 2014), did not join the movement and is now finding its PSUs in the doldrums (Gupta et al. 2014) and is awaiting a reform.
The first and foremost step in performance management is performance measurement (Swiatczak et al. 2015). Though the use and quality of performance indicators have been evolving (Kennerley and Neely 2002; Johnson 2005), ‘devising good indicators of quality is still hard’ (Zineldin 2006). Initially, financial indicators were more prevalent, but gradually other indicators (e.g., quality) were introduced. This has led to a proliferation of indicators (Modell 2004; Carlin et al. 2004) but not always an improvement in the quality of the indicators themselves (Lemieux-Charles et al. 2003). As a result, there are four types of indicators: output based, welfare based, performance based and composite indicators that combine all three (Stevens and Zimmerman 2006). Further, Macpherson (2001) states that the most useful numbers are those pertaining to planning, prediction, and budget.
Several authors have proposed various frameworks to assess organization’s activity, few being performance prism (Neely and Adams 2001) or the Balanced Scorecard (Kaplan and Norton 1996). Rouse and Putterill (2003) provide a critique of these frameworks and outlines an alternative framework consisting of multi-dimensional views and evaluation frameworks to reflect the variety of stakeholders. However, there is no single framework that suits all organizations (Pun and White 2005). Further, choosing an inappropriate measure may lead to goal-incongruence and exploitation of organizational resources (Alexius et al. 2014).
It is in this context that Rangan (2004) and Kaplan (2001) advocate that goal clarity and measurability of results are of foremost importance to preventing the diffusion of organizational energy. Effective programs and their efficient implementation could be achieved by focusing on controls, i.e., focusing on either output controls, action controls, or clan controls or a mix of these. Output-based controls or performance measurement have been a subject of great debate, resulting in a shift towards outcome-based measures (Guthrie and English 1997). Despite this shift, the ambiguity in objectives remains a cause of concern (Pollanen 2005), and that is what precisely needs to be addressed.
Post-NPM reforms attempted to address a few of these concerns by suggesting different governance modes that are believed to have improved the effectiveness of governance in PSUs. A few of those governance models are ‘Neo-Weberianism’ (Pollitt and Bouckaert 2011), ‘joined-up government’, and ‘whole of government’ (Christensen and Laegreid 2007, 2011b; Stoker 2006). The post-NPM era heralds integration, coordination, and cooperation. New governance mechanisms based on self-governance modes, thus seek to create a strong and unified sense of values and goals to enhance engagement and commitment of all involved parties to contribute to public-task fulfilment (Frost and Morner 2011; Sørensen and Triantafillou 2009). Post-NPM approaches create governance frameworks that foster decentralized steering and mutual monitoring. This new approach help the managers of PSUS to foster their problem-solving and self-steering capacities (Sørensen and Triantafillou 2009; Wälder and Morner 2013).
At first sight, post-NPM measures seem to be in contradiction with NPM measures (Swiatczak et al. 2015). Alternatively, some scholars regard a combination of diverse governance modes as an opportunity (Christensen and Laegreid 2011a; Christensen 2012). One argument favoring this view is that integrated governance modes respond more flexibly to dynamic and complex governance settings (Bruton et al. 2015; Christensen and Laegreid 2007; Egeberg and Trondal 2009; Grandori 1997, 2001). However, many governance modes are founded on partly inconsistent mechanisms and principles (Christensen and Laegreid 2011a).
Though there is a plethora of literature on boards, most studies relate to boards in private organizations (Jegers 2009), however, little is known about governance structures in PSUs (Hinna et al. 2010; Cornforth 2011). Most of the studies have focused on the composition, size, and diversity of boards and the effects thereof on the performance of the organization (Huse 2007). The few studies that have examined boards of PSUs have primarily looked at specific aspects like the accountability, particularly in relation to the role of regulatory authorities before and during the financial crisis, the application of governance codes, and the remuneration of board members (Hinna et al. 2010; Cornforth 2011). Special aspects like the appointment of politicians are sometimes studied as well, under the heading of patronage (Van Thiel 2012). However, importance and role of the board or governance for performance management in PSUs remain an under-researched area. It is in this background that few Asian countries have now begun the ‘institutionalization’ of performance management, yet most governments attempt to apply ‘result-based management’ (Koike 2013).
The problems associated with performance management are more profound in developing economies, such as India, due to lethargic bureaucracy, patrimonial culture (Koike 2013), red-tapism, and nepotism. Therefore, several researchers have attempted to examine the performance of Indian PSUs, particularly Central PSUs. Singh and Chittedi (2011) observed a significant improvement in the performance of PSUs in the post-liberalization era. Similarly, Gupta et al. (2011a) noted a significant improvement in the performance of PSUs that entered a Memorandum of Understanding with the government. In contrast, disinvestment did not lead to desired outcomes (Gupta et al. 2011b). Interestingly, Ramamurti (1987) documents that most Indian PSUs consider commercial profitability as the measure of their success. He observed that the profit motive in India was stronger than in countries with mixed enterprises or which are more right-winged.
Müller (2000) suggests that the under-performance of PSUs may be attributed, to a marked extent, to the entailing complex governance structure. The complications are intensified with the interference of the government (Simpson 2014). For instance, the top three Indian PSUs accounted for 74.35% of the total loss of all PSUs in 2011–2012. These companies have been incurring losses consecutively since 2009. A survey by Gupta et al. (2011a) leads to a recommendation that directors of PSUs should not involve themselves in the day-to-day functioning of the organization.
In contrast, China has come a long way, considering its experience with privatization. China’s ‘open policy’ of the 1980s to improve the efficiency of state-owned enterprises was based on the twin pillars of privatization and consolidation. Privatization led to productivity gains of over 170 per cent in Chinese firms (Zhangkai Huang et al. 2020). Apart from this, it is also argued that, apart from privatisation, focus on building core competencies of the Chinese state-owned enterprises also played an effective role (Barney 1991, 1995; Cheng and Bennett 2006).
Despite several studies attempting to measure performance measurement, there is no conclusive evidence on the effects of performance measurement (De Bruijn 2002). On the one hand, it brings transparency (Osborne and Gaebler 1992) and helps in shaping accountability (De Bruijn 2001); on the other hand, it prompts game-playing (De Bruijn 2003) and blocks innovation (Smith 1993). To overcome these issues, De Bruijn (2003) suggests an outcome-based measure of performance instead of an output-based measure and has defined the rules of the game.
Therefore, in view of the above and the state of Indian PSUs, it seems imperative that a framework/model is developed that leads to better utilization of resources of PSUs, resulting in improved firm performance (Maheshwari and Ahlstrom 2004).
Accordingly, the primary objective of the study is to suggest measures that may lead to improvement in the performance of PSUs. In order to achieve this objective, two normative frameworks (one relating to risk levels and the other relating to governance structure) are being put forth.

3. Development of Indices

3.1. Development of a Risk Index

The ambiguity of objectives has been a major roadblock in the performance of companies, particularly PSUs, as ambiguous objectives could be a fall out of political control (García 2014). Consequently, there needs to be a benchmark or a broader frame of reference with respect to various operational aspects, particularly risk. Risk is considered a product of exposure, impact, and frequency. Publicly available information can be one of the factors in assessing risk associated with a particular company but, it cannot be the sole factor. Financial information from the financial statements can be used in estimating with some accuracy the part of risk which is the exposure. Thus, ratios can be used as excellent indicators of various risks. Following this stream of thought and taking inspiration from the work of Tamari (1966), development of a risk index (more appropriately, an ‘exposure index’) has been attempted in this study. This may also be viewed as normative ‘tolerance limits’ for various risks.
In the construction of the risk index, the initial step would be to identify the risks that affect a PSU. Logically, the ‘one size fits all’ analogy of considering all the possible risks would not be appropriate since every company is unique in terms of features such as organizational features, culture features, risk appetite, tolerance, and management practices. Therefore, based on literature and expert opinion, only those risks have been focused upon, which are believed to be pervasive and material. Committee of Sponsoring Organization of Treadway Commission (COSO) also propagates management by exception. In operational terms, the focus should be on the most important risks only. Accordingly, the following risks were identified for the study: accounting risk, attrition risk, competition risk, credit risk, customer satisfaction, interest rate risk, liquidity risk, market risk, operational risk, risk of overdependence on a product or division, risk related to innovation, solvency risk, and taxation risk. Due to unavailability of accurate and reliable data on some of the risks, only the following eight risks could be considered for the construction of the index: market risk, accounting risk, competition risk, contingency risk, credit risk, liquidity risk, operating risk, and solvency risk. Muzzy (2008) also advises the use of a filtering process to limit the number of manageable risks to 10 or fewer.
Every risk has been coded on a scale of 1 to 5 (Table 1), where 1 represents the least risky proposition, and 5 is the riskiest one. Thus, with eight risks considered with coding, the minimum risk index value a company can have is 8, and the maximum would be 40. It can also be noted that every risk score and its corresponding risk scale has been duly verified and validated by experts (both academic and industry). Further, the index values obtained for various companies have been expressed in percentage terms. The maximum possible index value of 40 has been taken as the base to express the computed index values in percentage form. So, if a company scores 1 on each of the eight risks, its risk index value will be 8; but as a percentage of the maximum possible risk index value (i.e., 40), it will be 20 per cent (i.e., 8/40). Similarly, if a company has 80 per cent risk exposure, it will have a computed risk index value of 32 (i.e., 80 per cent of 40). In terms of interpretation, the lower the index value, the lower the risk and vice-versa. (Shivaani and Agarwal 2020).
It may be noted that the relevance and importance of every risk depend on its severity and probability, which as outside parties, with access only to the publicly available information, is difficult for us to gauge. Therefore, giving more importance (weights) to one risk than the other is impossible. Further, the primary objective of the study was to set in motion a conversation on the usefulness of accounting information as an indicator of vulnerabilities that these companies are/may be exposed to and to provide a generic framework for risk measurement of PSUs. The framework may be modified by companies in view of the idiosyncrasies and peculiarities of their business environment.

3.2. Development of a Corporate Governance Index

Corporate governance may be defined as the system by which companies are directed and controlled (Cadbury Report 1992). In the present turbulent times when companies are fraught with risks and uncertainty, the quality of governance and the robustness of its structure assume greater significance. In other words, governance is a form of stakeholder protection (John et al. 2008). Therefore, the governance structure is expected to play a key role in effective and efficient risk management. Moreover, risk management is the responsibility of executive management, while risk governance is the responsibility of the board. The board establishes the firm’s general risk philosophy and risk tolerance and provides a framework of the company’s risk policies and procedures so that management implements a robust risk management program. An appropriate risk governance structure may reduce the incidence of agency problems which is generally created by separation of ownership and control. In addition, it may be a control mechanism to deter managers from reckless risk taking. A proper risk governance structure will also ensure timely and adequate identification, measurement, and monitoring of risks.
A strong governance structure may act as a deterrent to excessive risk appetite. An excessive risk appetite may limit the company’s potential to exploit business opportunities and put constraints on its business strategy. Therefore, a strong governance structure (Goddard 2005) is required to keep in check excessive risk taking. In addition, most Asian PSUs follow a market-oriented competitive governance model (Koike 2013). Accordingly, the corporate governance index (CGI), which is based on eleven variables, namely, size of the board, board diversity in terms of gender, proportion of executive directors, executive/non-executive status of chairpersons, proportion of independent directors, CEO duality, chief risk officer (CRO), risk management committee, mandatory committees, voluntary committees, and existence/non-existence of whistleblower policy, is being proposed. (Shivaani et al. 2019; Shivaani and Agarwal 2020).
The variables used to construct the CGI, along with the scales assigned to them, have been shown in Table 2a,b. The governance indexes can range between 15 and 55. For further analysis, the index has been expressed in percentages.

4. Data and Methodology

The sample consists of all 39 PSUs in the Nifty 500 Index. As of 31 March 2017, the Nifty 500 Index represents about 95.2% of the free-float market capitalization of the stocks listed on NSE. Further, these PSUs, together with a market capitalization of about INR 10 lakh crores, constitute 8.5% of NIFTY 500 Index1. The study covers a 10-year period from 1 April 2005 to 31 March 2015. Financial data is collected from a data base called Ace Equity. Further, for Risk disclosure and fields of governance the data are hand collected from individual annual reports of the relevant firms culled from databases such as Bloomberg.
Return on assets (ROA) (Parthasarathy et al. 2006) and return on equity (ROE) have been used as proxies of firm performance. The control variables used in the model include the age of the firm (Ahuja and Majumdar 1998), growth rate of the firm, and size of the firm (Ahuja and Majumdar 1998). A dummy variable has also been used to factor in the effects of recession (though the period of recession has been explicitly defined by NBER for the US, a definite period could not be traced for India). Singh et al. (2016) suggest that as per the UNCTAD’s investment brief, worldwide flows came down by nearly 20% towards the second half of 2007–2008; therefore, it appears reasonable to consider the period from 2005–2008 as the pre-recession period and 2008–2015 as the post-recession period for Indian companies. Further, given the panel nature of data and the possibility of endogeneity, dynamic panel data-generalized method of moments (DPD-GMM) regression has been used (Arellano and Bond 1991; Wintoki et al. 2010).
Due to the use of panel data methodology in the study, the method can control for unobservable heterogeneity (Hsiao 2003), with significant reduction or elimination of estimation bias and potential problems of data multicollinearity (Hsiao 2003). The main advantage of using the panel data is mainly to control for unobservable firm-specific effects (Baltagi 1995). Despite these various advantages, the presence of autocorrelation might exist with data considered for longer periods (Simon 2015). However, the study considers short panel data, which makes it less exposed to the problem of autocorrelation (Simon 2015). Seminal studies by Wintoki et al. (2010) suggested that endogeneity could arise on account of (i) simultaneity, (ii) unobservable heterogeneity, and (iii) dynamic endogeneity. In this study, Arellano and Bond’s (1991) two-step generalized method of moments (GMM) approach with lagged variables of the dependent variable is thus used to nullify the potential problem of endogeneity and multicollinearity of the study variables (Arellano and Bond 1991; Arellano and Bover 1995; Windmeijer 2005).
Thus, the following model has been used:
ROA it = α +   β 1 ROA i , t 1 + β 2 CGI it + β 3 RI it +   β 4 Age it + β 5 Size it +   β 6 Growth it + β 7 Recesison   dummy it +   ε it
ROE it = α +   β 1 ROE i , t 1 + β 2 CGI it + β 3 RI it +   β 4 Age it + β 5 Size it +   β 6 Growth it + β 7 Recesison   dummy it +   ε it
where ROAit is the return on assets in company i at time t; β1 is the growth elasticity of ROA. Similarly, ROEit is the return on equity in company i at time t; β1 is the growth elasticity of ROE. Descriptions of other variables are provided in Table 3. eit is the idiosyncratic error term. In order to examine the time-varying nature of CGI and risk index across the industries considered, panel plots were obtained using the Grammar of Graphics (ggplot) library using R-programming. A first generation panel stationarity test was conducted on the individual variables considered using the Levin, Lin, Chu (LLC) as proposed by Levin et al. (2002), which is based on the assumption of independent cross-sectional units. Based on the tests conducted, all the variables were considered to be stationary at level except for the size variable. The size variable depicting net total assets of the company was found to be stationary at the first difference, and thus log of the size variable was considered for the study.

5. Empirical Analysis

The descriptive statistics in Table 4 suggest that the average ROA of the sample companies is around 11.5%, and the average ROE is around 15%. Given the fact that the period of study includes the period of recession as well, such returns seem satisfactory. Similarly, an average risk index of around 45 per cent is worth mentioning. It highlights the fact that implementation of hybrid regulatory models through Public-Private Partnership (PPP) may provide a strong incentive for managers to bring more efficiency. Irrespective of these companies being present for a longer period on average, state ownership of the firms has continued to make these firms incompetent and incapable of competition. However, the objective with which the PSUs were envisioned still seems a far-fetched dream. The much-needed improvement in governance structures of PSUs is evident from the low mean CGI score of around 62 per cent. Risk index and CGI values point towards the underutilized institutional capacity and weaker regulatory commitments. An in-depth analysis revealed it is primarily on account of non-compliance with even the basic governance parameters, such as a minimum number of independent or non-executive directors.
Further, the results in Table 5 indicate that both ROA and ROE of the current year are significantly and positively associated with the ROA and ROE of the immediately preceding year, respectively.
The corporate governance index is positively related to both ROA and ROE, indicating that with the improvement in governance structure, PSUs tend to perform better. Considering the components of CGI, it may be suggested that (i) PSUs appoint separate a CEO and chairperson, (ii) ensure adequate representation of women on boards, (iii) appoint a Chief Risk Officer, and (iv) constitute a risk management committee.
The results also indicate that there is a negative association between risk index and returns. In other words, those PSUs which have lower risk in terms of the normative framework (developed in the paper) can generate higher returns. A recession dummy is negatively related to ROA and ROE at 1% significance level, indicating returns are negatively impacted during a recession. The null of the Wald test was rejected in all estimated models, so all coefficients are different from zero. These results not only validate the framework used to develop the risk index but also provide a yardstick for PSUs to benchmark their risk-taking if they want to maximize their ROA and ROE.

6. Additional Analysis and Tests of Robustness

The results above primarily indicate the effect of CGI when RI is zero and vice-versa. However, such a model seems unrealistic as both the forces, quality of governance structure, and risk levels are operational at any given point in time. Therefore, it seems reasonable to examine the effects of possible interaction between the two variables. A preliminary graphical investigation of CGI and RI with respect to returns revealed distinctly non-parallel lines, suggesting interaction effects amongst the variable of interest. Accordingly, an interaction variable (RI*CGI) has been introduced, and the modified model is as follows:
Y i t = α + β 1 Y i , t 1 + β 2 C G I i t + β 3 R I i t + β 4 ( R I * C G I ) i t + β 5 A g e i t + β 6 S i z e i t + β 7 G r o w t h i t + β 8 P R e c e s i s o n   d u m m y i t + ε i t
where Y denotes ROA, ROE, standard deviation of return (risk), and average return (equity) of the company. Columns (1) and (2) of Table 5 clearly highlight the interaction effects of RI and CGI on returns. The RI continues to be negatively associated with returns, but in the presence of interaction terms, the coefficient of CGI terms is also negative. When viewed in conjunction with a positive coefficient of interaction, the results suggest that firms with higher risk can improve their returns by having a better-quality governance structure. However, for firms with lower risk levels, quality governance structure comes at a cost, as they tend to have lower returns. In other words, risk levels (RI) act as moderating variables, influencing the relation between the quality of governance structure and returns.
It is pertinent to note that as the study is exploratory in nature, it is imperative to ensure the robustness of the models and results. For that reason, equity returns of a firm as well as the most widely accepted measure of risk, standard deviation, have been taken to corroborate the results. Clearly, the results presented in columns (3) and (4) are in line with the results of columns (1) and (2), thus, making the suggested normative frameworks warranting implementation.

7. Analysis of PSU Performance over Time Using Panel Data

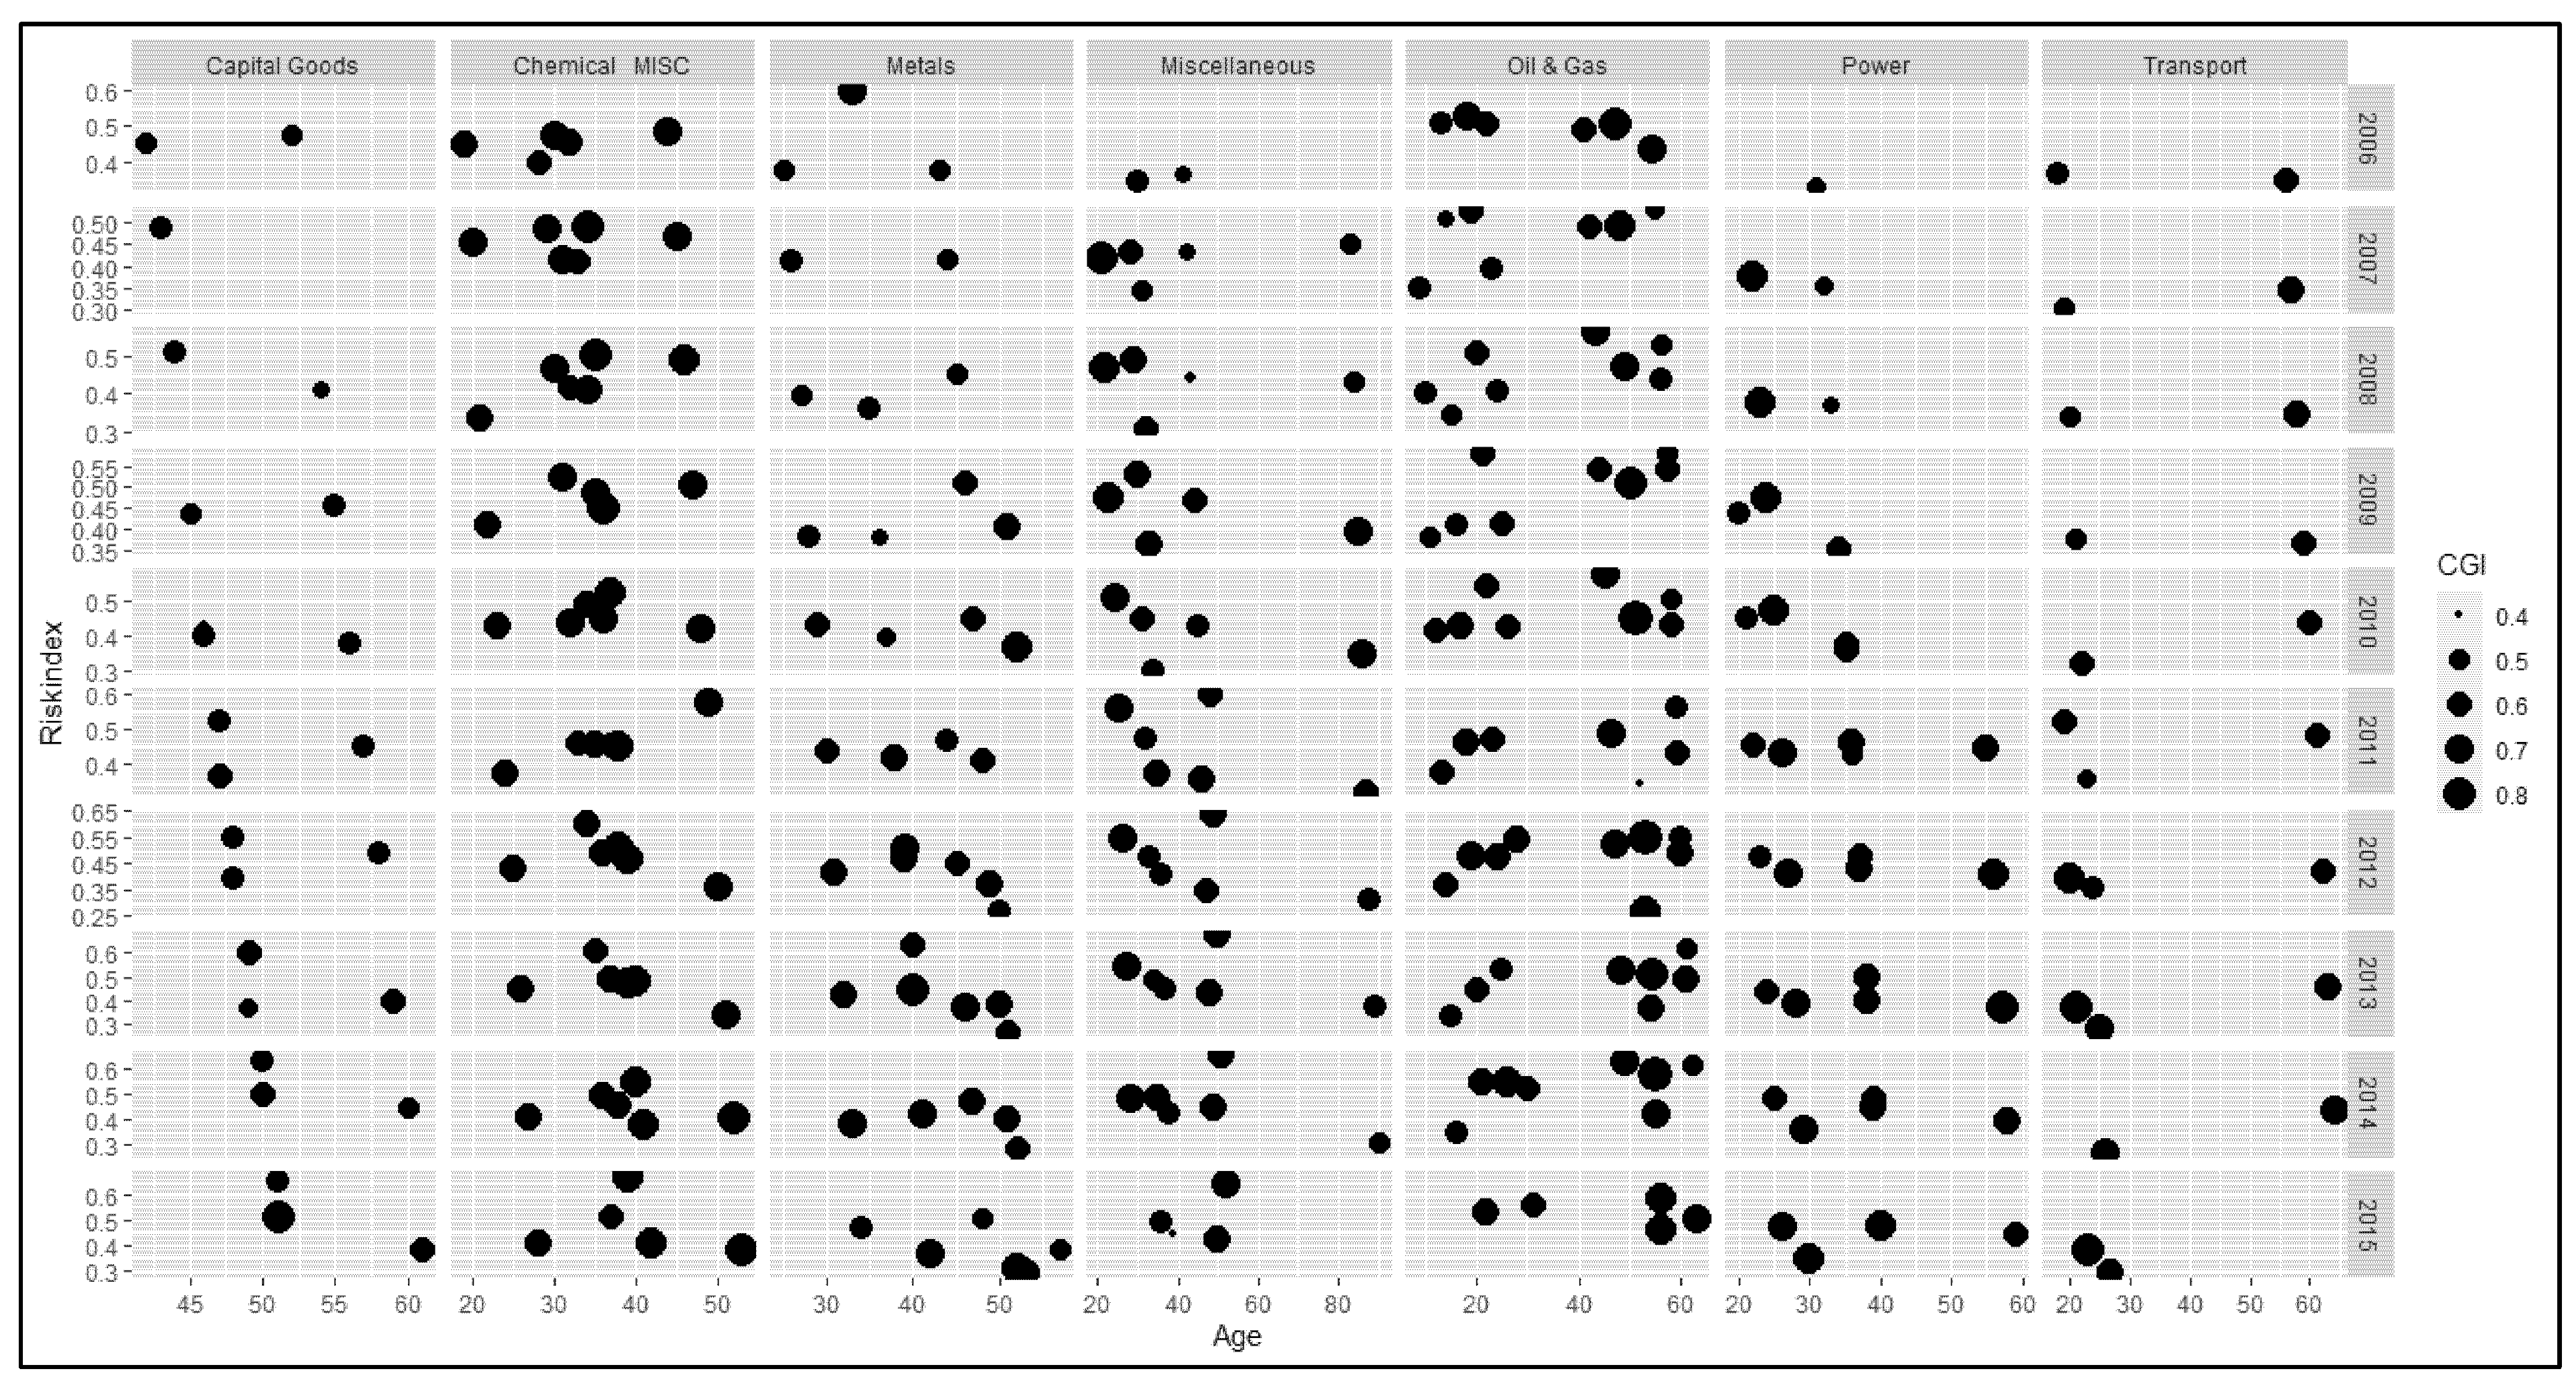
Figure 1 shows a panel plot of the age of the companies within each sector compared with the risk index over time. The size of the bubbles represents the CGI index values. Figure 1 shows the interaction effects of the risk index and CGI as observed in Table 5 and Table 6, with age being the independent variable. It is evident from Figure 1 that, except for the transport sector, most of the companies in other sectors were incorporated more than 30 years ago, on average. Despite doing business for so long and being the pioneers in their fields, the risk index seems to have changed insignificantly over time. Thus, the age of the companies is not in conjunction with the reduction in risk index across all sectors, thereby highlighting inefficiencies prevailing in the companies across the sectors. PSUs play a critical role in organized industrial activity of emerging economies and are expected to deploy their resources efficiently to accelerate the rate of expansion (Ramamurti 1987). However, their performance has been largely dismal, with panel plots showing the risk index remained high with no significant change over the years. As a result, there is an urgent need to develop frameworks for the performance management of these inefficient and ineffective PSUs (Nakamura and Warburton 1998). Inefficiencies of the companies prevail over time with no significant improvements in the risk index. One positive aspect seems to be a slight improvement in the CGI over the years across the following sectors: capital goods, metals, oil and gas, power, and transport. However, worrisome development is that, irrespective of the governance structure put in place as reflected by CGI, there seems to be no role of the structure in effective and efficient risk management as reflected by the risk index. From 2006 to 2015, a significant number of disinvestments took place in India. Irrespective of the government’s ambitions towards privatization, the issue of PSU disinvestments remained a contentious issue due to a lack of focus on core competencies and the government still retaining control of the management irrespective of higher CGI observed in key sectors where disinvestments were proposed. In the case of the following three sectors: chemical miscellaneous, oil and gas, and miscellaneous, though CGI index values have been high from the beginning of the study period, there seems to be no reduction in the risk index with the age of the companies in the sectors. This points towards poor quality of governance and lack of robustness in these sectors.
This paper thus provides evidence that the companies that do well in terms of the risk index and governance index developed in the paper are able to demonstrate better performance. Such benchmarks/models/frameworks may be prescribed for PSUs to ensure effective and efficient work on their part. Though the frameworks seem to be practical, caution needs to be taken while implementing them.

8. Concluding Observations

PSUs are the catalyst in the socio-economic development of emerging economies, such as India. Yet, the mere incorporation of PSUs is not a guarantee for social and economic returns. This paper shows that maintaining a high-quality governance structure in the face of high risk is the key to generating higher returns. The governance- and risk-related dimensions dealt with in the paper are, in fact, complementary to the perspective set out by new public management. In this light, the paper is perhaps the first of its kind in general and in the context of a prominent emerging economy (India) that provides and validates a risk index and governance index. While constructing the CGI, certain non-compliances were observed, even in terms of mandatory requirements, such as the proportion of independent directors. Such infringements call for stringent penal provisions and better monitoring of PSUs. Further, if the normative frameworks are adhered to as per the study by the Securities and Exchange Board of India (SEBI) and Ministry of Corporate Affairs (MCA), PSUs may take more effective and efficient decisions with lower risks, and hassle-free management resulting in better return on assets and return on equity.
Finally, we would like to mention the primarily empirical limitations of this research. Risks, such as risks related to innovation and technological changes, could not be considered due to the unavailability of data. Though the data set may appear old, it has only been used to test the risk index and analyze the results. Further, being exploratory in nature, the indices have scope for improvement. The new datasets may further check for compliance and its effect on the results. We strongly believe that cross-country analysis based on these indices may help evolve these frameworks and would make a tangible contribution to the paradigm of new public management.

Author Contributions

Conceptualization, V.G. and S.M.; Methodology, S.M.; Writing—Original Draft, S.M. and V.G.; Data Curation, V.G.; Formal Analysis, V.G.; Writing—Review and Editing, S.M. and D.R.N.; Project Administration, S.M.; Software, D.R.N.; Validation, D.R.N. All authors have read and agreed to the published version of the manuscript.

Funding

This research received no external funding The APC was paid by Suneel Maheshwari on 11 May 2022. Depending upon availability of competitive money with graduate school at Indiana University of Pennsylvania, Dr. Suneel Maheshwari will apply for reimbursement of partial APC. There is no automatic reimbursement of APC.

Institutional Review Board Statement

Not applicable.

Informed Consent Statement

Not applicable.

Data Availability Statement

Financial data is collected from a data base called Ace Equity. Further, for Risk disclosure and fields of governance the data are hand collected from individual annual reports of the relevant firms culled from databases such as Bloomberg.

Conflicts of Interest

The authors declare no conflict of interest.

Note

1
NIFTY500 index represents the top 500 companies based on full market capitalisation from the eligible universe. It represents about 95.2% of the free-float market capitalisation of the stocks listed on NSE as on 31 March 2017.

References

  1. Ahuja, Gautam, and Sumit Majumdar. 1998. An assessment of the performance of Indian state-owned enterprises. Journal of Productivity Analysis 9: 113–32. [Google Scholar] [CrossRef]
  2. Alexius, Susanna, and Jenny Cisneros Örnber. 2015. Mission(s) impossible? Configuring values in the governance of state-owned enterprises. International Journal of Public Sector Management 28: 286–306. [Google Scholar] [CrossRef]
  3. Alexius, Susanna, Jutterstrom Mats, and Martin Rosenström. 2014. Intervention markets and market re-organization. Paper presented at the Score International Conference on Organizing Markets, Stockholm, Sweden, October 16–17. [Google Scholar]
  4. Almqvist, Roland, Giuseppe Grossi, Jan van Helden, and Christoph Reichard. 2013. Public sector governance and accountability. Critical Perspectives on Accounting 24: 479–87. [Google Scholar] [CrossRef] [Green Version]
  5. Arellano, Manuel, and Olympia Bover. 1995. Another look at the instrumental variable estimation of error components models. Journal of Econometrics 68: 29–51. [Google Scholar] [CrossRef] [Green Version]
  6. Arellano, Manuel, and Stephen Bond. 1991. Some tests of specification for panel data: Monte Carlo evidence and an application to employment equations. The Review of Economic Studies 58: 277–97. [Google Scholar] [CrossRef] [Green Version]
  7. Baltagi, H. Badi. 1995. Econometric Analysis of Panel Data. New York: John Wiley and Sons. [Google Scholar]
  8. Barney, Jay B. 1991. Firm resources and competitive advantage. Journal of Management 17: 99–120. [Google Scholar] [CrossRef]
  9. Barney, Jay B. 1995. Looking inside for competitive advantage. Academy of Management Executive 9: 49–61. [Google Scholar] [CrossRef] [Green Version]
  10. Beasley, Mark S., Richard Clune, and Dana R. Hermanson. 2006. The Impact of Enterprise Risk Management on the Internal Audit Function. Institute of Internal Auditors (IIA) Research Foundation and the Assistance of Don Sparks of the IIA. Available online: https://erm.ncsu.edu/az/erm/i/chan/library/ERMJFAPaper21306.pdf (accessed on 17 July 2021).
  11. Bruton, Garry, Susanna Khavul, Donald Siegel, and Mike Wright. 2015. New financial alternatives in seeding entrepreneurship: Microfinance, crowdfunding, and peer-to-peer innovations. Entrepreneurship Theory and Practice 39: 9–26. [Google Scholar] [CrossRef]
  12. Büge, Max, Matias Egeland, Przemyslaw Kowalski, and Monika Sztajerowska. 2013. State-Owned Enterprises in the Global Economy: Reason for Concern? Available online: https://voxeu.org/article/state-owned-enterprises-global-economy-reason-concern (accessed on 24 July 2021).
  13. Burkert, Michael, Franz Michael Fischer, and Utz Schäffer. 2011. Application of the controllability principle and managerial performance: The role of role perceptions. Management Accounting Research 22: 143–59. [Google Scholar] [CrossRef]
  14. Cadbury Report. 1992. Report of the Committee on the Financial Aspects of Corporate Governance: The Code of Best Practices. London: Gee (A Division of Professional Publishing Ltd.). [Google Scholar]
  15. Carlin, Wendy, Mark Schaffer, and Paul Seabright. 2004. A minimum of rivalry: Evidence from transition economies on the importance of competition for innovation and growth. Contributions in Economic Analysis & Policy 3: 241–85. [Google Scholar]
  16. Cheng, Jeremy, and David Bennett. 2006. Strategies for performance improvement in the Chinese chemical industry: Evidence from case study investigations. Journal of Technology Management in China 1: 190–207. [Google Scholar] [CrossRef]
  17. Christensen, Tom. 2012. Global ideas and modern public sector reforms: A theoretical elaboration and empirical discussion of a neo institutional theory. The American Review of Public Administration 42: 635–53. [Google Scholar] [CrossRef]
  18. Christensen, Tom, and Per Laegreid. 2007. Modern regulatory policy—Ideals and practice. Policy and Society 26: 9–37. [Google Scholar] [CrossRef] [Green Version]
  19. Christensen, Tom, and Per Laegreid. 2011a. Complexity and hybrid public administration—Theoretical and empirical challenges. Public Organization Review 11: 407–23. [Google Scholar] [CrossRef] [Green Version]
  20. Christensen, Tom, and Per Laegreid. 2011b. Democracy and administrative policy: Contrasting elements of New Public Management (NPM) and post-NPM. European Political Science Review 3: 125–46. [Google Scholar] [CrossRef]
  21. Cornforth, Chris. 2003. The Governance of Public and Non-Profit Organisations: What Do Boards Do? London: Routledge. [Google Scholar]
  22. Cornforth, Chris. 2011. Limitations of the focus on boards and suggestions for new directions. Nonprofit and Voluntary Sector Quarterly 41: 1116–35. [Google Scholar] [CrossRef] [Green Version]
  23. Davies Report. 2011. Women on Boards. Department for Business, Innovation & Skills. Government of UK. Available online: https://www.gov.uk/government/news/women-on-boards (accessed on 12 July 2021).
  24. Davis, James H., F. David Schoorman, and Lex Donaldson. 1997. Toward a stewardship theory of Management. Academy of Management Review 22: 20–47. [Google Scholar] [CrossRef]
  25. De Bruijn, Hans. 2001. Managing Performance in the Public Sector. Routledge: London. [Google Scholar]
  26. De Bruijn, Hans. 2002. Performance measurement in the public sector: Strategies to cope with the risks of performance measurement. International Journal of Public Sector Management 15: 578–94. [Google Scholar] [CrossRef]
  27. De Bruijn, Hans. 2003. Output steering in public organizations: About the use of a product approach and a process approach. Managerial Auditing Journal 18: 303–12. [Google Scholar] [CrossRef]
  28. Egeberg, Morten, and Jarle Trondal. 2009. National agencies in the European administrative space: Government driven, commission driven, or networked? Public Administration 87: 779–90. [Google Scholar] [CrossRef] [Green Version]
  29. Frost, Jetta, and Michèle Morner. 2011. Governing collective action: Revisiting the theory of the firm. Paper presented at 2nd Conference Humanizing the Firm and the Management Profession, Barcelona, Spain, June 27–28. [Google Scholar]
  30. Fryer, Karen, Jiju Antony, and Susan Ogden. 2009. Performance management in the public sector. International Journal of Public Sector Management 22: 478–98. [Google Scholar] [CrossRef]
  31. García, Félix Madrid. 2014. Developments and challenges in public sector accounting. Journal of Public Budgeting, Accounting & Financial Management 26: 345–66. [Google Scholar]
  32. Goddard, Andrew. 2005. Reform as regulation—Accounting, governance and accountability in UK local government. Journal of Accounting and Organizational Change 1: 27–44. [Google Scholar] [CrossRef] [Green Version]
  33. Grandori, A. 1997. Governance structures, coordination mechanisms and cognitive models. Journal of Management & Governance 1: 29–47. [Google Scholar]
  34. Grandori, Anna. 2001. Organization and Economic Behavior. London: Routledge. [Google Scholar]
  35. Gupta, S., P. K. Jain, and S. S. Yadav. 2014. Public Sector Enterprises in India. New Delhi: Springer India. [Google Scholar]
  36. Gupta, Seema, P. K. Jain, and Surendra S. Yadav. 2011a. Impact of MoU on financial performance of public sector enterprises in India. Journal of Advances in Management Research 8: 263–84. [Google Scholar] [CrossRef]
  37. Gupta, Seema, P. K. Jain, Surendra S. Yadav, and V. K. Gupta. 2011b. Financial performance of disinvested central state-owned enterprises in India: An empirical study on select dimensions. Journal of Applied Finance and Banking 1: 57–67. [Google Scholar]
  38. Guthrie, James, and Linda English. 1997. Performance information and programme evaluation in the Australian public sector. International Journal of Public Sector Management 10: 154–64. [Google Scholar] [CrossRef]
  39. Higgs, Derek. 2003. Review of the Role and Effectiveness of Non-Executive Directors; Report of the Department of Trade and Industry. London: Department of Trade and Industry. Available online: www.dti.gov.uk/cld/non_exec_review (accessed on 26 July 2021).
  40. Hinna, Alessandro, Ernesto De Nito, and Gianluigi Mangia. 2010. Board of directors within public organisations. International Journal of Business Governance and Ethics 5: 131–56. [Google Scholar] [CrossRef]
  41. Hood, Christopher. 1991. A public management for all seasons? Public Administration 69: 3–19. [Google Scholar] [CrossRef]
  42. Hsiao, Cheng. 2003. Analysis of panel data. In Econometric Society Monographs. Cambridge: Cambridge University Press, vol. 34. [Google Scholar]
  43. Huang, Zhangkai, Jinyu Liu, Guangrong Ma, and Lixin C. Xu. 2020. The Transformative Effects of Privatization in China: A Natural Experiment Based on Politician Career Concern. Policy Research Working Paper. Washington: WorldBank Group, Available online: https://openknowledge.worldbank.org/bitstream/handle/10986/33845/The-Transformative-Effects-of-Privatization-in-China-A-Natural-Experiment-Based-on-Politician-Career-Concern.pdf?sequence=1&isAllowed=y (accessed on 3 August 2021).
  44. Hughes, Owen. 2017. Public management: 30 years on. International Journal of Public Sector Management 30: 547–54. [Google Scholar] [CrossRef]
  45. Huse, Morten. 2007. Boards, Governance and Value Creation, 1st ed. Cambridge: Cambridge University Press. [Google Scholar]
  46. Jain, P. K., Seema Gupta, and Surendra S. Yadav. 2014. Public Sector Enterprises in India: The Impact of Disinvestment and Self Obligation on Financial Performance. New Delhi: Springer (India) Private Limited. [Google Scholar]
  47. Jegers, Marc. 2009. Corporate governance in non profit organizations: A nontechnical review of the economic literature. Non Profit Management & Leadership 20: 143–216. [Google Scholar]
  48. John, Kose, Lubomir Litov, and Bernard Yeung. 2008. Corporate governance and risk-taking. The Journal of Finance 63: 1679–728. [Google Scholar] [CrossRef]
  49. Johnson, Clay. 2005. Memorandum for Chief Acquisition Officers, Chief Financial Officers, Chief Information Officers. Subject: Implementing Strategic Sourcing. Available online: www.uspto.gov/web/offices/ac/comp/proc/OMBmemo.pdf (accessed on 24 July 2021).
  50. Kaplan, Robert S. 2001. Transforming the balanced scorecard from performance measurement to strategic management: Part I. American Accounting Association Accounting Horizons 15: 87–104. [Google Scholar] [CrossRef]
  51. Kaplan, Robert S., and D. P. Norton. 1996. Using the balanced scorecard as a strategic management system. Harvard Business Review 74: 75–85. [Google Scholar]
  52. Kennerley, Mike, and Andy Neely. 2002. A framework of the factors affecting the evolution of performance measurement systems. International Journal of Operations & Production Management 22: 1222–45. [Google Scholar]
  53. Khumawala, Saleha B. 1997. Public sector accounting in India: A historical review and an analysis since independence to the economic reforms of the nineties. Journal of Public Budgeting, Accounting & Financial Management 9: 305–30. [Google Scholar]
  54. Koike, Osamu. 2013. Institutionalizing performance management in Asia: Looking East or West? International Journal of Public Sector Management 26: 347–60. [Google Scholar] [CrossRef]
  55. KPMG. 2012. State Owned Enterprises: Unlocking Their Potential. Available online: https://www.kpmg.com/in/en/industry/publications/aima-PSU.pdf (accessed on 14 August 2021).
  56. Lemieux-Charles, Louise, Wendy McGuire, Francois Champagne, Jan Barnsley, Donald Cole, and Claude Sicotte. 2003. The use of multilevel performance indicators in managing performance in health care organizations. Management Decision 41: 760–70. [Google Scholar] [CrossRef]
  57. Levin, Andrew, Chien Fu Lin, and Chia Shang James Chu. 2002. Unit Root Tests in Panel Data: Asymptotic and Finite-Sample Properties. Journal of Econometrics 108: 1–24. [Google Scholar] [CrossRef]
  58. Ling, Tom. 2002. Delivering joined–up government in the UK: Dimensions, issues and problems. Public Administration 80: 615–42. [Google Scholar] [CrossRef]
  59. Macpherson, Malcolm. 2001. Performance measurement in not-for-profit and public-sector organisations. Measuring Business Excellence 5: 13–17. [Google Scholar] [CrossRef] [Green Version]
  60. Maheshwari, Sunil Kumar, and David Ahlstrom. 2004. Turning around a state owned enterprise: The case of scooters India Limited. Asia Pacific Journal of Management 21: 75–101. [Google Scholar] [CrossRef]
  61. Mansi, Mansi, Rakesh Pandey, and Ehtasham Ghauri. 2017. CSR focus in the mission and vision statements of public sector enterprises: Evidence from India. Managerial Auditing Journal 32: 356–77. [Google Scholar] [CrossRef]
  62. Mishra, R. K. 2011. Millennium Development Goals: The Indian Journey. New Delhi: Allied Publishers. [Google Scholar]
  63. Modell, Sven. 2004. Performance measurement myths in the public sector: A research note. Financial Accountability & Management 20: 39–50. [Google Scholar]
  64. Müller, Wolfgang C. 2000. Political parties in parliamentary democracies: Making delegation and accountability work. European Journal of Political Research 37: 309–33. [Google Scholar] [CrossRef]
  65. Muzzy, Ladd. 2008. Approaching enterprise risk management. Financial Executive 24: 59–61. [Google Scholar]
  66. Nabatchi, Tina, Holly T. Goerdel, and Shelly Peffer. 2010. Public administration in dark times: Some questions for the future of the field. Journal of Public Administration Research and Theory 21: 129–43. [Google Scholar] [CrossRef]
  67. Nakamura, Alice O., and William P. Warburton. 1998. Performance measurement in the public sector. Canadian Business Economics 6: 37–48. [Google Scholar]
  68. Neely, Andy, and C. Adams. 2001. The performance prism perspective. Journal of Cost Management 15: 7–15. [Google Scholar]
  69. Osborne, David, and Ted Gaebler. 1992. Reinventing Government: How The Entrepreneurial Spirit Is Transforming the Public Sector. Reading: Addison-Wesley. [Google Scholar]
  70. Parthasarathy, A., K. Menon, and D. Bhattacharjee. 2006. Executive compensation, firm performance and corporate governance: An empirical analysis. Economic and Political Weekly 41: 4139–47. [Google Scholar] [CrossRef]
  71. Pollanen, Raili M. 2005. Performance measurement in municipalities: Empirical evidence in Canadian context. International Journal of Public Sector Management 18: 4–24. [Google Scholar] [CrossRef]
  72. Pollitt, Christopher, and G. Bouckaert. 2011. Public Management Reform: A Comparative Analysis—NPM, Governance and the Neo-Weberian State. Oxford: Oxford University Press. [Google Scholar]
  73. Pollitt, Christopher. 2017. Performance management 40 years on: A review. Some key decisions and consequences. Public Money & Management 38: 167–74. [Google Scholar]
  74. Power, Michael. 2004. The risk management of everything. The Journal of Risk Finance 5: 58–65. [Google Scholar] [CrossRef] [Green Version]
  75. Pun, Kit Fai, and Anthony Sydney White. 2005. A performance measurement paradigm for integrating strategy formulation: A review of systems and frameworks. International Journal of Management Reviews 7: 49–71. [Google Scholar] [CrossRef]
  76. Ramamurti, Ravi. 1987. Performance evaluation of state-owned enterprises. Theory and Practice 33: 876–93. [Google Scholar]
  77. Ramaswamy, Kannan, and William Renforth. 1996. Competitive intensity and technical efficiency in public sector firms: Evidence from India. International Journal of Public Sector Management 9: 4–17. [Google Scholar] [CrossRef]
  78. Rangan, V. Kasturi. 2004. Lofty missions, down-to-earth plans. Harvard Business Review 82: 112–9. [Google Scholar]
  79. Rouse, Paul, and Martin Putterill. 2003. An integral framework for performance measurement. Management Decision 41: 791–805. [Google Scholar] [CrossRef]
  80. Shivaani, M. V., and Nishant Agarwal. 2020. Does competitive position of a firm affect the quality of risk disclosure? Pacific-Basin Finance Journal 61: 101317. [Google Scholar] [CrossRef]
  81. Shivaani, M. V., P. K. Jain, and Surendra S. Yadav. 2019. Development of a risk disclosure index and its application in an Indian context. Managerial Auditing Journal. [Google Scholar] [CrossRef]
  82. Shleifer, Andrei, and Robert W. Vishny. 1997. A survey of corporate governance. The Journal of Finance 52: 737–83. [Google Scholar] [CrossRef]
  83. Simon, Kipeja Benedict K. 2015. Key determinants of China’s outward FDI to Africa. Journal of Economics and Sustainable Development 6: 216–34. [Google Scholar]
  84. Simpson, Samuel Nana Yaw. 2014. Boards and governance of state-owned enterprises. Corporate Governance 14: 238–51. [Google Scholar] [CrossRef]
  85. Singh, Jatinder, and Krishna Reddy Chittedi. 2011. Performance of State-owned enterprises in India: A macro-level analysis. IUP Journal of Managerial Economics 9: 7–25. [Google Scholar]
  86. Singh, Shveta, P. K. Jain, and Surendra Singh Yadav. 2016. Equity Markets in India: Returns, Risk and Price Multiples. New Delhi: Springer (India) Private Limited. [Google Scholar]
  87. Smith, Peter. 1993. Outcome-related performance indicators and organizational control in the public sector. British Journal of Management 4: 135–51. [Google Scholar] [CrossRef]
  88. Sørensen, Eva, and Peter Triantafillou. 2009. The Politics of Self-Governance. Farnham: Ashgate Publishing Limited. [Google Scholar]
  89. Stevens, Bonnie W., and J. Zimmerman. 2006. The use of performance measurement in South Carolina nonprofits. Nonprofit Management and Leadership 16: 315–27. [Google Scholar]
  90. Stoker, Gerry. 2006. Public value management: A new narrative for networked Governance? American Review of Public Administration 36: 41–57. [Google Scholar] [CrossRef] [Green Version]
  91. Swiatczak, Martyna, Michele Morner, and Nadine Finkbeiner. 2015. How can performance measurement systems empower managers? An exploratory study in state-owned enterprises. International Journal of Public Sector Management 28: 371–403. [Google Scholar] [CrossRef]
  92. Tamari, Meir. 1966. Financial ratios as a means of forecasting bankruptcy. Management International Review 6: 15–21. [Google Scholar]
  93. Turner, Mark. 2002. Choosing items from the menu: New public management in southeast Asia. International Journal of Public Administration 25: 1493–512. [Google Scholar] [CrossRef]
  94. Van Thiel, Sandra. 2012. Comparing agencies across countries. In Government Agencies: Practices and Lessons from 30 Countries. Edited by K. Verhoest, S. Van Thiel and G. Bouckaert. Basingstoke: Palgrave MacMillan, pp. 18–26. [Google Scholar]
  95. Van Thiel, Sandra. 2015. Boards of public sector organizations: A typology with Dutch illustrations. International Journal of Public Sector Management 28: 322–34. [Google Scholar] [CrossRef]
  96. Wälder, and Michele Morner. 2013. Competence building in multinational companies: How to establish an organizational ambient for cooperation. Paper presented at Governance of Organizational Competences in International Business, EURAM 13th EURAM Conference, Istanbul, Turkey, June 26–29; pp. 1–29. [Google Scholar]
  97. Windmeijer, Frank. 2005. A finite sample correction for the variance of linear efficient two-step GMM estimators. Journal of Economics 126: 25–51. [Google Scholar] [CrossRef]
  98. Wintoki, M. Babajide, James S. Linck, and Jeffry M. Netter. 2010. Endogeneity and the Dynamics of Internal Corporate Governance. Journal of Financial Economics 105: 581–606. Available online: http://ssrn.com/abstract=970986 (accessed on 21 August 2021). [CrossRef]
  99. Zineldin, Mosad. 2006. The royalty of loyalty: CRM, quality and retention. Journal of Consumer Marketing 23: 430–37. [Google Scholar] [CrossRef]
Figure 1. Panel plot of Risk Index and Age of the companies across various sectors with CGI as the size parameter over time.
Jrfm 15 00225 g001
Table 1. Risks and their corresponding scales used in the construction of the risk index.
Market Risk (Col. 1)Accounting Risk (Col. 2)Competition Risk (Col. 3)Contingency Risk (Col. 4)Credit Risk (Col. 5)Liquidity Risk 1 (Col. 6)Liquidity Risk 2 (Col. 7)Operating Risk (Col. 8)Solvency Risk 1 (Col. 9)Solvency Risk 2 (Col. 10)(Col. 11)
Beta (β)Auditor’s OpinionGrowth/Decline in Market ShareInverse of Contingency Coverage Ratio (ICCR)Credit Risk (CR)Inverse of Acid-Test Ratio (IATR)Modified Defensive Interval Ration (MDI) (in Days)Degree of Operating Leverage (DOL)Total Debt to Equity Shareholders’ Funds (TD/E)Inverse of Interest Coverage Ratio (IICR)Assigned scores
0 < β ≤ 0.95UnqualifiedGrowth0 < ICCR ≤ 0.10 < CR ≤ 0.3 180 < MDIDOL ≤ 0TD/E ≤ 0.33 1
0.667 ≤ IATR ≤ 0.8 IICR < 0.331.25
0.95 < β ≤ 1.05Emphasis of matter0% < Decline ≤ 20%0.1 < ICCR ≤ 0.250.3 < CR ≤ 0.55 90 < MDI ≤ 1800 < DOL ≤ 1.50.33 < TD/E ≤ 0.5 2
IATR < 0.4 0.33 ≤ IICR < 0.52.5
1.05 < β ≤ 2Qualified20% < Decline ≤ 35%0.25 < ICCR ≤ 0.50.55 < CR ≤ 0.75 30 < MDI ≤ 901.5 < DOL ≤ 30.5 < TD/E ≤ 0.6 3
0.4 < IATR ≤ 0.667 OR 0.8 < IATR ≤ 1 0.5 ≤ IICR ≤ 13.75
2 < β ≤ 4Adverse35% < Decline ≤ 50%0.5 < ICCR ≤ 10.75 < CR ≤ 0.95 15 < MDI ≤ 303 < DOL ≤ 50.6 < TD/E ≤ 0.75 4
4 < βDisclaimer50% < Decline1 < ICCR0.95 < CR1 < IATR0 < MDI ≤ 155 < DOL0.75 < TD/E1 < IICR5
Table 2. (a) Summary of variables used to construct risk governance index (RGI) and scores assigned to them. (b). Scores in context of voluntary committees.
(a) Summary of variables used to construct risk governance index (RGI) and scores assigned to them.
Number of Board of Directors (Col. 1)Board Diversity in Terms of Gender (Col. 2)Proportion of Non-Executive Directors (Col. 3)Executive/Non-Executive Chairman (Col. 4)Proportion of Independent Directors on Board (PoID) (Col. 5)CEO Duality (Col. 6)Chief Risk Officer (CRO) (Col. 7)Whistleblower Policy (Col. 8)Risk Management Committee (Col. 9)Compulsory Committees (CC) (Col. 10)(Col. 11)
Number of board of directors (BOD)Proportion of female directors on board (PoF)Proportion of non-executive directors on board (PoNED)Status of ChairmanWhen the Chairman is an executive directorWhen the Chairman is a non-executive directorCEO dualityAppointed CROImplemented a whistleblower policyExistence of a Risk management committeeNumber of CCAssigned scores
0 < No. of BOD < 3No female0 < PoNED < 1/2 0 < PoID < 1/20 < PoID < 1/3 YesYesYesAt least 1 CC is not in place1
No. of BOD = 3 2
0 < PoF < 1/3 OR PoF > 1/2 2.5
No. of BOD ˃ 15 PoNED = 1/2Executive ChairmanPoID = 1/2PoID = 1/3Yes 3
1/3 < PoF < 1/2 3.5
4 ≤ No. of BOD < 8 OR 10 < No. of BOD ≤ 15 4
8 ≤ No. of BOD ≤ 10PoF = 1/2PoNED > 1/2Non-executive ChairmanPoID > 1/2PoID > 1/3NoNoNoNoAll CC are in place5
(b) Scores in context of voluntary committees.
Constituted Voluntary CommitteesScore
None1
Only in 1 category1.8
In 2 categories2.6
In 3 categories3.4
In 4 categories4.2
In all 5 categories5
Table 3. Description of Variables and their measurement.
VariableDefinitionMeasurement
ROAReturn on assetsNet profit after tax+ Interest/Average total assets
ROEReturn on equityNet profit after tax− Preference dividend− Dividend distribution tax/Equity shareholders’ funds
RIRisk indexAs developed in Table 1
CGICorporate governance indexAs developed in Table 2a,b
AGEAgeNumber of years since the inception of company
SIZESizeNatural log of net total assets of company
GROWTHGrowthCAGR of sales on year on year basis
Recession dummyPeriod of global financial crisisDummy variable (pre-GFC period, 2005–2008) = 0, else 1
Table 4. Descriptive statistics.
VariableNo. of ObservationsMeanStd. Dev.MinMax
Age31139.520915.20204990
RI3110.44780.07940.26820.6727
Growth311−0.06810.4091−0.10001.6666
Size3119.2185791.4974996.39607912.45881
CGI3110.61600.08300.40000.8490
ROE2970.14800.0760−0.06400.3450
ROA3070.11500.05100.00500.2990
Table 5. Results of (Arellano-Bond) GMM estimation of ROA and ROE on risk index and CGI.
Variables ROAROE
ROA (−1) 0.4471 ***
(0.0324)
ROE (−1) 0.4694 ***
(0.1987)
CGI 0.0047 *0.0013 *
(0.0001)(0.0003)
Risk index −0.0428 ***−0.0941 ***
(0.0145)(0.02317)
Age −0.0061−0.0022 **
(0.0009)(0.0009)
Growth −0.0059 **−0.0001
(0.0005)(0.0021)
Size −0.0261 ***−0.0317 ***
(0.0007)(0.0019)
Recession dummy −0.0068 ***−0.0124 ***
(0.0031)(0.0058)
Constant 0.3507 ***0.4242 ***
Number of observations 216205
Number of instruments 3736
Statistic
Wald Testχ2(7)8354.54 ***4610.80 ***
Sargan testχ2(35)30.8241728.71551
AutocorrelationFirst order−2.2102 **−2.4392 **
Second order1.37210.06342
Note: ***, **, * denotes significance at 1% level, 5% level, and 10% level, respectively.
Table 6. Additional analysis and tests of robustness.
(1)(2)(3)(4)
Variables ROAROEStd deviationAve Return
ROA (t − 1) 0.3208 ***
(0.0208)
ROE (t − 1) 0.1257 ***
(0.0101)
Std deviation (t − 1) 0.5288 ***
(0.0187)
Ave return (t − 1) −0.4195 ***
(0.0049)
RI −0.4504 ***−0.0064 *0.0275 *−0.1363 ***
(0.0998)(0.0007)(0.0424)(0.0211)
CGI −0.3453 ***−0.0608 *−0.0606 ***−0.0978 ***
(0.0708)(0.0021)(0.9644)(0.0174)
RI*CGI0.7345 ***0.1133 *0.1354 ***0.2125 ***
(0.1652)(0.0347)(0.0611)(0.0309)
Age −0.0001−0.0177 ***−0.00180.0009 ***
(0.0008)(0.0022)(0.0004)(0.0001)
Size −0.0457 **0.0369 ***−0.0118 ***0.0006 ***
(0.0058)(0.0080)(0.0024)(0.0011)
Growth −0.0037 ***0.0016−0.0155 ***0.0039
(0.0017)(0.0049)(0.0021)(0.0003)
Pre-recession−0.0037 ***−0.0106 ***−0.0072 ***−0.0059 **
(0.0010)(0.0021)(0.0018)(0.0007)
Constant 0.7255 ***0.5090 ***0.2288 ***0.0253 *
(0.0446)(0.1426)(0.0276)(0.0068)
Number of observations222222221221
Number of instruments 4244444444
p-valuep-value p-value
Wald test χ2(8)12,227.112,169.139,298.794,116.05
Sargan test χ2(35)30.38728.6533.005430.4958
AutocorrelationFirst order−1.9569 *−1.2816 *−2.9059 **−2.6667 ***
Second order1.22360.74560.5338−2.4016
Note: ***, **, * denotes significance at 1% level, 5% level, and 10% level, respectively.
Publisher’s Note: MDPI stays neutral with regard to jurisdictional claims in published maps and institutional affiliations.

