

Asymmetric Information Flow between Exchange Rate, Oil, and Gold: New Evidence from Transfer Entropy Approach


1
Independent Researcher, Kolkata 711112, India
2
Madras School of Economics (MSE), Gandhi Mandapam Road, Kottur, Chennai 600025, India
*
Author to whom correspondence should be addressed.
J. Risk Financial Manag. 2023, 16(1), 2; https://0-doi-org.brum.beds.ac.uk/10.3390/jrfm16010002
Submission received: 3 November 2022
/
Revised: 17 December 2022
/
Accepted: 18 December 2022
/
Published: 21 December 2022
(This article belongs to the Special Issue European Financial Market Efficiency: Investors' Behaviour, Efficient Market Hypothesis and Behavioural Finance)
Abstract
:The present study used transfer entropy and effective transfer entropy to examine the asymmetric information flow between exchange rates, oil, and gold. The dataset is composed of daily data covering the period of 1 January 2018 to 31 December 2021. Further, the dataset is bifurcated for analysis for before and during COVID. The bidirectional information flow is observed between EUR/USD and Oil for the whole study period unlike before COVID. However, during COVID, there was a unidirectional information flow from Oil→EUR/USD. The study finds a significant unidirectional information flow from Gold→EUR/USD. The study estimates also indicate that before COVID, the direction of information flow was from Oil→Gold. However, the direction of information flow reversed during COVID from Gold→Oil. Overall, the direction of information flow among these three variables is asymmetric. The highest transfer entropy was observed for Gold→EUR/USD among all the pairs under consideration.
1. Introduction
A common belief among policymakers and investors globally is that prices of the commodity move in unison as they are impacted by the various common macroeconomic variables (Le and Chang 2011). Crude Oil and Gold are listed among the most traded commodities in the world. Globally, Crude Oil is the most demanded commodity, and its prices are very volatile. Several studies have already been done on the asymmetry, uncertainty, volatility, and other aspects of Crude Oil prices in a global context, yet many studies are still ongoing (Li et al. 2022; Zhang et al. 2022a, 2022b). On the other hand, Gold is not just a precious metal that has an industrial value, but it is also considered a safe-haven asset (Ali et al. 2021; Janani et al. 2022; Vukovic et al. 2021b; Wen et al. 2022; Madani and Ftiti 2022). Due to this, investors both in the advanced and emerging markets generally use the combination of Gold and Oil to diversify their investment portfolios (Soytas et al. 2009). The exchange rates play a vital role in the global trading of commodities. Earlier and recent studies show that exchange rates strongly influence both Crude Oil and Gold prices (Jain and Biswal 2016; Bedoui et al. 2018; Chen et al. 2022).
As a consequence, a considerable number of studies are done on the dynamic linkages between Crude Oil, Gold, and exchange rates in the global context (Chang et al. 2013; Chen et al. 2022; Zhang and Qin 2022). The study findings are mixed because of different exchange rates, economic policies, consumption patterns, non-linear behavior and others. Hence, there is no ultimate consensus regarding the causal relationship among Crude Oil, Gold, and exchange rates. This provides theoretical support for the present study. The present study is diverse from the earlier studies in many contexts. First, the present study considers global indices over regional indices for Crude Oil and Gold, unlike the aforementioned studies. Second, the present study used EUR/USD currency pairs as the proxy for exchange rates instead of the regional exchange rates. The reason to choose EUR/USD is that statistically, EUR/USD currency pairs in FOREX are the most traded currency pairs in the world. The information flow between the time series is of great interest to researchers and policymakers. As such, hidden information flow could reveal critical information on the risk, noise, and other associated dynamics (Kayal et al. 2021). However, quantifying such information flow between the time series is relatively difficult in reality. Most of the previous studies rely on VAR, VECM, GARCH, and other regular techniques for studying the causal relationship between the timeseries. These techniques are most useful for studying linear models based on several assumptions. However, the present study relies on the transfer entropy approach to overcome the above-mentioned issues.
The history of quantifying information has its roots in information theory. The study by Hartley (1928) quantifies the information as a logarithm of the number of all possible sequences of symbols based on a particular probability distribution. The concept of information entropy is introduced by Shannon (1948). The Kullback and Leibler (1951) distance and Shannon entropy concepts are combined to measure Shannon transfer entropy (Schreiber 2000). Similar to Shannon transfer entropy, a measure of Renyi transfer entropy is also derived (Rényi 2007; Beck and Schögl 1993; Jizba et al. 2012). Shannon and Renyi’s transfer entropy are nonparametric-based measures that deal with the asymmetric information transfer between the time series. The assumptions and restrictions associated with these two methods are quite a few as compared to the other techniques. The study by Bossomaier et al. (2016) covered details on the background and applications of transfer entropy. However, transfer entropy-based measures are only used by a few studies in finance (Sensoy et al. 2014; Teng and Shang 2017; Benedetto et al. 2020; Huynh et al. 2020; Lahmiri and Bekiros 2020; Yao and Li 2020; Asafo-Adjei et al. 2021; Nyakurukwa 2021; Owusu Junior et al. 2021; and others).
The present study relies on the transfer entropy approach for the following reasons, as listed below.
- (i)
- Transfer entropy approach is well suited for studying asymmetric, nonlinear, and nonparametric causality.
- (ii)
- Transfer entropy approach can capture certain information that is beyond the scope of both the Diebold and Yilmaz (2012) and Baruník and Křehlík (2018) approaches [see Owusu Junior et al. (2021)].
- (iii)
- Transfer entropy approach ensures that the tail risk and leverage effects of asset returns are well captured [see Owusu Junior et al. (2021)].
- (iv)
- The present study also estimates effective transfer entropy to delineate low-risk assets from risky assets. In addition to it, effective transfer entropy measures are also useful in terms of accuracy, especially for small datasets.
Hence, the present study added value to the existing literature in the following ways:
- By providing rich asymmetric causality information among the exchange rate, Crude Oil, and Gold, especially during the COVID-19 period and non-COVID-19 period to the global policymakers and investors.
- By estimating effective transfer entropy values to outline low-risk assets from risky assets. It also helps to understand the integration between the various assets. All this information would be useful to the policymakers to design appropriate steps for domestic financial markets and investors in minimizing the overall investment risks and increasing returns, especially during crises.
The present study findings are interesting and have important implications for the policymakers. It investigates the asymmetric information flow among Oil, Gold, and EUR/USD, during and before the COVID period. All these variables have a direct link to the performance of European and global financial markets. Moreover, Gold is necessary for sovereign reserves. Similarly, Oil is a key petroleum product that is heavily imported by European and other nations as an energy resource. Furthermore, major trading currencies used globally for these Oil and Gold commodities are USD and EUR. These three assets’ (Gold, Oil, and EUR/USD) widespread appeal has resulted in bivariate price co-movements that have been the subject of growing research literature. Since a thorough understanding of price co-movements is essential for comprehending market integration and taking the proper action for portfolio diversification, it is critical to investigate the overall dynamics of information transmission among these assets. The study finds a strong one-way information flow from Gold→EUR/USD in both COVID and non-COVID periods. However, for the other pairs, the flow of information between the pairs varies significantly during COVID and non-COVID periods. This provides varied insights for decision making during the volatile (during COVID) and less volatile (before COVID) periods. It suggests that there is more to understanding market co-integration than only looking at the short- or long-term correlation between assets to develop an investing strategy. Our work looks into the diversification prospects in the form of quantifying information flows over the transmission of shocks. The transfer entropy and effective transfer entropy measures quantify the information flows. These values would help global researchers and policymakers to examine the informational efficiency of markets. Moreover, the findings suggest that depending on the state of the market, information flow may alter, which would have an effect on how the assets are integrated and, consequently, how their prices move. As a result, investors’ diversification strategies should be flexible and depend on market integration and the direction of information flow.
2. Literature Review
Gold and Oil are the two most actively traded commodities in the world (Baruník et al. 2016). Further, among all commodities, Gold is considered a means of exchange and a store of value and is also part of most of the central bank’s major FOREX reserves (Kayal and Maheswaran 2021). Further, Oil is the most important commodity as it is the primary source of energy globally. Since it combines two of the largest economies and trading blocks in the world, the EUR/USD pairing has grown to be the most actively traded and thereby most liquid currency pair in the world. Further, USD and EUR are the top two most reserved foreign exchange currencies (Kayal and Maheswaran 2017). The global appeal of these three assets (Gold, Oil, and EUR/USD) has led to bivariate price co-movements, which have been the topic of developing scholarly literature. It is important to examine the general dynamics of information transmission among these assets since a detailed understanding of price co-movements is crucial for understanding market integration and taking the appropriate steps for portfolio diversification.
Economic theory makes it simple to explain the connection between the prices of Gold, Oil, and EUR/USD. For instance, a rise in the price of oil internationally pushes inflation higher. Investors commonly use major precious metals such gold in this situation to hedge their portfolios from inflation (Baruník et al. 2016). Additionally, an important gauge of the state of the world economy is the Gold-Oil ratio. As mentioned earlier, the global trading of commodities is heavily reliant on exchange rates. Exchange rates have a significant impact on the prices of both Crude Oil and Gold, according to both earlier and recent studies (Jain and Biswal 2016; Bedoui et al. 2018; Chen et al. 2022). As a result, much research on the dynamic relationships between crude Oil, Gold, and exchange rates in a worldwide context have been conducted (Chang et al. 2013; Chen et al. 2022; Zhang and Qin 2022). Because of various exchange rates, economic policies, purchasing habits, and other factors, the study’s findings are conflicting. As Gold and Oil both are denominated in US dollars, they are strongly connected. Among fiat currencies, EUR is the most important alternative to the USD and therefore a positive connection is generally observed between Gold and EUR or Oil and EUR. Consequently, EUR/USD is the single most suitable currency pair for this study.
Sometimes, generic economic intuition seems obvious while exploring directional or causative linkages among these three assets (Gold, Oil, and EUR/USD). Such theories might not, however, always offer sufficient justifications for actual linkages. The empirical finance literature is looking into these price dynamics using different advanced econometric or statistical models. We contribute to similar literature using the Transfer entropy (TE) approach. Prior research on the co-movements and spill-over of Gold, Oil and currency is inadequate and conflicting. To the best of our knowledge, a study specifically examining the direction and dominance of information transfer between pairs of Gold, Oil, and EUR/USD is few and far between. Through this work, we try to shed light on the same. We first discuss the studies that explore the relationship between Gold and Oil, the studies on Oil and EUR/USD and, lastly, the studies on Gold and EUR/USD.
The relationship between Gold and Oil prices is generally found to be momentous. For instance, some studies observe a stable correlation between Gold and Oil prices (Sari et al. 2010; Shafiee and Topal 2010; Gil-Alana et al. 2017), whereas others find that the same correlation is weak and inconsequential (Mensi et al. 2020a; Wen et al. 2020). Further, an asymmetric and nonlinear long-term relationship between Oil and Gold was observed (Churchill et al. 2019). Among many different commodities, Gold is found to be a net information transmitter for other significant commodities (Kang et al. 2017), whereas one study (Yıldırım et al. 2020) demonstrates a one-way information flow from Oil to Gold prices. Another study (Yaya et al. 2016) observes a bidirectional relationship between them explicitly prior to the financial crisis and the unidirectional relationship (Gold to Oil) following it.
The evidence of the dynamic relationship between Oil prices and the EUR/USD exchange rate in academic studies is inconsistent. For example, there is evidence of a one-way causal relationship between EUR/USD to Oil prices (EUR/USD→Oil) (Houcine et al. 2020). However, Youssef and Mokni (2020) observe no significant relationship between them. In the context of volatility spillover, there is an existence of a positive relationship between EUR/USD and Oil prices (Jawadi et al. 2016; Zolfaghari et al. 2020). Further, a recent study offers significant evidence for a nonlinear and asymmetric relationship between these two assets, especially during periods of oil crashes (Ming et al. 2022). Many other studies offer different insights into the dynamic relationship between Oil prices and exchange rates (see Jammazi and Nguyen 2017; Li et al. 2017; Kočenda and Moravcová 2019; Bagheri and Ebrahimi 2020; Wen et al. 2020; Karatas and Unal 2021; Shang and Hamori 2021; etc.).
Earlier studies that explore specifically the dynamic relationship between Gold prices and the EUR/USD currency pair are rare and generally studied in the context of other aspects such as hedging, portfolio diversification, etc. Therefore, drawing precise conclusions related to the relationship between EUR/USD currency pair and Gold prices could be challenging. However, many studies provide various perspectives on the dynamic connection between Gold prices and exchange rates (for example, Antonakakis and Kizys 2015; Bagheri and Ebrahimi 2020; Mensi et al. 2021; Abdullah et al. 2022). Unlike all these studies, this study specifically explores the price dynamics between Gold and the EUR/USD currency pair.
Empirical academic literature on price co-movements, spillovers, interdependence, contagion, and information transfer is vast. All these studies use different financial assets such as equity, exchange rates, energy, cryptocurrency, and commodities in different settings (for example, Antonakakis 2012; Hameed et al. 2015; Corbet et al. 2020; Mensi et al. 2020b; Al-Yahyaee et al. 2020). The recent development of new statistical/econometrics methods suitable for quantifying these dynamics and advancement in computational power has resulted in a rapid expansion of the empirical finance literature in this area. Most of this research makes use of different time series models such as VAR-SVAR (Luu Duc Huynh 2019); nonlinear model (Zhang and Wu 2019; Maiti et al. 2020b; Peng et al. 2020; Li et al. 2020); multi-quantile VaR (Deng et al. 2021); time-varying robust model (Pham and Cepni 2022); copula-based models (Dastgir et al. 2019; Jang et al. 2022; Kim et al. 2020; She et al. 2019); wavelet-based (Maiti et al. 2020a; Maiti 2021; Vukovic et al. 2021a; Li et al. 2021; Maiti et al. 2022; Adebayo 2022), etc. Compared to all these methods, we use a completely different approach in this study. To accurately estimate the granger causality, we do not use traditional/advanced model-dependent cointegration methodologies. We explore a model-free TE method that allows nonlinear, nonparametric, and asymmetric interactions. Application of the nonlinear nonparametric technique is crucial since structural changes, volatility variations, and nonlinearities may all be used to characterize the prices of financial assets. By using the proper conditional density, TE may also be able to separate information that originates from shared information because of shared history. As a result, TE is a desirable metric for locating conditional dependencies (Diks and Fang 2017).
Further, due to its resistance to the issue of missing data and small variance Gaussian noise, TE is an effective method for estimating real-world bivariate causal connections (Edinburgh et al. 2021). In the context of directional causality of bivariate variables, the empirical finance literature has only recently begun to recognize the value and benefits of TE (see, He and Shang 2017; Adam 2020; Benedetto et al. 2020; Huynh 2020; Osei and Adam 2020; Behrendt and Schmidt 2021; Maghyereh et al. 2021). This is one of few first studies, to the best of the authors’ knowledge, to utilize TE to analyze the information flow between bivariate pairs of different financial assets.
3. Data and Methodology
3.1. Data
The daily closing price data for EUR/USD, Crude Oil, and Gold is obtained from Yahoo. Daily returns are calculated from the closing price. The total data period of the study is between 3 January 2018 and 30 December 2021. Furthermore, the study divided the total sample into two as follows: (i) Before COVID (3 January 2018 to 31 December 2019) and (ii) During COVID (1 January 2020 to 30 December 2021).
3.2. Methodology
The study by Shannon (1948) estimates entropy of the discrete random variable as shown in Equation (1).
The above formula uses the log base of 2 and the random variable is denoted by J. All the possible outcomes are denoted by , , , whereas probabilities of the outcomes are denoted by p(), … p(). Thus, the above Equation (1) measures the average level of uncertainty or randomness or information gain in the units of bits. However, to quantify the information transfer between the two-time series, the concept of Shannon’s (1948) entropy needed to be tied with the concept of Kullback and Leibler (1951) distance under the assumption that the underlying process follows a Markov process (Schreiber 2000). Accordingly, the Shannon transfer entropy is derived as follows (Schreiber 2000):
where measures the transfer entropy or information flow from J to I.
In a similar line, the transfer entropy could also be estimated by using the Rényi (2007) entropy. Rényi (2007) estimated entropy of the discrete random variable as shown in Equation (3).
where q represents the weighting parameters and p(j) represents the individual probabilities. The weighting parameters distribution could be normalized by using the escort distribution (Beck and Schögl 1993). Consequently, the Renyi transfer entropy is derived as follows (Jizba et al. 2012):
where measures the transfer entropy or information flow from J to I. The Renyi entropy approaches the Shannon entropy for q→1.
From the application point of view, in the smaller samples, the above transfer entropy estimates are often biased. Such biases are addressed by estimating the effective transfer entropy (Marschinski and Kantz 2002). The statistical significance of the Shannon transfer entropy function (Equation (2)) is determined by the Markov block bootstrap (Dimpfl and Peter 2013). A discrete and stationary dataset is required for estimating both the Shannon and Renyi transfer entropy. In this study, the Shannon and Renyi transfer entropy are tested and estimated as outlined by Behrendt et al. (2019).
4. Results and Discussion
Both the Augmented Dickey Fuller (ADF) and Kwiatkowski–Phillips–Schmidt–Shin (KPSS) tests confirm that all the time series under consideration are stationary and at level (See Table 1).
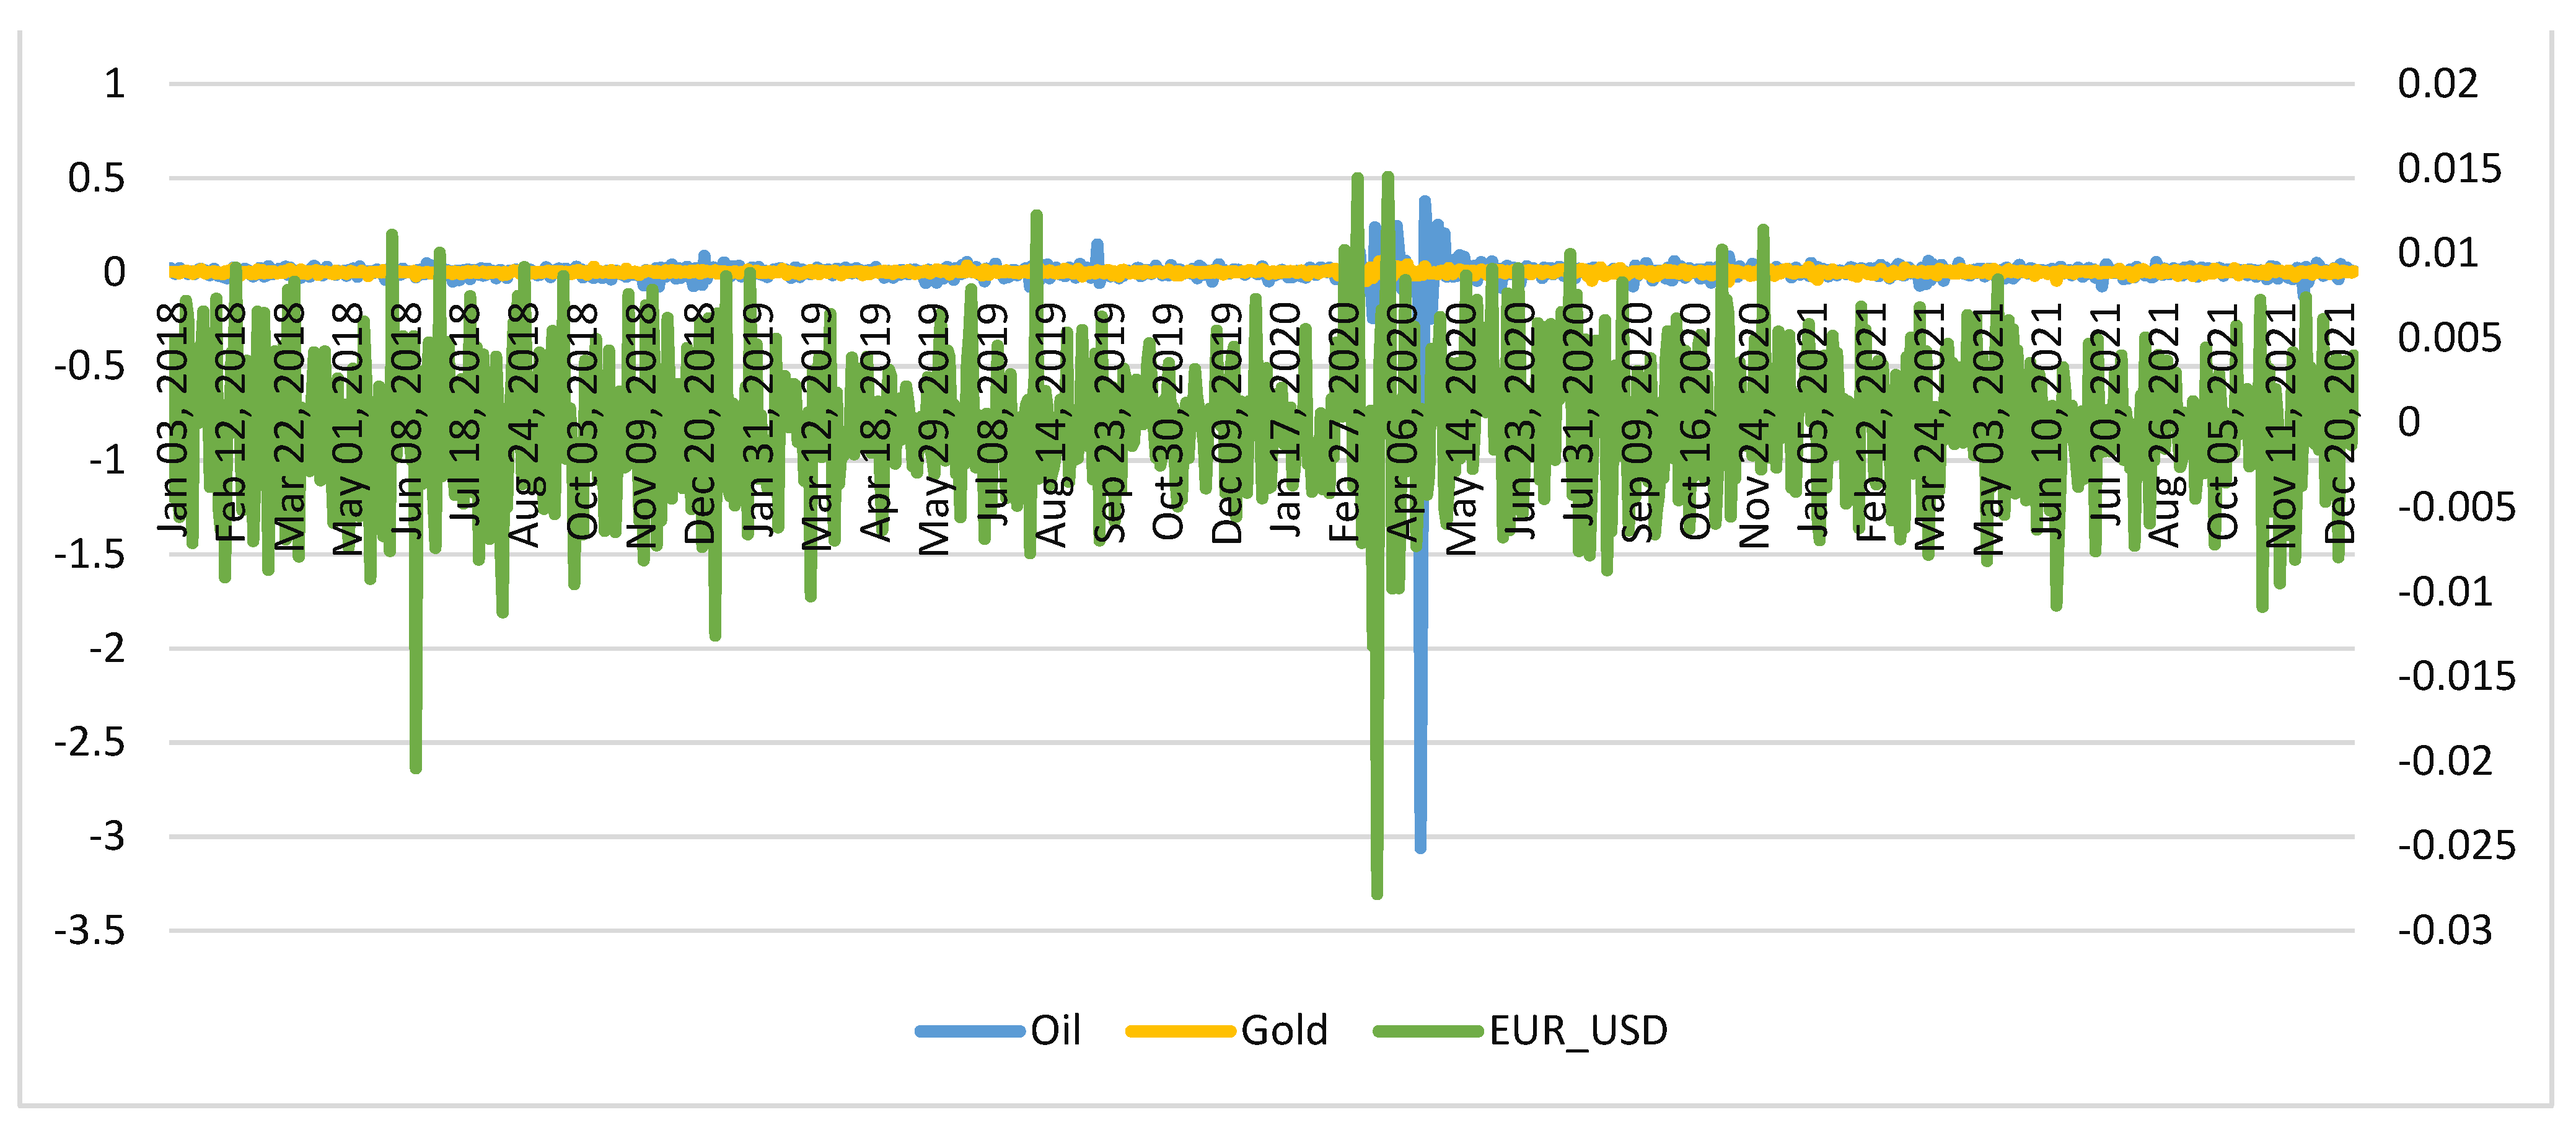
The descriptive statistics of EUR/USD, Oil, and Gold for the whole study period is shown in Table 2. The oil return series is more volatile as compared to the EUR/USD and Gold. The Skewness and Kurtosis values are extremely high for Oil.
The daily returns of Oil, Gold, and EUR/USD series are shown in Figure 1. Please also note that the EUR/USD series is represented in the secondary axis in Figure 1.
The following observations are common for all the Shannon transfer estimates tables. Under the column direction, X represents the first series and Y represents the second series. It indicates the direction of information flow from one series to another. For example, X→Y represents directional information flow from X to Y. The effective transfer entropy is shown under the heading “Eff. TE”. The Standard errors and p-values are based on the bootstrap samples whose quantiles are depicted at the end of the table.
4.1. EUR/USD and Oil
The Shannon transfer entropy estimates between the two-time series namely EUR/USD and Oil are shown in Table 3a,b.
The obtained Shannon entropy transfer estimates (Table 3a) confirm that there is a significant information flow between the two series for the entire study period in both ways (EUR/USD→Oil and Oil→ EUR/USD). This means that knowledge of either variable will even indicate a correspondingly higher level of risk. A part of this result is similar to the observation made by Houcine et al. (2020). They find a one-way causal relationship between the EUR/USD to oil prices (EUR/USD→Oil). However, before COVID, there was no statistically significant information flow observed between the two series (EUR/USD and Oil), consistent with the findings of Youssef and Mokni (2020). This indicates that both the two series, namely EUR/USD and Oil, are highly unpredictable and risky. Interestingly, during COVID, a statistically significant information flow is observed between Oil→EUR/USD but not in the other direction (See Table 3b). The possible reason for this could be crude oil prices were more volatile and have a statistically significant impact on EUR/USD during COVID. It indicates that during an extraordinary situation, major financial assets become more integrated and generally move in similar fashion. Therefore, it becomes challenging for the investors to appropriately diversify their financial portfolio across asset classes. A diversification strategy that performs well in normal times might not perform similarly in a crisis.
4.2. EUR/USD and Gold
The Shannon transfer entropy estimates between EUR/USD and Gold are shown in Table 4a,b.
The obtained Shannon entropy transfer estimates (Table 4a,b) confirm that there is a statistically significant unidirectional information flow observed between Gold→EUR/USD in all the cases. This indicates that EUR/USD series movement is predictable to a certain extent by perceiving the varying GOLD returns. Although there is numerous research that offer varied viewpoints on the dynamic relationship between gold prices and exchange rates (see Bagheri and Ebrahimi 2020; Mensi et al. 2021; Abdullah et al. 2022, etc.), our observation is a bit different. Significant presence of unidirectional information flow between Gold→EUR/USD in all scenarios considered in this work implies gold price should be used to predict currency rates, especially EUR/USD. The possible reason behind our findings is the large share of gold among all the traded commodities in the world and significance of EUR and USD as the major traded currency.
4.3. Oil and Gold
The Shannon transfer entropy estimates between Oil and Gold are shown in Table 5a,b.
The obtained Shannon entropy transfer estimates (Table 5a,b) indicate that there is a significant unidirectional information flow between Gold→Oil during COVID and for the whole sample, similar to the findings of Yaya et al. (2016). However, before COVID, there was a significant reverse directional flow of information from Oil→Gold. This observation is in line with the findings of Yıldırım et al. (2020). The possible reason for this reverse trend could be the significant excessive asymmetric multifractality and fat tails characteristics of oil and gold prices (Mensi et al. 2020a). These different findings imply that understanding cointegration for investing strategy and portfolio diversification requires more than simply examining the short- or long-term correlation between assets. Information flow could change based on the market situation and that would impact the integration between the assets and hence their price movements. Therefore, diversification strategies for investors should be dynamic and must be based on market integration and the directional information flow.
4.4. Robustness Checks
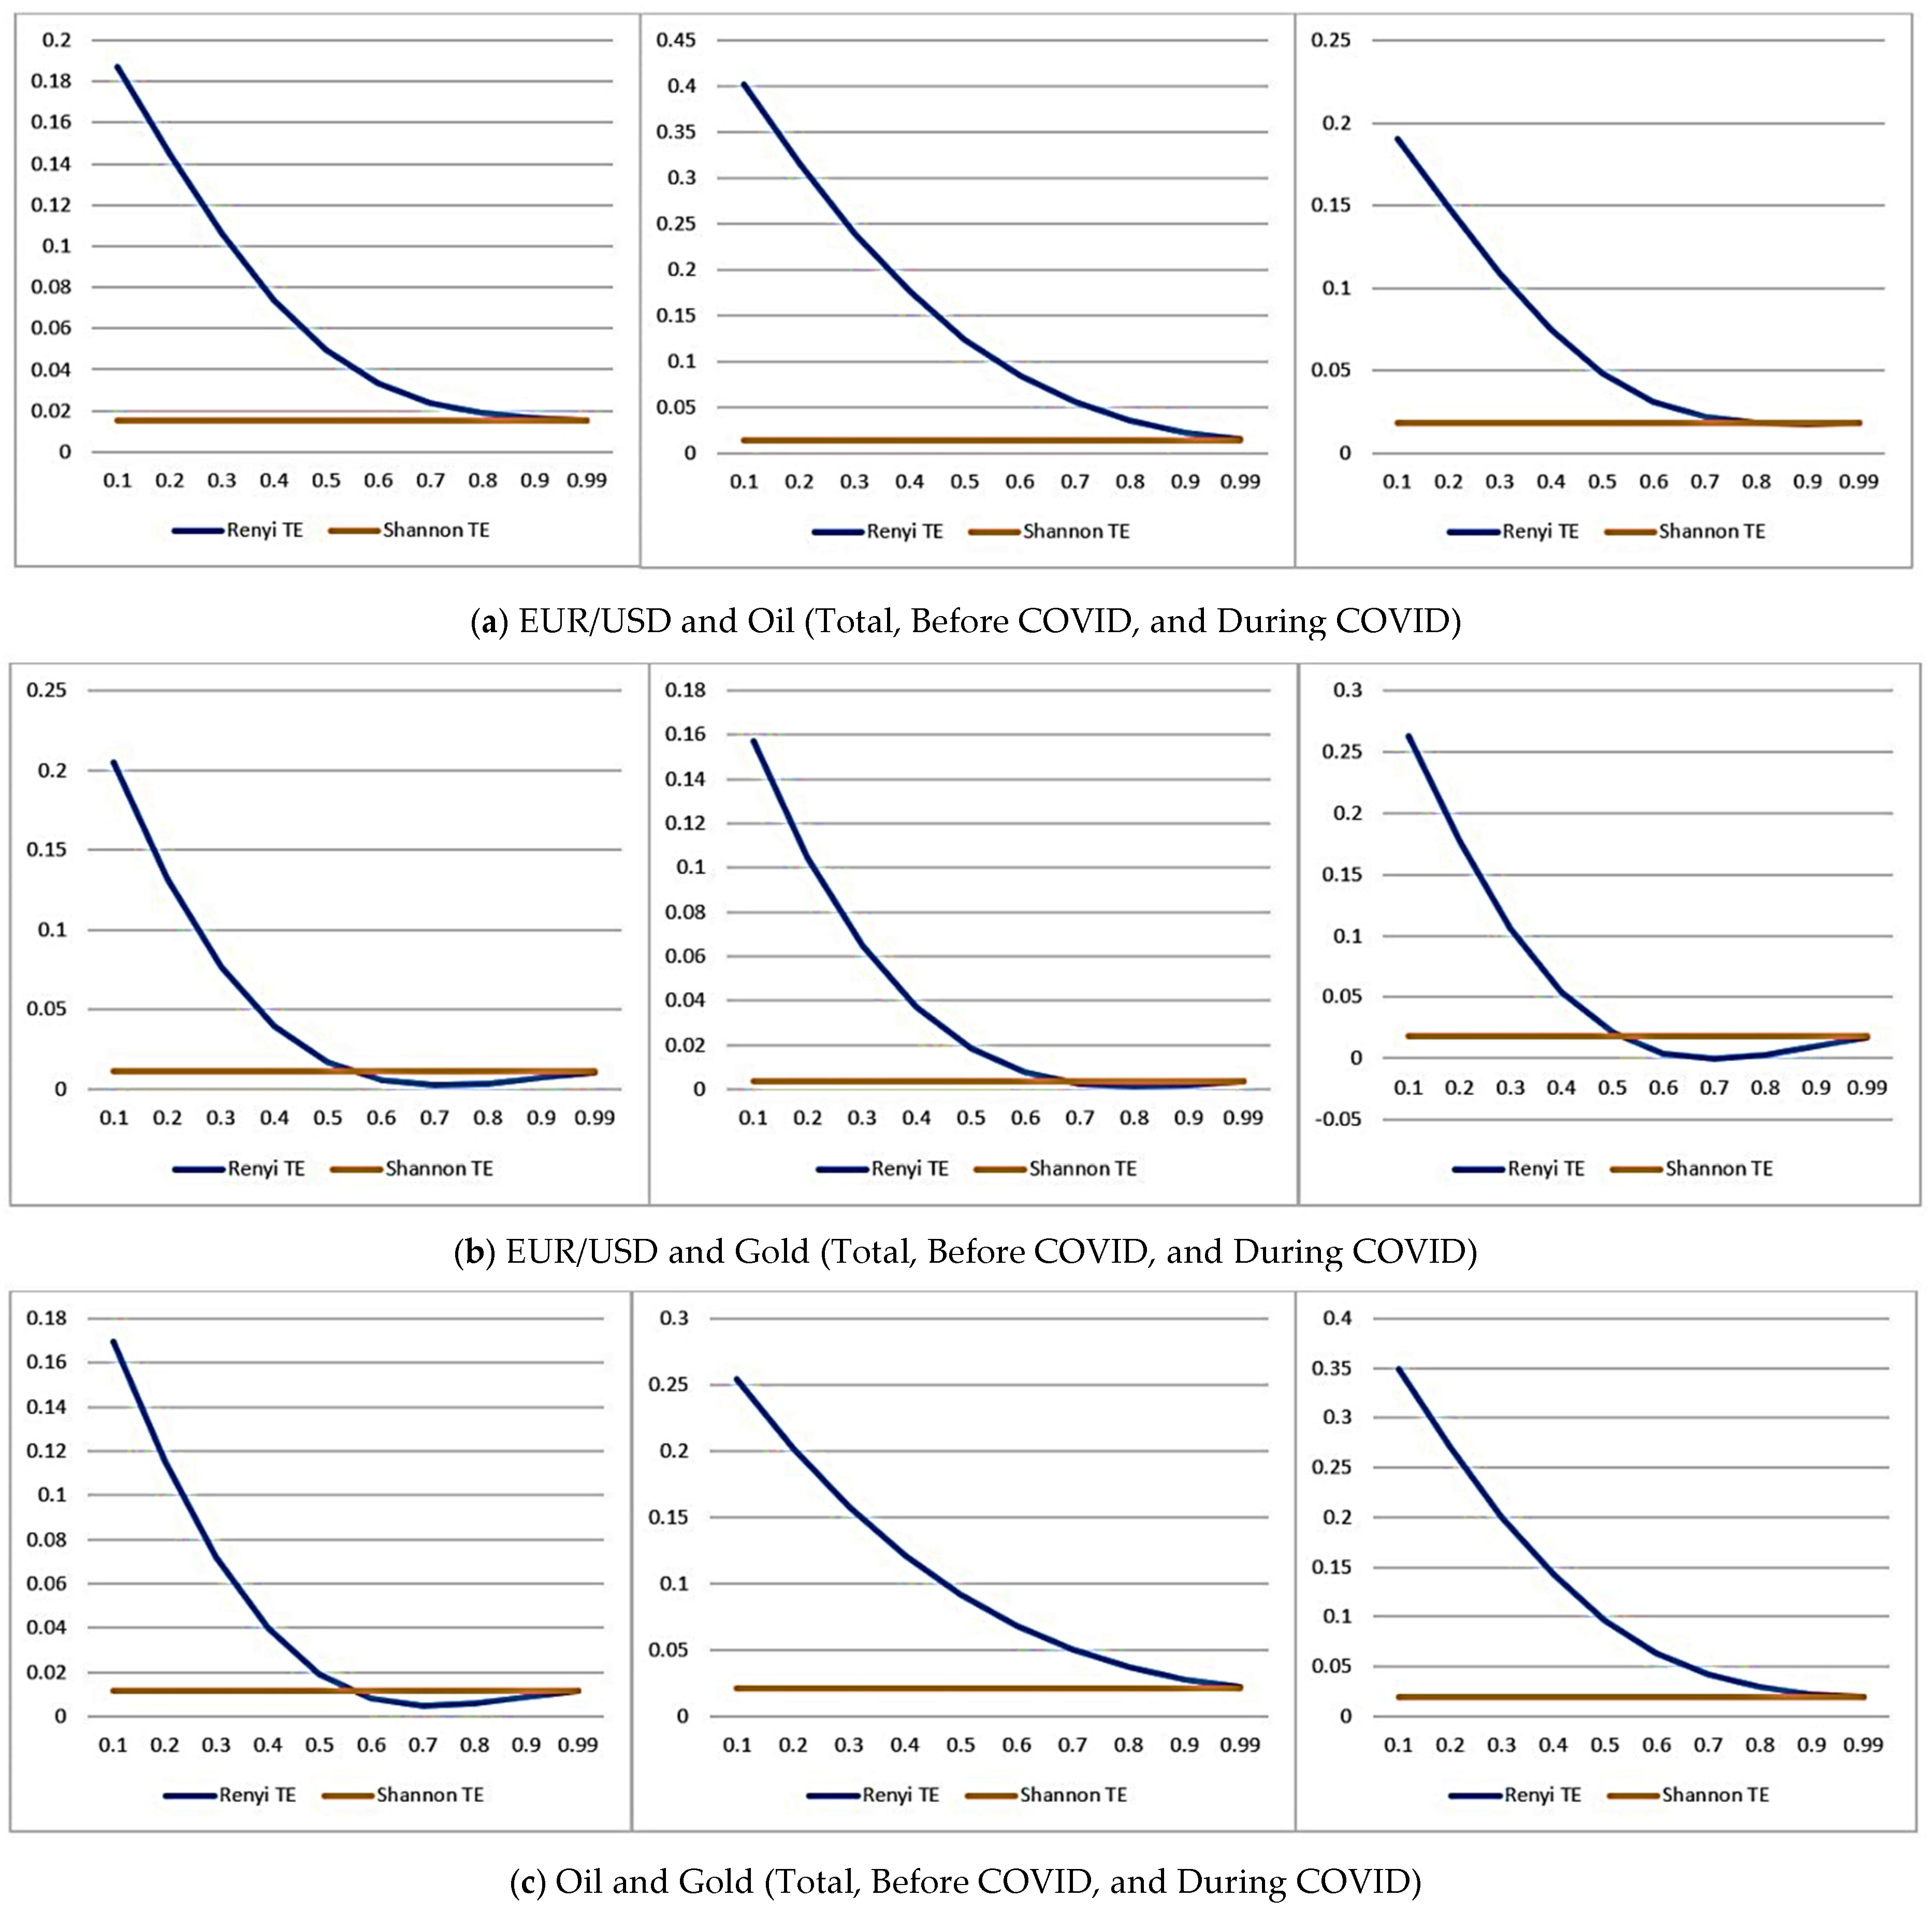
The quantiles are important because they affect the order of magnitude of the transfer entropy. Renyi transfer entropy allows for reweighting the probabilities associated with the different areas under the distributions. Hence, the Shannon transfer entropy estimates are comparable to the Renyi transfer entropy only when using the same bins. The Renyi transfer entropy for different weighting(q) are shown in the Figure 2a–c. It is clear from all the figures that the value of Renyi transfer entropy is highest at the lower values of q and it decreases subsequently with the increasing values of q, and as the value of q approaches 1 (q→1), it converges with the Shannon entropy. All these estimates confirm that the analysis is robust.
5. Conclusions
The present study used transfer entropy and effective transfer entropy to examine the information flow between the different time series (exchange rate, oil, and gold). For a comprehensive analysis, the present study divides the period into three periods as total, before COVID, and during COVID. Information flow from series X to series Y is the amount of uncertainty reduced in future values of Y by knowing the past values of X given past values of Y. The transfer entropy and effective transfer entropy values quantify the amount of information flow from one series to another time series. Hence, knowing these values would certainly help global policymakers to design appropriate steps for domestic financial markets and investors in portfolio diversification to maximize risk-adjusted returns. The study finds a significant bidirectional information flow between EUR/USD and Oil pairs for the whole sample, partly similar to the observation made by Houcine et al. (2020). However, it becomes unidirectional during COVID (Oil→EUR/USD), and insignificant for the before COVID sample. The study estimates also indicate a significant unidirectional transfer of entropy from Gold to EUR/USD (Gold→EUR/USD) for all samples. Our results offer a different insight into the dynamic relationship between gold prices and the exchange rates relationship literature (see Bagheri and Ebrahimi 2020; Mensi et al. 2021; Abdullah et al. 2022, etc. for varied viewpoints). Before COVID, there was a significant information flow from Oil to Gold (Oil→Gold), similar to the observation made by Yıldırım et al. (2020). However, the direction of information flow reversed during COVID (Gold→Oil). Among all these pairs, the information flow from Gold to EUR/USD is higher for all the samples. The findings show strong one-way information flow from gold→EUR/USD during both COVID and non-COVID periods. However, for other couples, the information flow between pairs differs significantly during COVID and non-COVID times. Based on the estimated transfer entropy and effective transfer entropy values, global investors and policymakers should make their decision in the selection of the assets in the portfolio to diversify the risk and improve returns.
For robustness checks, the present study plotted Renyi transfer entropy for different values of q against Shannon transfer entropy estimates. The plotted Figure 2a–c indicates that the value of Renyi transfer entropy is highest at the lower values of q, and when the value of q approaches 1 (q→1), it converges with the Shannon entropy. This means that knowledge of any of the two variables will even reveal a correspondingly higher level of risk. Certainly, it also does not mean there is no information flow. The major limitation of this work is that it does not consider multi-variate information transfer. Future research could replicate the current study utilizing real-time tick data, other important characteristics, possibly in a multi-variate framework.
Author Contributions
Conceptualization, M.M.; methodology, M.M. and P.K.; validation, P.K.; formal analysis, M.M. and P.K.; writing—original draft preparation, M.M. and P.K.; writing—review and editing, M.M. and P.K.; supervision, M.M. All authors have read and agreed to the published version of the manuscript.
Funding
This research received no external funding.
Data Availability Statement
Data is available publicly as mentioned in Section 3.1.
Conflicts of Interest
The authors declare no conflict of interest.
References
- Abdullah, Ahmad Monir, Maizatulakma Abdullah, and Romlah Jaafar. 2022. The Dynamic Volatilities and Correlations between German Stock Market Indices and Commodities: Evidence from Wavelet and MGARCH-DCC Approaches. Asian Economic and Financial Review 12: 731–50. [Google Scholar] [CrossRef]
- Adam, Anokye M. 2020. Susceptibility of stock market returns to international economic policy: Evidence from effective transfer entropy of Africa with the implication for open innovation. Journal of Open Innovation: Technology, Market, and Complexity 6: 71. [Google Scholar] [CrossRef]
- Adebayo, Tomiwa Sunday. 2022. Environmental consequences of fossil fuel in Spain amidst renewable energy consumption: A new insights from the wavelet-based Granger causality approach. International Journal of Sustainable Development & World Ecology 29: 1–14. [Google Scholar]
- Ali, Fahad, Yuexiang Jiang, and Ahmet Sensoy. 2021. Downside risk in Dow Jones Islamic equity indices: Precious metals and portfolio diversification before and after the COVID-19 bear market. Research in International Business and Finance 58: 101502. [Google Scholar] [CrossRef]
- Al-Yahyaee, Khamis Hamed, Mobeen Ur Rehman, Idries Mohammad Wanas Al-Jarrah, Walid Mensi, and Xuan Vinh Vo. 2020. Co-movements and spillovers between prices of precious metals and non-ferrous metals: A multiscale analysis. Resources Policy 67: 101680. [Google Scholar] [CrossRef]
- Antonakakis, Nikolaos. 2012. Exchange return co-movements and volatility spillovers before and after the introduction of euro. Journal of International Financial Markets, Institutions and Money 22: 1091–109. [Google Scholar] [CrossRef] [Green Version]
- Antonakakis, Nikolaos, and Renatas Kizys. 2015. Dynamic spillovers between commodity and currency markets. International Review of Financial Analysis 41: 303–19. [Google Scholar] [CrossRef] [Green Version]
- Asafo-Adjei, Emmanuel, Peterson Owusu Junior, and Anokye M. Adam. 2021. Information flow between global equities and cryptocurrencies: A VMD-based entropy evaluating shocks from COVID-19 pandemic. Complexity 2021: 4753753. [Google Scholar] [CrossRef]
- Bagheri, Ehsan, and Seyed Babak Ebrahimi. 2020. Estimating network connectedness of financial markets and commodities. Journal of Systems Science and Systems Engineering 29: 572–89. [Google Scholar] [CrossRef]
- Baruník, Jozef, and Tomáš Křehlík. 2018. Measuring the frequency dynamics of financial connectedness and systemic risk. Journal of Financial Econometrics 16: 271–96. [Google Scholar] [CrossRef]
- Baruník, Jozef, Evžen Kočenda, and Lukáš Vácha. 2016. Gold, oil, and stocks: Dynamic correlations. International Review of Economics & Finance 42: 186–201. [Google Scholar]
- Beck, Christian, and Friedrich Schögl. 1993. Thermodynamics of Chaotic Systems: An Introduction. Cambridge Nonlinear Science Series; Cambridge: Cambridge University Press. [Google Scholar] [CrossRef]
- Bedoui, Rihab, Sana Braeik, Stéphane Goutte, and Khaled Guesmi. 2018. On the study of conditional dependence structure between oil, gold and USD exchange rates. International Review of Financial Analysis 59: 134–46. [Google Scholar] [CrossRef]
- Behrendt, Simon, and Alexander Schmidt. 2021. Nonlinearity matters: The stock price–trading volume relation revisited. Economic Modelling 98: 371–85. [Google Scholar] [CrossRef]
- Behrendt, Simon, Thomas Dimpfl, Franziska J. Peter, and David J. Zimmermann. 2019. RTransferEntropy—Quantifying information flow between different time series using effective transfer entropy. SoftwareX 10: 100265. [Google Scholar] [CrossRef]
- Benedetto, Francesco, Loretta Mastroeni, Greta Quaresima, and Pierluigi Vellucci. 2020. Does OVX affect WTI and Brent oil spot variance? Evidence from an entropy analysis. Energy Economics 89: 104815. [Google Scholar] [CrossRef]
- Bossomaier, Terry, Lionel Barnett, Michael Harré, and Joseph T. Lizier. 2016. An Introduction to Transfer Entropy: Information Flow in Complex Systems, 1st ed. New York: Springer International Publishing. [Google Scholar] [CrossRef]
- Chang, Hsiao-Fen, Liang-Chou Huang, and Ming-Chin Chin. 2013. Interactive relationships between crude oil prices, gold prices, and the NT–US dollar exchange rate—A Taiwan study. Energy Policy 63: 441–48. [Google Scholar] [CrossRef]
- Chen, Yufeng, Jing Xu, and May Hu. 2022. Asymmetric volatility spillovers and dynamic correlations between crude oil price, exchange rate and gold price in BRICS. Resources Policy 78: 102857. [Google Scholar] [CrossRef]
- Churchill, Sefa Awaworyi, John Inekwe, Kris Ivanovski, and Russell Smyth. 2019. Dynamics of oil price, precious metal prices and the exchange rate in the long-run. Energy Economics 84: 104508. [Google Scholar] [CrossRef]
- Corbet, Shaen, John W. Goodell, and Samet Günay. 2020. Co-movements and spillovers of oil and renewable firms under extreme conditions: New evidence from negative WTI prices during COVID-19. Energy Economics 92: 104978. [Google Scholar] [CrossRef]
- Dastgir, Shabbir, Ender Demir, Gareth Downing, Giray Gozgor, and Chi Keung Marco Lau. 2019. The causal relationship between Bitcoin attention and Bitcoin returns: Evidence from the Copula-based Granger causality test. Finance Research Letters 28: 160–64. [Google Scholar] [CrossRef]
- Deng, Chao, Xiaoying Zhou, Cheng Peng, and Huiming Zhu. 2021. Going green: Insight from asymmetric risk spillover between investor attention and pro-environmental investment. Finance Research Letters 47: 102565. [Google Scholar] [CrossRef]
- Diebold, Francis X., and Kamil Yilmaz. 2012. Better to give than to receive: Predictive directional measurement of volatility spillovers. International Journal of forecasting 28: 57–66. [Google Scholar] [CrossRef] [Green Version]
- Diks, Cees GH, and Hao Fang. 2017. Detecting Granger Causality with a Nonparametric Information-Based Statistic (No. 17-03). CeNDEF Working Paper. Amsterdam: University of Amsterdam. [Google Scholar]
- Dimpfl, Thomas, and Franziska Julia Peter. 2013. Using transfer entropy to measure information flows between financial markets. Studies in Nonlinear Dynamics and Econometrics 17: 85–102. [Google Scholar] [CrossRef] [Green Version]
- Edinburgh, Tom, Stephen J. Eglen, and Ari Ercole. 2021. Causality indices for bivariate time series data: A comparative review of performance. Chaos: An Interdisciplinary Journal of Nonlinear Science 31: 083111. [Google Scholar] [CrossRef]
- Gil-Alana, Luis A., OlaOluwa S. Yaya, and Olushina O. Awe. 2017. Time series analysis of co-movements in the prices of gold and oil: Fractional cointegration approach. Resources Policy 53: 117–24. [Google Scholar] [CrossRef]
- Hameed, Allaudeen, Randall Morck, Jianfeng Shen, and Bernard Yeung. 2015. Information, analysts, and stock return comovement. The Review of Financial Studies 28: 3153–87. [Google Scholar] [CrossRef]
- Hartley, Ralph VL. 1928. Transmission of information 1. Bell System Technical Journal 7: 535–63. [Google Scholar] [CrossRef]
- He, Jiayi, and Pengjian Shang. 2017. Comparison of transfer entropy methods for financial time series. Physica A: Statistical Mechanics and Its Applications 482: 772–85. [Google Scholar] [CrossRef]
- Houcine, Benlaria, Gheraia Zouheyr, Belbali Abdessalam, Hadji Youcef, and Abdelli Hanane. 2020. The relationship between crude oil prices, EUR/USD Exchange rate and gold prices. International Journal of Energy Economics and Policy 10: 234–42. [Google Scholar] [CrossRef]
- Huynh, Toan Luu Duc. 2020. The effect of uncertainty on the precious metals market: New insights from Transfer Entropy and Neural Network VAR. Resources Policy 66: 101623. [Google Scholar] [CrossRef]
- Huynh, Toan Luu Duc, Muhammad Ali Nasir, Xuan Vinh Vo, and Thong Trung Nguyen. 2020. Small things matter most”: The spillover effects in the cryptocurrency market and gold as a silver bullet. The North American Journal of Economics and Finance 54: 101277. [Google Scholar] [CrossRef]
- Jain, Anshul, and Pratap Chandra Biswal. 2016. Dynamic linkages among oil price, gold price, exchange rate, and stock market in India. Resources Policy 49: 179–85. [Google Scholar] [CrossRef]
- Jammazi, Rania, and Duc Khuong Nguyen. 2017. Estimating and forecasting portfolio’s Value-at-Risk with wavelet-based extreme value theory: Evidence from crude oil prices and US exchange rates. Journal of the Operational Research Society 68: 1352–62. [Google Scholar] [CrossRef]
- Janani, Sri S., Parthajit Kayal, and G. Balasubramanian. 2022. Can Equity be Safe-haven for Investment? Journal of Emerging Market Finance 21: 32–63. [Google Scholar] [CrossRef]
- Jang, Hyuna, Jong-Min Kim, and Hohsuk Noh. 2022. Vine copula Granger causality in mean. Economic Modelling 109: 105798. [Google Scholar] [CrossRef]
- Jawadi, Fredj, Waël Louhichi, Hachmi Ben Ameur, and Abdoulkarim Idi Cheffou. 2016. On oil-US exchange rate volatility relationships: An intraday analysis. Economic Modelling 59: 329–34. [Google Scholar] [CrossRef]
- Jizba, Petr, Hagen Kleinert, and Mohammad Shefaat. 2012. Renyi’s information transfer between financial time series. Physica A 391: 2971–89. [Google Scholar] [CrossRef] [Green Version]
- Kang, Sang Hoon, Ron McIver, and Seong-Min Yoon. 2017. Dynamic spillover effects among crude oil, precious metal, and agricultural commodity futures markets. Energy Economics 62: 19–32. [Google Scholar] [CrossRef]
- Karatas, Cengiz, and Gazanfer Unal. 2021. Co-movement, fractal behaviour and forecasting of exchange rates. International Journal of Dynamics and Control 9: 1818–31. [Google Scholar] [CrossRef]
- Kayal, Parthajit, and S. Maheswaran. 2017. Is USD-INR really an excessively volatile currency pair? Journal of Quantitative Economics 15: 329–42. [Google Scholar] [CrossRef]
- Kayal, Parthajit, and Srinivasan Maheswaran. 2021. A study of excess volatility of gold and silver. IIMB Management Review 33: 133–45. [Google Scholar] [CrossRef]
- Kayal, Parthajit, Sumanjay Dutta, Vipul Khandelwal, and Rakesh Nigam. 2021. Information Theoretic Ranking of Extreme Value Returns. Journal of Quantitative Economics 19: 1–21. [Google Scholar] [CrossRef]
- Kim, Jong-Min, Namgil Lee, and Sun Young Hwang. 2020. A copula nonlinear Granger causality. Economic Modelling 88: 420–30. [Google Scholar] [CrossRef]
- Kočenda, Evžen, and Michala Moravcová. 2019. Exchange rate comovements, hedging and volatility spillovers on new EU forex markets. Journal of International Financial Markets, Institutions and Money 58: 42–64. [Google Scholar] [CrossRef] [Green Version]
- Kullback, Solomon, and Richard A. Leibler. 1951. On information and sufficiency. The Annals of Mathematical Statistics 22: 79–86. [Google Scholar] [CrossRef]
- Lahmiri, Salim, and Stelios Bekiros. 2020. Renyi entropy and mutual information measurement of market expectations and investor fear during the COVID-19 pandemic. Chaos, Solitons & Fractals 139: 110084. [Google Scholar]
- Le, Thai-Ha, and Youngho Chang. 2011. Oil and Gold: Correlation or Causation? Available online: https://mpra.ub.uni-muenchen.de/31795/1/MPRA_paper_31795.pdf (accessed on 1 September 2022).
- Li, Jianping, Jingyu Li, Xiaoqian Zhu, Yinhong Yao, and Barbara Casu. 2020. Risk spillovers between FinTech and traditional financial institutions: Evidence from the US. International Review of Financial Analysis 71: 101544. [Google Scholar] [CrossRef]
- Li, Rong, Sufang Li, Di Yuan, and Huiming Zhu. 2021. Investor attention and cryptocurrency: Evidence from wavelet-based quantile Granger causality analysis. Research in International Business and Finance 56: 101389. [Google Scholar] [CrossRef]
- Li, Xiafei, Yu Wei, Xiaodan Chen, Feng Ma, Chao Liang, and Wang Chen. 2022. Which uncertainty is powerful to forecast crude oil market volatility? New evidence. International Journal of Finance & Economics 27: 4279–97. [Google Scholar]
- Li, Xiao-Ping, Chun-Yang Zhou, and Chong-Feng Wu. 2017. Jump spillover between oil prices and exchange rates. Physica A: Statistical Mechanics and Its Applications 486: 656–67. [Google Scholar] [CrossRef]
- Luu Duc Huynh, Toan. 2019. Spillover risks on cryptocurrency markets: A look from VAR-SVAR granger causality and student’st copulas. Journal of Risk and Financial Management 12: 52. [Google Scholar] [CrossRef] [Green Version]
- Madani, Mohamed Arbi, and Zied Ftiti. 2022. Is gold a hedge or safe haven against oil and currency market movements? A revisit using multifractal approach. Annals of Operations Research 313: 367–400. [Google Scholar] [CrossRef] [PubMed]
- Maghyereh, Aktham, Hussein Abdoh, and Basel Awartani. 2021. Have returns and volatilities for financial assets responded to implied volatility during the COVID-19 pandemic? Journal of Commodity Markets 26: 100194. [Google Scholar] [CrossRef]
- Maiti, Moinak. 2021. Introduction to Wavelets. In Applied Financial Econometrics. Singapore: Palgrave Macmillan. [Google Scholar] [CrossRef]
- Maiti, Moinak, Darko Vukovic, Viktor Krakovich, and Maneesh Kumar Pandey. 2020a. How integrated are cryptocurrencies. International Journal of Big Data Management 1: 64–80. [Google Scholar] [CrossRef]
- Maiti, Moinak, Yaroslav Vyklyuk, and Darko Vuković. 2020b. Cryptocurrencies chaotic co-movement forecasting with neural networks. Internet Technology Letters 3: e157. [Google Scholar] [CrossRef]
- Maiti, Moinak, Darko Vukovic, Yaroslav Vyklyuk, and Zoran Grubisic. 2022. BRICS Capital Markets Co-Movement Analysis and Forecasting. Risks 10: 88. [Google Scholar] [CrossRef]
- Marschinski, Robert, and Holger Kantz. 2002. Analysing the information flow between financial time series: An improved estimator for transfer entropy. European Physical Journal B 30: 275–81. [Google Scholar] [CrossRef]
- Mensi, Walid, Ahmet Sensoy, Xuan Vinh Vo, and Sang Hoon Kang. 2020a. Impact of COVID-19 outbreak on asymmetric multifractality of gold and oil prices. Resources Policy 69: 101829. [Google Scholar] [CrossRef]
- Mensi, Walid, Jose Arroeola Hernandez, Seong-Min Yoon, Xuan Vinh Vo, and Sang Hoon Kang. 2021. Spillovers and connectedness between major precious metals and major currency markets: The role of frequency factor. International Review of Financial Analysis 74: 101672. [Google Scholar] [CrossRef]
- Mensi, Walid, Mobeen Ur Rehman, and Xuan Vinh Vo. 2020b. Spillovers and co-movements between precious metals and energy markets: Implications on portfolio management. Resources Policy 69: 101836. [Google Scholar] [CrossRef]
- Ming, Lei, Yao Shen, Shenggang Yang, and Minyi Dong. 2022. Contagion or flight-to-quality? The linkage between oil price and the US dollar based on the local Gaussian approach. Journal of Futures Markets 42: 722–50. [Google Scholar] [CrossRef]
- Nyakurukwa, Kingstone. 2021. Information flow between the Zimbabwe Stock Exchange and the Johannesburg Stock Exchange: A transfer entropy approach. Organizations and Markets in Emerging Economies 12: 353–76. [Google Scholar] [CrossRef]
- Osei, Prince Mensah, and Anokye M. Adam. 2020. Quantifying the information flow between Ghana stock market index and its constituents using transfer entropy. Mathematical Problems in Engineering 2020: 6183421. [Google Scholar] [CrossRef]
- Owusu Junior, Peterson, Siaw Frimpong, Anokye M. Adam, Samuel K. Agyei, Emmanuel N. Gyamfi, Daniel Agyapong, and George Tweneboah. 2021. COVID-19 as information transmitter to global equity markets: Evidence from CEEMDAN-based transfer entropy approach. Mathematical Problems in Engineering 2021: 8258778. [Google Scholar] [CrossRef]
- Peng, Yufang, Weidong Chen, Pengbang Wei, and Guanyi Yu. 2020. Spillover effect and Granger causality investigation between China’s stock market and international oil market: A dynamic multiscale approach. Journal of Computational and Applied Mathematics 367: 112460. [Google Scholar] [CrossRef]
- Pham, Linh, and Oguzhan Cepni. 2022. Extreme directional spillovers between investor attention and green bond markets. International Review of Economics & Finance 80: 186–210. [Google Scholar]
- Rényi, Alfréd. 2007. Probability Theory. Mineola: Dover Publications, Inc., Courier Corporation. [Google Scholar]
- Sari, Ramazan, Shawkat Hammoudeh, and Ugur Soytas. 2010. Dynamics of oil price, precious metal prices, and exchange rate. Energy Economics 32: 351–62. [Google Scholar] [CrossRef]
- Schreiber, Thomas. 2000. Measuring information transfer. Physical Review Letters 85: 461. [Google Scholar] [CrossRef] [Green Version]
- Sensoy, Ahmet, Cihat Sobaci, Sadri Sensoy, and Fatih Alali. 2014. Effective transfer entropy approach to information flow between exchange rates and stock markets. Chaos, Solitons & Fractals 68: 180–85. [Google Scholar] [CrossRef]
- Shafiee, Shahriar, and Erkan Topal. 2010. An overview of global gold market and gold price forecasting. Resources Policy 35: 178–89. [Google Scholar] [CrossRef]
- Shang, Jin, and Shigeyuki Hamori. 2021. Do crude oil prices and the sentiment index influence foreign exchange rates differently in oil-importing and oil-exporting countries? A dynamic connectedness analysis. Resources Policy 74: 102400. [Google Scholar] [CrossRef]
- Shannon, Claude Elwood. 1948. A mathematical theory of communication. The Bell System Technical Journal 27: 379–423. [Google Scholar] [CrossRef]
- She, Qingshan, Hang Zheng, Tongcai Tan, Botao Zhang, Yingle Fan, and Zhizeng Luo. 2019. Time-Frequency-Domain Copula-Based Granger Causality and Application to Corticomuscular Coupling in Stroke. International Journal of Humanoid Robotics 16: 1950018. [Google Scholar] [CrossRef] [Green Version]
- Soytas, Ugur, Ramazan Sari, Shawkat Hammoudeh, and Erk Hacihasanoglu. 2009. World oil prices, precious metal prices and macroeconomy in Turkey. Energy Policy 37: 5557–66. [Google Scholar] [CrossRef]
- Teng, Yue, and Pengjian Shang. 2017. Transfer entropy coefficient: Quantifying level of information flow between financial time series. Physica A: Statistical Mechanics and Its Applications 469: 60–70. [Google Scholar] [CrossRef]
- Vukovic, Darko B., Kseniya A. Lapshina, and Moinak Maiti. 2021a. Wavelet coherence analysis of returns, volatility and interdependence of the US and the EU money markets: Pre & post crisis. The North American Journal of Economics and Finance 58: 101457. [Google Scholar]
- Vukovic, Darko, Moinak Maiti, Zoran Grubisic, Elena M. Grigorieva, and Michael Frömmel. 2021b. COVID-19 pandemic: Is the crypto market a safe haven? the impact of the first wave. Sustainability 13: 8578. [Google Scholar] [CrossRef]
- Wen, Danyan, Li Liu, Chaoqun Ma, and Yudong Wang. 2020. Extreme risk spillovers between crude oil prices and the US exchange rate: Evidence from oil-exporting and oil-importing countries. Energy 212: 118740. [Google Scholar] [CrossRef]
- Wen, Fenghua, Xi Tong, and Xiaohang Ren. 2022. Gold or Bitcoin, which is the safe haven during the COVID-19 pandemic? International Review of Financial Analysis 81: 102121. [Google Scholar] [CrossRef]
- Yao, Can-Zhong, and Hong-Yu Li. 2020. Effective transfer entropy approach to information flow among epu, investor sentiment and stock market. Frontiers in Physics 8: 206. [Google Scholar] [CrossRef]
- Yaya, OlaOluwa S., Mohammed M. Tumala, and Christopher G. Udomboso. 2016. Volatility persistence and returns spillovers between oil and gold prices: Analysis before and after the global financial crisis. Resources Policy 49: 273–81. [Google Scholar] [CrossRef]
- Yıldırım, Durmuş Çağrı, Emrah Ismail Cevik, and Ömer Esen. 2020. Time-varying volatility spillovers between oil prices and precious metal prices. Resources Policy 68: 101783. [Google Scholar] [CrossRef]
- Youssef, Manel, and Khaled Mokni. 2020. Modeling the relationship between oil and USD exchange rates: Evidence from a regime-switching-quantile regression approach. Journal of Multinational Financial Management 55: 100625. [Google Scholar] [CrossRef]
- Zhang, Yaojie, Mengxi He, Yudong Wang, and Chao Liang. 2022a. Global economic policy uncertainty aligned: An informative predictor for crude oil market volatility. International Journal of Forecasting. [Google Scholar] [CrossRef]
- Zhang, Yaojie, M. I. M. Wahab, and Yudong Wang. 2022b. Forecasting crude oil market volatility using variable selection and common factor. International Journal of Forecasting 39: 486–502. [Google Scholar] [CrossRef]
- Zhang, Yue-Jun, and Yao-Bin Wu. 2019. The time-varying spillover effect between WTI crude oil futures returns and hedge funds. International Review of Economics & Finance 61: 156–69. [Google Scholar]
- Zhang, Zitao, and Yun Qin. 2022. Study on the nonlinear interactions among the international oil price, the RMB exchange rate and China’s gold price. Resources Policy 77: 102683. [Google Scholar] [CrossRef]
- Zolfaghari, Mehdi, Hamed Ghoddusi, and Fatemeh Faghihian. 2020. Volatility spillovers for energy prices: A diagonal BEKK approach. Energy Economics 92: 104965. [Google Scholar] [CrossRef]
Figure 1.
Oil, Gold, and EUR/USD daily returns plots between 3 January 2018 to 30 December 2021.

Figure 2.
(a–c): Renyi transfer entropy for different values of q.


Table 1.
Stationarity test results.
| EUR/USD | Oil | Gold | |
|---|---|---|---|
| ADF | −32.176 | −23.14 | −32.406 |
| p value | 0.01 | 0.01 | 0.01 |
| KPSS | 0.29341 | 0.068584 | 0.10441 |
| p value | 0.1 | 0.1 | 0.1 |
Table 2.
Descriptive Statistics.
| EUR/USD | Oil | Gold | |
|---|---|---|---|
| Mean | −2.18 × 10⁻⁵ | −0.00288 | 0.000381 |
| Median | 0.00017 | 0.002286 | 0.000584 |
| Maximum | 0.014509 | 0.376623 | 0.059477 |
| Minimum | −0.02782 | −3.05966 | −0.04979 |
| Std. Dev. | 0.004055 | 0.110553 | 0.009629 |
| Skewness | −0.3731 | −22.6229 | −0.15439 |
| Kurtosis | 5.792471 | 603.6905 | 8.969453 |
Table 3.
(a) and (b): Shannon entropy estimates for EUR/USD and Oil.
| (a) Total | ||||||||||
| Direction | TE | Eff. TE | Std. Err. | p value | ||||||
| X->Y | 0.0154 | 0.007 | 0.0036 | 0.05 | * | |||||
| Y->X | 0.0183 | 0.0108 | 0.0033 | 0.0033 | ** | |||||
| Bootstrapped TE Quantiles (300 replications): | ||||||||||
| Direction | 0% | 25% | 50% | 75% | 100% | |||||
| X->Y | 0.0017 | 0.0045 | 0.0065 | 0.0094 | 0.0194 | |||||
| Y->X | 0.001 | 0.0064 | 0.0089 | 0.0113 | 0.0217 | |||||
| (b) | Before COVID | During COVID | ||||||||
| Direction | TE | Eff. TE | Std. Err. | p value | TE | Eff. TE | Std. Err. | p value | ||
| X->Y | 0.0141 | 0 | 0.0057 | 0.3467 | 0.018 | 0.0033 | 0.0058 | 0.28 | ||
| Y->X | 0.0048 | 0 | 0.0049 | 0.86 | 0.0232 | 0.0103 | 0.0051 | 0.0133 | * | |
| Bootstrapped TE Quantiles (300 replications) | ||||||||||
| Direction | 0% | 25% | 50% | 75% | 100% | 0% | 25% | 50% | 75% | 100% |
| X->Y | 0.0006 | 0.0064 | 0.0091 | 0.0131 | 0.028 | 0.0007 | 0.0071 | 0.0099 | 0.0141 | 0.0315 |
| Y->X | 0.0013 | 0.0086 | 0.0119 | 0.0162 | 0.0382 | 0.0035 | 0.0114 | 0.014 | 0.0186 | 0.0407 |
Note: p-values: 0.001 ‘***’, 0.01 ‘**’, 0.05 ‘*’; X: EUR/USD & Y: Oil.
Table 4.
(a) and (b): Shannon entropy estimates for EUR/USD and Gold.
| (a) Total | ||||||||||
| Direction | TE | Eff. TE | Std. Err. | p value | ||||||
| X->Y | 0.011 | 0.0039 | 0.0032 | 0.11 | ||||||
| Y->X | 0.0319 | 0.0244 | 0.0037 | 0 | *** | |||||
| Bootstrapped TE Quantiles (300 replications) | ||||||||||
| Direction | 0% | 25% | 50% | 75% | 100% | |||||
| X->Y | 0.0013 | 0.0048 | 0.0068 | 0.0092 | 0.0248 | |||||
| Y->X | 0.0012 | 0.0044 | 0.0067 | 0.0088 | 0.0174 | |||||
| (b) | Before COVID | During COVID | ||||||||
| Direction | TE | Eff. TE | Std. Err. | p value | TE | Eff. TE | Std. Err. | p value | ||
| X->Y | 0.0037 | 0 | 0.0049 | 0.8833 | 0.0185 | 0.0058 | 0.0056 | 0.1233 | ||
| Y->X | 0.0514 | 0.0415 | 0.0046 | 0 | *** | 0.0428 | 0.0321 | 0.0056 | 0 | *** |
| Bootstrapped TE Quantiles (300 replications): | ||||||||||
| Direction | 0% | 25% | 50% | 75% | 100% | 0% | 25% | 50% | 75% | 100% |
| X->Y | 0.0015 | 0.0066 | 0.0095 | 0.0129 | 0.0315 | 0.001 | 0.0073 | 0.011 | 0.0153 | 0.032 |
| Y->X | 0.0006 | 0.0056 | 0.0086 | 0.0116 | 0.0269 | 0.0019 | 0.0081 | 0.0114 | 0.0158 | 0.0334 |
Note: p-values: 0.001 ‘***’, 0.01 ‘**’, 0.05 ‘*’; X: EUR/USD & Y: Gold.
Table 5.
(a) and (b): Shannon entropy estimates for Oil and Gold.
| (a) Total | ||||||||||
| Direction | TE | Eff. TE | Std. Err. | p value | ||||||
| X->Y | 0.0118 | 0.0045 | 0.0033 | 0.1133 | ||||||
| Y->X | 0.0149 | 0.0056 | 0.0032 | 0.04 | * | |||||
| Bootstrapped TE Quantiles (300 replications) | ||||||||||
| Direction | 0% | 25% | 50% | 75% | 100% | |||||
| X->Y | 0.0028 | 0.0065 | 0.0085 | 0.0108 | 0.0226 | |||||
| Y->X | 0.0018 | 0.0052 | 0.0072 | 0.0096 | 0.0175 | |||||
| (b) | Before COVID | During COVID | ||||||||
| Direction | TE | Eff. TE | Std. Err. | p value | TE | Eff. TE | Std. Err. | p value | ||
| X->Y | 0.0212 | 0.0124 | 0.0046 | 0.01 | ** | 0.0191 | 0.0058 | 0.0061 | 0.1467 | |
| Y->X | 0.011 | 0 | 0.006 | 0.52 | 0.0265 | 0.0102 | 0.0061 | 0.03 | * | |
| Bootstrapped TE Quantiles (300 replications) | ||||||||||
| Direction | 0% | 25% | 50% | 75% | 100% | 0% | 25% | 50% | 75% | 100% |
| X->Y | 0.0004 | 0.0079 | 0.0112 | 0.0158 | 0.0345 | 0.0029 | 0.0104 | 0.0134 | 0.0175 | 0.0434 |
| Y->X | 0.0004 | 0.0056 | 0.0087 | 0.012 | 0.0253 | 0.0013 | 0.0081 | 0.0118 | 0.0166 | 0.0348 |
Note: p-values: 0.001 ‘***’, 0.01 ‘**’, 0.05 ‘*’; X: Oil & Y: Gold.
Disclaimer/Publisher’s Note: The statements, opinions and data contained in all publications are solely those of the individual author(s) and contributor(s) and not of MDPI and/or the editor(s). MDPI and/or the editor(s) disclaim responsibility for any injury to people or property resulting from any ideas, methods, instructions or products referred to in the content. |
© 2022 by the authors. Licensee MDPI, Basel, Switzerland. This article is an open access article distributed under the terms and conditions of the Creative Commons Attribution (CC BY) license (https://creativecommons.org/licenses/by/4.0/).
Share and Cite
MDPI and ACS Style
Maiti, M.; Kayal, P. Asymmetric Information Flow between Exchange Rate, Oil, and Gold: New Evidence from Transfer Entropy Approach. J. Risk Financial Manag. 2023, 16, 2. https://0-doi-org.brum.beds.ac.uk/10.3390/jrfm16010002
AMA Style
Maiti M, Kayal P. Asymmetric Information Flow between Exchange Rate, Oil, and Gold: New Evidence from Transfer Entropy Approach. Journal of Risk and Financial Management. 2023; 16(1):2. https://0-doi-org.brum.beds.ac.uk/10.3390/jrfm16010002
Chicago/Turabian StyleMaiti, Moinak, and Parthajit Kayal. 2023. "Asymmetric Information Flow between Exchange Rate, Oil, and Gold: New Evidence from Transfer Entropy Approach" Journal of Risk and Financial Management 16, no. 1: 2. https://0-doi-org.brum.beds.ac.uk/10.3390/jrfm16010002