1. Introduction
Conceptually, Efficient Market Hypothesis [hence, EMH] gives an indication that current stock prices are reflections of available information, whether private and/or public in nature (see:
Saglam and Guresci 2018;
Grabowski 2019). Notwithstanding this, while the EMH has been tested using various stock markets from advanced, emerging and developing countries (see for example,
Yang et al. 2019;
Kelikume et al. 2020), its connectivity with technological innovation remains unexplored in the literature. However, there are clear examples in the literature to suggest that a market could be efficient (see
Van et al. 2013;
Bulla 2015;
Yang et al. 2019) or inefficient (see
Nguyen and Muhammad 2011;
Dong et al. 2013;
Awiagah and Choi 2018;
Saglam and Guresci 2018;
Zaman 2019;
Kelikume et al. 2020), particularly with reference to the stock market. In recent times, there is growing concern on EMH losing strength, owing especially to the technological bubble of 1995 to 2000 and the financial crisis of 2007/2008, a period which was characterized with many investors making abnormal returns (see
Gilson and Kraakman 2014;
McAleer et al. 2016;
Kelikume et al. 2020). It is now an issue of concern on the potential roles of technology in either achieving efficient market hypothesis or the alternative. Specifically, the rate of technology advancement and its spread across various stock markets gives an indication on the nexus between the technology shock and the EMH. As a result, it is rather pertinent as to how far-reaching the impact of technological progress can further ensure EMH.
There is evidence of studies that have discussed stock returns in relative terms via technology, though with no particular reference to international shock propagation (see
Yang 2013;
Kogan and Papanikolaou 2014;
Garlappi and Song 2017;
Prabheesh and Vidya 2018;
Grabowski 2019), there are also studies on technology shock propagation in relation to exchange rate behaviour (see:
Corsetti et al. 2014;
Nam and Wang 2015;
Miyamoto and Nguyen 2017;
Klein and Linnemann 2021) and business cycle and financial friction (see
Kamber et al. 2015). But, studies with specific interest on the wider implications of technology shock with respect to stock market efficiency is lacking in the literature. In other words, the discussion on the efficiency or inefficiency of markets through technology shock has not been given serious attention in the previous studies. Hence, our aim in this regard is to contribute to this discussion by investigating the role of technology shock in achieving market efficiency. For our discussion, we shall take a global look by giving consideration to a group of advanced (Euro and non-Euro countries) and emerging market economies. The idea is to present a wider implication of the shock analysis for both developed and emerging markets. If indeed the market is efficient, a positive shock to technology shocks should necessarily increase the stock volume, but not returns or price. It is believed that the investors are exposed to all available information in the markets, which would not lead to arbitrarily higher stock returns. Any other option that is rather contrary will lead to a case of weak efficiency or inefficiency.
We rely on the GVAR model for our choice of methodology. This model appropriately reflects the individual country’s content of the shock propagation and also gives insight into the region-specific information. Aside, the result estimations from GVAR model analysis are usually large and include a preliminary test, impulse response functions, and main results. On the proxy for technology shock, many related studies measured it through investment specific technology shock [IST] (see, for example,
Grabowski 2019) and proxy-instrumental variables from total factor productivity (see for example
Klein and Linnemann 2021), but in this study, technology shock is captured through recently computed technology shock data by
Sharma and Narayan (
2022). The computation of this variable uses the growth of a number of patents in all of the countries considered. It equally has very large scope (more than 100 years) and the process of its computation helps to eliminate the look-ahead bias, as it is measured on a 5-year rolling window. The idea is to account for the time between the application of the patent right and the time it is often granted in many countries, where its impact within this time-frame becomes manifested in the economy.
However, these computed shock series have three components, and each has two variants: the series for the US, for the group of 164 countries (given the data availability), and the series for the group of OECD countries (12 in number). Each series appears in the original form as well as in the standardized form. As defined by the scope of this study which is essentially based on the developed and emerging market economies, we make use of the technology shock for 164 countries (hence referred to as GTS-164) and the one for OECD specific countries (hence, GTS-OECD). While computing the shocks, emphasis is much more on the detrending of growth in patents for the concerned country. In particular, the current technology shock is computed by taking the natural logarithms of the number of patents and detrend its growth rate on 5 year rolling windows. In order to compute the global technology shock, the number of patents is added for each of the 164 countries. Thereafter, its natural logarithm is taken and then detrended using a 5-year moving window. For the OECD specific technology shock, the addition of the number of patents and the detrending process is now for all 12 of the OECD countries considered in the computation (see
Sharma and Narayan 2022).
We can make a summary of our findings as follows. One, we find that GTS-164 raises real equity prices in nearly 70% of the markets, and this was sustained throughout the forecast periods. This indicates that only a few markets are efficient when global technology shock is considered. In the other outcome, the response of real equity prices to GTS-OECD is rather different. While this shock results in the immediate rise in real equity prices for more than 85% of the markets, it is evidently short lived below the fourth quarter of the forecast horizon, with an average rise of 0.72%. However, in our further analysis, the countries are grouped into various blocs where both GST-164 and GTS-OECD are considered, and the outcome reveals that many of the economic blocs could not easily absorb the GTS-164 shock except the emerging and Euro markets. As for GTS-OECD, the impact of the shock on various economic regions is transient and rarely extends beyond the second quarter of the forecast horizon. Hence, market efficiency for the equity-shock nexus is assured for region specific shock rather than the one with a more global outlook.
Apart from the foregoing, the balance of this paper entails the sections on the data and methodology, the preliminary analysis, and the result discussion. The last section presents the conclusion and the policy implications.
2. Methodology
As a way to test for the efficiency of the real equity market for the Euro, non-Euro and emerging markets, we adopt the Global Vector Auto-Regressive (GVAR) approach by
Chudik and Pesaran (
2013) and
Smith and Galesi (
2014). In this approach, we analyze the individual countries’
VARX*(
pi,
qi) models across
group of developed (Euro and non-Euro) and emerging markets such that:
. The
VARX*(
pi,
qi) model for each country and region expresses the endogenous variables as functions of both foreign and common variables. However, the GVAR model being a data base contains country-specific endogenous variables which in this case are: real GDP, inflation, real equity prices, real exchange rate, and short interest rate. In addition, the global variables are commodity prices and metal prices. We then augment these data with measures of global technology shock, of which there are of two variants: the global technology shock for the group of 164 countries (GTS-164), and the region-specific technology shock for the group of OECD countries (GTS-OECD). Given this, our GVAR framework is presented as follows:
From this equation, the variable
is a
vector of country-specific variables denoted with
, where
runs from 1 to
N (such that
N = 33) in a particular period
(where
). Also, the variable
is the corresponding
vector of foreign variables constructed as trade-weighted counterparts of the local variables. Hence,
from where
1 and
wii = 0. The external common (global) factors are represented with
and their values are repeated for all the cross-sections. Again,
, which runs as
, is a
matrix of unknown parameters for domestic variables;
(where
) is a
matrix of unknown parameters for the lag of foreign variables, and
(where
) is an
matrix of unknown parameters for the lag of global variables which are repeated for all the cross-sections; while
is a vector (i.e.,
) of error terms. Both
and
are the parameters for the current periods as defined for variables above. However, we factor all the foreign and common factor variables as weakly exogenous in this context. As shown in Equation (1), we stack the estimated country-specific model to form a large GVAR model from which the effect of the global technology shock on international real equity prices is formed.
3. Data and Preliminary Analyses
There are two datasets combined in this study. The first is the traditional GVAR dataset that contains both the domestic and foreign variables. On this, we refer our readers to the GVAR toolbox of
Smith and Galesi (
2014) for the original data as well as the recently updated version by
Mohaddes and Raissi (
2020)
2, which covers the period up to the end of 2019. The second dataset which covers the technology shock data is incorporated into the GVAR model as a global variable. The construction of technology shock that this study employs follows some specific steps which principally involve the detrending of growth in patents for the concerned country (see
Sharma and Narayan (
2022) for technical details).
3 In particular, the current technology shock is estimated by taking the natural logarithms of the number of patents and detrending its growth rate on 5-year rolling windows. The 5-year window accounts for the periods that often lie between the application for the patent right and the period when it is granted in various countries of consideration
4. This process of detrending as applied in deriving the shocks essentially helps to eliminate the problem associated with look-ahead bias. A similar approach is followed to derive the global technology shock, where the number of patents is added for each of the 164 countries for which data are available. Thereafter, its natural logarithm is taken and then detrended using a 5-year moving window. For the OECD-specific technology shock, the addition of the number of patents and the detrending process is now for only 12 OECD countries (see
Sharma and Narayan 2022 and other papers as cited in the paper in lieu of construction of the shock). Although the technology shock series has a broader scope (more than 100 years for the least countries), our scope is limited to the periods between 1980 and 2018. The start date is defined by the data on real stock prices (as well as other variables in the GVAR model), and the end date is defined by the series on technology shock. However, while the real equity prices are quarterly data, that of the technology shock is annual. It is believed that market efficiency will hold when stock prices have no significant response to the innovation arising from technology shock and the reverse will be assured when the opposite takes place.
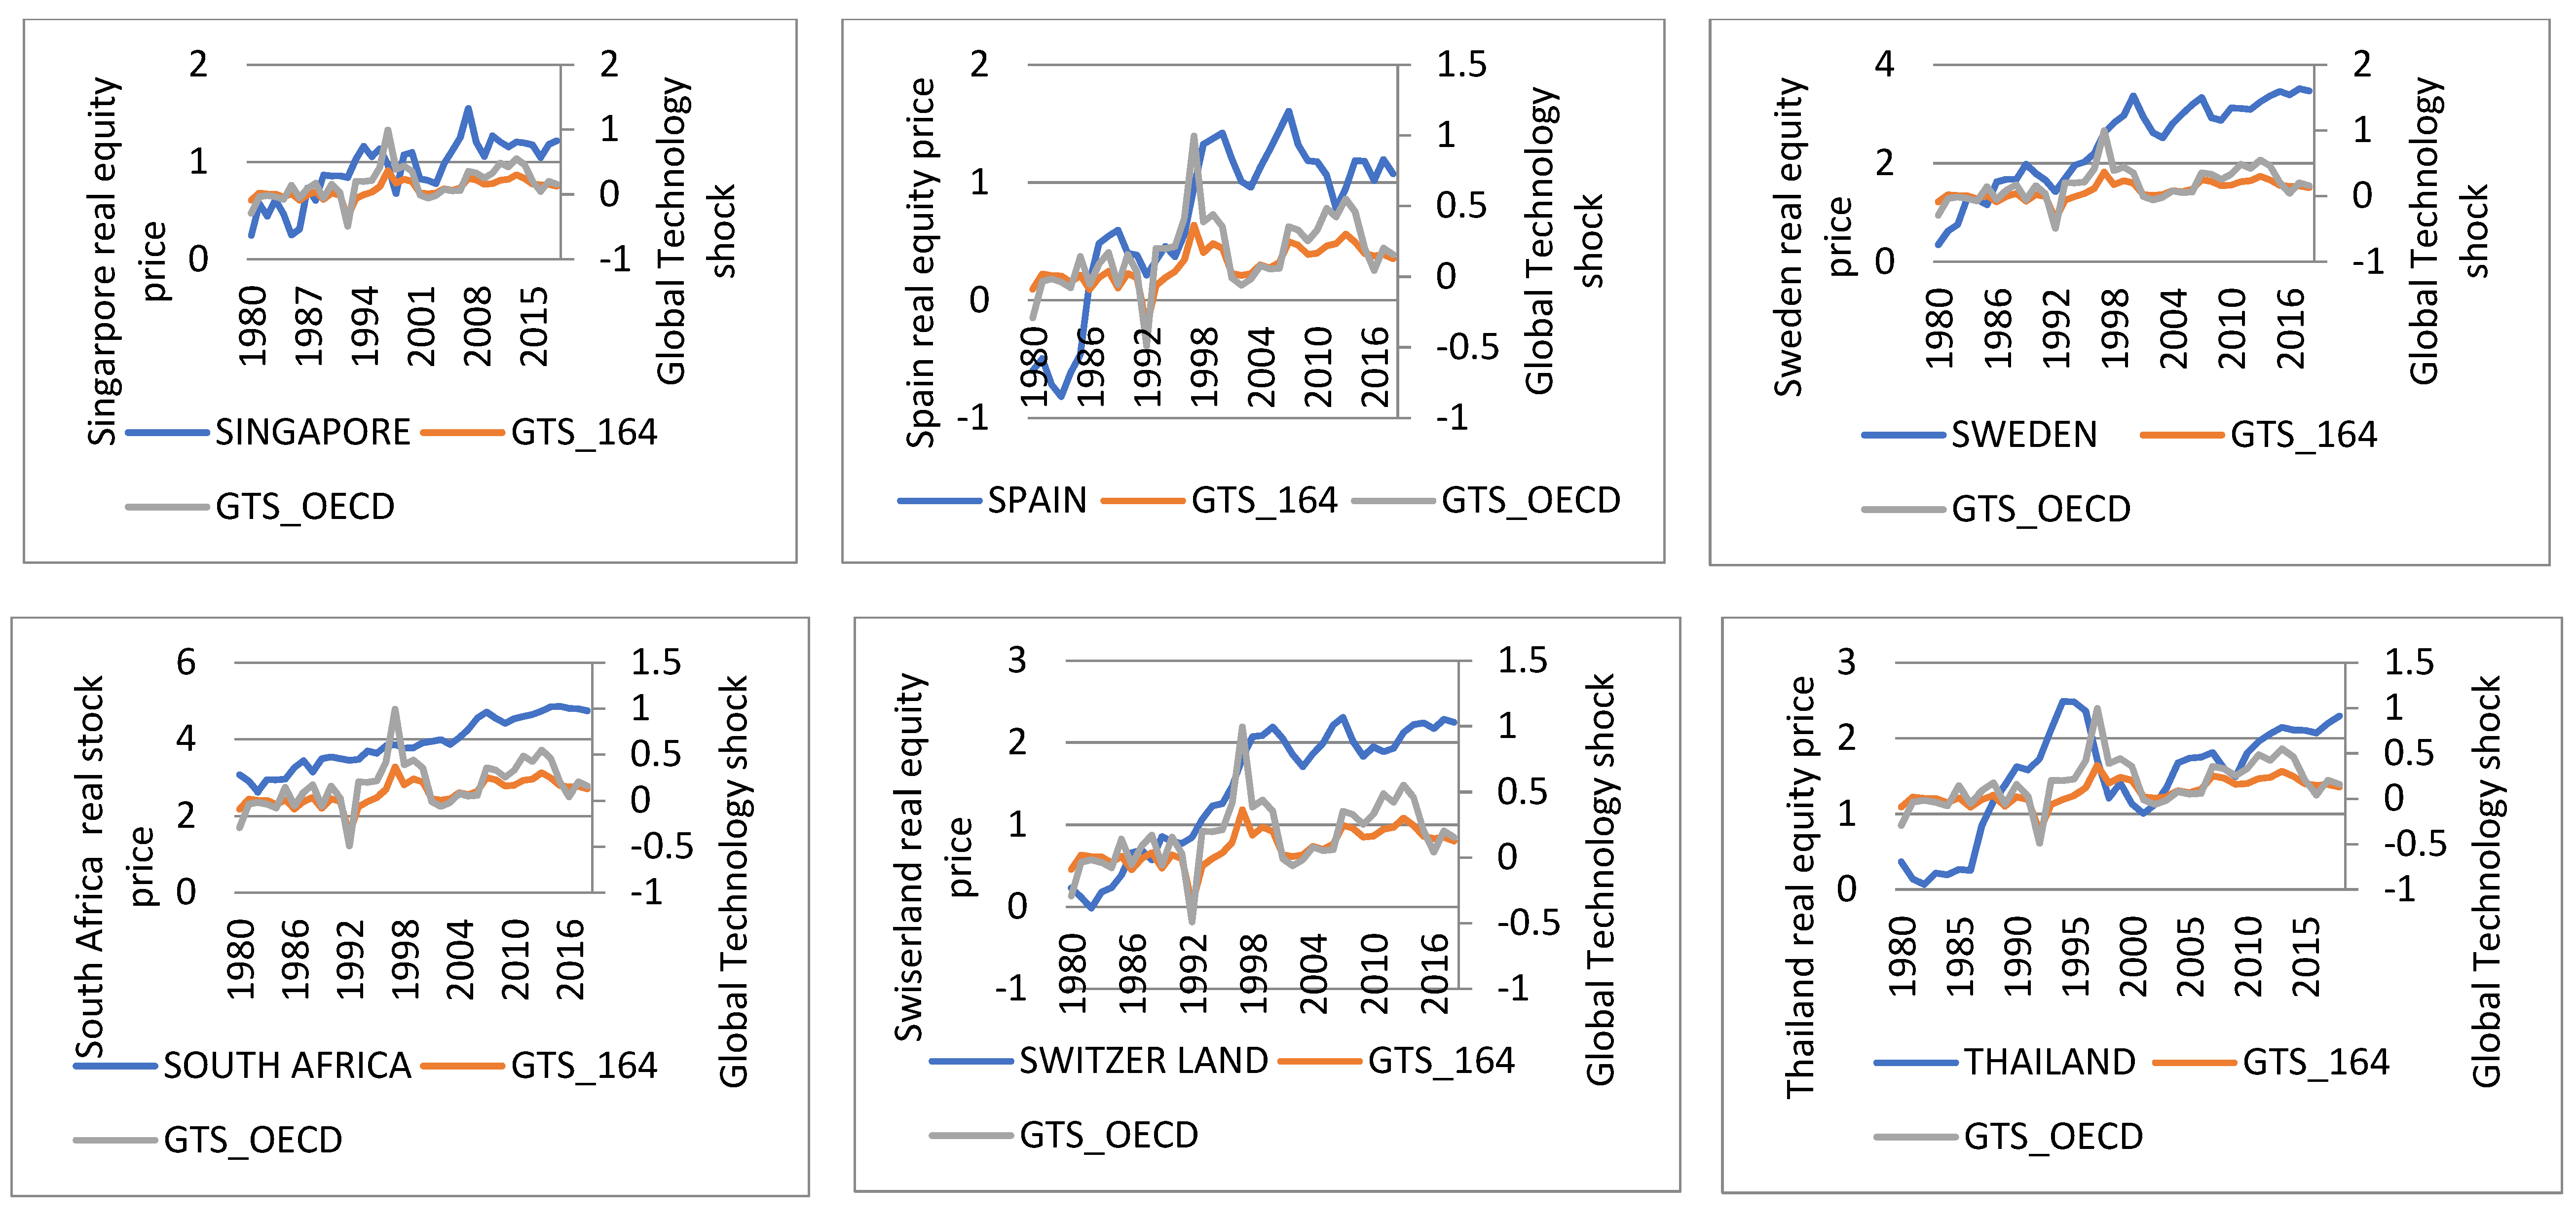
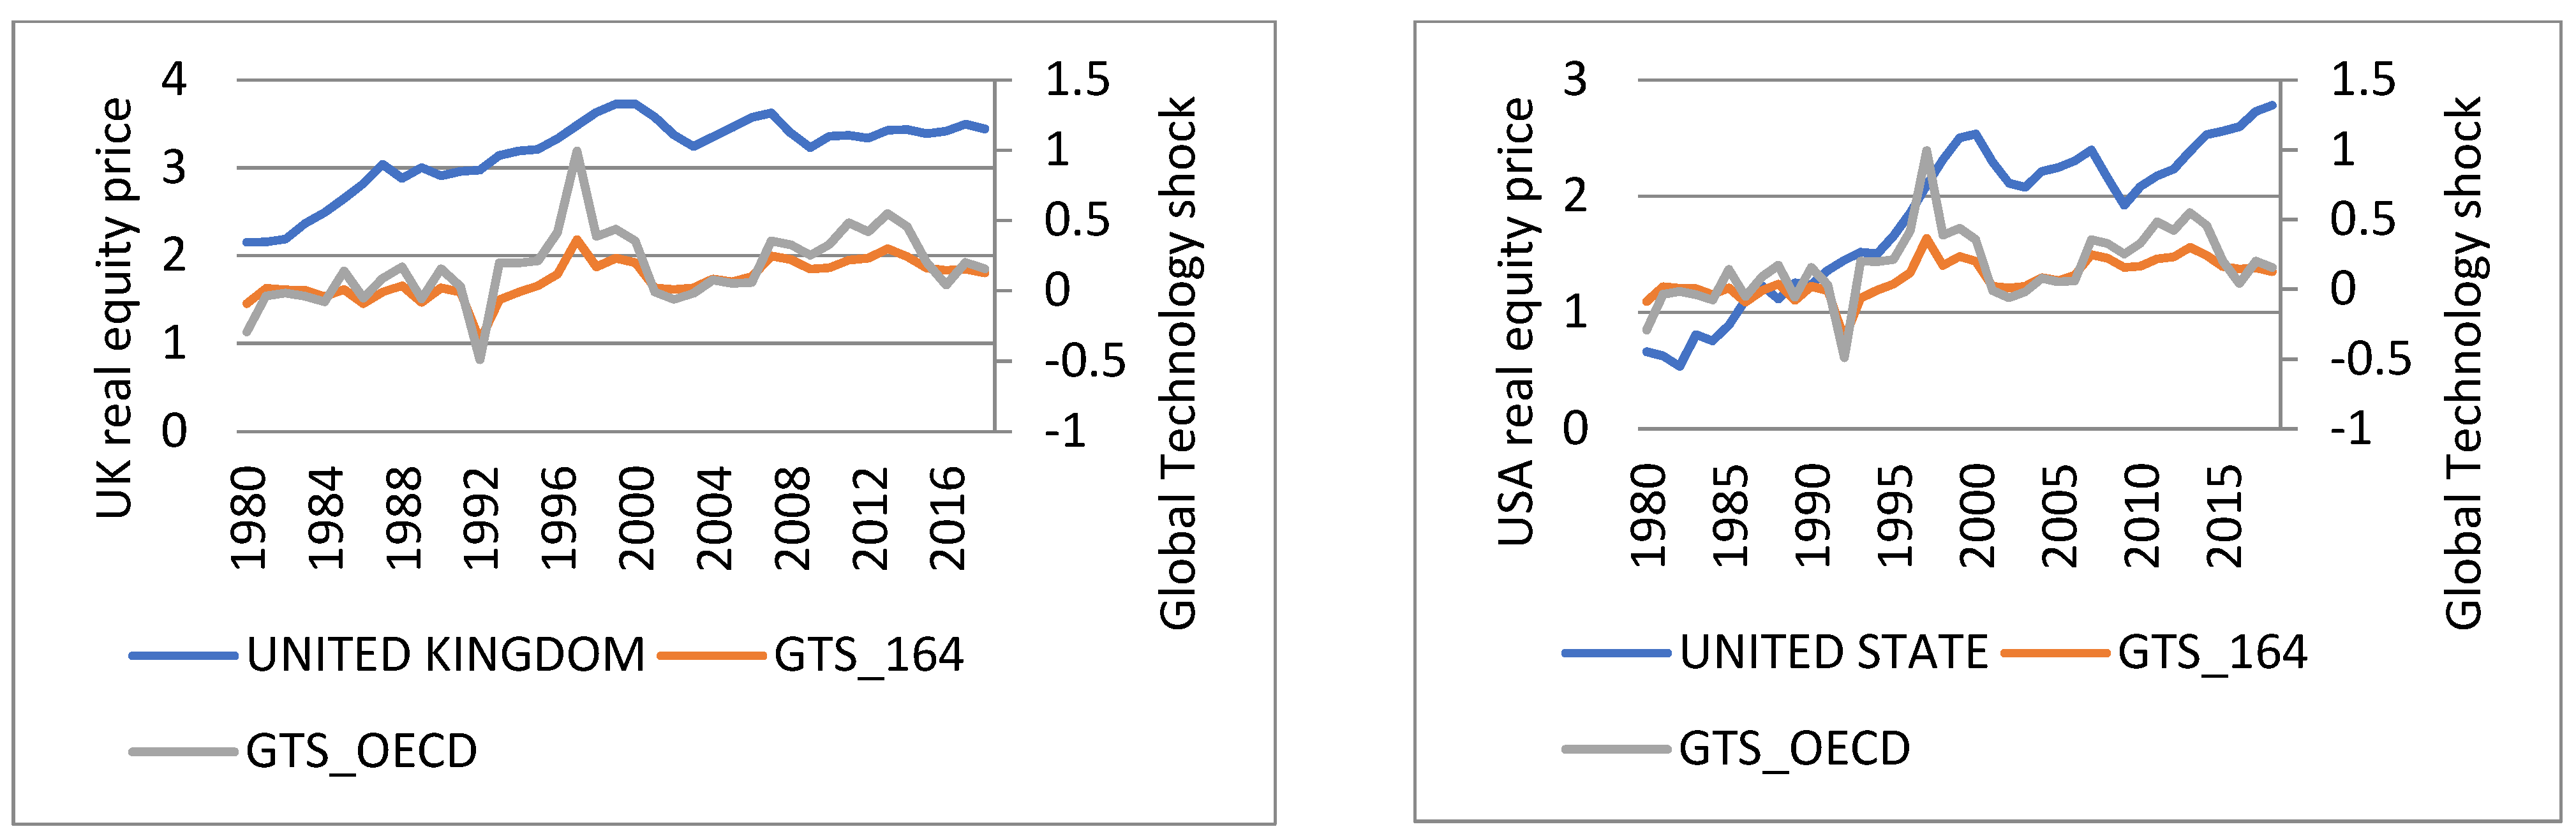
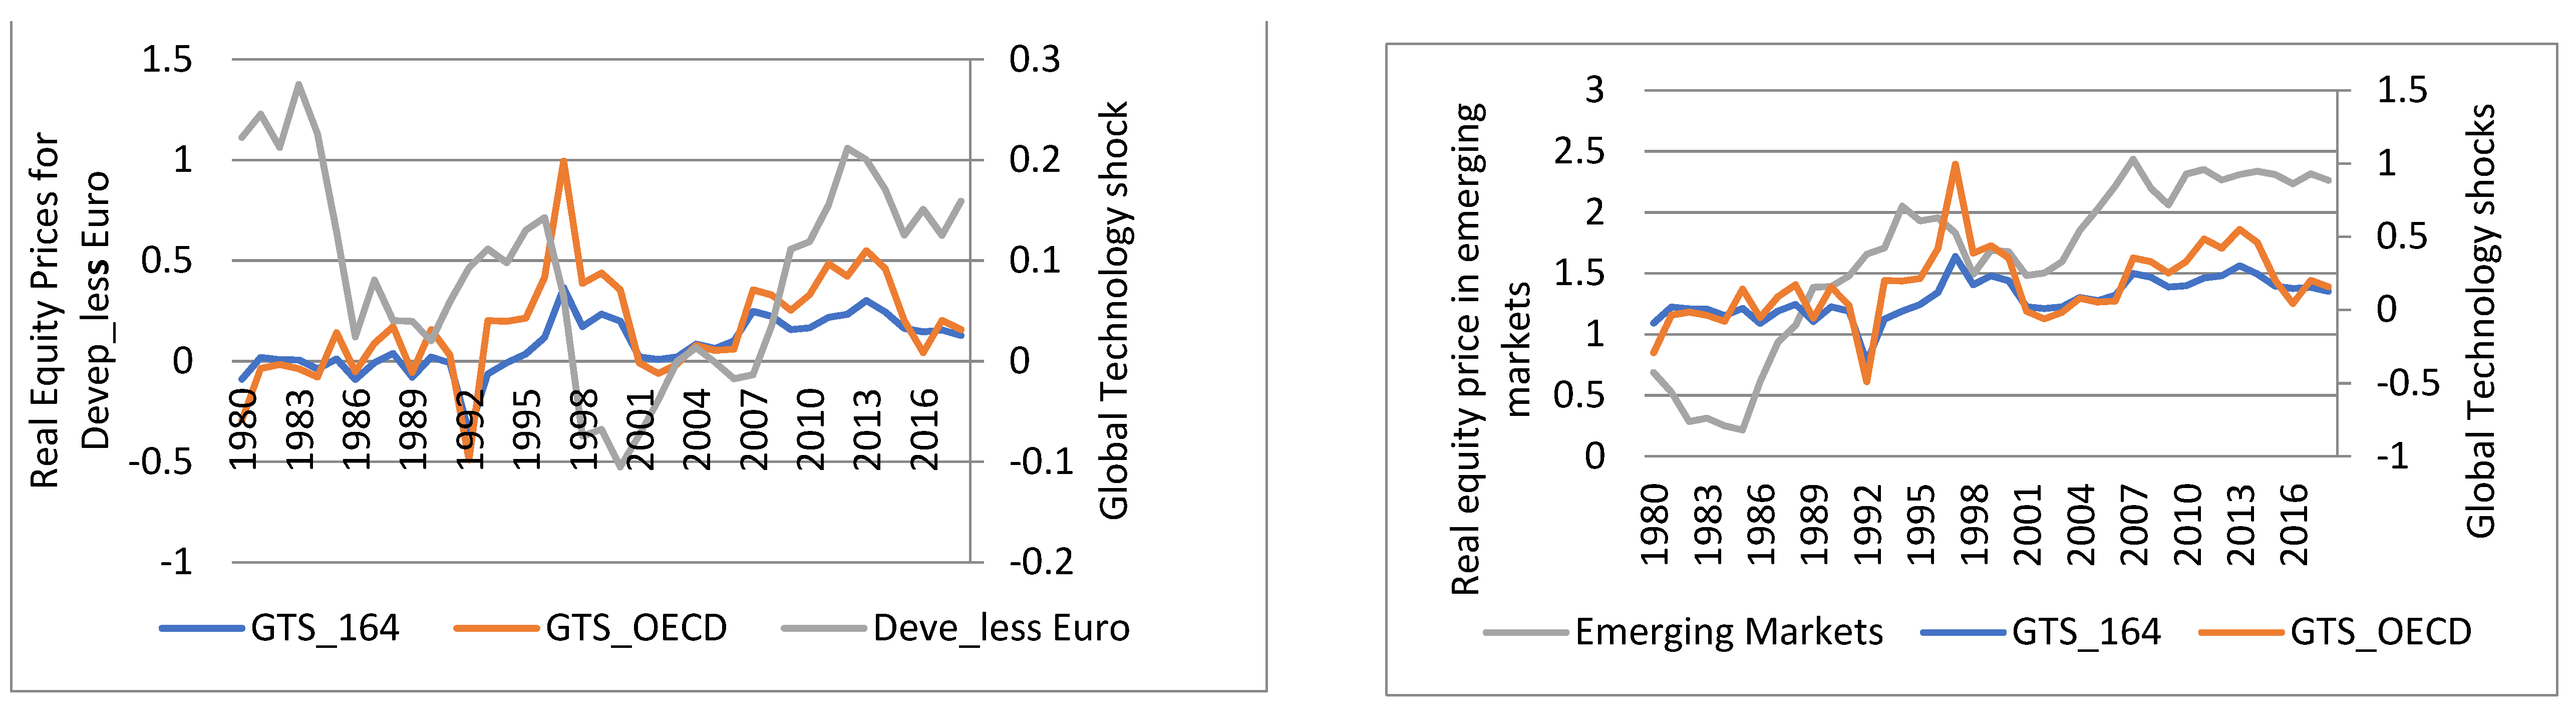
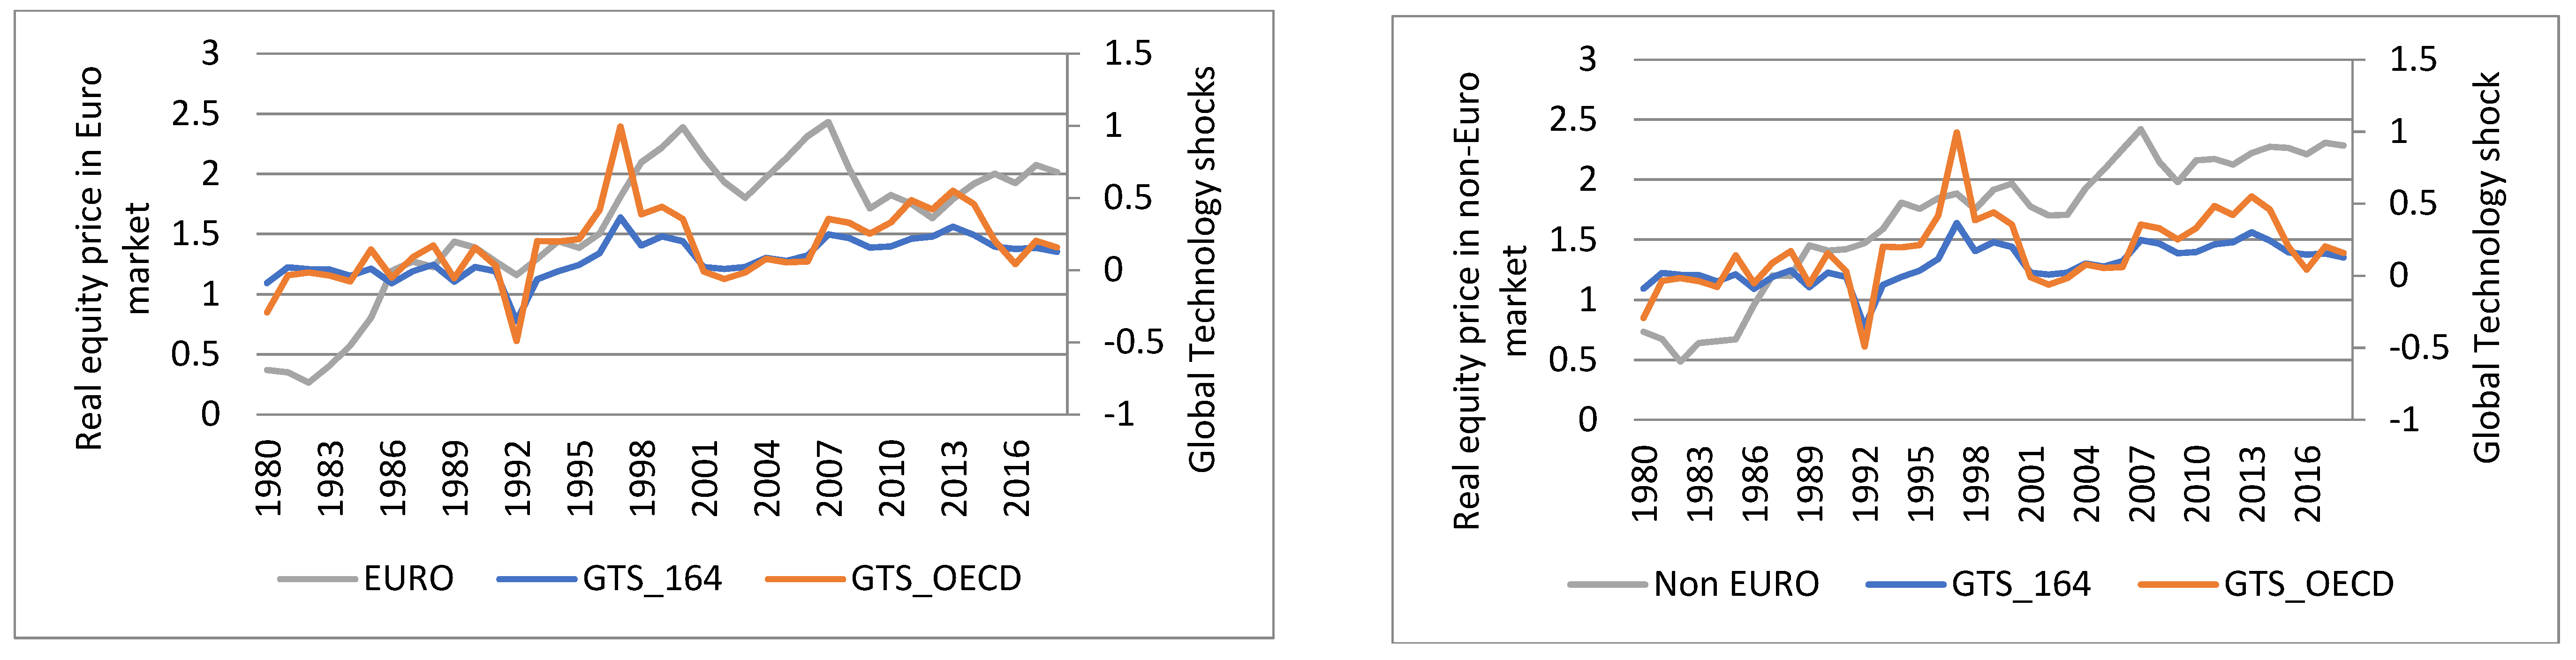
The background information about the variables is provided in
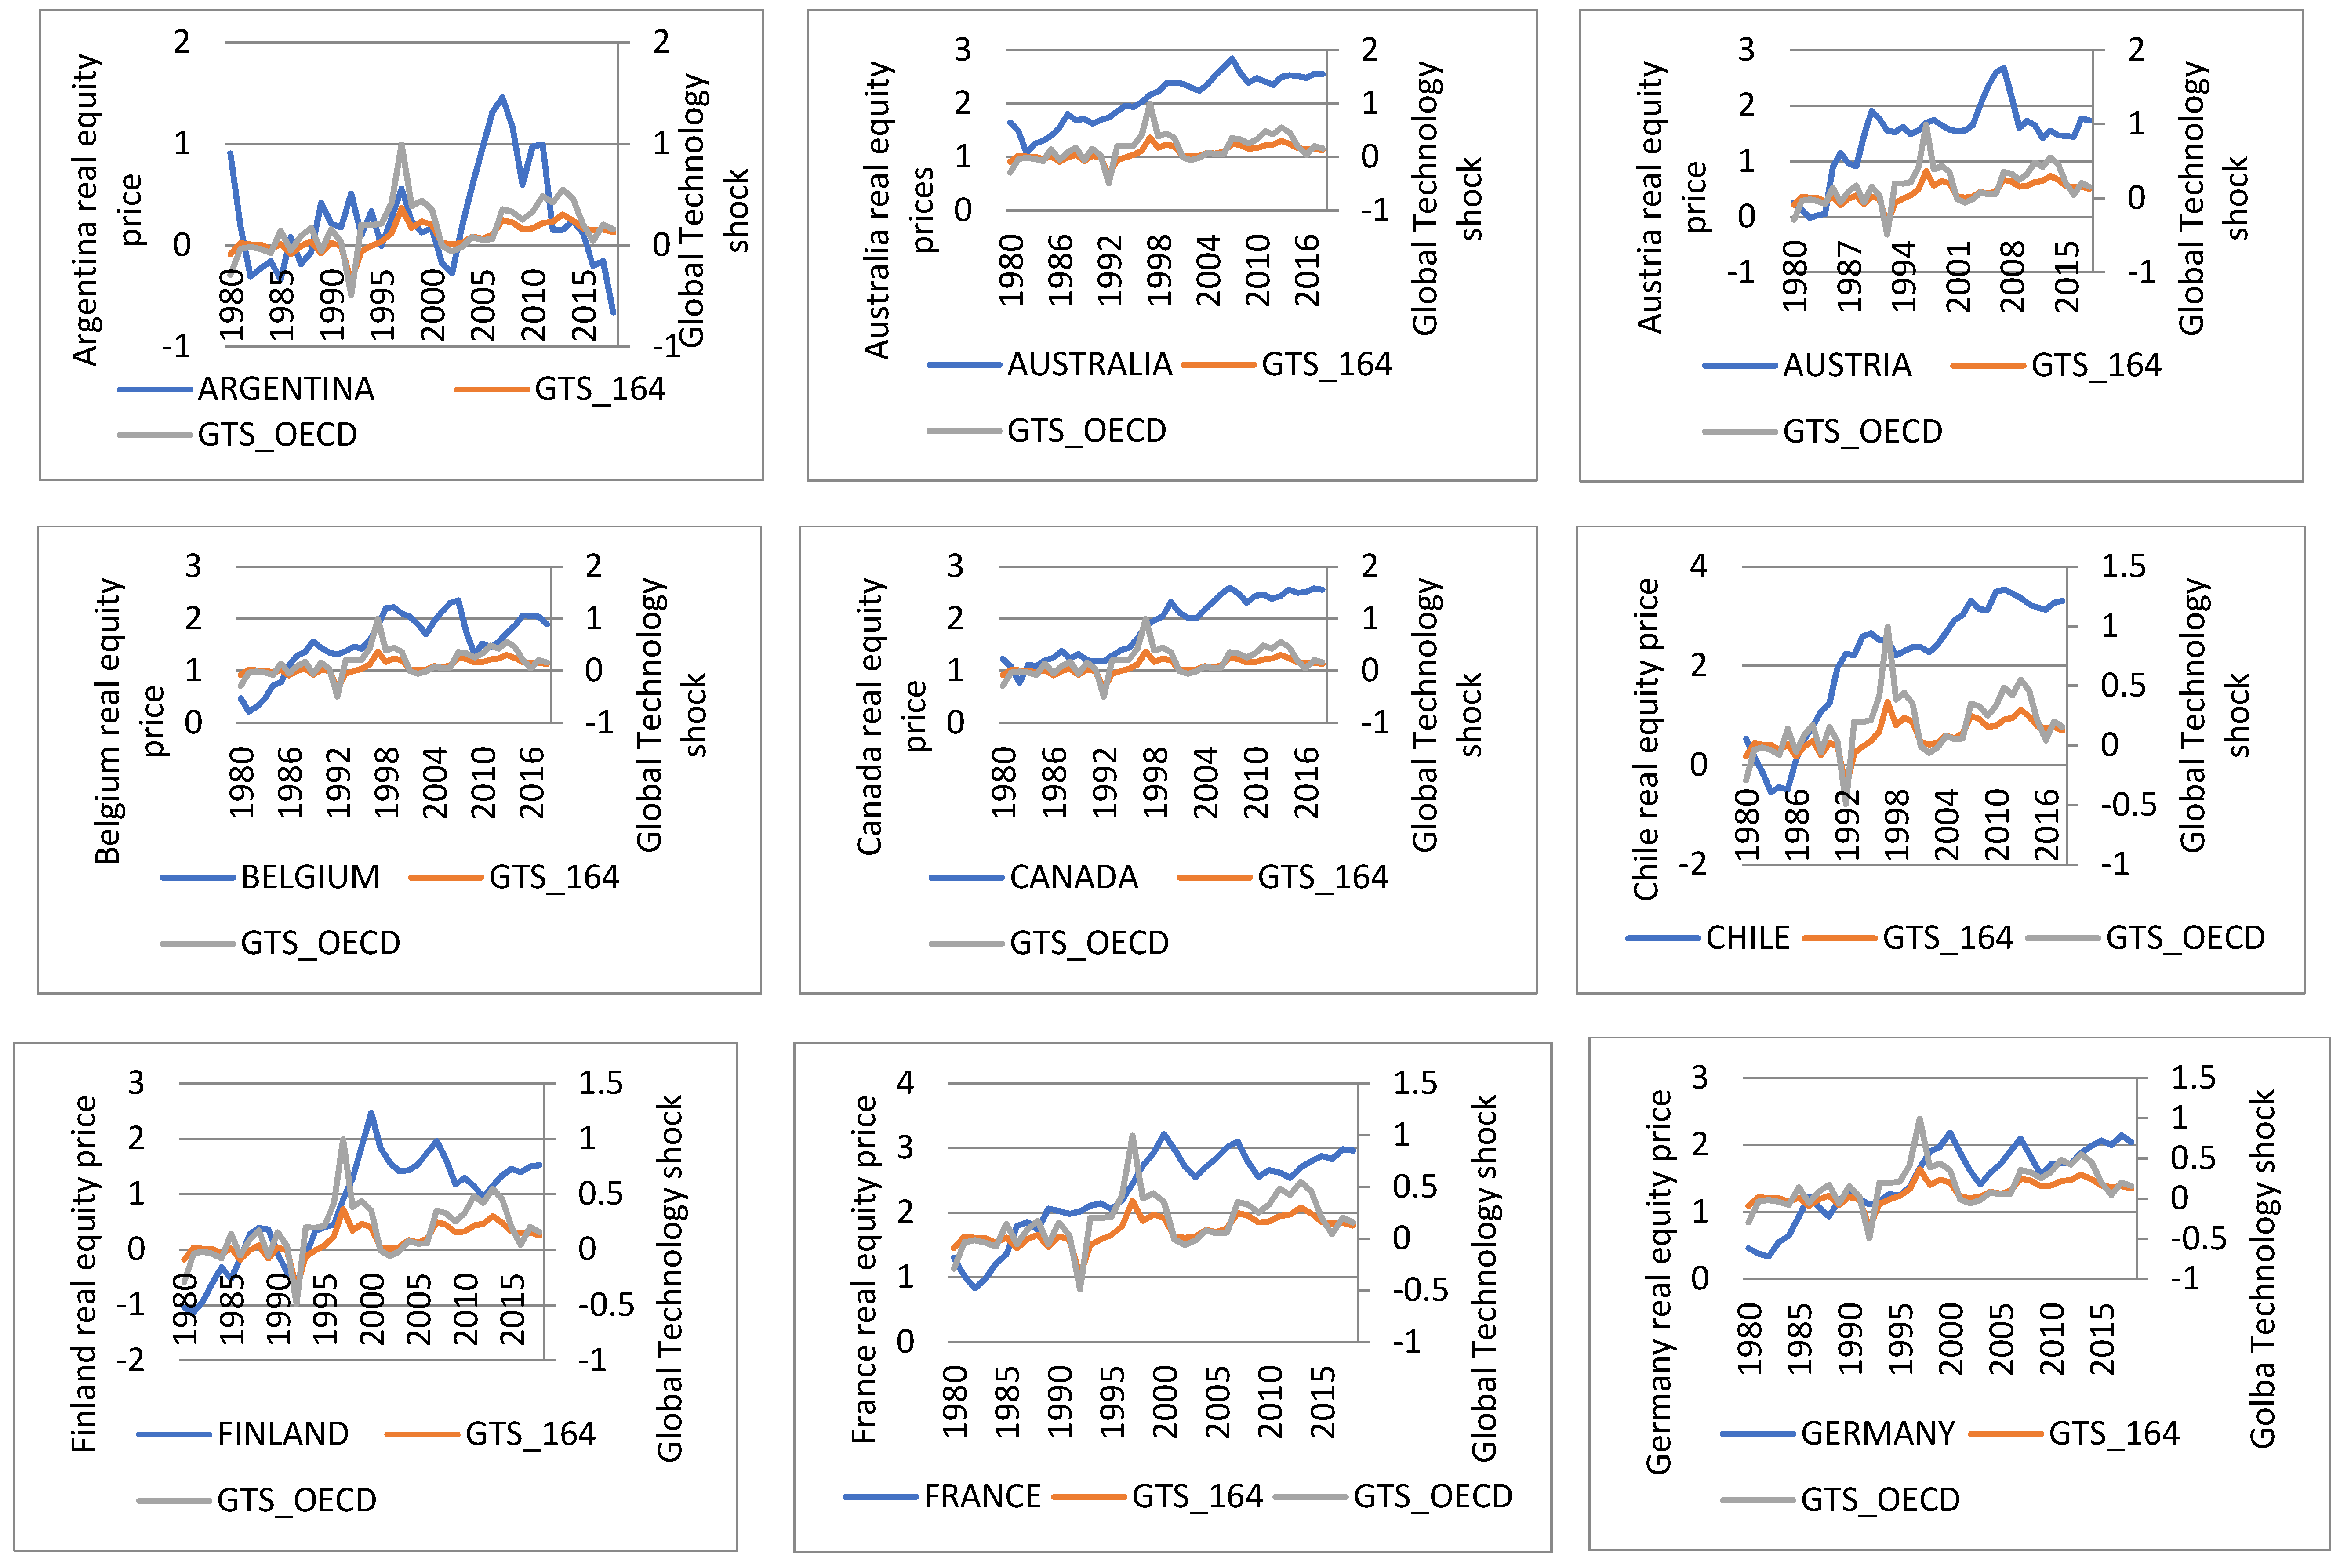
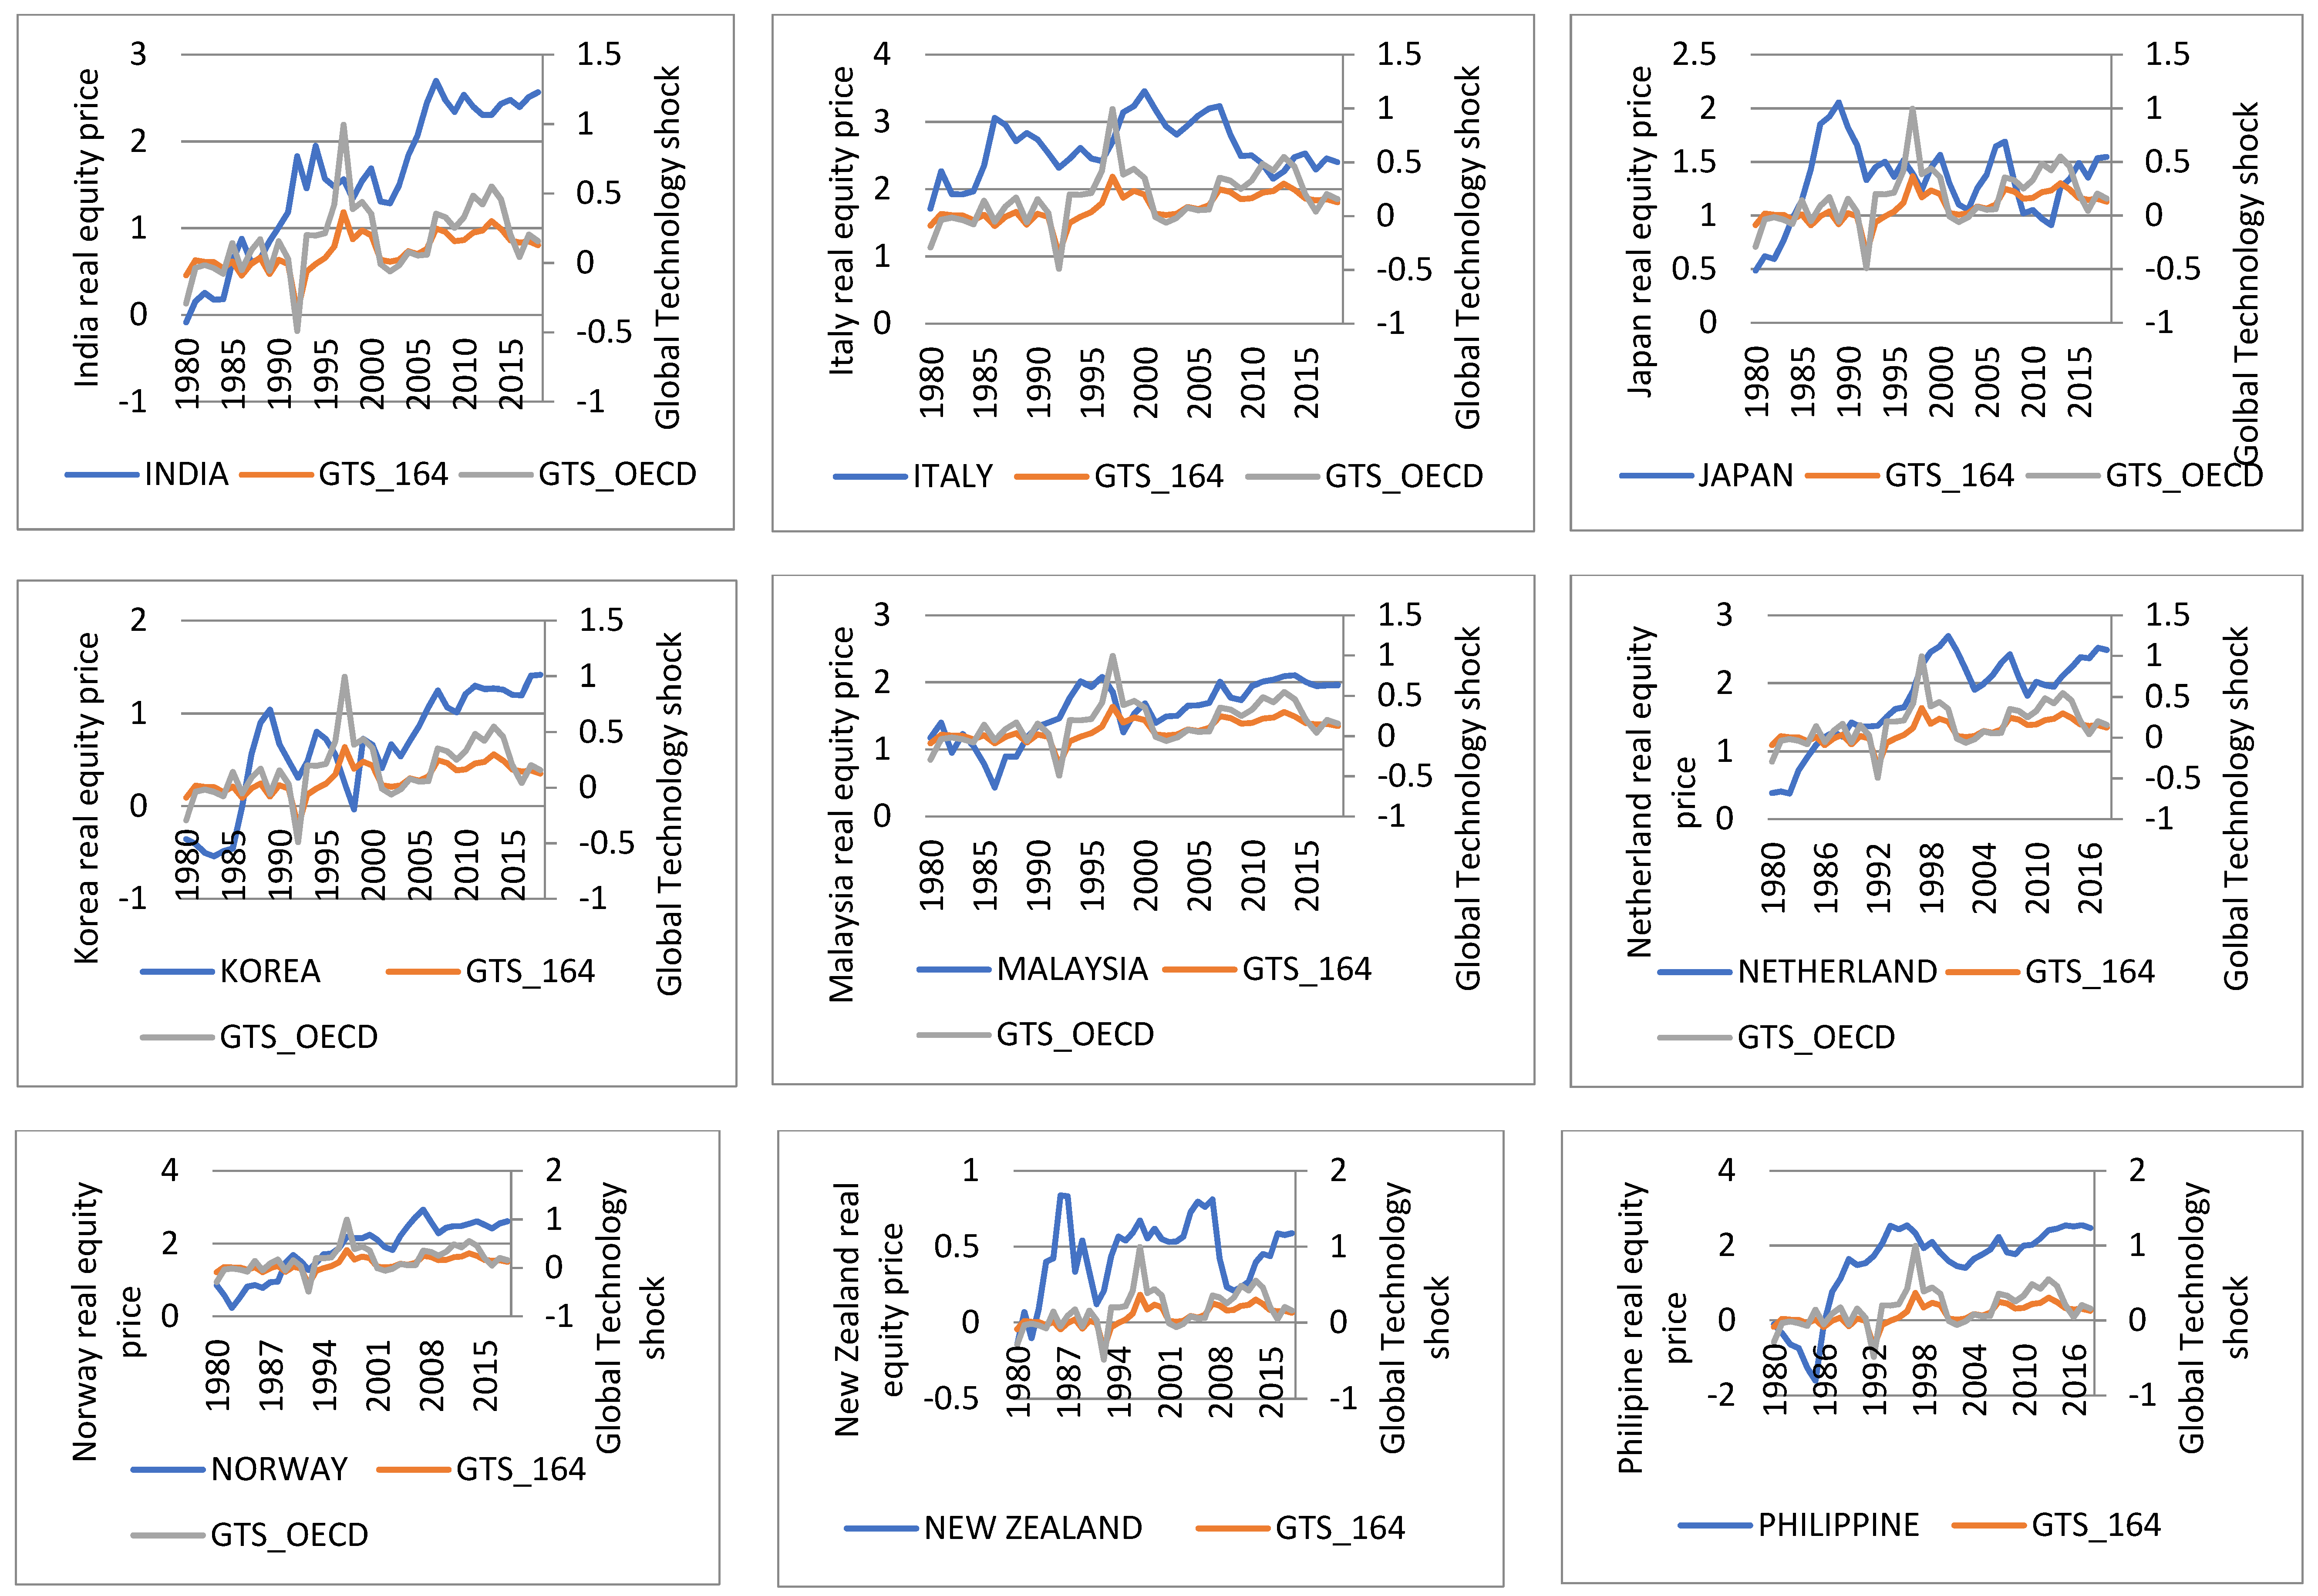
Table 1. This information is specifically for the risk adjusted mean and the coefficient of variations for the real equity prices across the group of developed and emerging market economies and that of the global technology shock and specific OECD shock. While the global shock is derived for the group of 164 countries, that of OECD shock is mainly for 12 OECD countries. The risk adjusted mean for the real equity prices across the markets ranges between 0.487 and 7.367. In all, only two cases have values below 1 (Argentina and Finland). By implication, the average values for the real equity are higher than the level of dispersion in virtually all the markets, suggesting the possibility of low risk in the markets. As for the coefficient of variation, the values are found to be below 100% except for very few cases. In fact, in about 62% of the markets, the standard deviation is only about 40% of the mean, giving an indication of relatively lower dispersion. For the information about various economic blocs, both the risk adjusted mean and coefficient of variation are normal, though the real equity for emerging markets has a relatively higher level of dispersion (the standard deviation being 42.2% of the mean). However, the global technology shock and OECD specific shock have higher levels of volatilities (the standard deviation is almost twice the mean of the two shocks series). By implication, there is higher variability among the computed series. We further align the real equity prices in all the countries and the bloc regions with technology shock series in a graphical representation (see
Appendix A and
Figure A1 and
Figure A2). From these graphs, we infer an inverse relationship between the equity prices and the shock component series. This gives an implication that positive technology shocks command higher prices in many of the markets.
4. Results and Discussion
Our results are divided into two. In the first part, we use GTS-164 (i.e., the global technology shock which captures the aggregate shock for 164 countries), and in the second, we employ GTS-OECD (i.e., the global technology shock for the group of 12 OECD countries with the inclusion of the US).
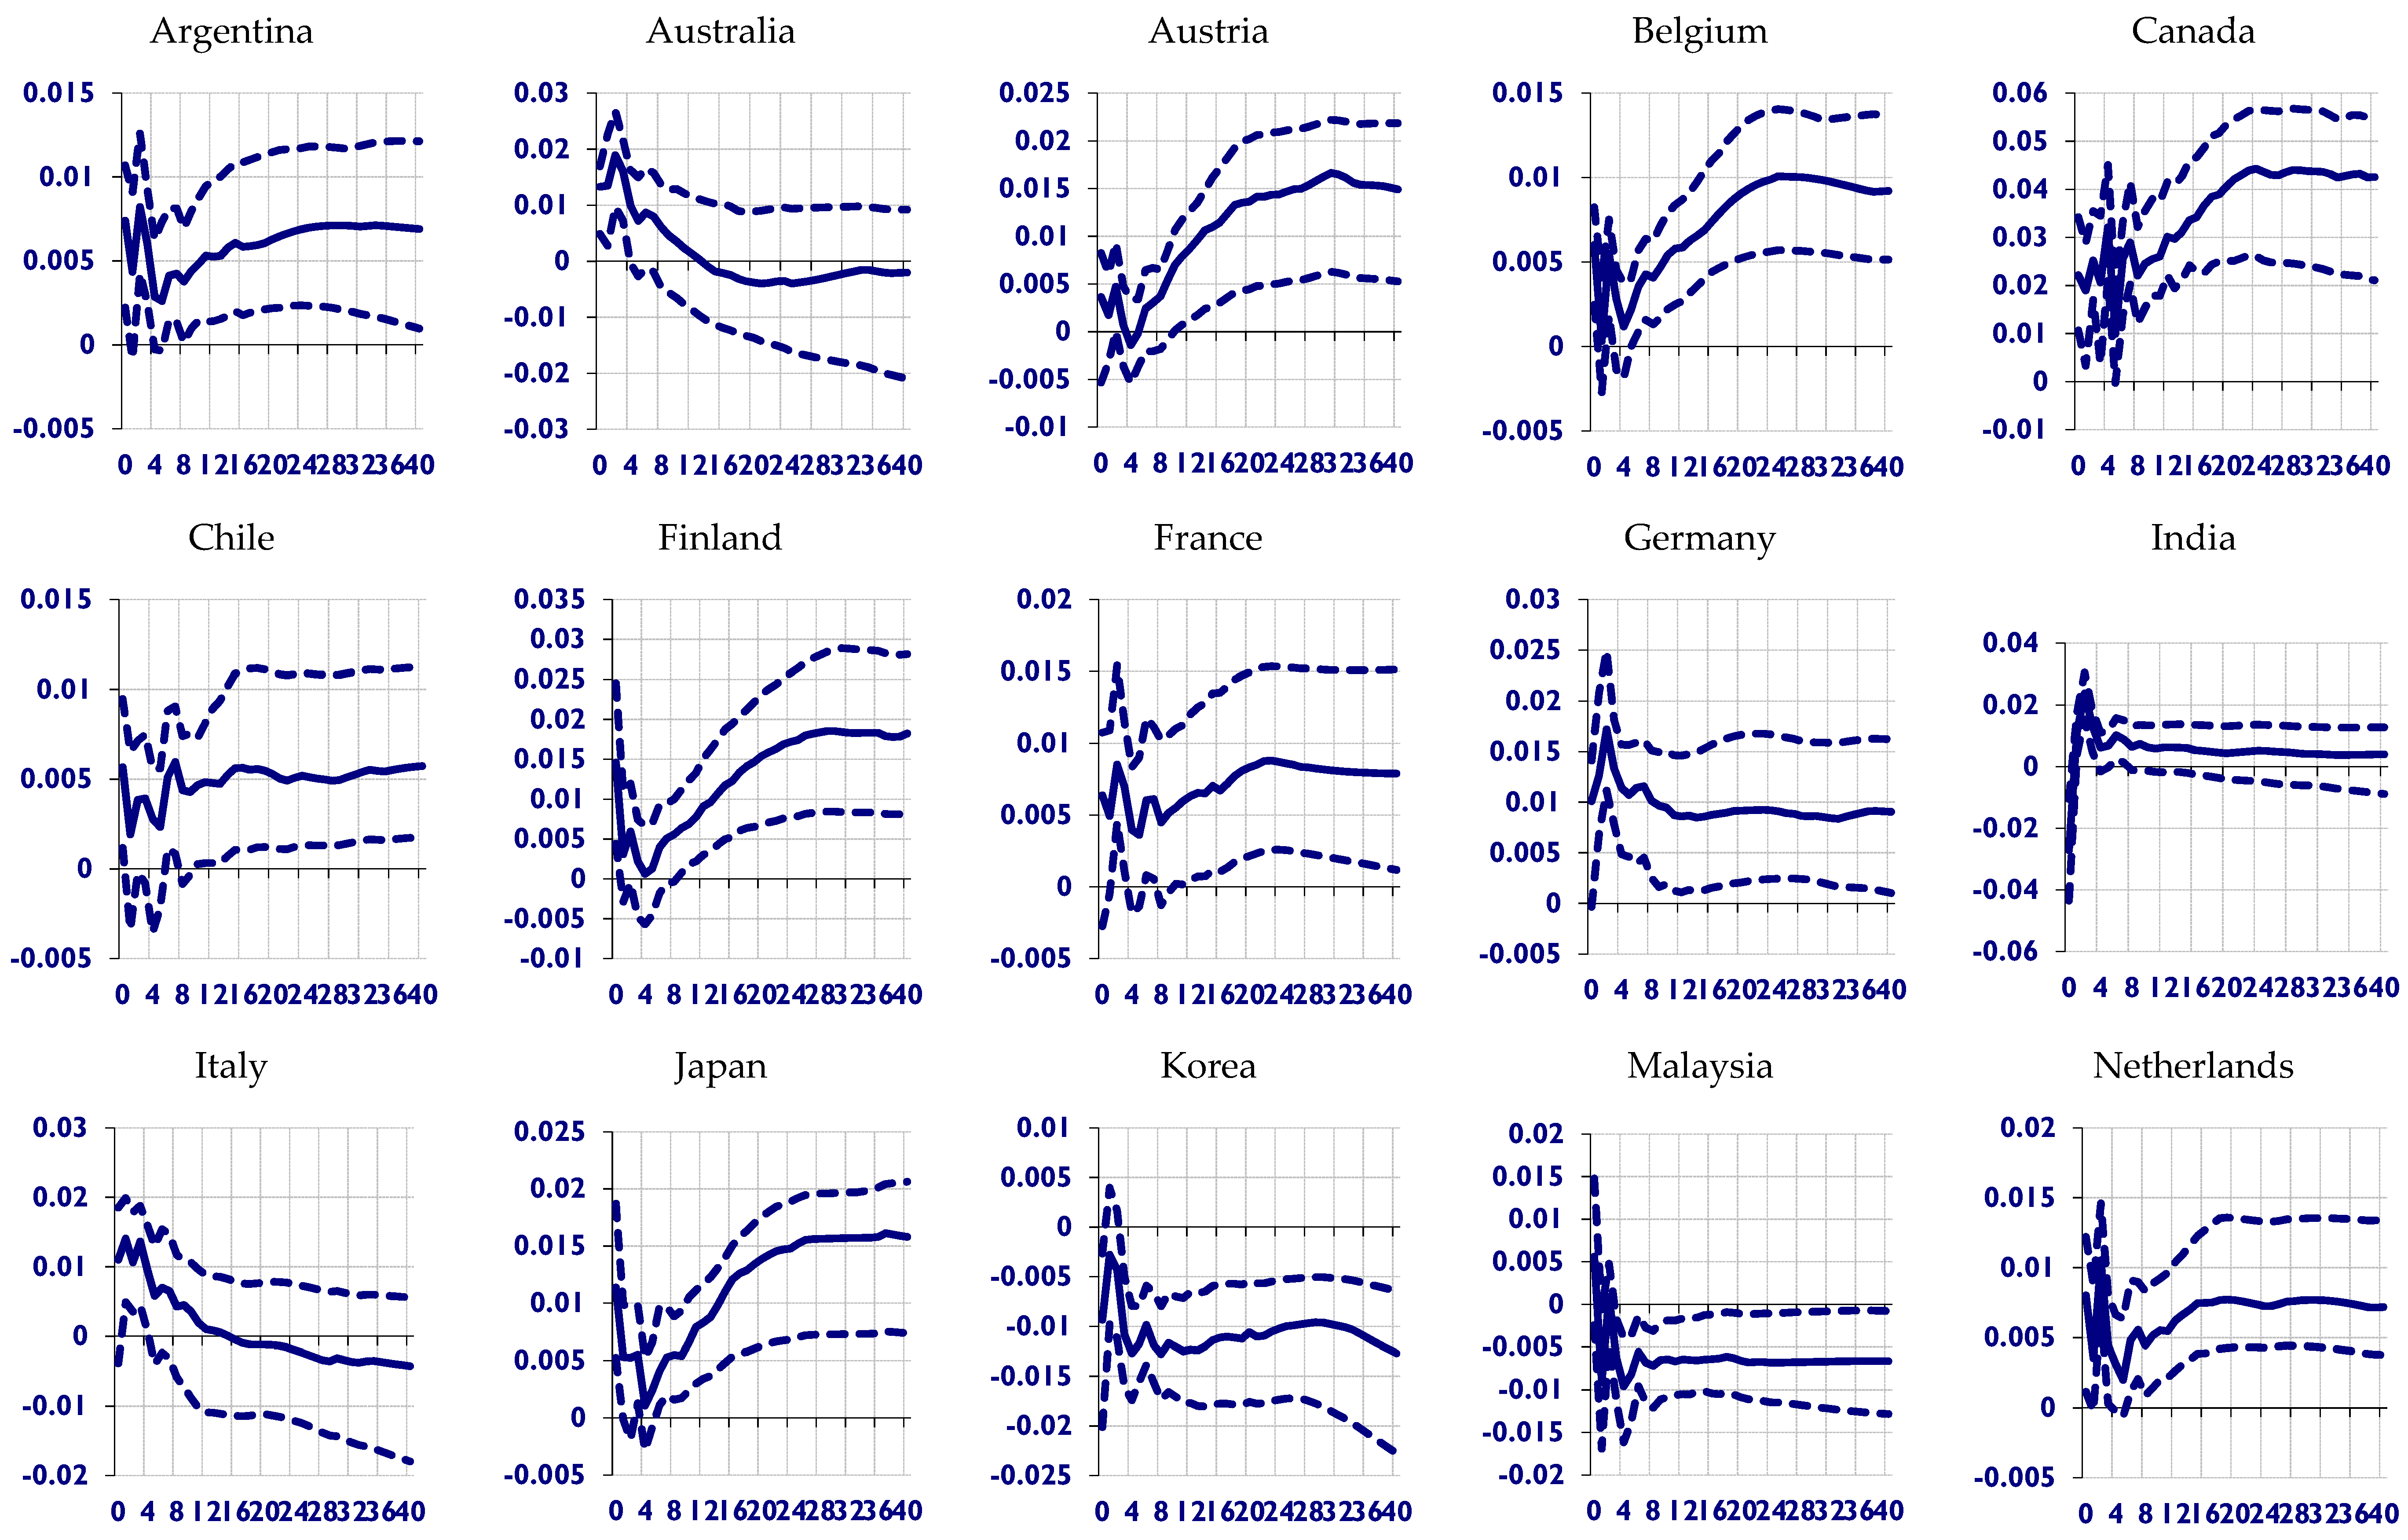
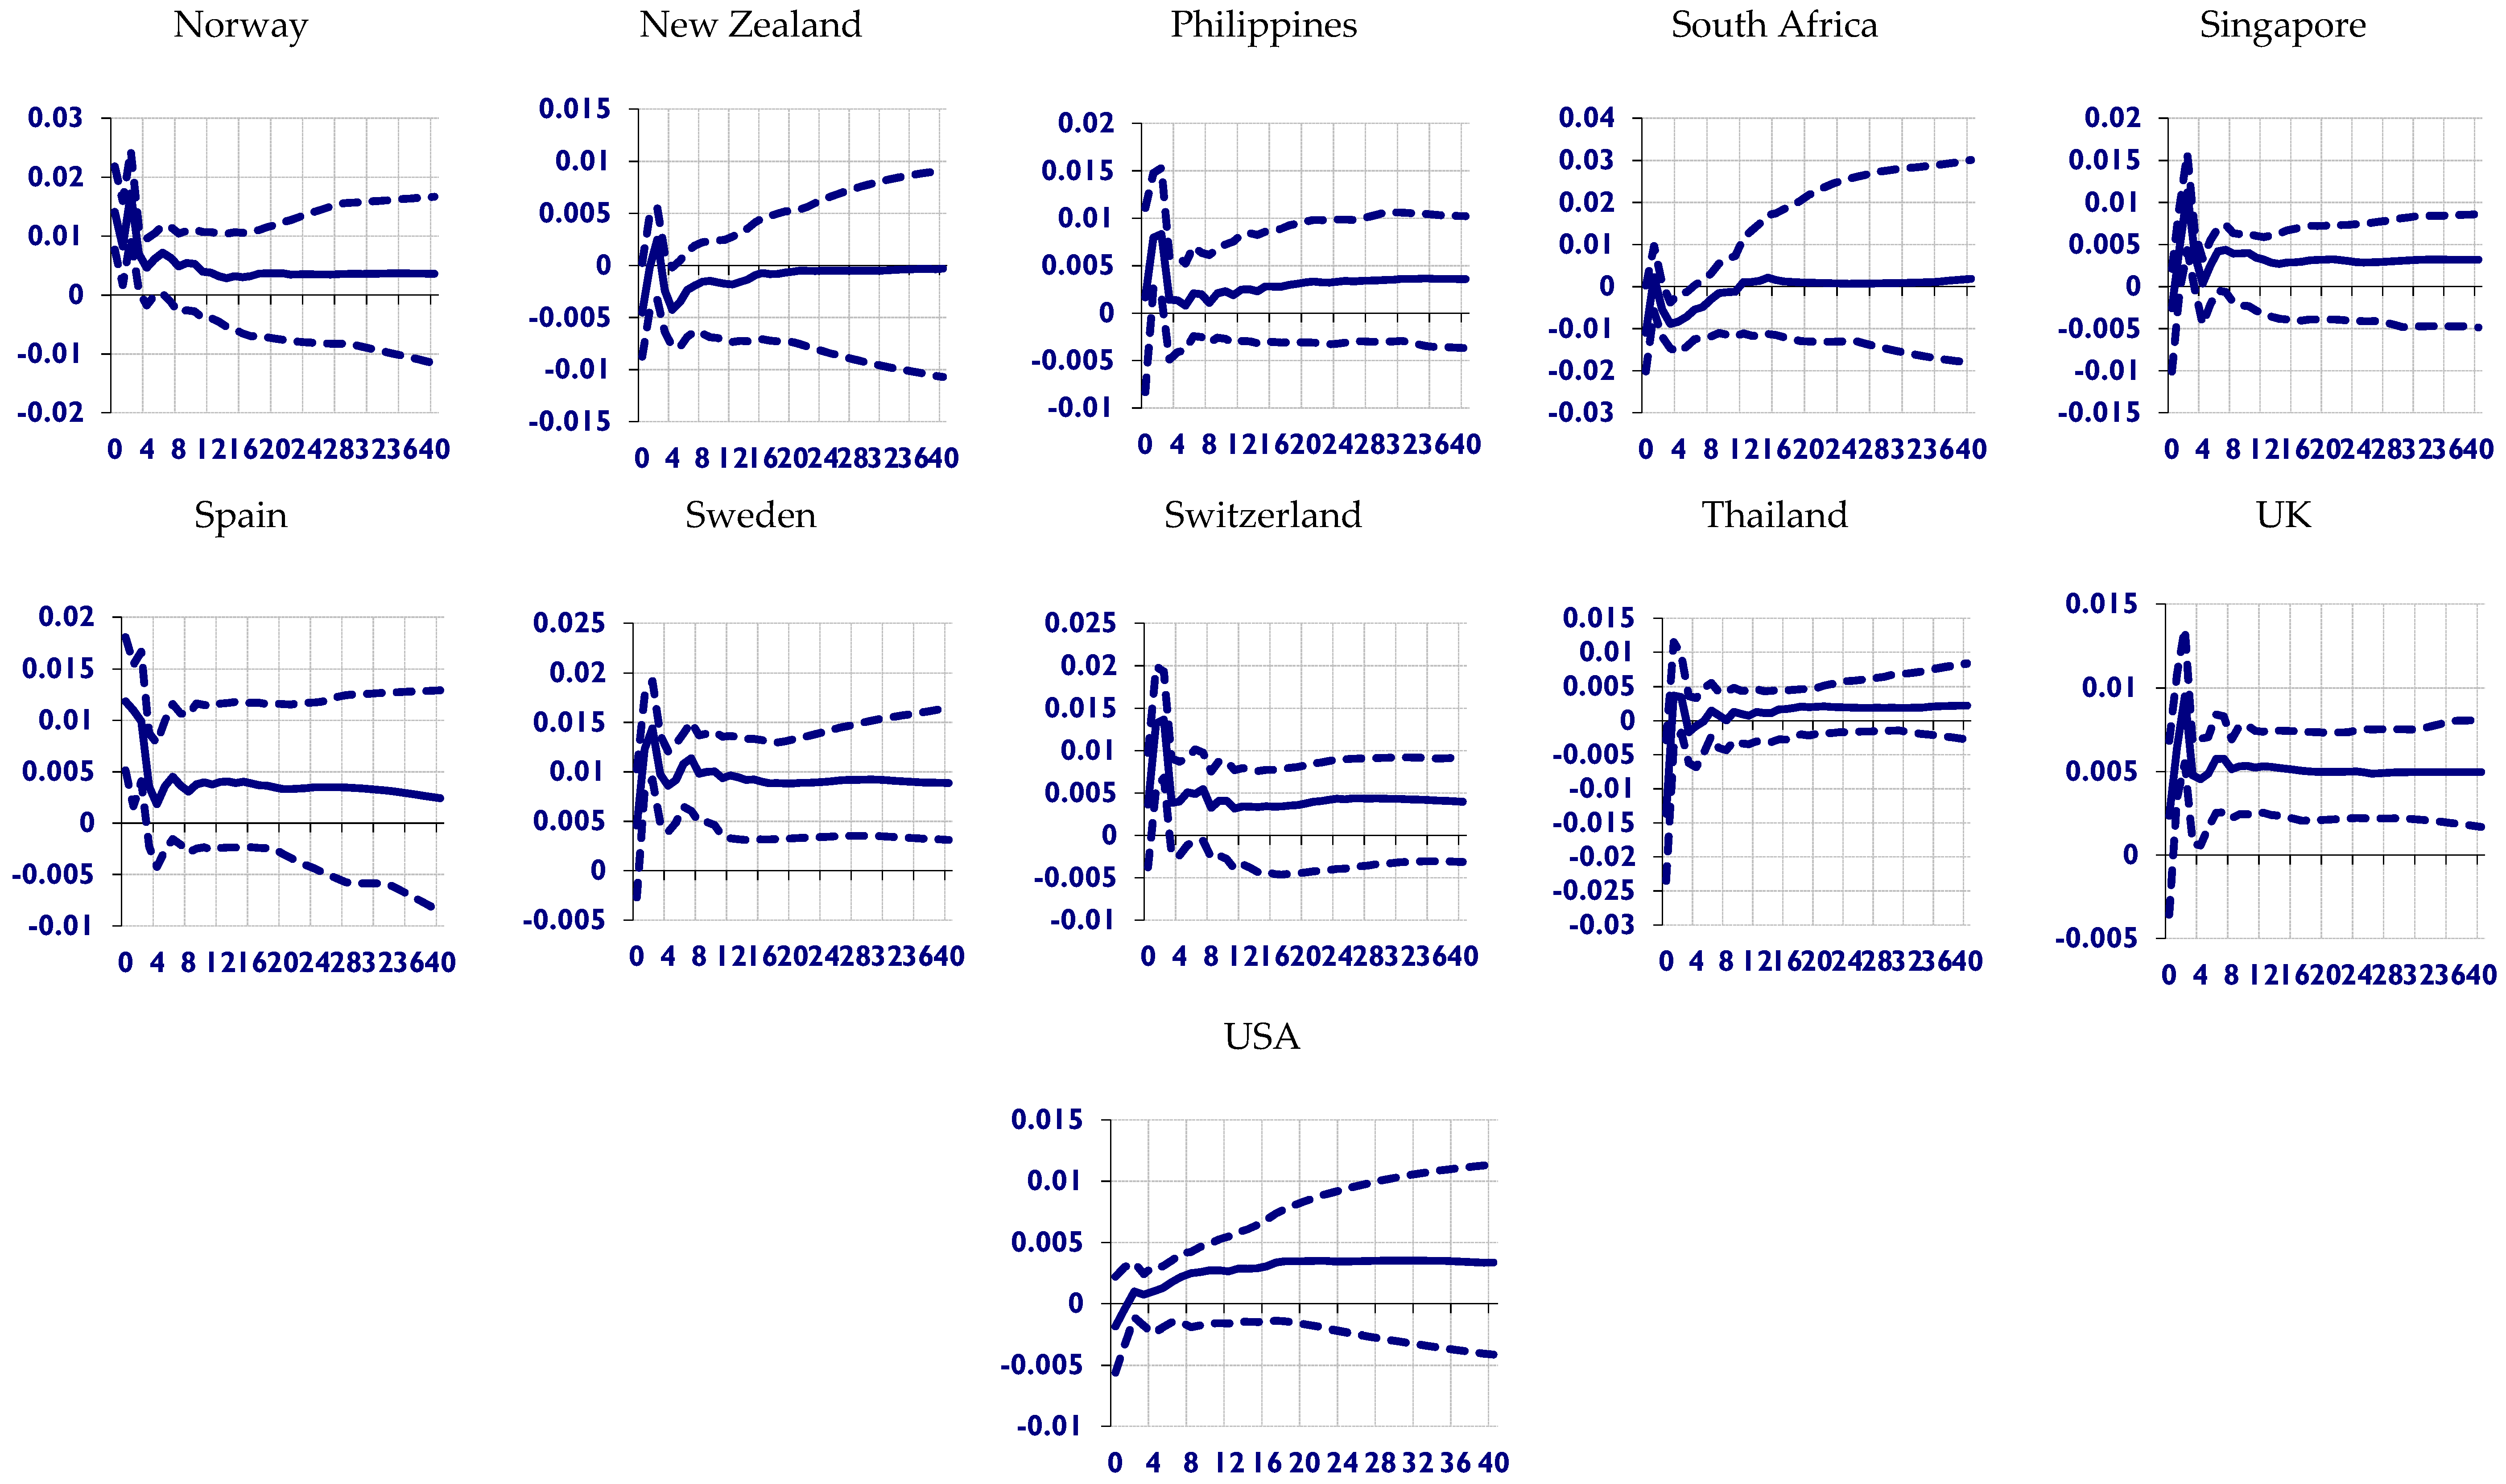
Figure 1 and
Figure 2 give the response of real equity to a positive standard deviation of GTS-164 for both country-level analysis and the region-specific evaluation. In
Figure 1, where we present the country-level analysis, the shock to the positive standard deviation of the GTS-164 results in overall fall in the real equity prices in about 70% of the markets considered, and we further find this response to be instantaneous in about 46% of the markets and delayed in 23% of the total countries considered. However, while the shock impact is sustained for the significant number of the markets with an average rise in real equity of 0.62%, it is rather not persistent for the few others, and the real equity price, in this case, only rises by 0.24% on average (see
Figure 1).
As emphasized before, for efficiency to hold for any market, stock prices should necessarily not be influenced by any factors other than the available information in the market. Meanwhile, a further assessment of the propagation of this shock gives some indication that many Euro countries are rather inefficient at absorbing the global technology shocks (the impact is sustained with an average rise of 0.74%), while other developed and emerging markets behave relatively better. In sum, the shock impact only renders very few markets as being efficient, while greater numbers of others are not. Surprisingly, the US economy cannot absorb this shock, with the initial response being very sluggish for up to 10 quarters of the forecast horizon, but sustained later. This could possibly suggest the ability of the US economy to withstand any external shock at any period when it occurs. In
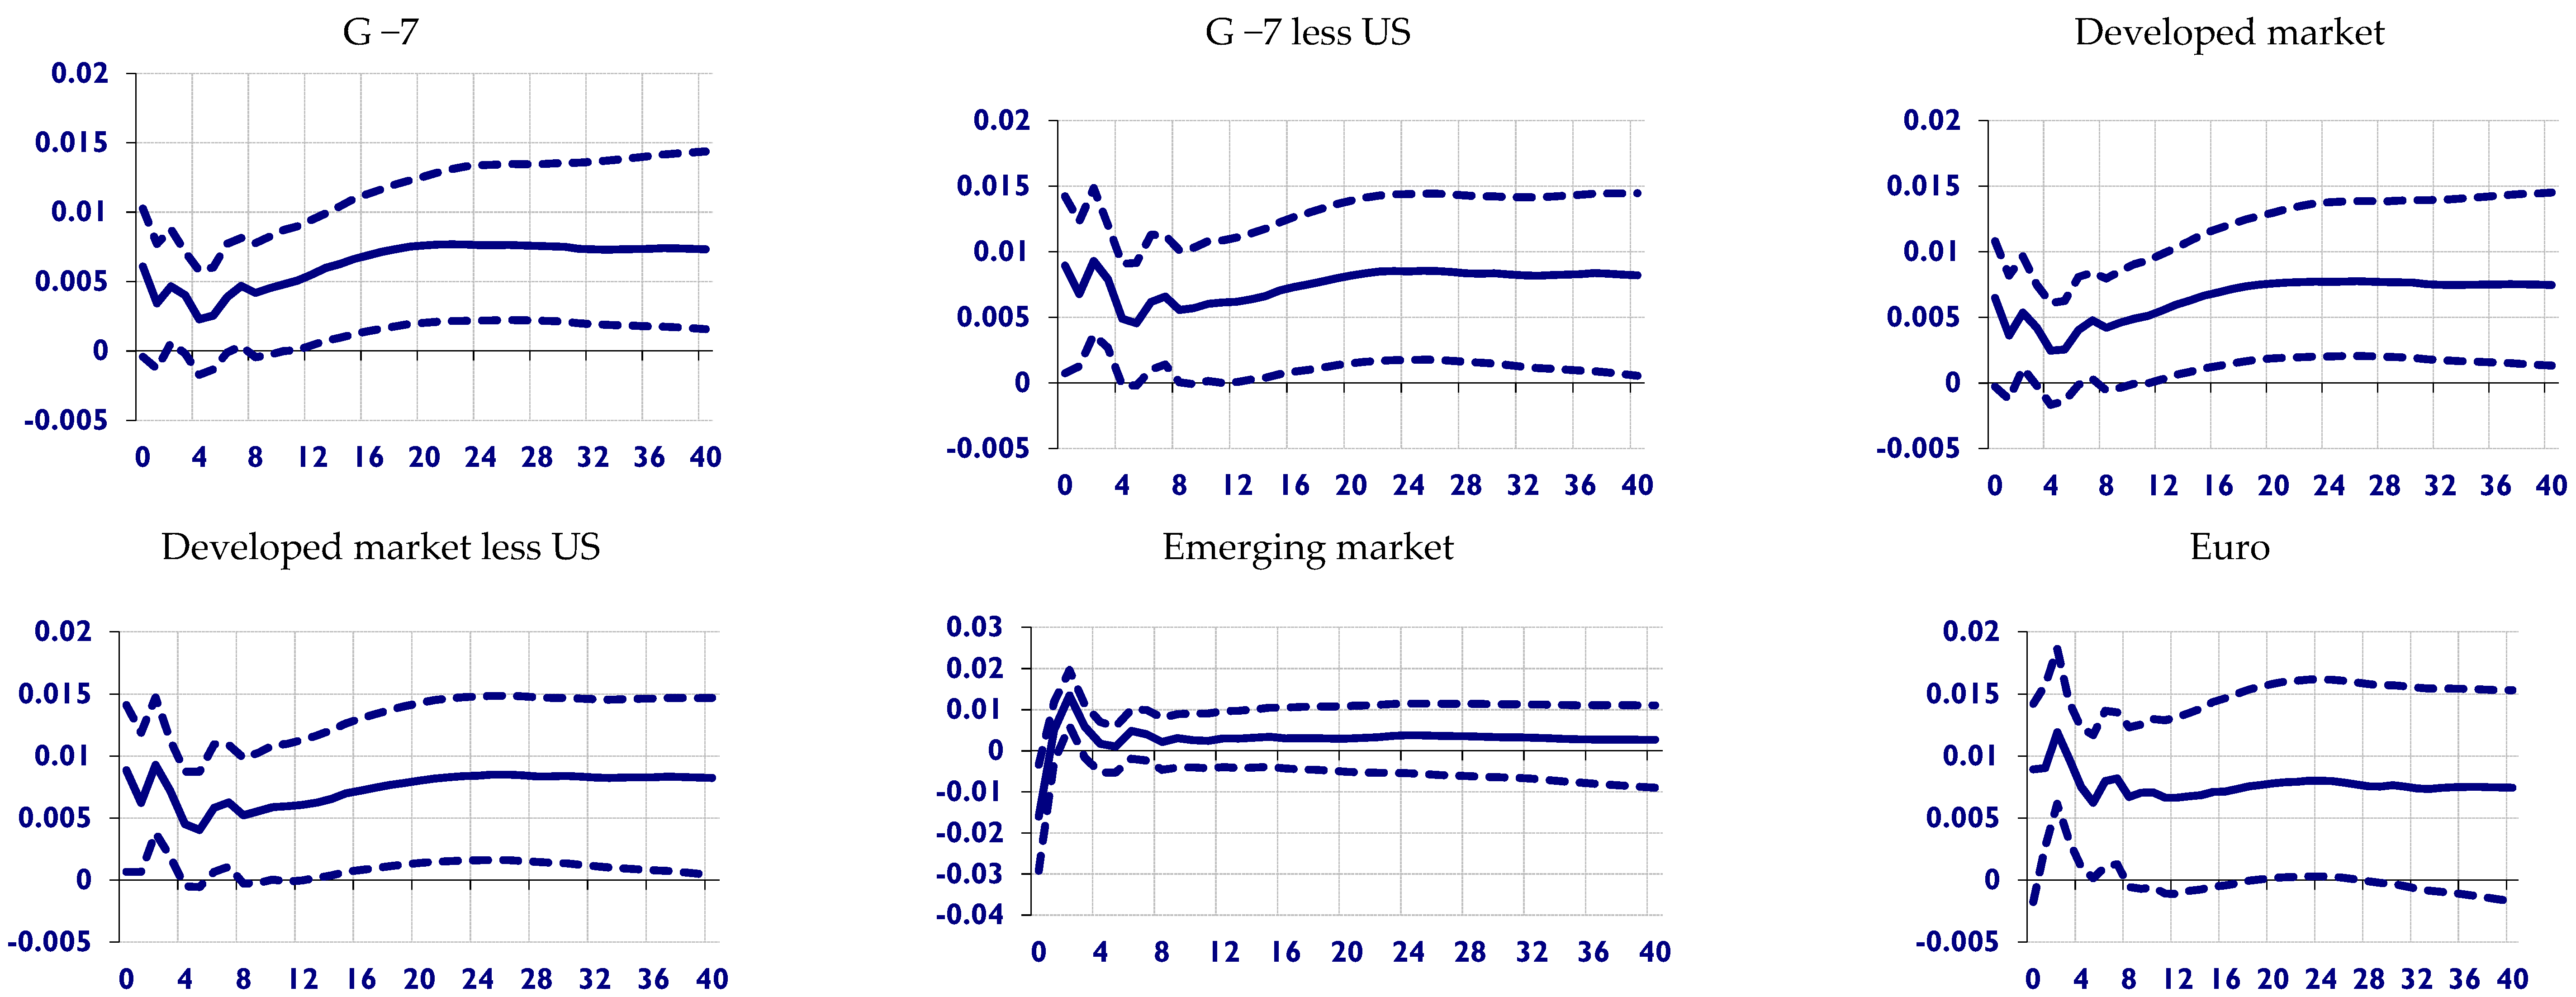
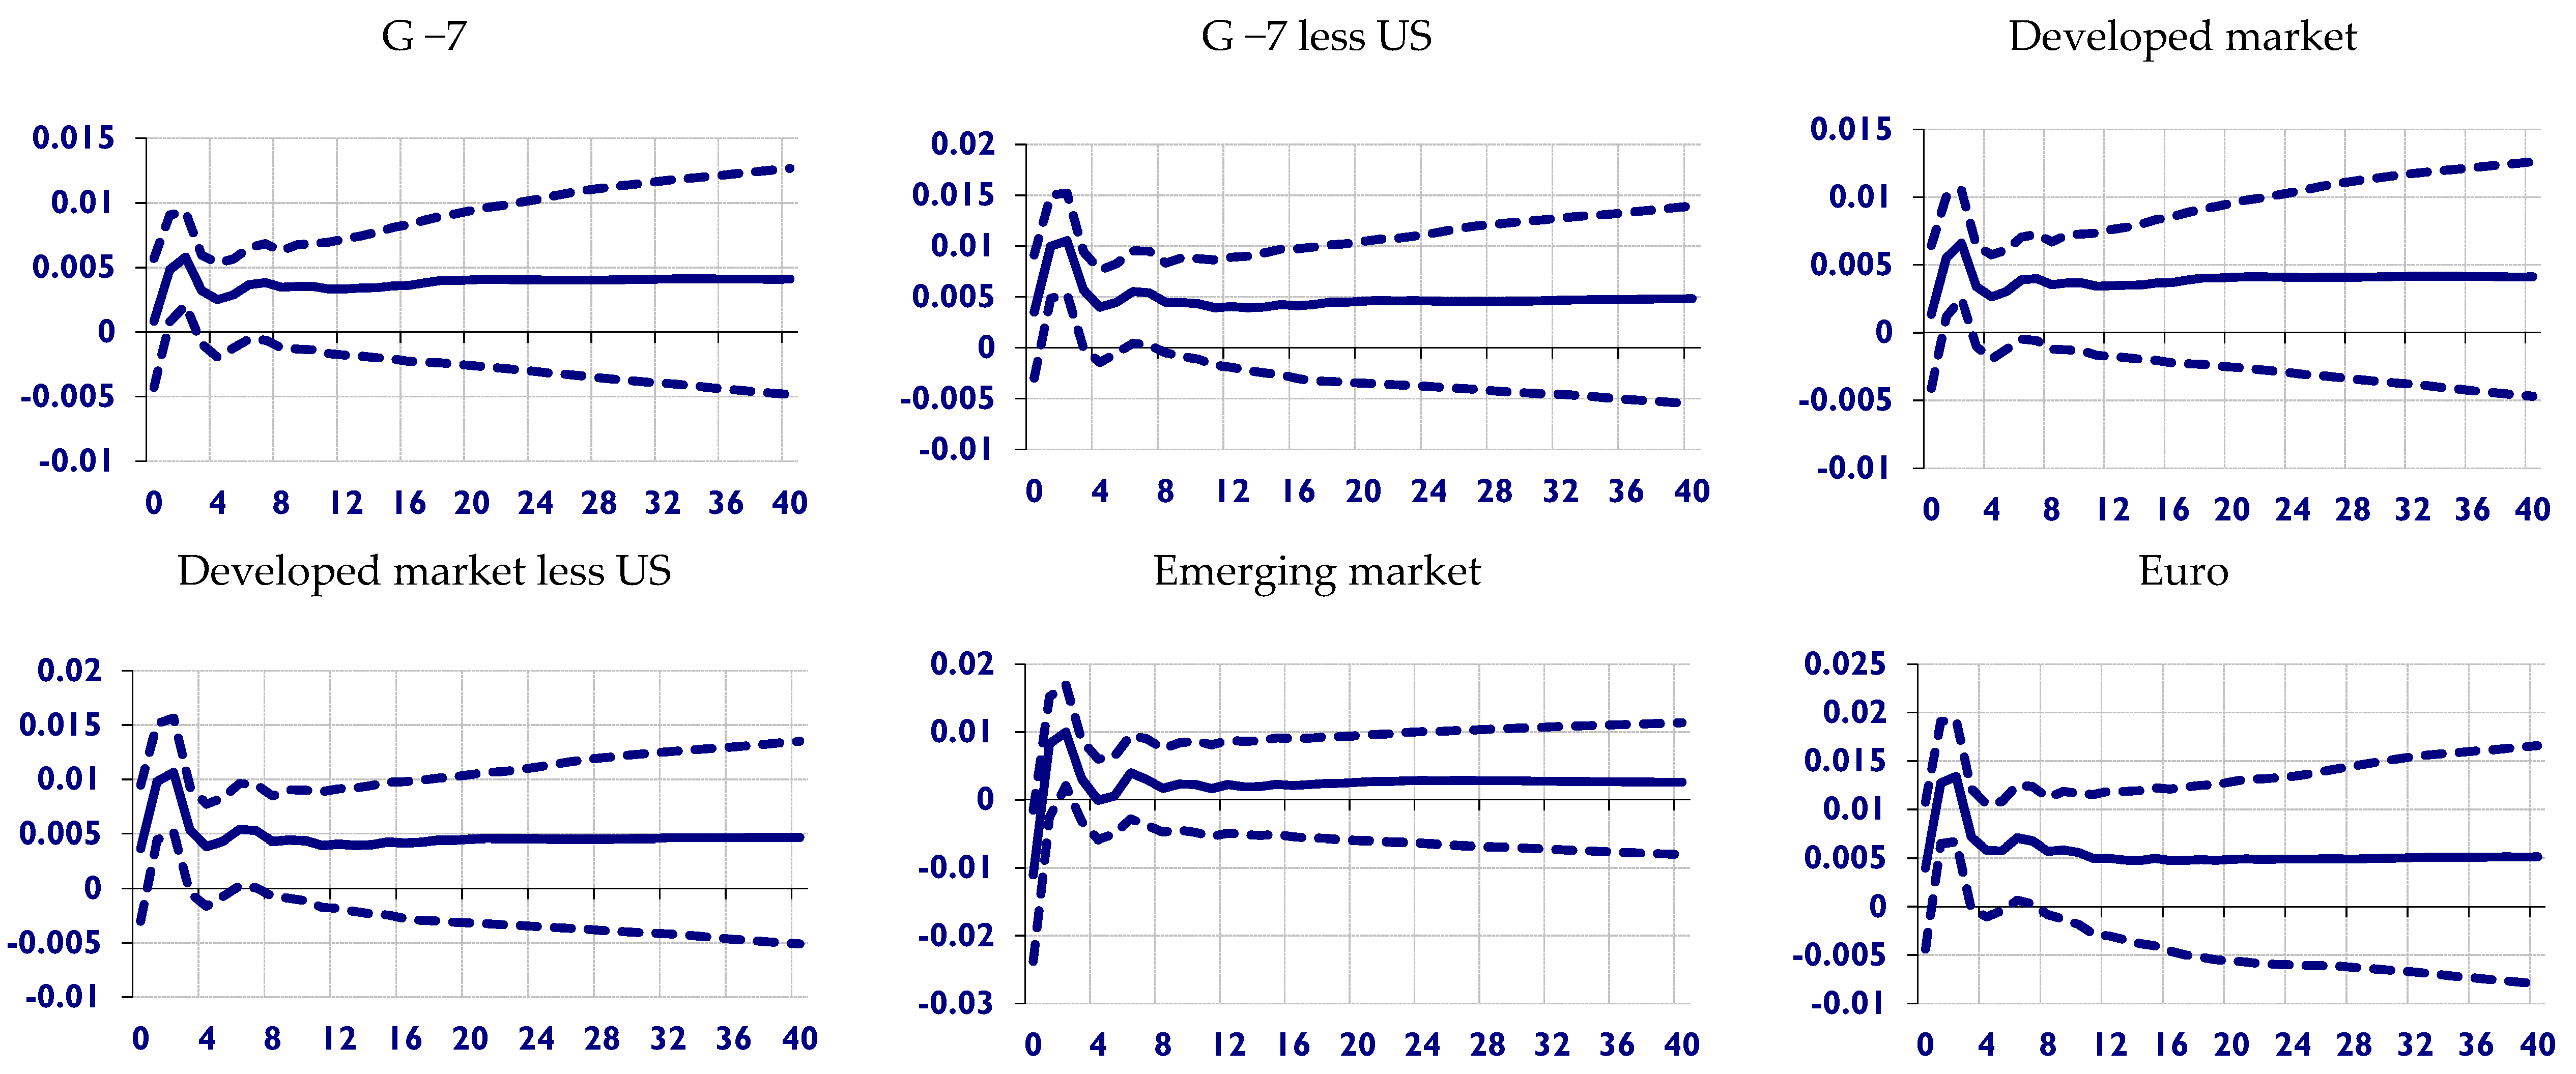
Figure 2, the countries are categorized into various economic blocs for further analysis. The results give further support to the analysis at the country level. The developed market responds to the Global technology shock with an immediate fall in real equity prices when the US is not considered. However, the impact becomes delay with the inclusion of US, where real equity prices rise by an average of 0.7% and at the same time having the impact being sustained throughout the forecast period. The influence of the US in this nexus becomes that much more established. The response of real equity for the Euro and emerging markets to the shock innovation is evident with the immediate rise in real equity. While this rise (on average) is 0.29% for the emerging markets, it is higher for the European bloc (approximately 0.77%), and it was further found to be transient for the two markets. Thus, by categorizing the countries into blocs, the Euro market and the emerging markets are efficient, as the shock impact could not be sustained. In all, the efficient market hypothesis does not hold when global technology shock is considered. The arising implication is that stock prices are capable of being influenced when they are exposed to global shock variables. Hence, the impact of global technology shock in changing the stock prices is rather obvious. While the efficiency market hypothesis does not hold in this regard, it suggests that investors’ rationality or irrationality could rather give way to adaptive market efficiencies for the global technology shock. This is more likely as changes in stock prices are found to be associated with significant changes in global technology shocks.
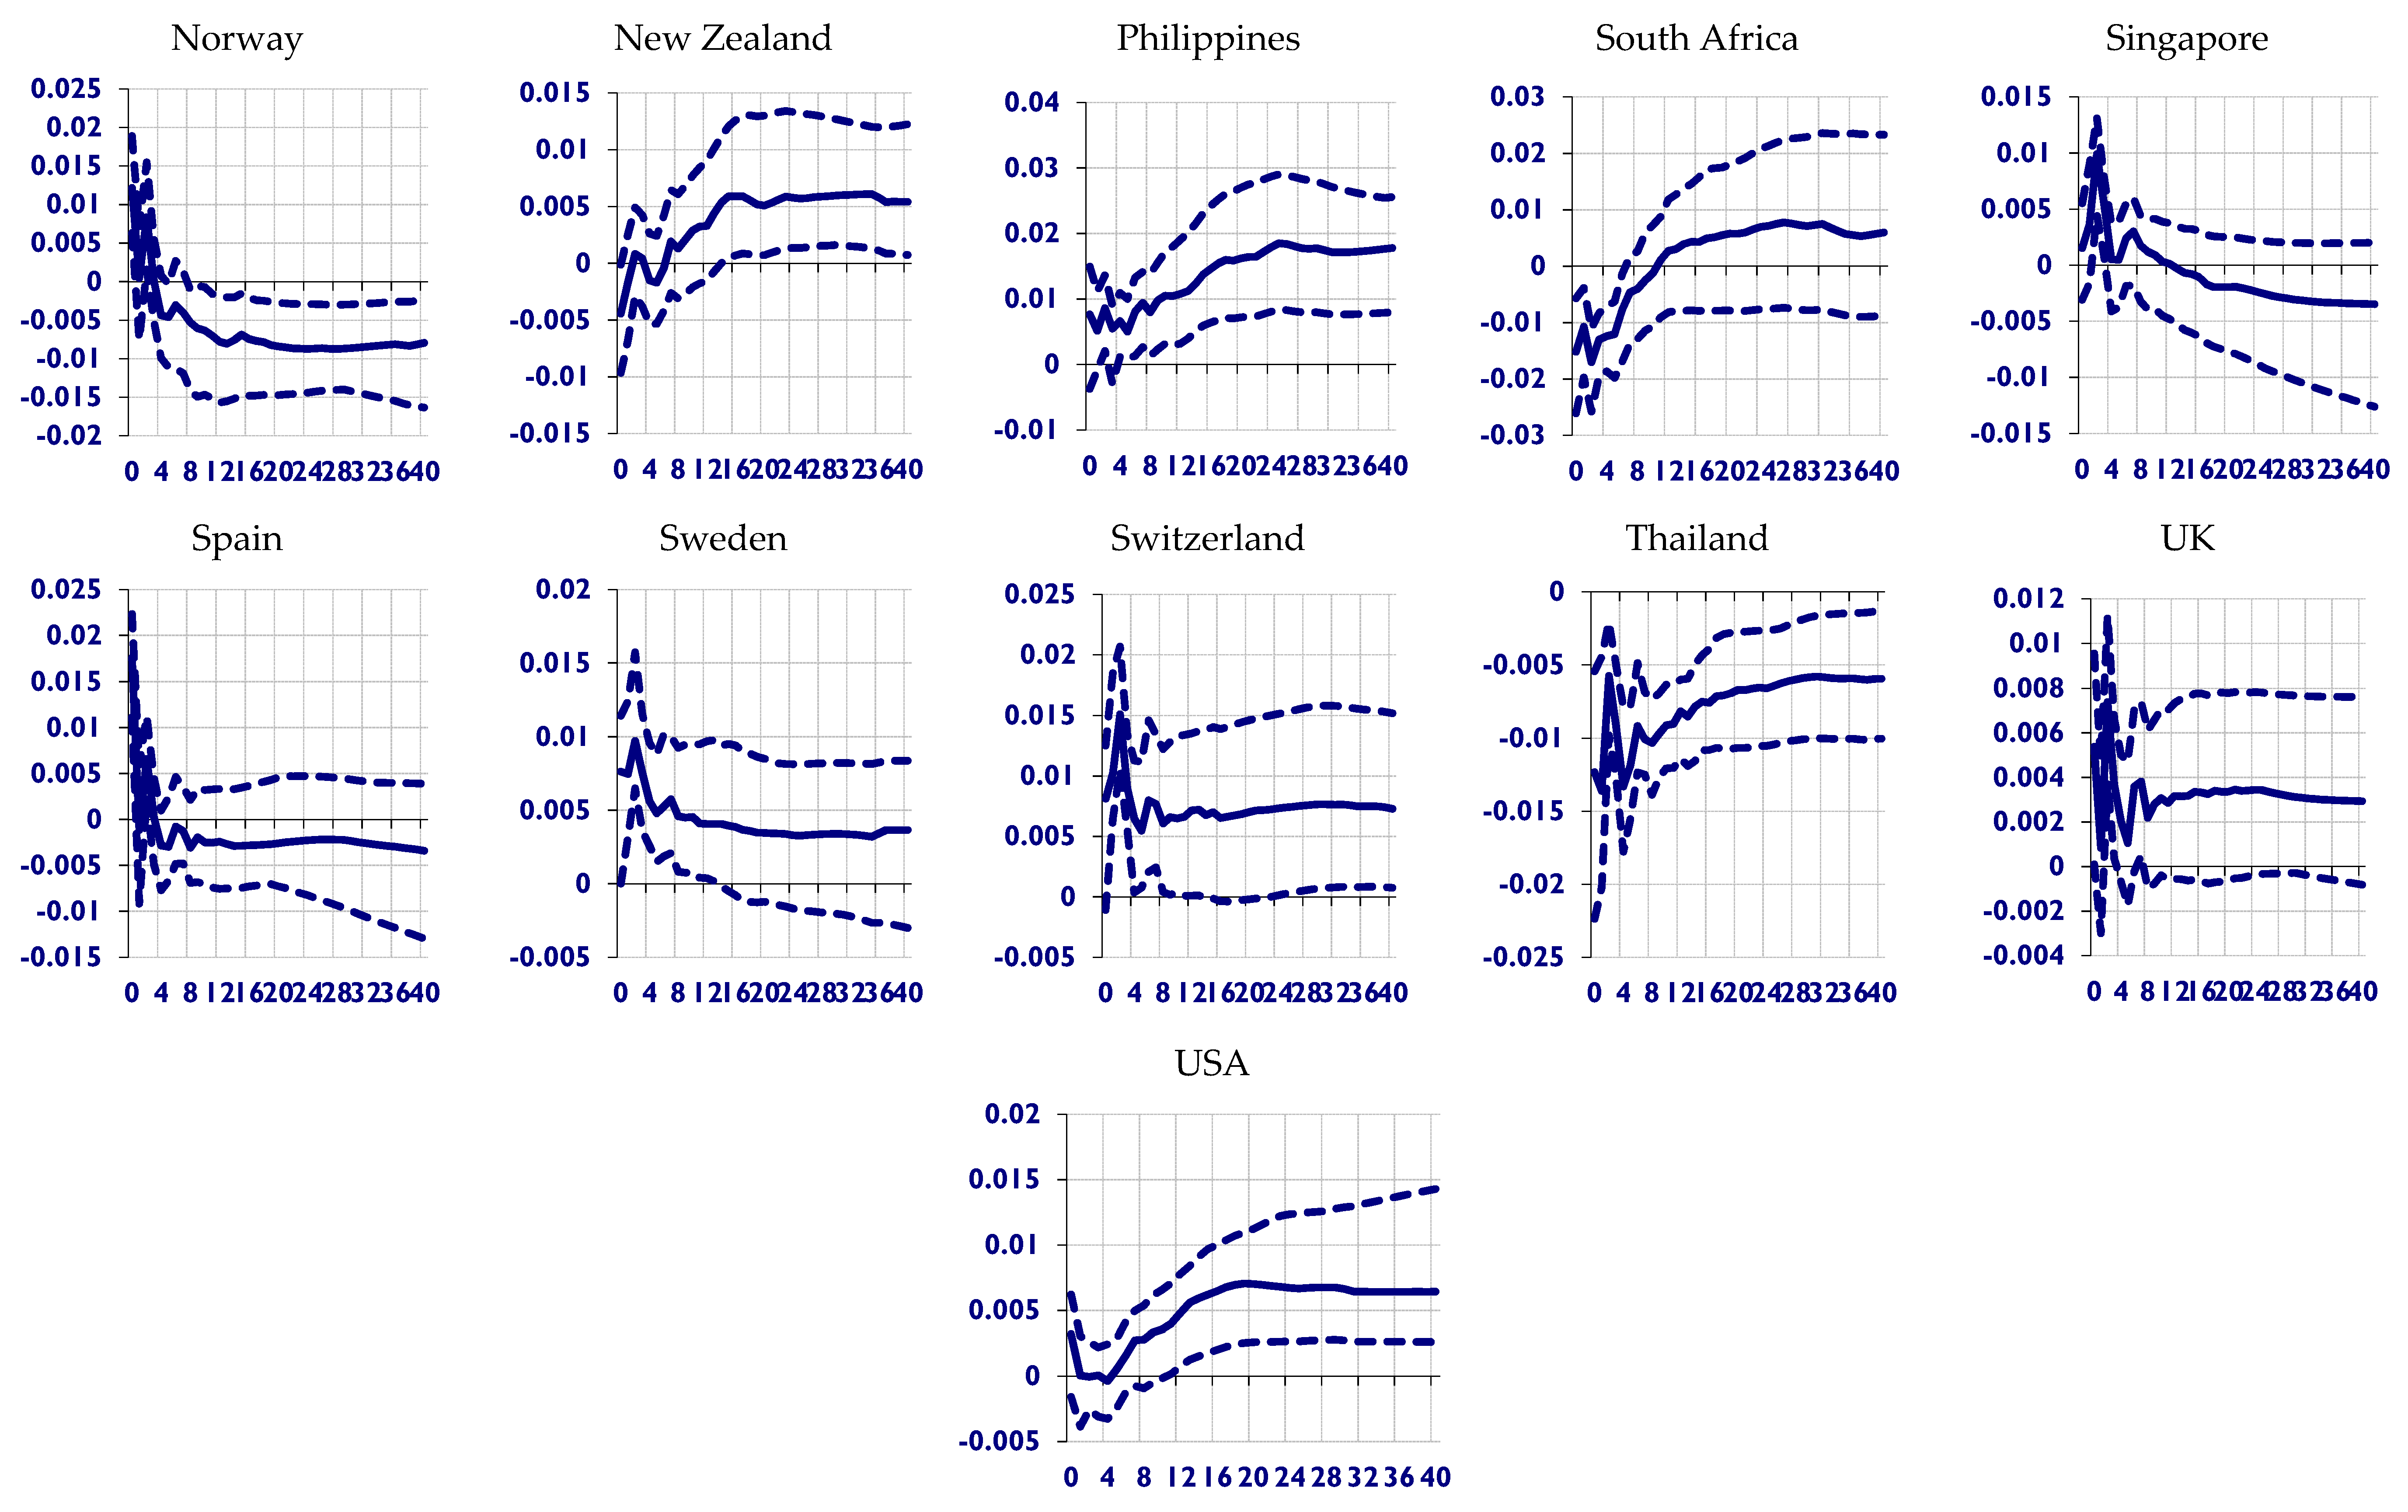
As a way to make this finding more engaged, we give consideration to global technology shock for a group of OECD countries. This is done to establish whether this shock impact will exhibit different trends when the global technology shock becomes more region-specific. The response of various real equity markets to the OECD global technology shock, however, gives some salient information on how real equity prices of different countries could be prone to the technology shock that is rather region-specific.
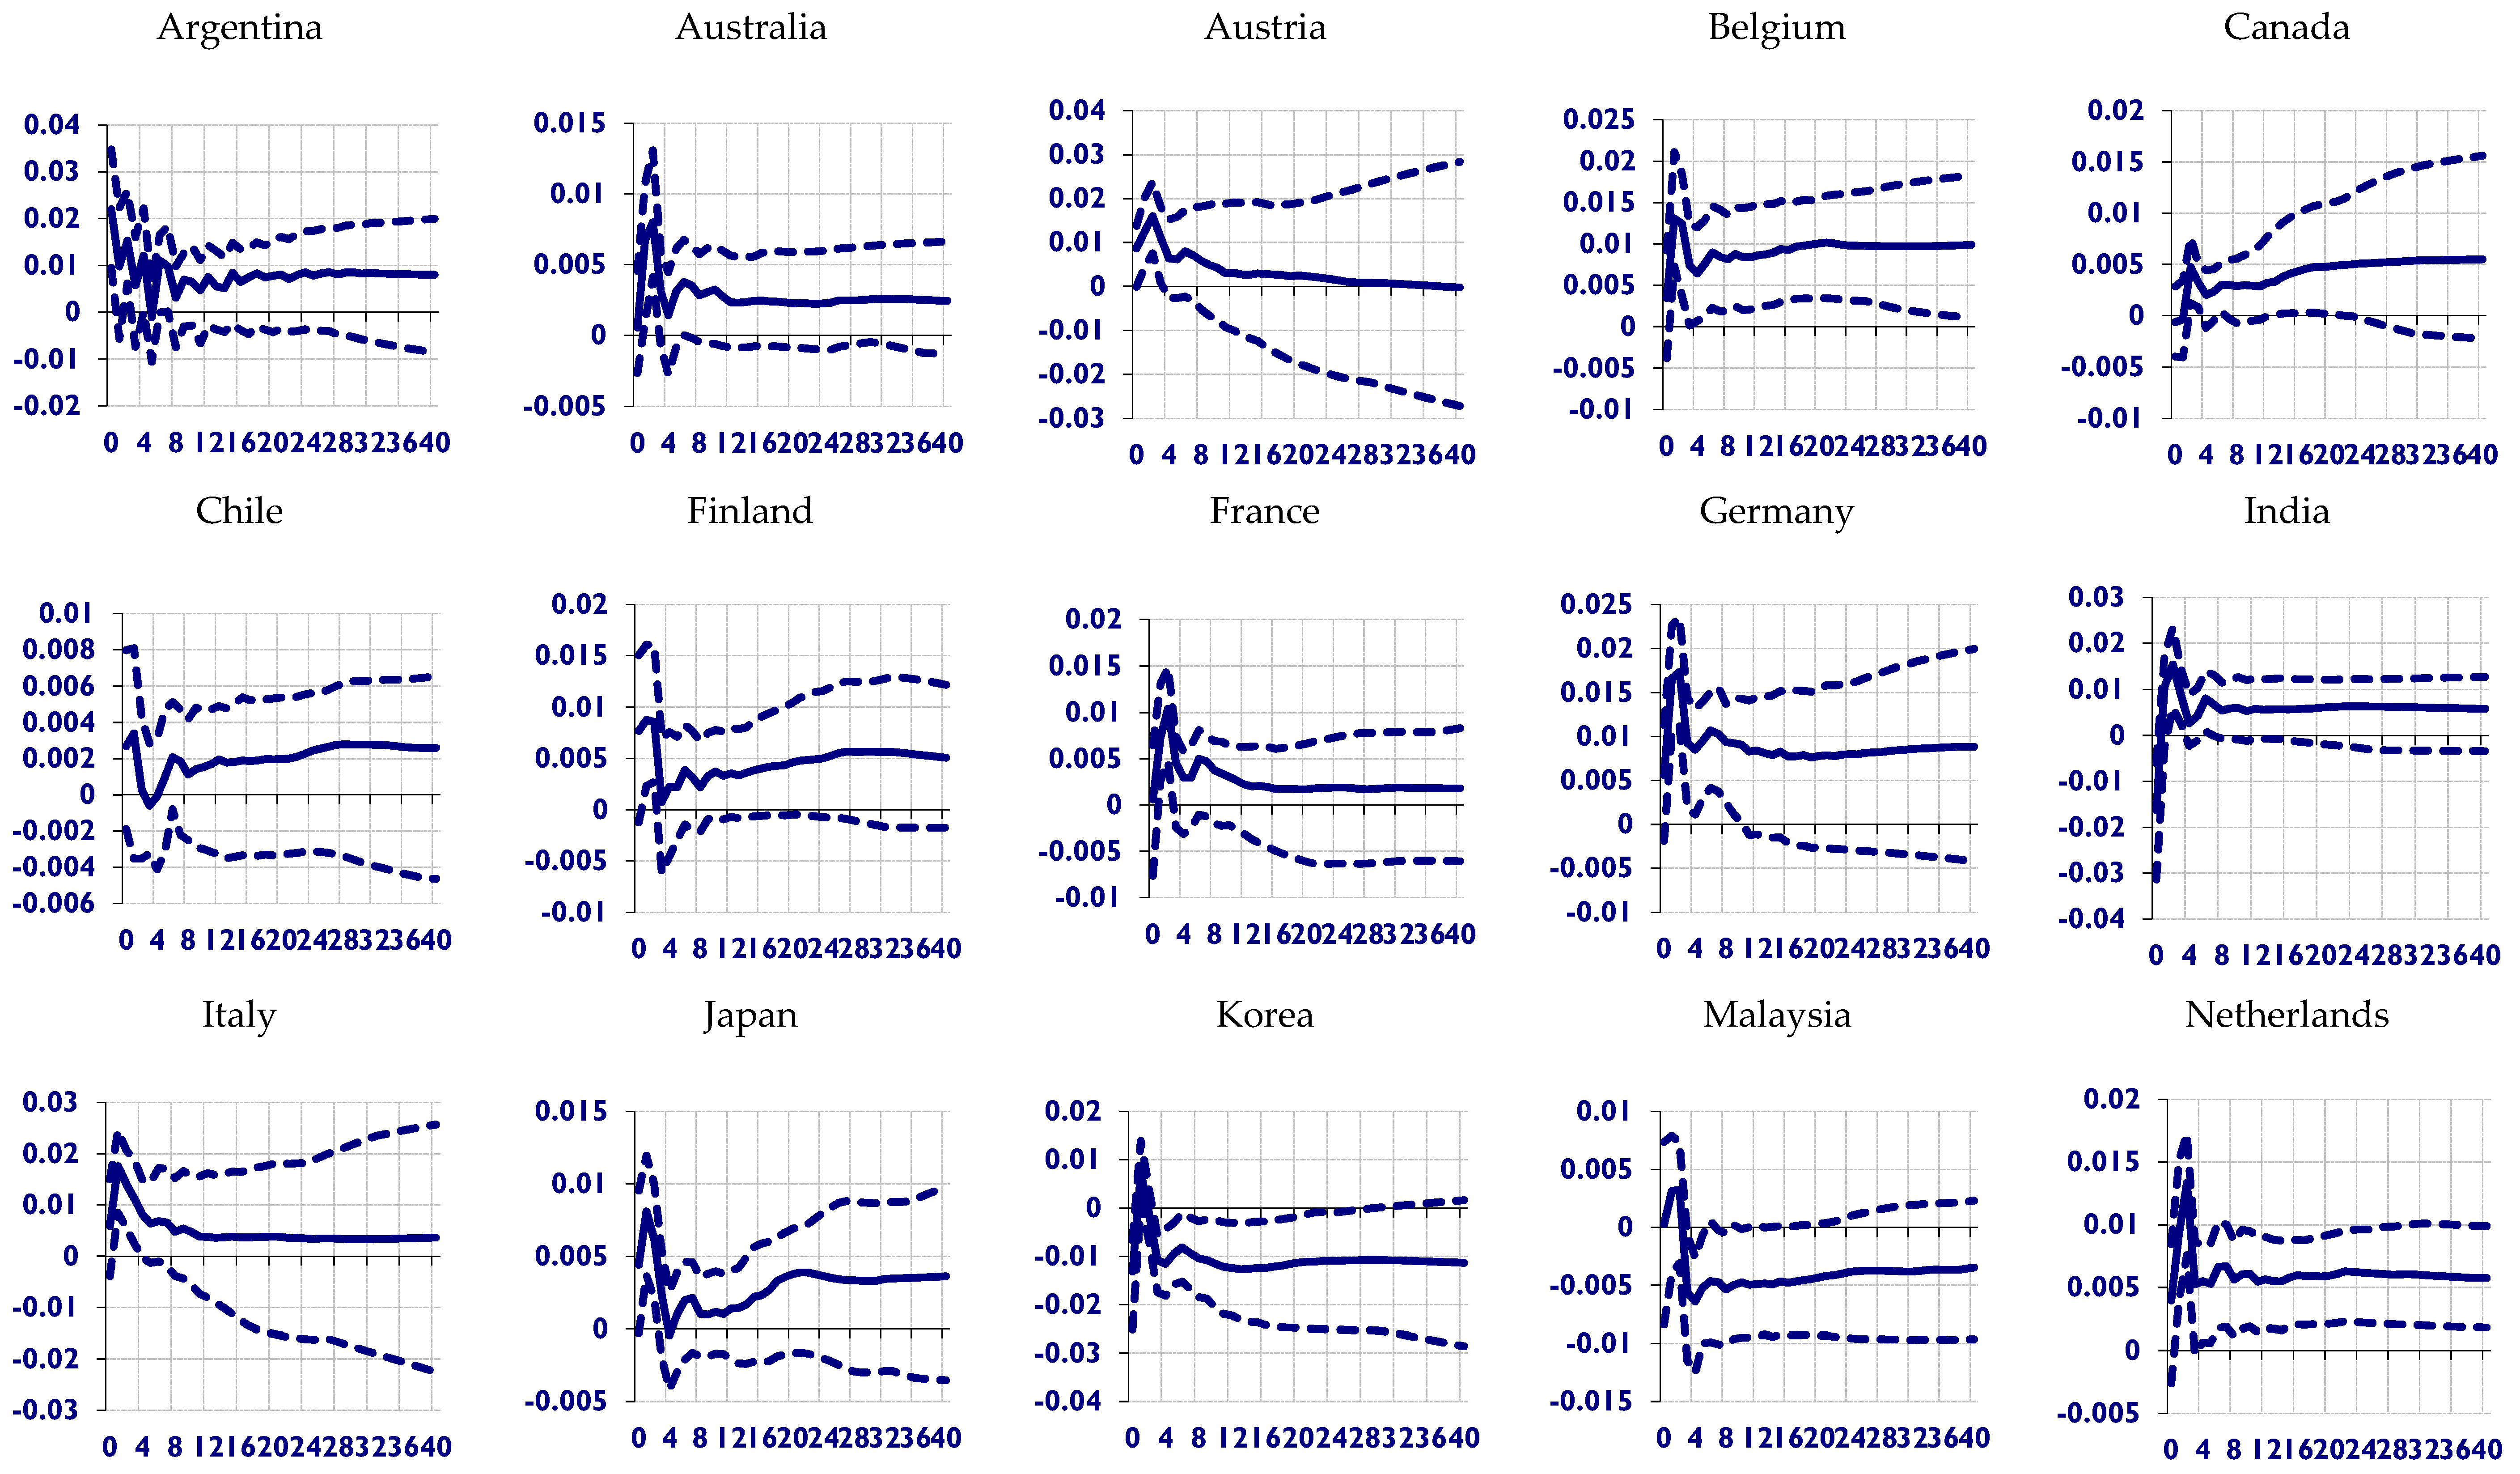
Figure 3 and
Figure 4 present this information for all the developed and emerging markets that are considered in this study. In
Figure 3, we observed an immediate rise in real equity prices for nearly 85% of the economies under investigation. However, this response is transient and could rarely last for up to three quarters of the forecast horizon. By implication, while a more global measure of technology shock renders many individual markets inefficient, the shock impact of a region-specific technology is rather different. For the markets where the shock impact is transient, the real equity prices rise by an average of 0.72%, and higher where it is persistent. We now find that many Euro countries easily absorb this shock, and the same scenario is evident for other developed and emerging markets. In addition, the US economy further established its strong stance by being resilient to this shock impact. Therefore, the efficiency of the markets for these economies given the consideration of OECD global technology shock is assured for nearly all the countries under consideration.
Accounting for the global technology shock from the perspective of OECD economies provides more insight on other developed and emerging markets’ efficiencies. Thus, its negligence could have led to the wrong conclusion. We then argue that where the global technology shock is limited to few countries that share economic values with developed and emerging markets, the impact on real equity prices is likely to be transient and the efficiency of the markets will be established. However, measuring the impact of a global technology shock by aggregating the data of many countries without referencing them as either developed or emerging markets could be misleading. In
Figure 4, where the countries are grouped into different economic blocs, the response of real equity prices to the positive innovation of OECD technology shock is only transient, and rises by 0.53% (the most in the second forecast horizon) for the G-7 countries. However, when the US is excluded, the impact further spread to the sixth and seventh periods of the forecast horizon, with an average increase in real equity price of 0.71%. As a result, the presence of US in absorbing this shock is further established. Furthermore, the response of real equity prices of emerging markets to the shock is short-lived (it only occurs in the second quarter, with an average increase of 0.9%), while that of Euro markets is only transient and dissipates after the seventh quarter of the forecast horizon (an average increase of 0.98%). Thus, while the global technology shock is only absorbed by Euro and emerging markets, the OECD shock is easily absorbed by all of the blocs. Hence, market efficiency for the equity-shock nexus is assured for a region-specific shock rather than the one with a more global outlook. In other words, the efficient market hypothesis is found to hold for all the markets considered when the technological shock is region-specific. By implication, this type of technology shock has little or no impact on the stock prices of the countries under consideration. In this regard, the efficient market hypothesis explains the transient and insignificant influence of technology shock on stock prices. Thus, while the adaptive market hypothesis holds for global technology shock, EMH is confirmed for region-specific shocks.
5. Conclusions
We employed recently constructed technology shock data by
Sharma and Narayan (
2022) together with real equity prices for a group of emerging and developing countries in a GVAR model. The data were of three variants: the global technology shock that covers 164 countries (GTS-164), the region specific one for 12 OECD countries (GTS-OECD), and the specific one for the US. We are, however, more focused on testing the efficiency of real equity markets for Euro, non-Euro and emerging markets with data on global technology shock (GTS −164) and the specific regional shock (GTS −OECD) that spans from 1980Q1 to 2018Q4. Our choice of GVAR model lies in its efficacy to reveal global specific information of the variables under consideration without losing sight of the individual countries’ content.
Our findings can be summarized as follows. One, GTS-164 raises real equity prices in nearly 70% of the markets, and this was sustained throughout the forecast periods. This indicates that only a few markets are efficient when global technology shock is considered. In the other outcome, the response of real equity prices to GTS-OECD is rather different. While this shock results in the immediate rise in real equity prices for more than 85% of the markets, it is evidently short lived below the fourth quarter of the forecast horizon, with an average rise of 0.72%. However, in our additional analysis, the countries are grouped into various blocs where both GST-164 and GTS-OECD are considered, and the outcome reveals that many of the economic blocs could not easily absorb the GTS-164 shock except the emerging and Euro markets. As for GTS-OECD, the shock impact on various economic regions is transient and rarely extends beyond the second quarter of the forecast horizon.
The implication arising is that the GTS-164 is more intense in its impact on real equity prices across many markets, which suggests that the real equity markets in those countries (including US) are inefficient. However, the outcome from GTS-OECD shocks indicates that many of the markets and various economic blocs (including the Euro region) as considered in this study are efficient. It thus suggests that the efficiency of real equity market is associated with region-specific technology shock but rather not for the alternative measures that account for numerous markets with no consideration on their relationship with developed and emerging countries. In such a situation when technology shock is particularly global, adaptive market hypotheses play an important role in explaining the changes in stock prices rather than the Efficient Market Hypothesis.


