Effects of Live Fuel Moisture Content on Wildfire Occurrence in Fire-Prone Regions over Southwest China


1
School of Resources and Environment, University of Electronic Science and Technology of China, Chengdu 611731, China
2
Fenner School of Environment and Society, The Australian National University, Canberra ACT 2601, Australia
3
Bushfire & Natural Hazards Cooperative Research Centre, Melbourne VIC 3002, Australia
*
Authors to whom correspondence should be addressed.
Forests 2019, 10(10), 887; https://0-doi-org.brum.beds.ac.uk/10.3390/f10100887
Submission received: 9 September 2019
/
Revised: 4 October 2019
/
Accepted: 6 October 2019
/
Published: 8 October 2019
(This article belongs to the Special Issue Forest Fire Risk Prediction)
Abstract
:Previous studies have shown that Live Fuel Moisture Content (LFMC) is a crucial driver affecting wildfire occurrence worldwide, but the effect of LFMC in driving wildfire occurrence still remains unexplored over the southwest China ecosystem, an area historically vulnerable to wildfires. To this end, we took 10-years of LFMC dynamics retrieved from Moderate Resolution Imaging Spectrometer (MODIS) reflectance product using the physical Radiative Transfer Model (RTM) and the wildfire events extracted from the MODIS Burned Area (BA) product to explore the relations between LFMC and forest/grassland fire occurrence across the subtropical highland zone (Cwa) and humid subtropical zone (Cwb) over southwest China. The statistical results of pre-fire LFMC and cumulative burned area show that distinct pre-fire LFMC critical thresholds were identified for Cwa (151.3%, 123.1%, and 51.4% for forest, and 138.1%, 72.8%, and 13.1% for grassland) and Cwb (115.0% and 54.4% for forest, and 137.5%, 69.0%, and 10.6% for grassland) zones. Below these thresholds, the fire occurrence and the burned area increased significantly. Additionally, a significant decreasing trend on LFMC dynamics was found during the days prior to two large fire events, Qiubei forest fire and Lantern Mountain grassland fire that broke during the 2009/2010 and 2015/2016 fire seasons, respectively. The minimum LFMC values reached prior to the fires (49.8% and 17.3%) were close to the lowest critical LFMC thresholds we reported for forest (51.4%) and grassland (13.1%). Further LFMC trend analysis revealed that the regional median LFMC dynamics for the 2009/2010 and 2015/2016 fire seasons were also significantly lower than the 10-year LFMC of the region. Hence, this study demonstrated that the LFMC dynamics explained wildfire occurrence in these fire-prone regions over southwest China, allowing the possibility to develop a new operational wildfire danger forecasting model over this area by considering the satellite-derived LFMC product.
1. Introduction
Wildfire is a natural phenomenon for many ecosystems since fire affects nutrient cycling, vegetation succession patterns, and resistance to pests [1]. It also poses a great threat to the ecological environment, economic development, as well as human life and property [2,3,4,5,6]. There are three major factors that relate to the incidence of wildfires, spatially continuous and dry enough to burn fuel (biomass), meteorological conditions conducive to the spread of fire, and ignitions [7,8,9]. In this context, fuel moisture content (FMC), defined as the proportion of water content to dry mass within the fuel and traditionally divided into FMC of live (LFMC) and dead fuels (DFMC) [10], is an important driver affecting fuel ignition and fire spread rate [11,12,13]. Additionally, FMC has also been proven to explain fire occurrence at a large scale as the burned area tends to increase as FMC decreases [14,15,16,17]. This is due to the fact that fuels with higher moisture content require more energy for water evaporation, slowing down the fire spread rate and decreasing the flame length [18].
Three methods are normally used to estimate FMC: on-ground field measurements, meteorological data, and satellite imagery [19]. Ground field measurements commonly achieve a high accuracy level if a standard protocol is followed and have been used to investigate the relation of FMC with wildfire occurrence, particularly for the Mediterranean region. For example, Chuvieco et al. [17] demonstrated FMC measurements to have a predictive effect on fire occurrence in central Spain where grassland FMC change was a significant factor explaining the numbers of fires, and shrub FMC was highly associated with large fires. Schoenberg et al. [20] showed that the burned area tended to increase when the field measured FMC was lower than 90%. Dennison et al. revealed an FMC threshold of 70%–80% [21] and 79% [15] in chamise and southern California, that explained the largest fires. However, despite the locally high accuracy level for FMC taken at the field, the high time- and cost-consuming make the large-scale and spatial–temporal FMC mapping unfeasible.
Meteorological indices such as the Keetch–Byram Drought Index (KBDI) and Cumulative Water Balance Index (CWBI) have been commonly used as indicators for FMC variations [22,23,24]. Ruffault et al. [25] predicted LFMC quantitative variations and critical values by evaluating the capacity of six drought indices (Duff Moisture Code (DMC), Drought Code (DC), KBDI, the Nesterov Index (NI) and the Relative Water Content (RWCL and RWCH)). FMC estimated from meteorological data allowed for long-term and large-scale mapping, however, the coarse spatial resolution and interpolation of meteorological data also introduce additional errors. Moreover, the LFMC estimate from meteorological data is still challenged because living plants can utilize moisture stored in the soil and have multiple drought adaptation strategies [19,26].
Remote sensing techniques are the only way to date to spatially and temporally understand the FMC dynamics at regional to continental scale. Methods based on remote sensing for FMC mapping can be broadly classified into two categories: empirical methods and the radiative transfer model (RTM) based methods [19,27,28,29]. The former techniques are known to use statistical formulas based on FMC measurements and corresponding reflectance or vegetation indices derived from remote sensing images. For example, with optimally averaged Enhanced Vegetation Index, Myoung et al. [30] developed an empirical model function of LFMC from MODIS satellite data for wildfire danger assessment in southern California USA. These statistical approaches are simple and have a known local accuracy, and their effect on wildfire occurrence has also been explored and analyzed in previous studies [31]. Jurdao et al. [31] suggested that the critical FMC that supported 90% of grassland and shrubland fire occurrence was 127.12% and 105.51%, respectively, by extracting the burned pixels from the MODIS Thermal Anomalies product (MOD14) and retrieving pre-fire FMC from empirical models applied to satellite images. Nolan et al. [9] determined DFMC thresholds of forest and woodland (14.6% and 9.9%, respectively) across eastern Australia, based on an empirical formula of vapor pressure deficit estimated from interpolated weather station measurements [32], and determined the LFMC threshold values that explained fire occurrence in eastern Australia (156.1% and 101.5%) by estimating LFMC using an empirically exponential model based on MODIS derived vegetation index. They also demonstrated the “switch” hypothesis [7] that flammable and non-flammable states can change quickly from one to another when the temporal dynamics of FMC are close to the thresholds. However, these empirical methods are known to lack reproducibility due to the shortcomings of sensor-specificity and position-dependence [33,34]. Alternatively, RTM-based methods have proven to be more reproducible for LFMC retrievals given they are based on physical laws that provide explicit connections between surface parameters and leaf and/or canopy spectra [35,36]. Furthermore, RTM-based methods for LFMC retrieval have been demonstrated to be robust, not site-specific, and easy to generalize [37].
This study aims to explore the effect of LFMC dynamics on wildfire occurrence in the fire-prone regions over southwest China between 2007 and 2016 using LFMC estimates derived from satellite data and RTM. Specifically, senescence in grasses results in the conversion of live fuel to dead fuel over time. Grassland LFMC in the sections below, is considered as the average moisture content of both live and dead fuel components, and the degree of curing is not explicitly accounted for. This study is novel as it (i) provides the first analysis of the effects of LFMC on wildfire occurrence over the southwest China fire-prone regions which are historically vulnerable to wildfire, and (ii) was entirely based on optical remote sensing data while RTM-derived LFMC offers a unique way to monitor LFMC dynamics at large scale. The materials and methods mentioned here can be applied to other fire-prone areas due to the generalization potential and reproducibility of the RTM-based LFMC retrieving methods used. The overarching objective of this study is to contribute to the development of an operational system over this region by considering the satellite- and RTM- based LFMC product. This new system will allow wildfire danger early prediction, suppression, and response, as well as improved awareness of fire risk to life and property.
2. Materials and Methods
2.1. Study Area
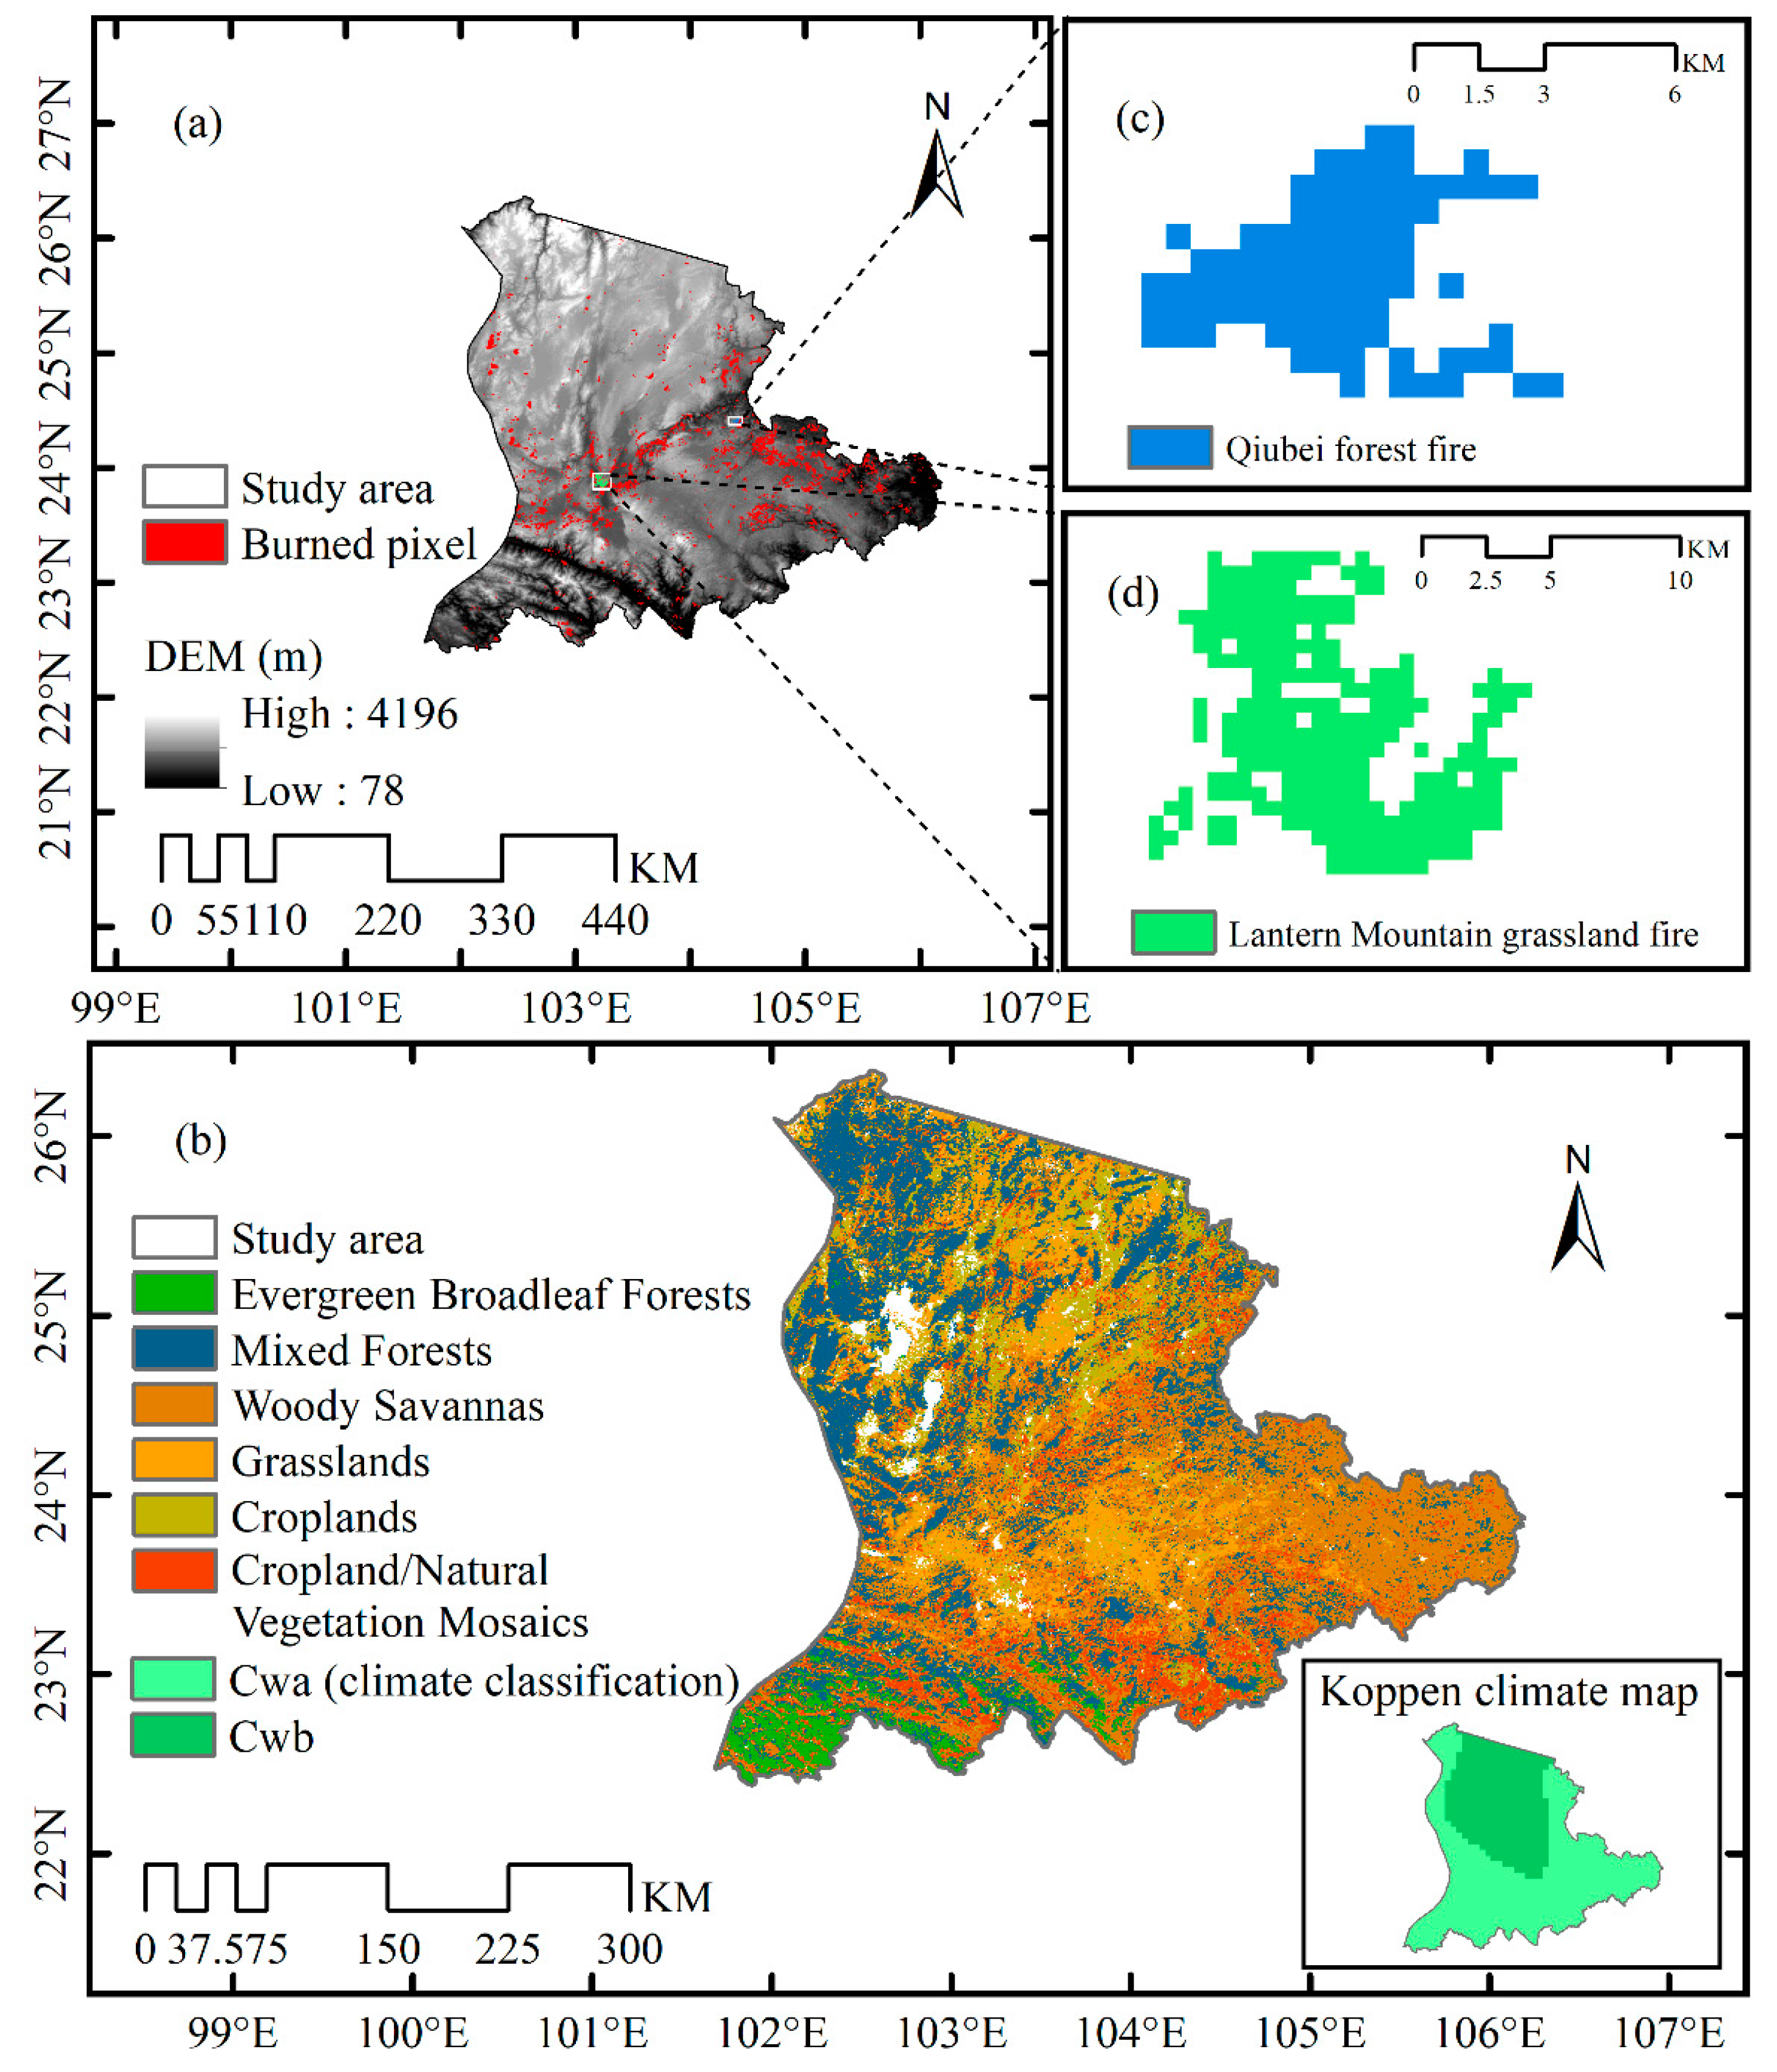
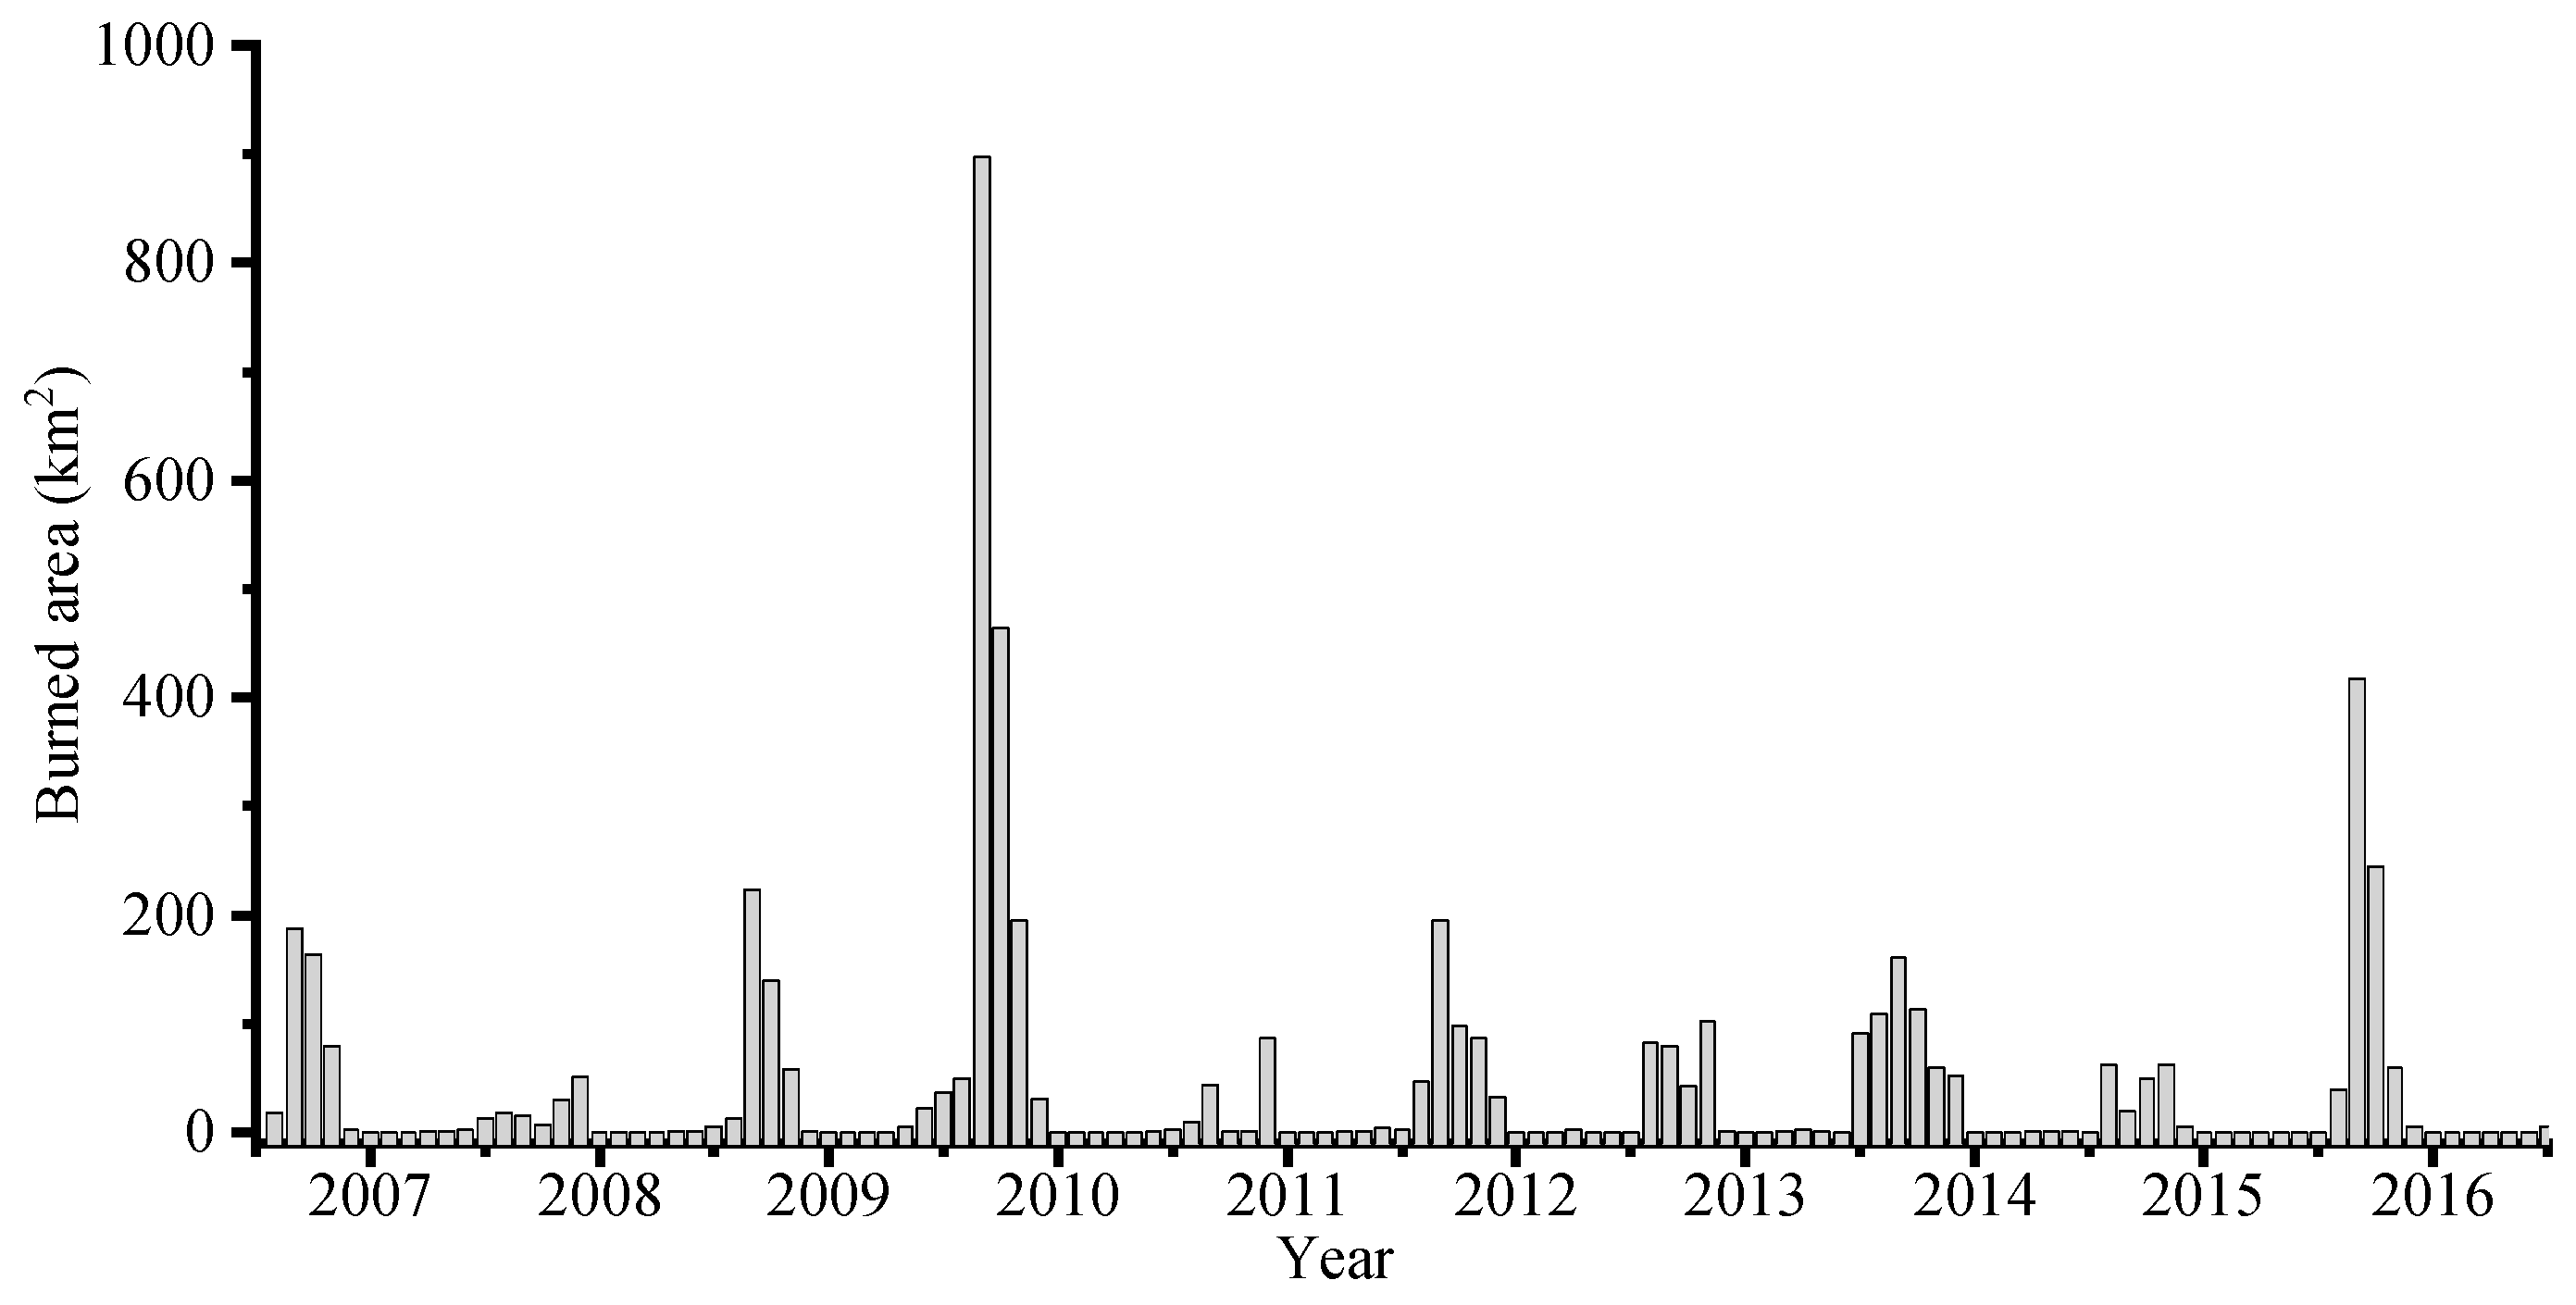
The study area (101° E–107° E, 22° N–27° N) is located in southwest China, which is part of the Yunnan–Guizhou plateau (Figure 1a), with most areas are 1500–2000 meters above sea level. According to the IGBP (International Geosphere–Biosphere Programme) classification scheme of the MODIS Land Cover product MCD12Q1 [38], evergreen broadleaf forests, mixed forests, woody savannas, grasslands, croplands, and cropland/natural vegetation mosaics are dominant vegetation types in this area (Figure 1b) (Table 1). Under the Koppen climate classification [39], the study area lies within the subtropical highland zone (Cwb) and humid subtropical zone (Cwa), with mild to warm winters, and tempered summers (Figure 1b). The annual average temperature of the study area is 15–18 °C, with an annual temperature difference between 12 °C and 16 °C. The annual precipitation of the study area ranges from 1000 mm to 1200 mm. The precipitation in May to October accounts for 80%–90% of the whole year, whereas November to the next April is the dry season with little precipitation, leading to a high frequency of wildfire occurrence during this period. Figure 2 shows the burned area per month from 2007 to 2016 within the study area extracted from the MODIS Burned Area (BA) product MCD64A1 [40], which also illustrated that the wildfires commonly occurred during the dry season and peak in January to April. Here, we defined the fire season as spanning from September (month with highest LFMC value) to the next year August (e.g., the 2009/2010 fire season starts from September 2009 to August 2010) in this study in terms of the annual LFMC dynamics. Additionally, two large fire (burned area greater than 10 km2 following Arganaraz et al. [41]), Qiubei forest fire (104.42° E, 24.41° N) on the 1th February 2010 and burned 18.2 km2 for around two weeks (Figure 1c), and Lantern Mountain grassland fire (103.23° E, 23.89° N) on the 13th February 2016 and burned about 35.4 km2 for around three days (Figure 1d), were selected as the case studies to explore the relation between LFMC and fire occurrences.
2.2. LFMC Measurements
LFMC measurements taken at west China were used to validate the accuracy of the LFMC retrieved by RTM. The field campaigns were conducted at three areas during four periods, (i) Ruoergai Grassland (102.46° E–102.67° E, 33.38° N–33.98° N), 2013, (ii) Qinghai Lake (98.30° E– 101.09° E, 36.38° N–38.25° N), 2014, (iii) Qinghai Lake (98.48° E–101.07° E, 36.34° N–37.78° N), 2015, and (iv) Wenquan Town (102.44° E–102.46° E, 24.99° N–25.00° N), 2016. A total of 192 sampling plots (50 plots in 2013, 62 plots in 2014, 70 plots in 2015, and 10 plots in 2016) covering grass and forest areas were selected and sampled. The positions for each plot were measured through a global positioning system (GPS, Trimble Geo 3000). In each plot of grassland area (30 m × 30 m), the plants (0.5 m × 0.5 m) were randomly measured and destructively sampled. The forest samples were taken within 20 m from the center of the plots (i.e., the area of the plot is around 40 m × 40 m), and we used a telescopic scissor to sample the tree canopy leaves that were not easily reached. The fresh samples were first sealed in plastic bags to prevent the loss of water and then transported to the laboratory, weighed, then oven-dried, and finally weighed again to determine the LFMC. For details on the sampling protocol, please refer to refs. [36,42].
2.3. Satellite Data
Satellite products from two different sensors were used in this study, MODIS products and Landsat 8 OLI product. MODIS products were supplied by the Land Processes Distributed Active Archive Center (LPDAAC) at the U.S. Geological Survey (USGS) Earth Resources Observation and Science Center (EROS). Landsat 8 OLI product provided by USGS via Google Earth Engine (GEE).
2.3.1. Land Cover
The IGBP classification scheme integrated into the MODIS land cover product MCD12Q1 Collection 5 [38] was selected and used to re-classify the vegetation types into three fuel classes (Table 1): forest, grassland, and shrubland following Yebra et al. [43]. Since MCD12Q1 Collection 5 was only available from 2001 to 2013, we continued to use the year 2013 for the years 2014 to 2016. Notably, since little shrubland (around 0.46% of total vegetation coverage area) was identified in the study area, and the corresponding cumulative burned area was less than 10 km2, we masked those shrubland pixels out and did not estimate their LFMC.
2.3.2. Reflectance
The MODIS MCD43A4 Collection 5 product [44] provides 8-day temporal resolution and 500 m surface reflectance adjusted by Nadir Bidirectional Reflectance Distribution Function (BRDF), and the MODIS MCD43A2 Collection 5 product records the quality information of the MCD43A4 pixel reflectance. MCD43A4 is based on a 16-day period, which makes LFMC retrieval less influenced by clouds or shadows [45]. Moreover, adjustment by BRDF makes the observed reflectance closer to RTM simulations that were based on zero zenith angles [46].
Directly validating satellite-derived LFMC with LFMC measurements is unreasonable since the LFMC was measured at 30/40 m scale which was mismatched with the spatial resolution of MCD43A4 (500 m). Therefore, Landsat 8 Operational Land Imager (OLI) products with spatial resolution of 30 m and acquired at the closest sampling periods were used to filter out the LFMC measurements sampled in heterogeneous areas (Section 2.4.1).
2.3.3. Burned Area
The MODIS Burned Area (BA) product MCD64A1 Collection 6 [40] was proven to be of high accuracy and large-scale BA product [47] was selected as the measure of fire occurrence in this study. The product is generated monthly at a spatial resolution of 500 m. All pixels with values greater than zero in the “Burn Date” layer were identified as burned pixels and were used to determine the burn locations and burn dates in the study area.
2.4. Data Analysis
2.4.1. LFMC Retrieval and Validation
LFMC dynamics were retrieved and mapped from MCD43A4 based on the Look-Up Table (LUT) algorithm following Quan et al. [28] (grassland) and Quan et al. [36] (forest). In these studies, the PROSAIL RTM (PROSPECT [48] + SAILH [49,50]) was used for the LFMC retrieval for grassland, and the PROSAIL RTM coupled with PROGeoSAIL RTM (PROSPECT + GeoSAIL [51]) was used for forest. The latter was coupled to better represent a two-layered forest characteristic with upper tree species and understory of grass. To validate the approach, LFMC field measurements (see Section 2.2) were used, however, directly validating estimations with field measurements may cause errors because of scale discrepancy [52] (Figure 3). To alleviate the scale discrepancy between sampling plots (30 m for grassland and 40 m for forest) and MCD43A4-derived LFMC pixels (500 m) only homogeneous plots within the MODIS footprint were selected. The homogeneity of the plots was assessed using the standard deviation of NDVI (Normalized Difference Vegetation Index, Equation (1), Figure 3) derived from the Landsat 8 OLI pixels within a 500 m × 500 m buffer (SDNDVI) and the CVNDVI (Equation (2)). We argue that plants within the 500 m × 500 m MODIS pixel size buffer should be more homogeneous in both species composition and moisture condition when the CVNDVI (ranges from 0.05 to 0.15) and SDNDVI (ranges from 0.15 to 0.30) are lower than a certain threshold [53]. Finally, the threshold values that resulted in high R2 and low RMSE were selected for the final methodology. Noteworthily, 152 field data were finally obtained after calculating the average value of field LFMC measurements (originally 192 LFMC measurements) at MODIS scale (Figure 3b).
where and are the near-infrared and red reflectance of Landsat 8 OLI product, respectively.
The processing of the Landsat data was conducted using the Google Earth Engine [54] and the LFMC retrieval algorithm was implemented in MATLAB (R2017a version, The MathWorks, Natick, Massachusetts, United States of America).
2.4.2. Critical LFMC Thresholds and Their Relation to Fire Occurrence over Southwest China
The MCD64A1 burned area product was used to extract the historical wildfire location and date which, however, were almost provided at the pixel level, rather than specific fire events (normally with the burned area more than one pixel). The KD-Tree based DBSCAN (Density-Based Spatial Clustering of Applications with Noise) algorithm [55] was used to extract the total burned area for each of the studied fire events. Figure 1c,d show the cluster results of the Qiubei forest fire and the Lantern Mountain grassland fire. To analyze the influence of pre-fire LFMC on the burned area and frequency, the critical LFMC thresholds should be determined beforehand. We identified the burn dates of all pixels within each fire event based on the information of “Burn Date” layer of MCD64A1 BA product. The pre-fire LFMC value of each pixel was equal to the LFMC prior to the burning date of that pixel and the median value of all pre-fire LFMC values was used to characterize the overall LFMC condition before the fire broke out. The cumulative burned area by fire event was therefore calculated as a function of decreasing the pre-fire median LFMC value following Dennison and Moritz [15] and Nolan et al. [9]. A segmented regression model [51] was then applied to fit the relation between pre-fire LFMC and cumulative burned area for all the fire events, thus identifying critical LFMC thresholds. The model with the lowest Akaike’s Information Criterion (AIC) was selected as the optimal [9]. Breakpoints that indicate a significant increase in the cumulative burned area were finally identified as the critical threshold and other breakpoints were discarded because of the small significance. Here, we divided the study area into four areas (forest across Cwa and Cwb, grassland across Cwa and Cwb), and this methodology based on cumulative burned area was applied to each area. Moreover, the LFMC dynamics before and after the Qiubei forest fire and Lantern Mountain grassland fire were analyzed as two case studies to illustrate the effect of LFMC critical thresholds on fire occurrence.
Finally, the median LFMC values for forest and grassland over southwest China were calculated for each of the LFMC maps from 2007 to 2016, and then a boxplot was used to characterize the overall LFMC distribution on each DOY (Day of Year) at 8-day temporal resolution through the ten years. Because of the similarity of critical LFMC thresholds in Cwa and Cwb climate zones (see in Section 3.2), we did not distinguish here two climatic zones and analyzed the relation between LFMC climatology and fire occurrence based on different fuel classes (forest and grassland). We additionally analyzed the median LFMC and corresponding burned area dynamics for forest in 2015/2016 fire season and grassland in 2009/2010 fire season. Those periods were selected because of the occurrence of the large wildfires subject to investigation in this research. In this case, temporal resolution for the burned area was re-calculated to 8-days according to the burn date extracted from the MCD64A1 product.
3. Results
3.1. LFMC Validation and Mapping
The accuracy in the LFMC retrievals improved (R2 increased and RMSE decreased) when decreasing the CVNDVI and SDNDVI threshold values used to filter out heterogeneous plots (Figure 4). Specifically, R2 increased from 0.52 to 0.67, and RMSE slightly decreased from 41.8% to 40.5% as the CVNDVI and SDNDVI increased.
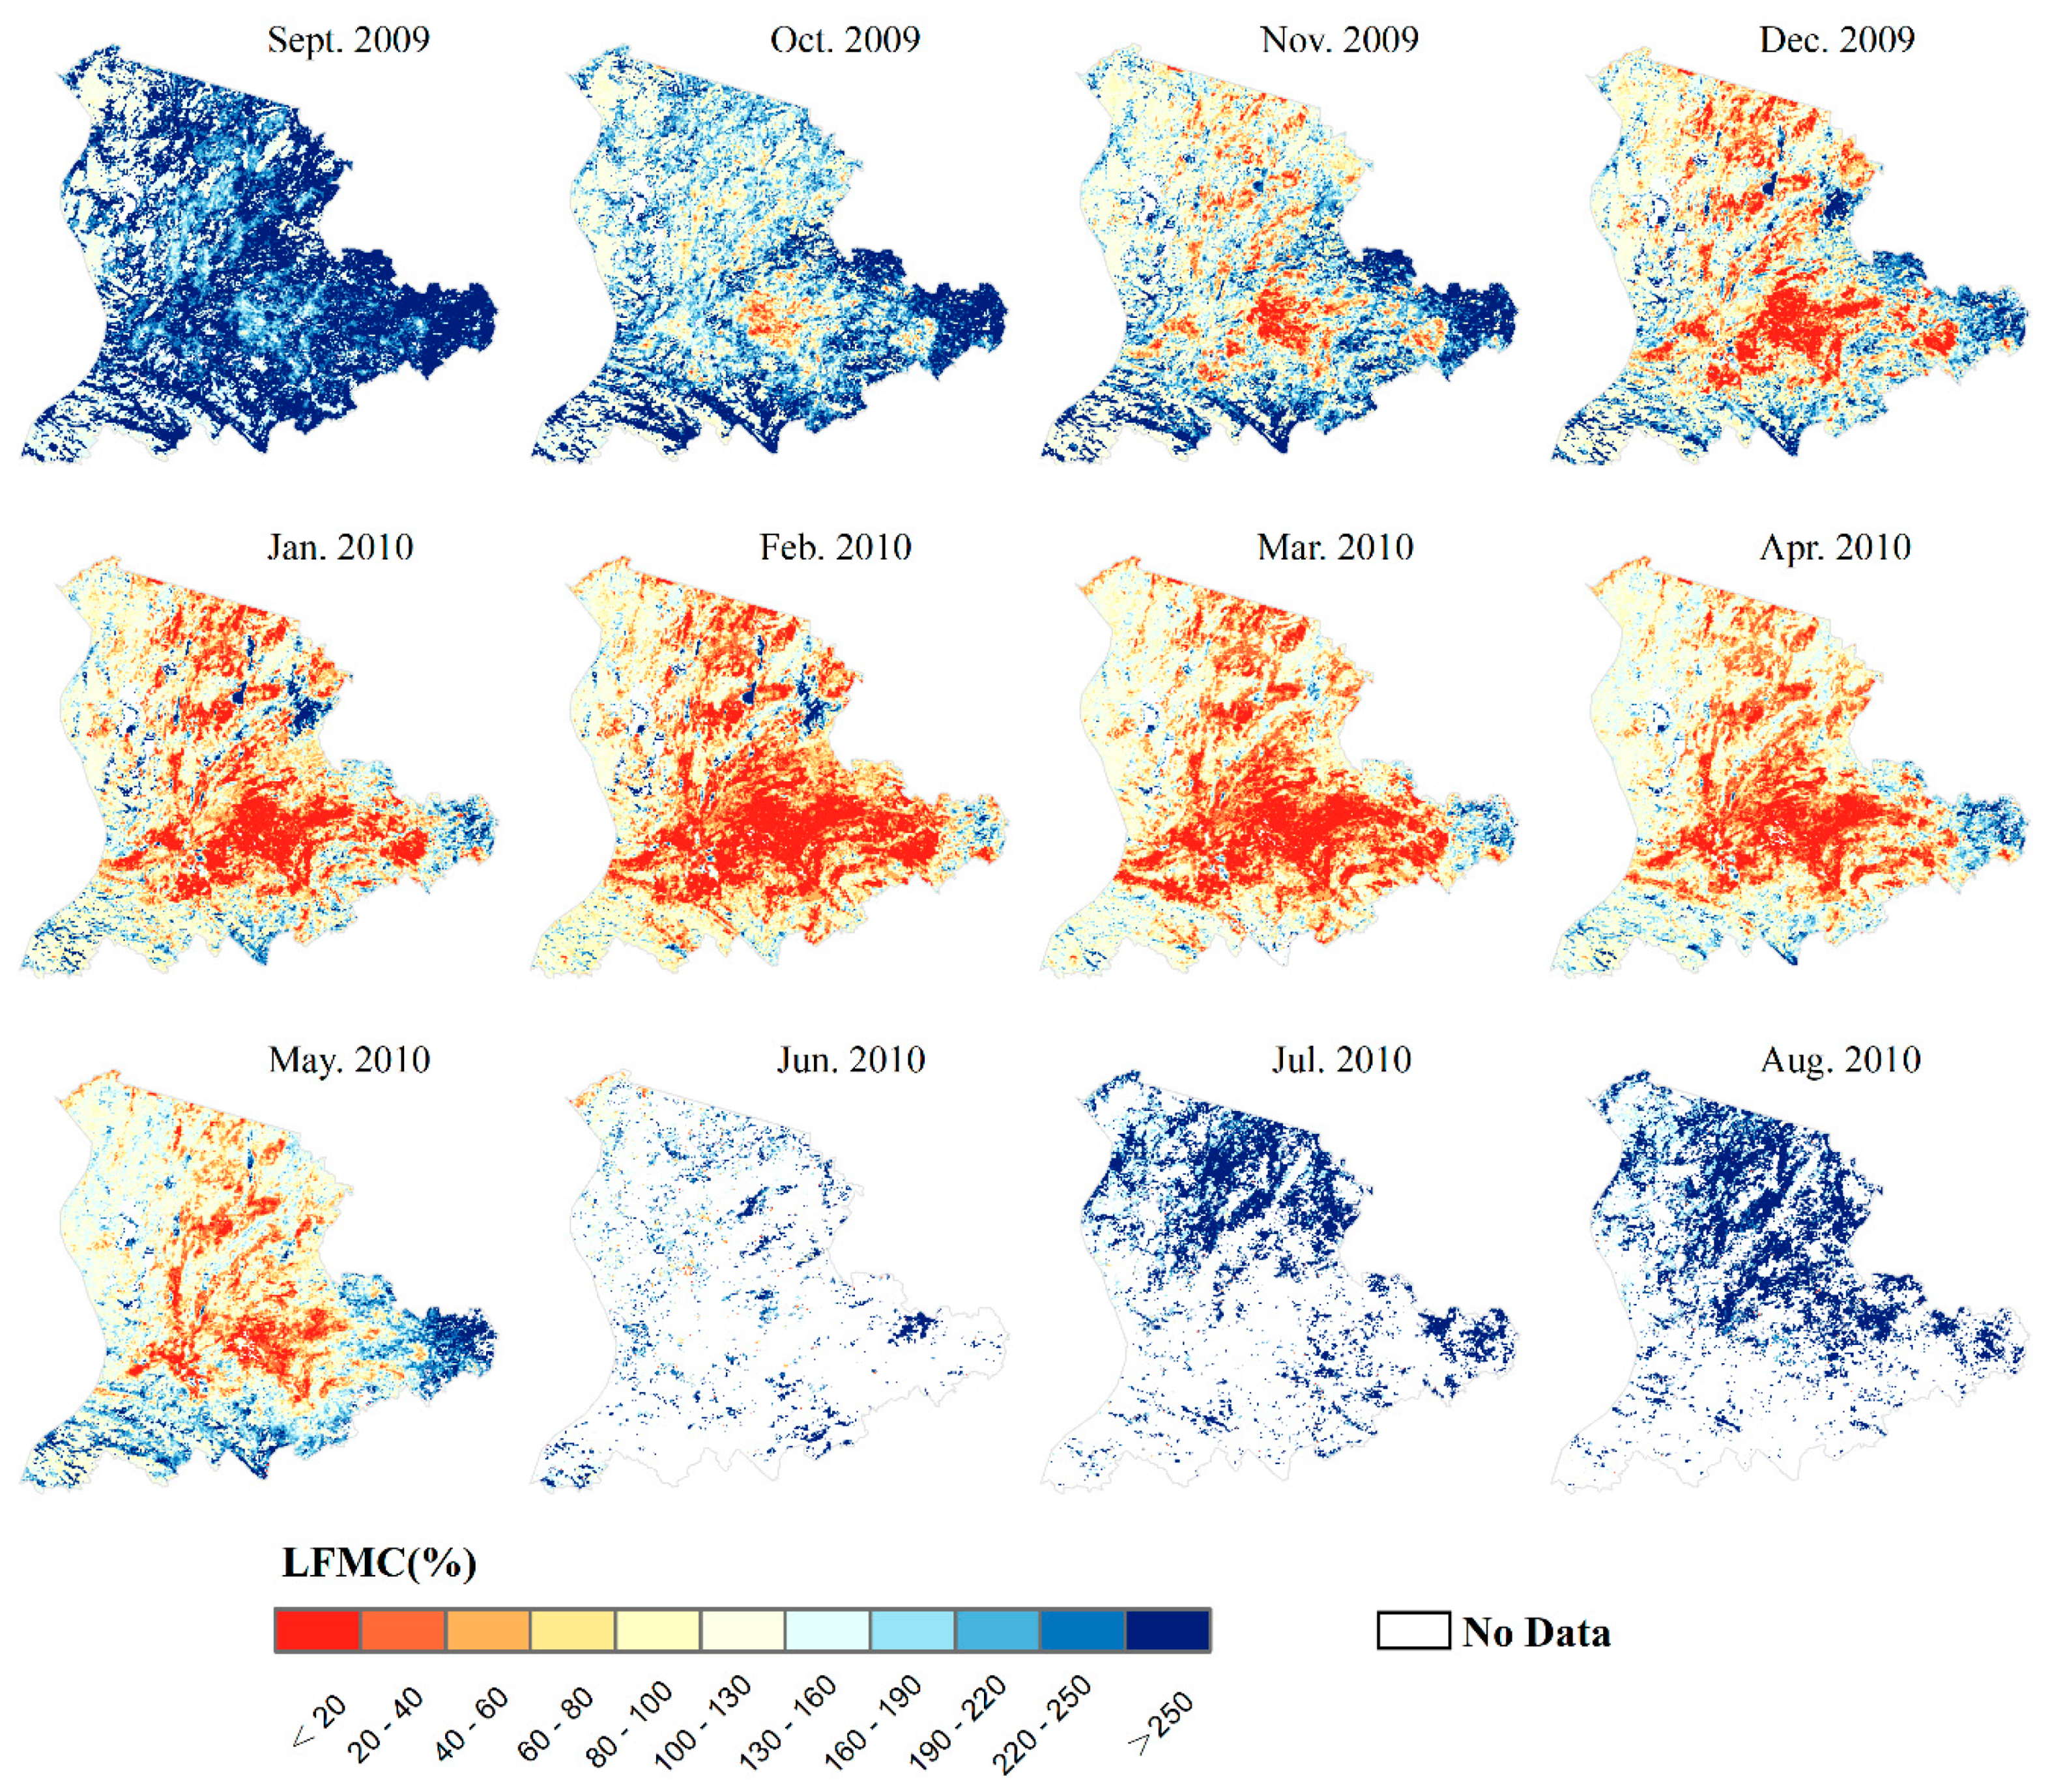
A result of this study is a multi-temporal LFMC dataset over the study area from 2007 to 2016. An example of the monthly LFMC distribution during the 2009/2010 fire season is shown in Figure 5. The LFMC in the study area was low from Nov 2009 to May 2010, particularly during the months of January to April. These months coincide with the dry season and peaks in the burned area in the study area (Figure 2). The rainy season generally begins in June and lasts until October. Consequently, high LFMC values are observed during this period but also more data gaps due to frequent cloudy and rainy weather (Figure 5).
3.2. Critical LFMC Thresholds and Their Relation to Fire Occurrence over Southwest China
The relations between the burned area and pre-fire LFMC were non-linear for both grassland and forest (Figure 6). However, the critical pre-fire LFMC thresholds that explain an increase in wildfire occurrence were different for these fuel classes. The burned area increased significantly when the LFMC was below the thresholds (Figure 6). Moreover, the thresholds of the same fuel class were similar under different climatic zones. More specifically, three LFMC thresholds were observed for the forest under the Cwa climate, 151.3% (95% Confidence Interval, CI: 146.8%–155.9%), 123.1% (95% CI: 121.8%–124.3%) and 51.4% (95% CI: 51.2%–51.7%). The ratio of the burned area below these thresholds to the total burned area accounted for 93.1%, 86.5%, and 34.2% of the total burned area, respectively (Figure 6a, Table 2). Ten large forest fires (burned area >10 km2) were also detected in this region, and out of which 10, 9, and 5 occurred below the corresponding LFMC thresholds (Table 2). There were three additional breakpoints identified at 101.8% (95% CI: 100.2%–103.4%), 48.3% (95% CI: 47.9%–48.6%) and 39.8% (95% CI: 38.5%–41.1%), which were not identified as thresholds and were discarded since they did not indicate a significant increase in burned area (e.g., the slope between 51.4% and 101.8% was lower than the slope between 101.8% and 123.1%). Three LFMC thresholds were also observed for grassland across the Cwa climate (138.1% (95% CI: 134.1%–142.0%), 72.8% (95% CI: 70.8%–74.8%), and 13.1% (95% CI: 12.1%–14.1%)) (Figure 6b). Similarly, 17, 14, and 4 out of 21 large grassland fires occurred below the corresponding threshold (Table 2).
Two thresholds were found for forest in the Cwb zone (115.0% (95% CI: 113.6%–116.3%) and 54.4% (95% CI: 53.6%–55.2%)) (Figure 6c). These two threshold values were close to those found for the second (123.1%) and third (51.4%) thresholds for forest in the Cwa zone. The maximum LFMC supporting forest fire occurrence in this region was 124.3% and no wildfire was detected at the wetter range of pre-fire LFMC, thus, no threshold was identified. For grassland across Cwb, 137.5% (95% CI: 129.4%–145.6%), 69.0% (95% CI: 66.5%–71.4%), and 10.6% (95% CI: 10.2%–11.0%) were identified as critical LFMC thresholds (Figure 6d). The three thresholds were similar to the LFMC thresholds for grassland across the Cwa zone.
The Qiubei forest fire, which occurred on the 1st February 2010, affected 75% of the forested area and 25% of the grassland area in the region. In six months, the median LFMC within the burned area gradually decreased from a maximum of 179.7% (YEAR-DOY 2009-241) to a minimum of 49.8% (2010-025), and a fire broke out when the LFMC was below the 51.4% threshold reported for forest across the Cwa zone (Figure 7a). After the fire, the median LFMC value across the burned area stabilized around 49% for more than one month. Similarly, the median LFMC for the vegetation within the final burned area of the Lantern Mountain fire (78% grassland and 22% forest) declined from 286.8% (2015-249) to 151.7% (2015-345) (Figure 7b). Two months before the fire occurred, the median LFMC (125.2%, 2015-353) was already below the 138.1% critical LFMC threshold found for grassland across Cwa zone and further decreased to 17.3% (20156-041), which was slightly higher than the 13.1% grassland LFMC threshold, just before the fire broke out. Different to the Qiubei forest fire, the LFMC recovered quickly after the fire probably due to a quicker regrowth of the grass in this region.
The dynamics variation of the median grassland (Figure 8b) and forest (Figure 8a) LFMC across the study area are similar in terms of alignment with the fire season (see Section 2.1). The lowest LFMC were observed from DOY 337 to DOY 113 which coincided with the dry season and the months with the highest fire occurrence (Figure 8). Additionally, the median LFMC for grassland and forest of the study area (red lines) reached the critical LFMC thresholds (dotted lines) earlier during the highest fire activity fire seasons (2009/2010 and 2015/2016) than for the whole time period (shown as boxplots). Moreover, the median LFMC values during these two fire seasons were almost lower than the first quartile value of the boxplot on the same DOY and were much more likely to be observed as the low outliers (dots traversed by the red line). For example, 14 and 21 median LFMC values were observed as the outliers in the 2015/2016 (Figure 8a) and 2009/2010 (Figure 8b) fire seasons, respectively. Furthermore, the period of lower LFMC coincided with the larger burned area (Figure 8). This suggests that the critical LFMC thresholds effectively explain the burned area. For example, almost all grassland fires in 2009/2010 occurred when the regional median LFMC was below the 70.9% threshold (Figure 8b).
4. Discussion
High-quality spatial information on LFMC is needed to explore the effect of LFMC on fire occurrence at a regional scale. In this study, we followed the methodologies by Quan et al. [28,36] to retrieve LFMC over southwest China using the MCD43A4 product. There was a statistically significant (p <0.01) agreement between retrieved and measured LFMC at field sites used to evaluate the inverse RTM method. The R2 and RMSE of LFMC improved from 0.52 to 0.67 and from 41.8% to 40.5% when we removed pixels heterogeneous within the MODIS footprint. This indicated the heterogeneity in the sampling site highly influences the accuracy assessment of the LFMC retrievals and therefore it should be considered when it comes to model evaluation.
In this study, cumulative burned area methodology was applied to identify breakpoints, and thus to determine the thresholds in forest and grassland classes across Cwa and Cwb climatic regions. Pimont et al. [56] suggested that this kind of methodology should be considered with caution because it is biased by the frequency distribution of LFMC values. However, we argue that the LFMC threshold is not only affected by the distribution of pre-fire LFMC but also by the corresponding burned area. For example, we found that in low LFMC condition (under 15%, Figure 6b,d), cumulative burned area significantly increases, mainly because of the occurrence of several fire events with a large burned area. Therefore, it is reasonable to use this methodology to find LFMC thresholds values below which fires are prone to break out and burn large areas. On the other hand, Pimont et al. [56] also found that fire activity saturated at low LFMC values when cumulative burned area methodology was applied. For example, the cumulative burned area basically did not increase when LFMC was lower than 37.2% (Figure 6c). However, this saturation does not suggest that a low LFMC corresponds to a low fire occurrence. It suggests that it is enough to support fire when the LFMC condition is slightly higher than 37.2%. Therefore, a higher LFMC threshold of 54.4% (Figure 6c) was considered.
Similar to these previously reported studies [9,15,21,31], we found that most wildfires occurred under low LFMC conditions and when LFMC crossed critical LFMC thresholds. Conversely, when pre-fire LFMC exceeded 200% only 0.29% (forest across Cwa) and 0.19% (grassland across Cwb) of the total burned area occurred (Figure 6a,d). However, four large fires with pre-fire LFMC greater than 200% were unexpectedly detected for grassland across Cwa (Figure 6b). Yebra et al. [43] also found high pre-fire LFMC (232%–256%) in the Linksview Road Grassland Fire which occurred in New South Wales on 16th October 2013. This suggests that FMC is not the only driver of wildfire occurrence and therefore, other factors such as meteorological data (e.g., temperature, precipitation, air humidity, etc.) should be accounted for full characterization. For both forest and grassland over southwest China, the first threshold (137.5%–151.3%) is similar to the LFMC threshold identified by Nolan et al. [9] at 156.1% in eastern Australia forest and woodland. The second thresholds changed between different fuel classes with 115.0%–123.1% for forest and 69.0%–72.8% for grassland. Among them, 115.0%–123.1% for forest is similar to the threshold identified by Nolan et al. [9] at 113.6% in eastern Australia, and 69.0%–72.8% for grassland is similar to those reported in other researches [9,15,21]. The third threshold (51.4%–54.4%) for forest is close to the lowest value of LFMC that results in wildfire occurrence in other studies [9,15,17,20,21]. The third threshold (10.6%–13.2%) for grassland is consistent with the previously reported results that the occurrence of wildfires increases when the DFMC decreases to 12.4%–15.1% [9].
LFMC dynamics over a 10-year time series showed that median forest and grassland LFMC values were significantly lower during fire seasons with relatively higher fire activity than other fire seasons. Additionally, those LFMC values were commonly detected as the outliers of the 10-year time series. This suggested that the LFMC is an effective driver and an early indicator of wildfire occurrence over southwest China.
We used optical remote sensing data for LFMC mapping in near real-time. However, because of the weak penetration ability of optical spectral signals through clouds, its applications over cloudy areas are largely limited [57,58]. For example, the computed LFMC maps had many data gaps in June, July, and August over the study area (Figure 5) in spite of the monthly image composite of MCD43A4 data used. Fortunately, this has little impact on analyzing the effects of LFMC on fire occurrences because seldom have wildfires been recorded during this period over the past 10 years (Figure 2). Nevertheless, it poses the question that wildfires may be highly frequent in cloudy areas (e.g., the tropics are inevitably affected by fire [59] and are often covered by clouds [60]). Microwave remote sensing data has been demonstrated to have better potential application in LFMC inversion because of its strong penetration ability [61] and high sensitivity to surface moisture [62,63,64,65]. The combination of multi-source optical and microwave remote sensing may be an effective way to alleviate the missing data problem caused by weather conditions, allowing high quality and long-term LFMC products for wildfire risk assessment to be generated. This will be explored in future work.
5. Conclusions
In this paper, we presented the first study on exploring the effect of LFMC on wildfire occurrence over southwest China. The LFMC dynamics from 2007 to 2016 were first retrieved using RTM and reflectance from the MODIS MCD43A4 product and then validated using field LFMC measurements. Wildfires events were identified through the KD-tree based DBSCAN algorithm under two Koppen climate zones (Cwa and Cwb). Statistical results showed that the LFMC dynamic remarkably affects both grassland and forest fire occurrence: Forest and grassland wildfires between 2007 and 2016 were controlled by three pre-fire critical LFMC thresholds which varied slightly between different fuel classes but were similar for the two climate zones. Furthermore, regional median LFMC during a fire season with high fire activity was significantly lower than the ten year average LFMC. Therefore, this study demonstrated that LFMC dynamics have clear effects on wildfire occurrence over southwest China, allowing the possibility to develop a new operational wildfire early-warning model over this area.
Author Contributions
Study conception and design: X.Q. and B.H. Methodology refining: M.Y. Acquisition of data: K.L. and X.Q. Analysis and interpretation of data: K.L., X.Q., and B.H. The first draft of the manuscript: K.L. Critical revisions: X.Q., M.Y., and B.H., X.Q. and K.L. contributed equally to this article.
Funding
This work was supported by the National Natural Science Foundation of China (Contract No. 41671361 and 41801272) and the Fundamental Research for the Central Universities (Contract No. ZYGX2017KYQD195).
Acknowledgments
The authors wish to thank NASA for providing MODIS MCD12Q1, MCD64A1, MCD43A2, MCD43A4 and Landsat 8 OLI datasets; Google for providing a planetary-scale platform Google Earth Engine for Earth science data and analysis; Peel et al for providing the Koppen climate classification map as a raster file.
Conflicts of Interest
The authors declare no conflict of interest.
List of abbreviations
| Abbreviation | Meaning |
| LFMC | Live Fuel Moisture Content |
| RTM | Radiative Transfer Model |
| Cwa | Subtropical Highland Zone |
| Cwb | Humid Subtropical Zone |
| BA | Burned Area |
| IGBP | International Geosphere–Biosphere Programme |
| KBDI | Keetch–Byram Drought Index |
| DEM | Digital Elevation Model |
| BRDF | Bidirectional Reflectance Distribution Function |
| Landsat 8 OLI | Landsat 8 Operational Land Imager |
| NDVI | Normalized Difference Vegetation Index |
| SDNDVI | Standard Deviation |
| CVNDVI | Coefficient of Variance |
| DBSCAN | Density-Based Spatial Clustering of Applications with Noise |
| CI | Confidence Interval |
| DOY | Day of Year |
References
- Kilgore, B.M. The ecological role of fire in Sierran conifer forests: Its application to National Park management. Quat. Res. 1973, 3, 496–513. [Google Scholar] [CrossRef]
- Van der Werf, G.R.; Randerson, J.T.; Giglio, L.; Collatz, G.J.; Kasibhatla, P.S.; Arellano, A.F., Jr. Interannual variability in global biomass burning emissions from 1997 to 2004. Atmos. Chem. Phys. 2006, 6, 3423–3441. [Google Scholar] [CrossRef] [Green Version]
- Werf, G.R.V.D.; Morton, D.C.; Defries, R.S.; Olivier, J.G.J.; Kasibhatla, P.S.; Jackson, R.B.; Collatz, G.J.; Randerson, J.T. CO2 emissions from forest loss. Nat. Geosci. 2009, 2, 737–738. [Google Scholar] [CrossRef]
- Boerner, R.E.J.; Jianjun, H.; Hart, S.C. Impacts of fire and fire surrogate treatments on forest soil properties: A meta-analytical approach. Ecol. Appl. 2009, 19, 338–358. [Google Scholar] [CrossRef] [PubMed]
- Liu, X.; He, B.; Quan, X.; Yebra, M.; Qiu, S.; Yin, C.; Liao, Z.; Zhang, H. Near real-time extracting wildfire spread rate from himawari-8 satellite data. Remote Sens. 2018, 10, 1654. [Google Scholar] [CrossRef]
- Rieman, B.E.; Gresswell, R.E.; Young, M.K.; Luce, C.H. Introduction to the effects of wildland fire on aquatic ecosystems in the Western USA. For. Ecol. Manag. 2003, 178, 1–3. [Google Scholar] [CrossRef]
- Bradstock, R.A. A biogeographic model of fire regimes in Australia: Current and future implications. Glob. Ecol. Biogeogr. 2010, 19, 145–158. [Google Scholar] [CrossRef]
- Meyn, A.; White, P.S.; Buhk, C.; Jentsch, A. Environmental drivers of large, infrequent wildfires: The emerging conceptual model. Prog. Phys. Geogr. 2007, 3, 287–312. [Google Scholar] [CrossRef]
- Nolan, R.H.; Boer, M.M.; de Dios, V.R.; Caccamo, G.; Bradstock, R.A. Large-scale, dynamic transformations in fuel moisture drive wildfire activity across southeastern Australia. Geoph. Res. Lett. 2016, 43, 4229–4238. [Google Scholar] [CrossRef] [Green Version]
- Chuvieco, E.; Aguado, I.; Dimitrakopoulos, A.P. Conversion of fuel moisture content values to ignition potential for integrated fire danger assessment. Can. J. For. Res. 2004, 34, 2284–2293. [Google Scholar] [CrossRef]
- Viegas, D.X.; Viegas, M.; Ferreira, A.D. Moisture content of fine forest fuels and fire occurrence in central Portugal. Int. J. Wildland Fire 1992, 2, 69–86. [Google Scholar] [CrossRef]
- Rossa, C.G. The effect of fuel moisture content on the spread rate of forest fires in the absence of wind or slope. Int. J. Wildland Fire 2017, 26, 24. [Google Scholar] [CrossRef]
- Rossa, C.G.; Fernandes, P.M. Live fuel moisture content: The ‘pea under the mattress’ of fire spread rate modeling? Fire 2018, 1, 43. [Google Scholar] [CrossRef]
- Davis, F.W.; Michaelsen, J. Sensitivity of Fire Regime in Chaparral Ecosystems to Climate Change; Springer: New York, NY, USA, 1995; pp. 435–456. [Google Scholar]
- Dennison, P.E.; Moritz, M.A. Critical live fuel moisture in chaparral ecosystems: A threshold for fire activity and its relationship to antecedent precipitation. Int. J. Wildland Fire 2009, 18, 1021–1027. [Google Scholar] [CrossRef]
- Agee, J.K.; Wright, C.S.; Williamson, N.; Huff, M.H. Foliar moisture content of Pacific Northwest vegetation and its relation to wildland fire behavior. For. Ecol. Manag. 2002, 167, 57–66. [Google Scholar] [CrossRef]
- Chuvieco, E.; González, I.; Verdú, F.; Aguado, I.; Yebra, M. Prediction of fire occurrence from live fuel moisture content measurements in a Mediterranean ecosystem. Int. J. Wildland Fire 2009, 18, 430–441. [Google Scholar] [CrossRef]
- Dimitrakopoulos, A.P.; Papaioannou, K.K. Flammability assessment of Mediterranean forest fuels. Fire Technol. 2001, 37, 143–152. [Google Scholar] [CrossRef]
- Yebra, M.; Dennison, P.E.; Chuvieco, E.; Riaño, D.; Zylstra, P.; Hunt, E.R., Jr.; Danson, F.M.; Yi, Q.; Jurdao, S. A global review of remote sensing of live fuel moisture content for fire danger assessment: Moving towards operational products. Remote Sens. Environ. 2013, 136, 455–468. [Google Scholar] [CrossRef]
- Schoenberg, F.P.; Peng, R.; Huang, Z.J.; Rundel, P. Detection of non-linearities in the dependence of burn area on fuel age and climatic variables. Int. J. Wildland Fire 2003, 12, 1–6. [Google Scholar] [CrossRef]
- Dennison, P.E.; Moritz, M.A.; Taylor, R.S. Evaluating predictive models of critical live fuel moisture in the Santa Monica Mountains, California. Int. J. Wildland Fire 2008, 17, 18–27. [Google Scholar] [CrossRef] [Green Version]
- Burgan, R.E. 1988 Revisions to the 1978 National Fire-Danger Rating System; Research Paper SE-273; US Department of Agriculture, Forest Service, Southeastern Forest Experiment Station: Asheville, NC, USA, 1988; p. 144.
- Dennison, P.E.; Roberts, D.A.; Thorgusen, S.R.; Regelbrugge, J.C.; Weise, D.; Lee, C. Modeling seasonal changes in live fuel moisture and equivalent water thickness using a cumulative water balance index. Remote Sens. Environ. 2003, 88, 442–452. [Google Scholar] [CrossRef]
- Dimitrakopoulos, A.; Bemmerzouk, A. Predicting live herbaceous moisture content from a seasonal drought index. Int. J. Biometeorol. 2003, 47, 73–79. [Google Scholar] [PubMed]
- Ruffault, J.; Martin-StPaul, N.; Pimont, F.; Dupuy, J.L. How well do meteorological drought indices predict live fuel moisture content (LFMC)? An assessment for wildfire research and operations in Mediterranean ecosystems. Agric. For. Meteorol. 2018, 262, 391–401. [Google Scholar] [CrossRef]
- Viegas, D.; Piñol, J.; Viegas, M.; Ogaya, R. Estimating live fine fuels moisture content using meteorologically-based indices. Int. J. Wildland Fire 2001, 10, 223–240. [Google Scholar] [CrossRef]
- Quan, X.; He, B.; Li, X.; Tang, Z. Estimation of grassland live fuel moisture content from ratio of canopy water content and foliage dry biomass. IEEE Geosci. Remote Sens. Lett. 2015, 12, 1903–1907. [Google Scholar] [CrossRef]
- Quan, X.; He, B.; Li, X.; Liao, Z. Retrieval of grassland live fuel moisture content by parameterizing radiative transfer model with interval estimated LAI. IEEE J. Sel. Top. Appl. Earth Obs. Remote Sens. 2016, 9, 910–920. [Google Scholar] [CrossRef]
- Quan, X.; He, B.; Yebra, M.; Yin, C.; Liao, Z.; Zhang, X.; Li, X. A radiative transfer model-based method for the estimation of grassland aboveground biomass. Int. J. Appl. Earth Obs. Geoinf. 2017, 54, 159–168. [Google Scholar] [CrossRef]
- Myoung, B.; Kim, S.H.; Nghiem, S.V.; Jia, S.; Whitney, K.; Kafatos, M.C. Estimating live fuel moisture from MODIS satellite data for wildfire danger assessment in Southern California USA. Remote Sens. 2018, 10, 87. [Google Scholar] [CrossRef]
- Jurdao, S.; Chuvieco, E.; Arevalillo, J.M. Modelling fire ignition probability from satellite estimates of live fuel moisture content. Fire Ecol. 2012, 8, 77–97. [Google Scholar] [CrossRef]
- Nolan, R.H.; Dios, V.R.D.; Boer, M.M.; Caccamo, G.; Goulden, M.L.; Bradstock, R.A. Predicting dead fine fuel moisture at regional scales using vapour pressure deficit from MODIS and gridded weather data. Remote Sens. Environ. 2016, 174, 100–108. [Google Scholar] [CrossRef] [Green Version]
- Al-Moustafa, T.; Armitage, R.P.; Danson, F.M. Mapping fuel moisture content in upland vegetation using airborne hyperspectral imagery. Remote Sens. Environ. 2012, 127, 74–83. [Google Scholar] [CrossRef]
- Houborg, R.; Anderson, M.; Daughtry, C. Utility of an image-based canopy reflectance modeling tool for remote estimation of LAI and leaf chlorophyll content at the field scale. Remote Sens. Environ. 2009, 113, 259–274. [Google Scholar] [CrossRef]
- Huang, J.X.; Sedano, F.; Huang, Y.B.; Ma, H.Y.; Li, X.L.; Liang, S.L.; Tian, L.Y.; Zhang, X.D.; Fan, J.L.; Wu, W.B. Assimilating a synthetic Kalman filter leaf area index series into the WOFOST model to improve regional winter wheat yield estimation. Agric. For. Meteorol. 2016, 216, 188–202. [Google Scholar] [CrossRef]
- Quan, X.; He, B.; Yebra, M.; Yin, C.; Liao, Z.; Li, X. Retrieval of forest fuel moisture content using a coupled radiative transfer model. J. Environ. Modell. Softw. 2017, 95, 290–302. [Google Scholar] [CrossRef]
- Yebra, M.; Chuvieco, E.; Riaño, D. Estimation of live fuel moisture content from MODIS images for fire risk assessment. Agr. For. Meteorol. 2008, 148, 523–536. [Google Scholar] [CrossRef]
- Friedl, M.A.; Sulla-Menashe, D.; Tan, B.; Schneider, A.; Ramankutty, N.; Sibley, A.; Huang, X. MODIS collection 5 global land cover: Algorithm refinements and characterization of new datasets. Remote Sens. Environ. 2010, 114, 168–182. [Google Scholar] [CrossRef]
- Peel, M.C.; Finlayson, B.L.; McMahon, T.A. Updated world map of the Koppen-Geiger climate classification. Hydrol. Earth Syst. Sci. 2007, 11, 1633–1644. [Google Scholar] [CrossRef]
- Giglio, L.; Schroeder, W.; Justice, C.O. The collection 6 MODIS active fire detection algorithm and fire products. Remote Sens. Environ. 2016, 178, 31–41. [Google Scholar] [CrossRef] [Green Version]
- Arganaraz, J.P.; Landi, M.A.; Scavuzzo, C.M.; Bellis, L.M. Determining fuel moisture thresholds to assess wildfire hazard: A contribution to an operational early warning system. PLoS ONE 2018, 13, e0204889. [Google Scholar] [CrossRef]
- Quan, X.; He, B.; Li, X. A bayesian network-based method to alleviate the ill-posed inverse problem: A case study on leaf area index and canopy water content retrieval. IEEE Trans. Geosci. Remote Sens. 2015, 53, 6507–6517. [Google Scholar] [CrossRef]
- Yebra, M.; Quan, X.; Riaño, D.; Larraondo, P.R.; Dijk, A.I.J.M.V.; Cary, G.J. A fuel moisture content and flammability monitoring methodology for continental Australia based on optical remote sensing. Remote Sens. Environ. 2018, 212, 260–272. [Google Scholar] [CrossRef]
- Strahler, A.H. MODIS BRDF/Albedo Product: Algorithm Theoretical Basis Document Version 5.0. 1999. Available online: https://www.semanticscholar.org/paper/MODIS-BRDF-%2F-Albedo-Product-%3A-Algorithm-Theoretical-Strahler-Lucht/1adc54eac2199b93536c5988bb2bd1952127d74f (accessed on 9 September 2019).
- Yebra, M.; Dijk, A.V.; Leuning, R.; Huete, A.; Guerschman, J.P. Evaluation of optical remote sensing to estimate actual evapotranspiration and canopy conductance. Remote Sens. Environ. 2013, 129, 250–261. [Google Scholar] [CrossRef]
- Jurdao, S.; Yebra, M.; Guerschman, J.P.; Chuvieco, E. Regional estimation of woodland moisture content by inverting radiative transfer models. Remote Sens. Environ. 2013, 132, 59–70. [Google Scholar] [CrossRef]
- Padilla, M.; Stehman, S.V.; Ramo, R.; Corti, D.; Hantson, S.; Oliva, P.; Alonso-Canas, I.; Bradley, A.V.; Tansey, K.; Mota, B.J.R.S.O.E. Comparing the accuracies of remote sensing global burned area products using stratified random sampling and estimation. Remote Sens. Environ. 2015, 160, 114–121. [Google Scholar] [CrossRef] [Green Version]
- Feret, J.B.; Francois, C.; Asner, G.P.; Gitelson, A.A.; Martin, R.E.; Bidel, L.P.R.; Ustin, S.L.; le Maire, G.; Jacquemoud, S. PROSPECT-4 and 5: Advances in the leaf optical properties model separating photosynthetic pigments. Remote Sens. Environ. 2008, 112, 3030–3043. [Google Scholar] [CrossRef]
- Verhoef, W. Light scattering by leaf layers with application to canopy reflectance modeling: The SAIL model. Remote Sens. Environ. 1984, 16, 125–141. [Google Scholar] [CrossRef] [Green Version]
- Kuusk, A. The Hot Spot Effect in Plant Canopy Reflectance; Springer: Berlin/Heidelberg, Germany, 1991; pp. 139–159. [Google Scholar]
- Huemmrich, K.F. The GeoSail model: A simple addition to the SAIL model to describe discontinuous canopy reflectance. Remote Sens. Environ. 2001, 75, 423–431. [Google Scholar] [CrossRef]
- Adab, H.; Devi Kanniah, K.; Beringer, J. Estimating and up-scaling fuel moisture and leaf dry matter content of a temperate humid forest using multi resolution remote sensing data. Remote Sens. 2016, 8, 961. [Google Scholar] [CrossRef]
- Yebra, M.; Scortechini, G.; Badi, A.; Beget, M.E.; Boer, M.M.; Bradstock, R.; Chuvieco, E.; Danson, F.M.; Dennison, P.; Resco de Dios, V.; et al. Globe-LFMC, a global plant water status database for vegetation ecophysiology and wildfire applications. Sci. Data 2019, 6, 155. [Google Scholar] [CrossRef]
- Gorelick, N.; Hancher, M.; Dixon, M.; Ilyushchenko, S.; Thau, D.; Moore, R. Google Earth engine: Planetary-scale geospatial analysis for everyone. Remote Sens. Environ. 2017, 202. [Google Scholar] [CrossRef]
- Hahsler, M. Density Based Clustering of Applications with Noise (DBSCAN) and Related Algorithms [R Package Dbscan Version 0.9-7]; 2016. Available online: https://rdrr.io/cran/dbscan/ (accessed on 9 September 2019).
- Pimont, F.; Ruffault, J.; Martin-Stpaul, N.K.; Dupuy, J.L. A cautionary note regarding the use of cumulative burnt areas for the determination of fire danger index breakpoints. Int. J. Wildland Fire 2019. [Google Scholar] [CrossRef]
- Shi, Q.; He, B.; Zhe, Z.; Liao, Z.; Quan, X. Improving Fmask cloud and cloud shadow detection in mountainous area for Landsats 4–8 images. Remote Sens. Environ. 2017, 199, 107–119. [Google Scholar]
- Zhu, Z.; Woodcock, C.E. Object-based cloud and cloud shadow detection in Landsat imagery. Remote Sens. Environ. 2012, 118, 83–94. [Google Scholar] [CrossRef]
- Roteta, E.; Bastarrika, A.; Padilla, M.; Storm, T.; Chuvieco, E. Development of a sentinel-2 burned area algorithm: Generation of a small fire database for sub-Saharan Africa. Remote Sens. Environ. 2019, 222, 1–17. [Google Scholar] [CrossRef]
- Asner, G.P. Cloud cover in landsat observations of the Brazilian Amazon. Int. J. Remote Sens. 2001, 22, 3855–3862. [Google Scholar] [CrossRef]
- Tsang, L.; Kong, J.A.; Shin, R.T. Theory of Microwave Remote Sensing; Wiley: New York, NY, USA, 1985. [Google Scholar]
- Fan, L.; Wigneron, J.-P.; Xiao, Q.; Al-Yaari, A.; Wen, J.; Martin-StPaul, N.; Dupuy, J.-L.; Pimont, F.; Al Bitar, A.; Fernandez-Moran, R. evaluation of microwave remote sensing for monitoring live fuel moisture content in the Mediterranean region. Remote Sens. Environ. 2018, 205, 210–223. [Google Scholar] [CrossRef]
- Tanase, M.; Panciera, R.; Lowell, K.; Aponte, C. Monitoring live fuel moisture in semiarid environments using L-band radar data. Int. J. Wildland Fire 2015, 24, 560–572. [Google Scholar] [CrossRef]
- Wang, L.; Quan, X.; He, B.; Yebra, M.; Xing, M.; Liu, X. Assessment of the dual polarimetric sentinel-1A data for forest fuel moisture content estimation. Remote Sens. 2019, 11, 1568. [Google Scholar] [CrossRef]
- Jia, S.; Kim, S.H.; Nghiem, S.V.; Kafatos, M. Estimating live fuel moisture using SMAP L-band radiometer soil moisture for Southern California, USA. Remote Sens. 2019, 11, 1575. [Google Scholar] [CrossRef]
Figure 1.
(a) Study area showing the historical (2007–2016) burned areas extracted from MCD64A1 Burned Area product and the DEM (Digital Elevation Model) as the background image. (b) Dominated vegetation types and Koppen climate classification. The location and burned pixels of (c) the Qiubei forest fire event on the 1st February 2010, and (d) Lantern Mountain grassland fire event on the 13th February 2016. Cwa: Subtropical Highland Zone; Cwb: Humid Subtropical Zone.

Figure 2.
Burned area per month from 2007 to 2016 extracted from MCD64A1 product over southwest China.
Figure 2.
Burned area per month from 2007 to 2016 extracted from MCD64A1 product over southwest China.

Figure 3.
A case showing the spatial location of field plot, Landsat 8 OLI pixel and MODIS pixel. The black boxes indicate the 3 × 3 MODIS grid (1.5 km × 1.5 km). (a) homogeneous and (c) heterogeneous LFMC measurement plots of vegetation at MODIS spatial resolution and (b) an example of a MODIS pixel containing multiple LFMC measurement plots, and 152 field data were finally obtained after calculating the average value of the field LFMC measurements in such a case.

Figure 4.
Three-dimensional maps showing R2 (a) and RMSE (b) between LFMC observations and estimations with the variation of the threshold values of CVNDVI and SDNDVI used to filter out sites that are heterogeneous within the MODIS footprint.
Figure 4.
Three-dimensional maps showing R2 (a) and RMSE (b) between LFMC observations and estimations with the variation of the threshold values of CVNDVI and SDNDVI used to filter out sites that are heterogeneous within the MODIS footprint.

Figure 5.
Multi-temporal mapping of monthly LFMC over southwest China throughout the 2009/2010 fire season.
Figure 5.
Multi-temporal mapping of monthly LFMC over southwest China throughout the 2009/2010 fire season.

Figure 6.
Relationship between pre-fire LFMC and cumulative burned area for forest (a) and grassland (b) across the Cwa climate zone, and forest (c) and grassland (d) across Cwb.
Figure 6.
Relationship between pre-fire LFMC and cumulative burned area for forest (a) and grassland (b) across the Cwa climate zone, and forest (c) and grassland (d) across Cwb.

Figure 7.
Temporal LFMC dynamics before and after the Qiubei (a) and the Lantern Mountain (b) fire events across the Cwa zone. The dotted lines represent the critical LFMC thresholds. The pie chart shows the percentage of the total burned area per land cover.
Figure 7.
Temporal LFMC dynamics before and after the Qiubei (a) and the Lantern Mountain (b) fire events across the Cwa zone. The dotted lines represent the critical LFMC thresholds. The pie chart shows the percentage of the total burned area per land cover.

Figure 8.
Dynamics of LFMC and burned area over forest (a) and grassland (b) in southwest China. Each boxplot indicates the distribution of median LFMC values of the forest or grassland on the same DOY over ten years (2007 to 2016). Red lines indicate the LFMC dynamics during the fire seasons when the studied fires broke down (a) 2015/2016 and (b) 2009/2010. Dotted lines denote the critical LFMC thresholds. The bar chart indicates the re-calculated 8-day burned area for (a) 2015/2016 and (b) 2009/2010.


Table 1.
Re-classified fuel classes based on the IGBP classification scheme and its corresponding coverage area and cumulative burned area.
Table 1.
Re-classified fuel classes based on the IGBP classification scheme and its corresponding coverage area and cumulative burned area.
| Fuel Class | IGBP | Coverage Area (km2) | Cumulative Burned Area (km2) |
|---|---|---|---|
| Forest | Evergreen Needleleaf Forests | 28.9 | * |
| Evergreen Broadleaf Forests | 4263.6 | 117.7 | |
| Deciduous Needleleaf Forests | 1.7 | * | |
| Deciduous Broadleaf Forests | 10.7 | * | |
| Mixed Forests | 26,680 | 1880.2 | |
| Grassland | Woody Savannas, | 22,384 | 2079.2 |
| Savannas | 30 | * | |
| Grasslands | 5784.7 | 417.8 | |
| Permanent Wetlands | 108.9 | * | |
| Croplands | 9794.9 | 429 | |
| Cropland/Natural Vegetation Mosaics | 5687.9 | 281.5 | |
| Shrubland | Closed Shrublands | 139.6 | * |
| Open Shrublands | 206.4 | * |
The coverage area was calculated based on IGBP in 2013. The cumulative burned area was calculated from 2007 to 2016 based on IGBP in 2013. * denotes the cumulative burned area of this vegetation type from 2007 to 2016 is less than 5 km2.
Table 2.
Value and range of critical LFMC thresholds, and proportion of burned area and the number of large fires below the corresponding threshold for forest and grassland across Cwa and Cwb zones.
Table 2.
Value and range of critical LFMC thresholds, and proportion of burned area and the number of large fires below the corresponding threshold for forest and grassland across Cwa and Cwb zones.
| Fuel Class | Climate Zone | Threshold (%) | 95% CI (%) | Burned Area Proportion (%) | Large Fire Number |
|---|---|---|---|---|---|
| Forest | Cwa | 151.3 | 146.8–155.9 | 93.1 | 10/10 |
| 123.1 | 121.8–124.3 | 86.5 | 9/10 | ||
| 51.4 | 51.2–51.7 | 34.2 | 5/10 | ||
| Cwb | 115.0 | 113.6–116.3 | 92.2 | 2/2 | |
| 54.4 | 53.6–55.2 | 34.1 | 0/2 | ||
| Grassland | Cwa | 138.1 | 134.1–142.0 | 81.6 | 17/21 |
| 72.8 | 70.8–74.8 | 67.5 | 14/21 | ||
| 13.1 | 12.1–14.1 | 33.7 | 4/21 | ||
| Cwb | 137.5 | 129.4–145.6 | 94.4 | 2/2 | |
| 69.0 | 66.5–71.4 | 81.1 | 2/2 | ||
| 10.6 | 10.2–11.0 | 30.7 | 0/2 |
95% CI (%) represents the range of this threshold under the 95% confidence interval. Burned area proportion represents the ratio of the burned area below this threshold to the total burned area. Large fire number denotes the number of large fires (greater than 10 km2) below this threshold and the total number of large fires for forest or grassland across Cwa (Subtropical Highland Zone) or Cwb (Humid Subtropical Zone).
© 2019 by the authors. Licensee MDPI, Basel, Switzerland. This article is an open access article distributed under the terms and conditions of the Creative Commons Attribution (CC BY) license (http://creativecommons.org/licenses/by/4.0/).
Share and Cite
MDPI and ACS Style
Luo, K.; Quan, X.; He, B.; Yebra, M. Effects of Live Fuel Moisture Content on Wildfire Occurrence in Fire-Prone Regions over Southwest China. Forests 2019, 10, 887. https://0-doi-org.brum.beds.ac.uk/10.3390/f10100887
AMA Style
Luo K, Quan X, He B, Yebra M. Effects of Live Fuel Moisture Content on Wildfire Occurrence in Fire-Prone Regions over Southwest China. Forests. 2019; 10(10):887. https://0-doi-org.brum.beds.ac.uk/10.3390/f10100887
Chicago/Turabian StyleLuo, Kaiwei, Xingwen Quan, Binbin He, and Marta Yebra. 2019. "Effects of Live Fuel Moisture Content on Wildfire Occurrence in Fire-Prone Regions over Southwest China" Forests 10, no. 10: 887. https://0-doi-org.brum.beds.ac.uk/10.3390/f10100887
Note that from the first issue of 2016, this journal uses article numbers instead of page numbers. See further details here.