Changes in Functional Response of Soil Microbial Community along Chronosequence of Spontaneous Succession on Post Mining Forest Sites Evaluated by Biolog and SIR Methods


Abstract
:1. Introduction
2. Methods
2.1. Study Sites
2.2. Sampling
2.3. SIR Method
2.4. Biolog Method
2.5. Enumeration of Bacteria
2.6. Statistical Analysis
3. Results
4. Discussion
4.1. Soil Biological Properties
4.2. Changes in the Catabolic Activity during Spontaneous Succession
4.3. Driving Factors of Microbial Catabolic Profile along Chronosequence
5. Conclusions
Author Contributions
Funding
Acknowledgments
Conflicts of Interest
References
- Frouz, J.; Keplin, B.; Pižl, V.; Tajovský, K.; Starý, J.; Lukešová, A.; Novakova, A.; Balík, V.; Háněl, L.; Materna, J.; et al. Soil biota and upper soil layer development in two contrasting post-mining chronosequences. Ecol. Eng. 2001, 17, 275–284. [Google Scholar] [CrossRef]
- Bradshaw, A. Restoration of mined lands—Using natural processes. Ecol. Eng. 1997, 8, 255–269. [Google Scholar] [CrossRef]
- Frouz, J.; Nováková, A. Development of soil microbial properties in topsoil layer during spontaneous succession in heaps after brown coal mining in relation to humus microstructure development. Geoderma 2005, 129, 54–64. [Google Scholar] [CrossRef]
- Zak, D.R.; Holmes, W.E.; White, D.C.; Peacock, A.D.; Tilman, D. Plant diversity, soil microbial communities, and ecosystem function: Are there any links? Ecology 2003, 84, 2042–2050. [Google Scholar] [CrossRef]
- Torsvik, V.; Øvreås, L. Microbial diversity and function in soil: From genes to ecosystems. Curr. Opin. Microbiol. 2002, 5, 240–245. [Google Scholar] [CrossRef]
- Miltner, A.; Bombach, P.; Schmidt-Brücken, B.; Kästner, M. SOM genesis: Microbial biomass as a significant source. Biogeochemistry 2012, 111, 41–55. [Google Scholar] [CrossRef]
- van Hees, P.A.W.; Jones, D.L.; Finlay, R.; Godbold, D.L.; Lundstöm, U.S. The carbon we do not see—The impact of low molecular weight compounds on carbon dynamics and respiration in forest soils: A review. Soil Biol. Biochem. 2005, 37, 1–13. [Google Scholar] [CrossRef]
- Yoshitomi, K.J.; Shann, J.R. Corn (Zea mays L.) root exudates and their impact on 14C-pyrene mineralization. Soil Biol. Biochem. 2001, 33, 1769–1776. [Google Scholar] [CrossRef]
- Baldrian, P.; Trögl, J.; Frouz, J.; Šnajdr, J.; Valášková, V.; Merhautová, V.; Cajthaml, T.; Herinková, J. Enzyme activities and microbial biomass in topsoil layer during spontaneous succession in spoil heaps after brown coal mining. Soil Biol. Biochem. 2008, 40, 2107–2115. [Google Scholar] [CrossRef]
- Bao, X.; Yu, J.; Liang, W.; Lu, C.; Zhu, J.; Li, Q. The interactive effects of elevated ozone and wheat cultivars on soil microbial community composition and metabolic diversity. Appl. Soil Ecol. 2015, 87, 11–18. [Google Scholar] [CrossRef]
- Banning, N.C.; Lalor, B.M.; Cookson, W.R.; Grigg, A.H.; Murphy, D.V. Analysis of soil microbial community level physiological profiles in native and post-mining rehabilitation forest: Which substrates discriminate? Appl. Soil Ecol. 2012, 56, 27–34. [Google Scholar] [CrossRef]
- Degens, B.P.; Schipper, L.A.; Sparling, G.P.; Vojvodic-Vukovic, M. Decreases in organic C reserves in soils can reduce the catabolic diversity of soil microbial communities. Soil Biol. Biochem. 2000, 32, 189–196. [Google Scholar] [CrossRef]
- Graham, M.H.; Haynes, R.J. Catabolic diversity of soil microbial communities under sugarcane and other land uses estimated by Biolog and substrate-induced respiration methods. Appl. Soil Ecol. 2005, 29, 155–164. [Google Scholar] [CrossRef]
- Campbell, C.D.; Chapman, S.J.; Cameron, C.M.; Davidson, M.S.; Potts, J.M. A rapid microtiter plate method to measure carbon dioxide evolved from carbon substrate amendments so as to determine the physiological profiles of soil microbial communities by using whole soil. Appl. Environ. Microbiol. 2003, 69, 3593–3599. [Google Scholar] [CrossRef] [PubMed]
- Insam, H.; Domsch, K.H. Relationship between soil organic carbon and microbial biomass on chronosequences of reclamation sites. Microb. Ecol. 1988, 15, 177–188. [Google Scholar] [CrossRef] [PubMed]
- Insam, H.; Haselwandter, K. Metabolic quotient of the soil microflora in relation to plant succession. Oecologia 1989, 79, 174–178. [Google Scholar] [CrossRef] [PubMed]
- Bardgett, R.D.; Walker, L.R. Impact of coloniser plant species on the development of decomposer microbial communities following deglaciation. Soil Biol. Biochem. 2004, 36, 555–559. [Google Scholar] [CrossRef]
- Tscherko, D.; Hammesfahr, U.; Zeltner, G.; Kandeler, E.; Böcker, R. Plant succession and rhizosphere microbial communities in a recently deglaciated alpine terrain. Basic Appl. Ecol. 2005, 6, 367–383. [Google Scholar] [CrossRef]
- Frouz, J.; Prach, K.; Pižl, V.; Háněl, L.; Starý, J.; Tajovský, K.; Materna, J.; Balík, V.; Kalčík, J.; Řehounková, K. Interactions between soil development, vegetation and soil fauna during spontaneous succession in post mining sites. Eur. J. Soil Biol. 2008, 44, 109–121. [Google Scholar] [CrossRef]
- Abakumov, E.V.; Cajthaml, T.; Brus, J.; Frouz, J. Humus accumulation, humification, and humic acid composition in soils of two post-mining chronosequences after coal mining. J. Soils Sediments 2013, 13, 491–500. [Google Scholar] [CrossRef]
- Frouz, J.; Pižl, V.; Tajovský, K. The effect of earthworms and other saprophagous macrofauna on soil microstructure in reclaimed and un-reclaimed post-mining sites in Central Europe. Eur. J. Soil Biol. 2007, 43, S184–S189. [Google Scholar] [CrossRef]
- Harris, J.A. Measurements of the soil microbial community for estimating the success of restoration. Eur. J. Soil Sci. 2003, 54, 801–808. [Google Scholar] [CrossRef]
- Lin, Q.; Brookes, P.C. An evaluation of the substrate-induced respiration method. Soil Biol. Biochem. 1999, 31, 1969–1983. [Google Scholar] [CrossRef]
- Anderson, T.H.; Domsch, K.H. Application of ecophysiological quotients (qCO2 and qD) on microbial biomasses from soils of different cropping histories. Soil Biol. Biochem. 1990, 22, 251–255. [Google Scholar] [CrossRef]
- Degens, B.P.; Harris, J.A. Development of a physiological approach to measuring the catabolic diversity of soil microbial communities. Soil Biol. Biochem. 1997, 29, 1309–1320. [Google Scholar] [CrossRef]
- Insam, H.; Ranger, A. Microbial Communities: Functional Versus Structural Approaches; Springer: Berlin, Germany, 1997. [Google Scholar]
- Garland, J.L.; Mills, A.L. Classification and characterization of heterotrophic microbial communities on the basis of patterns of community-level sole-carbon-source utilization. Appl. Environ. Microbiol. 1991, 57, 2351–2359. [Google Scholar] [PubMed]
- Bloem, J. Fluorescent staining of microbes for total direct counts. In Molecular Microbial Ecology Manual; Akkermans, A.D.L., van Elsas, J.D., de Bruijn, F.J., Eds.; Kluwer Academic Publishers: Dordrecht, The Netherlands, 1995; pp. 1–12. [Google Scholar]
- Lepš, J.; Šmilauer, P. Multivariate Analysis of Ecological Data Using CANOCO; Cambridge University Press: Cambridge, UK, 2003. [Google Scholar]
- Helingerová, M.; Frouz, J.; Šantrůčková, H. Microbial activity in reclaimed and unreclaimed post-mining sites near Sokolov (Czech Republic). Ecol. Eng. 2010, 36, 768–776. [Google Scholar] [CrossRef]
- Krištůfek, V.; Elhottová, D.; Chroňáková, A.; Dostálková, I.; Picek, T.; Kalčík, J. Growth strategy of heterotrophic bacterial population along successional sequence on spoil of brown coal colliery substrate. Folia Microbiol. 2005, 50, 427–435. [Google Scholar] [CrossRef] [PubMed]
- Sigler, W.V.; Crivii, S.; Zeyer, J. Bacterial succession in glacial forefield soils characterized by community structure, activity and opportunistic growth dynamics. Microb. Ecol. 2002, 44, 306–316. [Google Scholar] [CrossRef] [PubMed]
- Kříbek, B.; Strnad, M.; Boháček, Z.; Sýkorová, I.; Čejka, J.; Sobalík, Z. Geochemistry of Miocene lacustrine sediments from the Sokolov Coal Basin (Czech Republic). Int. J. Coal Geol. 1998, 37, 207–233. [Google Scholar] [CrossRef]
- Kuzyakov, Y.; Friedel, J.K.; Stahr, K. Review of mechanisms and quantification of priming effects. Soil Biol. Biochem. 2000, 32, 1485–1498. [Google Scholar] [CrossRef]
- Chodak, M.; Pietrzykowski, M.; Niklińska, M. Development of microbial properties in a chronosequence of sandy mine soils. Appl. Soil Ecol. 2009, 41, 259–268. [Google Scholar] [CrossRef]
- Frouz, J.; Thébault, E.; Pižl, V.; Adl, S.; Cajthaml, T.; Baldrián, P.; Háněl, L.; Starý, J.; Tajovský, K.; Materna, J.; et al. Soil Food Web Changes during Spontaneous Succession at Post Mining Sites: A Possible Ecosystem Engineering Effect on Food Web Organization? PLoS ONE 2013, 8, e79694. [Google Scholar] [CrossRef] [PubMed] [Green Version]


| Environmental Parameters | Min | Max |
|---|---|---|
| Site age (year) | 3 | 45 |
| pH (H2O) | 5.95 | 8.75 |
| C ox (%) | 3.38 | 15.23 |
| EC (µ S cm−1) | 257 | 1017 |
| litter mass (g m−2) | 0 | 1080 |
| root mass (g m−2) | 0 | 1187 |
| Tween 80 | 4-Hydroxy Benzoic Acid | D-Mannitol | D-Galacturonic Acid | L-Asparagine | α-Cyclodextrin | N-Acetyl-D-Glucosamine | Phenylethylamine | |
|---|---|---|---|---|---|---|---|---|
| r | 0.48 | −0.15 | 0.15 | 0.15 | 0.10 | 0.47 | 0.72 ** | −0.13 |
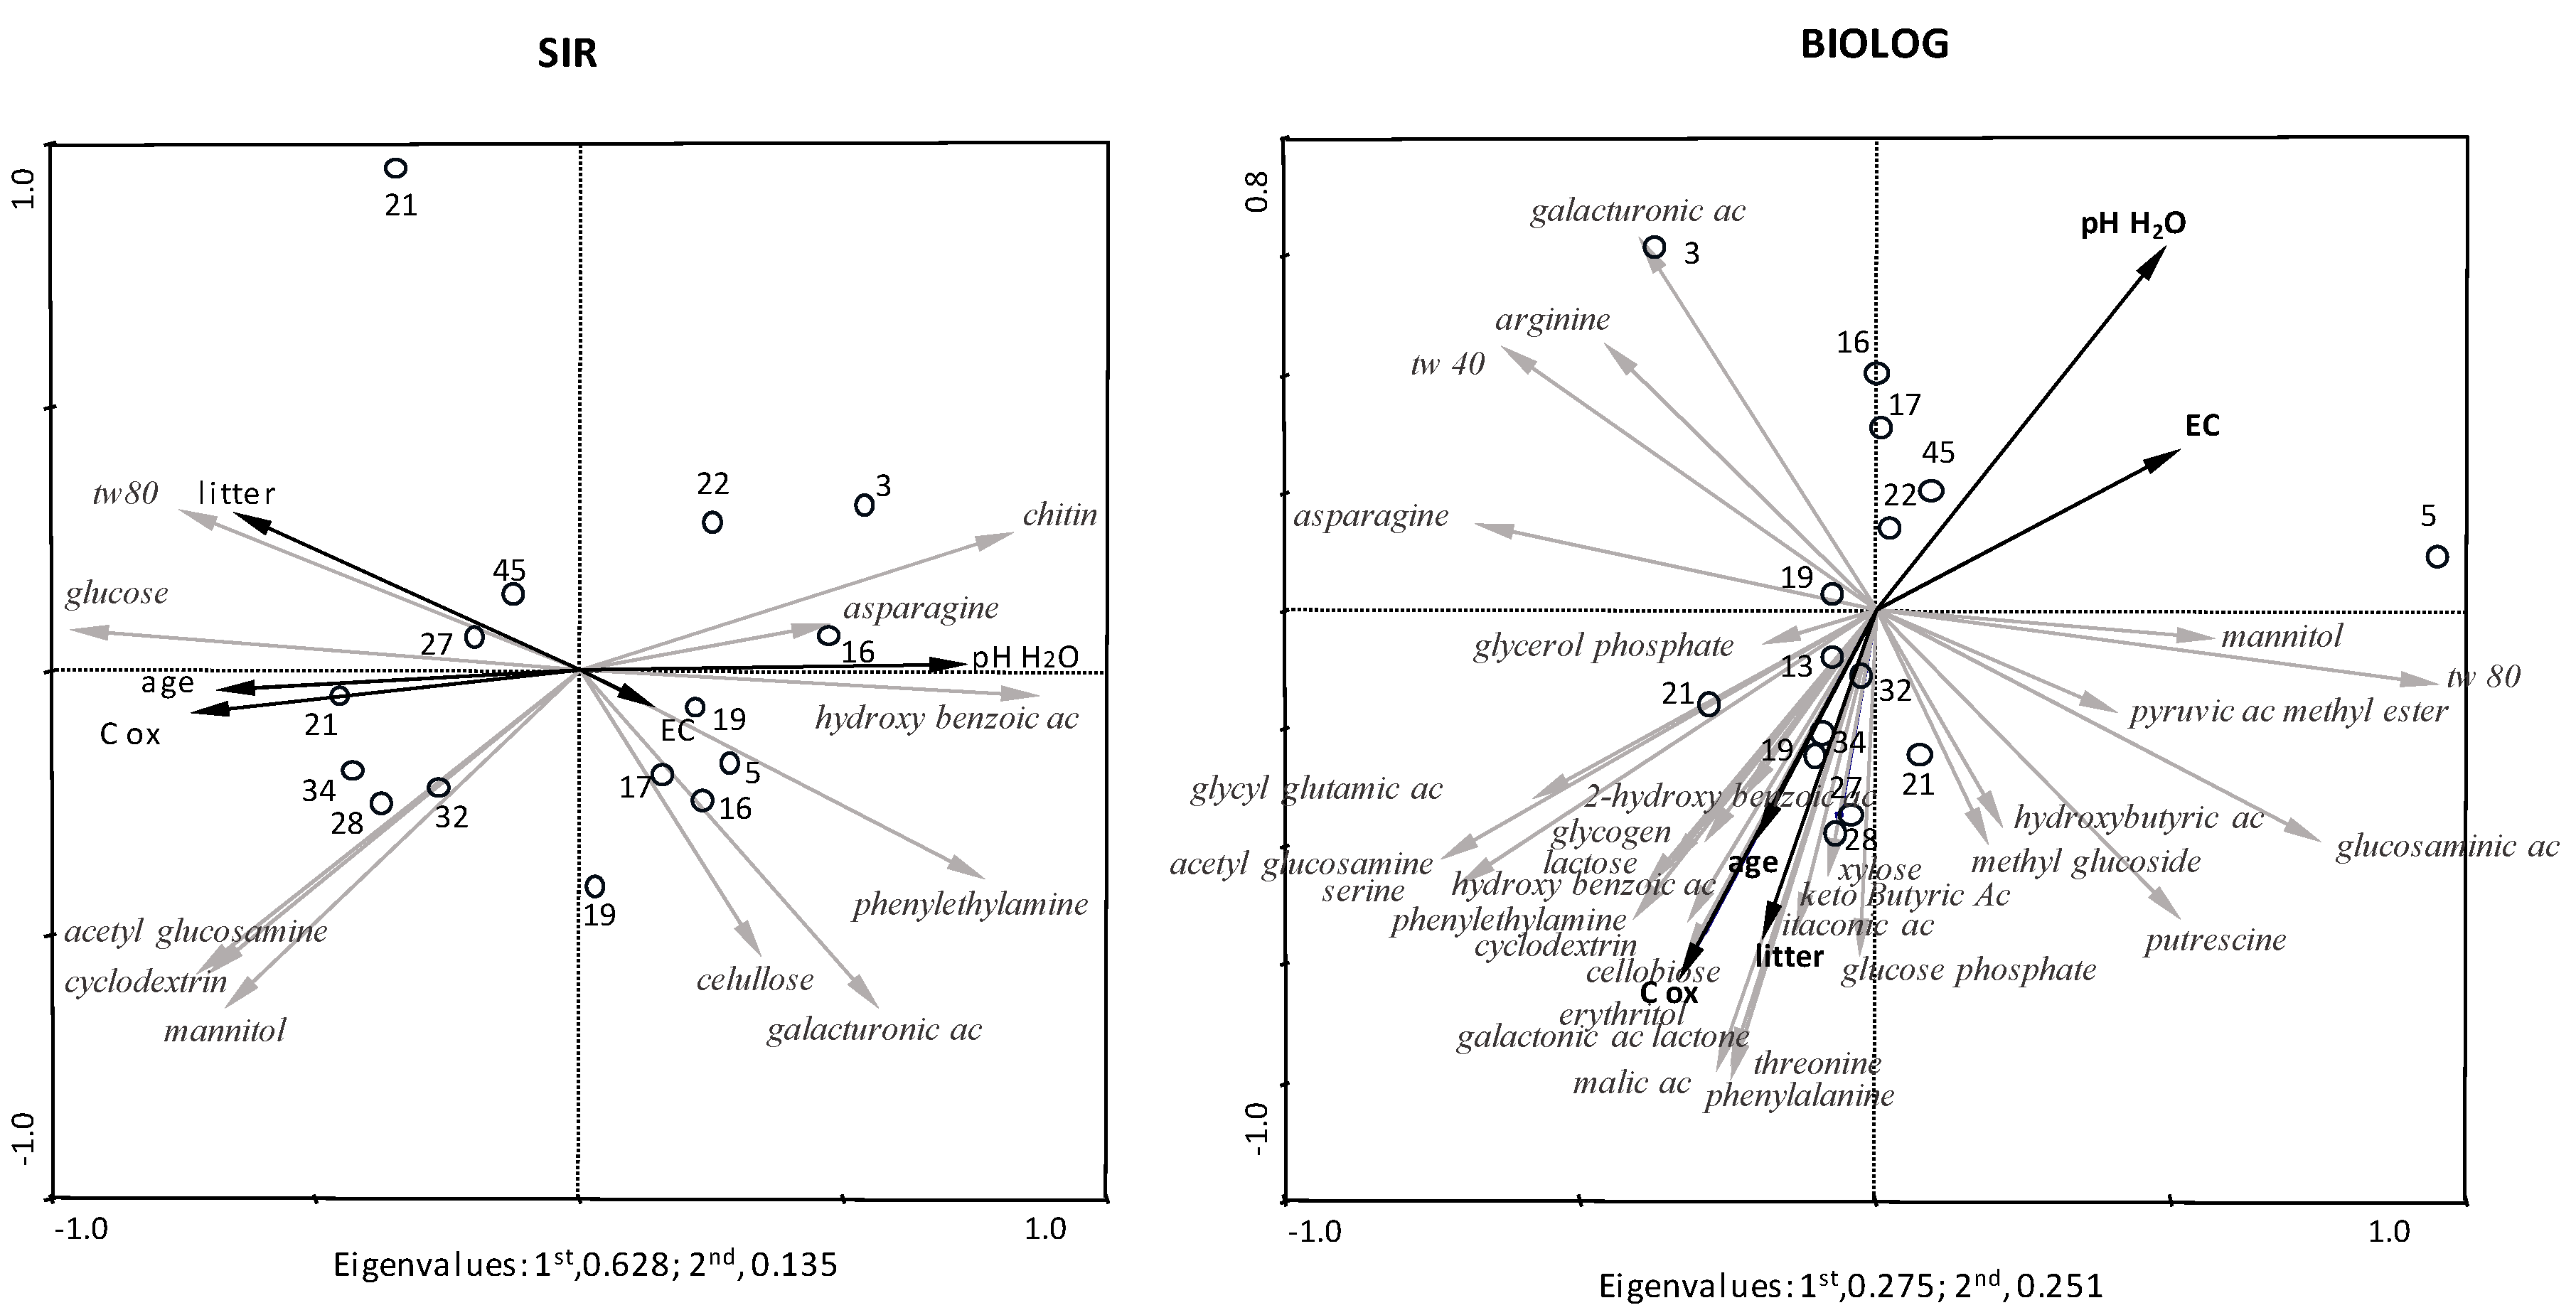
| SIR | 1st Axis | 2nd Axis | BIOLOG | ||
|---|---|---|---|---|---|
| Environmental Properties | 1st Axis | 2nd Axis | |||
| age | −0.69 | −0.04 | age | −0.20 | −0.39 |
| pH (H2O) | 0.73 | 0.01 | pH (H2O) | 0.49 | 0.62 |
| C ox | −0.74 | −0.08 | C ox | −0.33 | −0.63 |
| EC | 0.14 | −0.06 | EC | 0.52 | 0.27 |
| litter | −0.65 | 0.30 | litter | −0.19 | −0.56 |
| root | −0.60 | 0.16 | root | −0.25 | −0.64 |
© 2019 by the authors. Licensee MDPI, Basel, Switzerland. This article is an open access article distributed under the terms and conditions of the Creative Commons Attribution (CC BY) license (http://creativecommons.org/licenses/by/4.0/).
Share and Cite
Kaneda, S.; Krištůfek, V.; Baldrian, P.; Malý, S.; Frouz, J. Changes in Functional Response of Soil Microbial Community along Chronosequence of Spontaneous Succession on Post Mining Forest Sites Evaluated by Biolog and SIR Methods. Forests 2019, 10, 1005. https://0-doi-org.brum.beds.ac.uk/10.3390/f10111005
Kaneda S, Krištůfek V, Baldrian P, Malý S, Frouz J. Changes in Functional Response of Soil Microbial Community along Chronosequence of Spontaneous Succession on Post Mining Forest Sites Evaluated by Biolog and SIR Methods. Forests. 2019; 10(11):1005. https://0-doi-org.brum.beds.ac.uk/10.3390/f10111005
Chicago/Turabian StyleKaneda, Satoshi, Václav Krištůfek, Petr Baldrian, Stanislav Malý, and Jan Frouz. 2019. "Changes in Functional Response of Soil Microbial Community along Chronosequence of Spontaneous Succession on Post Mining Forest Sites Evaluated by Biolog and SIR Methods" Forests 10, no. 11: 1005. https://0-doi-org.brum.beds.ac.uk/10.3390/f10111005