Event-Based Integrated Assessment of Environmental Variables and Wildfire Severity through Sentinel-2 Data


Forestry Engineering School, University of Vigo—A Xunqueira Campus, 36005 Pontevedra, Spain
*
Author to whom correspondence should be addressed.
Forests 2019, 10(11), 1021; https://0-doi-org.brum.beds.ac.uk/10.3390/f10111021
Submission received: 25 September 2019
/
Revised: 12 November 2019
/
Accepted: 12 November 2019
/
Published: 14 November 2019
(This article belongs to the Section Forest Inventory, Modeling and Remote Sensing)
Abstract
:To optimize suppression, restoration, and prevention plans against wildfire, postfire assessment is a key input. Since little research has been carried out on applying Sentinel-2 imagery through an integrated approach to evaluate how environmental parameters affect fire severity, this work aims to fill this gap. A set of large forest fires that occurred in northwest Spain during extreme weather conditions were adopted as a case study. Sentinel-2 information was used to build the fire severity map and to evaluate the relation between it and a set of its driving factors: land cover, aspect, slope, proximity to the nearest stream, and fire recurrence. The cover types most affected by fire were scrubland, rocky areas, and Eucalyptus. The presence of streams was identified as a major cause of the reduced severity of fires in broadleaves. The occurrence of fires in the past is linked to the severity of fires, depending on the land cover. This research aims to help fire researchers, authority managers, and policy makers distinguish the conditions under which the damage by fire is minimized and optimize the resources allocated to restoration and future fire suppression.
1. Introduction
Wildfires can have beneficial effects on societies and ecosystems [1,2]. Conversely, wildland fires can turn into extreme wildfire events, which cause a measurable impact on the socio-economic scenario in terms of very large economic losses [3,4], can affect human health and mortality, and can contaminate water supplies [5]. Wildfires can also turn into wildfire disasters, which mainly occur when they provoke fatalities and affect human systems. Wildfire disasters may also have a measurable impact on ecology [6,7,8], due to their impact on biodiversity and soil degradation [9], significant influence on atmospheric chemistry and composition, gas and aerosol emissions [10], and contribute to altering the Earth’s climate and radiation budget [11].
Although some recent studies suggest that there is a slightly declining trend in the number of fires around the world [12,13], some other analyses point to a coupling between global warming and wildfire probability [14,15]. In 2017 and 2018, a large number of extreme fire events occurred in many parts of the world, including the US, Canada, Chile, the Mediterranean, Russia, and even Greenland [16]. In the particular case of Spain, the 2017 warm season was more severe than usual; that year, Spain was the second most affected country in the European Union in terms of both burned area and number of fires, just behind Portugal [17]. The large forest fires (LFFs) that occurred in Galicia (Spain) and Portugal were analyzed in Molina-Terrén et al. [18].
Forest fires are a substantial concern for public authorities in the European Union. In Mediterranean Europe, 2.6% of the wildfire events for the period 1980 to 2006 involved approximately 75% to 80% of the total burned area [19,20]. Although they are a global phenomenon, there is no universal definition for a large forest fire (LFF) [21]; however, in the European Union, LFFs are considered to be those that burn an area larger than 500 ha [22,23].
Once an LFF has occurred, a strategy for restoration or land recovery must be studied: on-site treatments [24] and restoration activities are evaluated [25,26], the evolution of the burned wildland is monitored [27,28], and the likely future downstream impacts due to flooding, landslides, and soil erosion are estimated [29]. To perform this decision-making process in postfire management, the characterization of the burned areas becomes a key input. This information is obtained by assessing fire severity, which is considered the magnitude of ecological change caused by fire [24] in both vegetation and soil [30]. Wildfire risk reduction also benefits from this line of research, especially in the case of LFFs under extreme weather conditions [31]. The characterization of unburned patches in LFF is also an active area of research since they play an important role in ecosystem dynamics and wildfire risk [32,33].
Burn scar mapping and characterization are fundamental inputs for an aerosol emissions estimation, carbon cycle modeling, hazard assessment, resource management, and policy creation [34]. A few years ago, wildfires had to be characterized through fieldwork, while the original situation was recorded on gross forestry maps. Apart from the very low reliability of these information sources, they were barely comparable due to their different natures. Nowadays, remote sensing has been consolidated as the main technique for assessing fire severity. Satellite sensors allow the measurement of the impact of fires by comparing pre- and postfire information. Remote sensing products are inexpensive, do not entail safety hazards, and provide rapid information for large areas [35]. For example, Abatzoglou et al. [36] applied the Moderate Resolution Imaging Spectroradiometer (MODIS) sensor to assess at a global scale the relation between fire activity, climate variability, and anthropogenic influence. Satellite models can also be transferred to platforms such as the Google Earth Engine, enabling a ready-to-use remote sensing product for the public [37].
Landsat has been the most explored program for decades. The operational land imager (OLI) aboard Landsat-8 generates high quality multispectral images at 30 m resolution with a revisiting time of 16 days [38,39]. The Sentinel-2 satellite missions of ESA’s Copernicus program, specifically designed for vegetation sensing, were launched in 2015 and 2017. They have led to significant increases in the available Earth surface acquisition data, both in spatial (10 m to 30 m) and temporal (five-day revisit) domains [40]. However, the application of Sentinel-2 imagery in fire severity assessment is still underdeveloped [41,42,43]. In fact, to date, six documents were published in Scopus under the search Title-Abs-Key (“sentinel-2” AND (“fire severity” OR “fire assessment”)).
Optical sensors allow the evaluation of fire severity through several indices that consist of numeric combinations of reflectance values from different spectral bands. The normalized difference vegetation index (NDVI) [44] and (differenced) Normalized Burn Ratio (NBR) [45] are the most commonly used indices [24].
Beyond the assessment of the fire impact on a location, a deeper understanding of the relations between the biophysical variables involved in the wildfire would facilitate postfire management. The fundamental biophysical variables that affect the spread and the fire intensity are meteorology (wind and air moisture), topography (elevation, slope, and aspect), and fuel (type of vegetation and moisture of vegetation) [46]. The correlation between some of these physical variables and the fire severity was described by Pereira et al. [47] and Mitsopoulos et al. [48].
Moreover, while there is a large body of scientific literature in the analysis and development of spectral indices derived from satellite data [49], there is little research on the relationship between fire severity and biophysical variables through satellite remote sensing. Amos et al. [50] demonstrated the suitability of Sentinel-2 imagery to separate burning severity levels. Further, they performed a short investigation into the association of six environmental variables—elevation, slope, aspect, fraction vegetation cover, terrain roughness index, and land cover—and fire severity, but no significant correlations were found. Soil erosion prediction is a physical parameter that can be mapped in conjunction with fire severity by using Sentinel-2 data [51,52].
Due to its relatively recent release, the potential of Sentinel-2 for wildland assessment needs to be further verified [40]. This paper presents a case study of burned area mapping and fire severity assessment by Sentinel image analysis. Fire severity was compared between the following variables: land cover, aspect, slope, proximity to the nearest stream, and fire recurrence. Indeed, no papers were found in Scopus under the search Title-Abs-Key (sentinel-2 AND fire AND (“land cover” OR “land use”) AND (moisture OR recurrence)). The fires that integrate this case study occurred under similar meteorological conditions. This represented an opportunity to analyze other key environmental variables that have been less studied to date.
2. Materials and Methods
2.1. Study Area and Datasets
The studied region is Pontevedra, the southwestern province of Galicia, on the Atlantic coast of Spain. Although Galicia represents only 6% of the national surface area, between 2006 and 2015, it registered an approximate average of 29.2% of Spanish LFFs and 19.4% of the total burned forest area by LFFs [53,54].
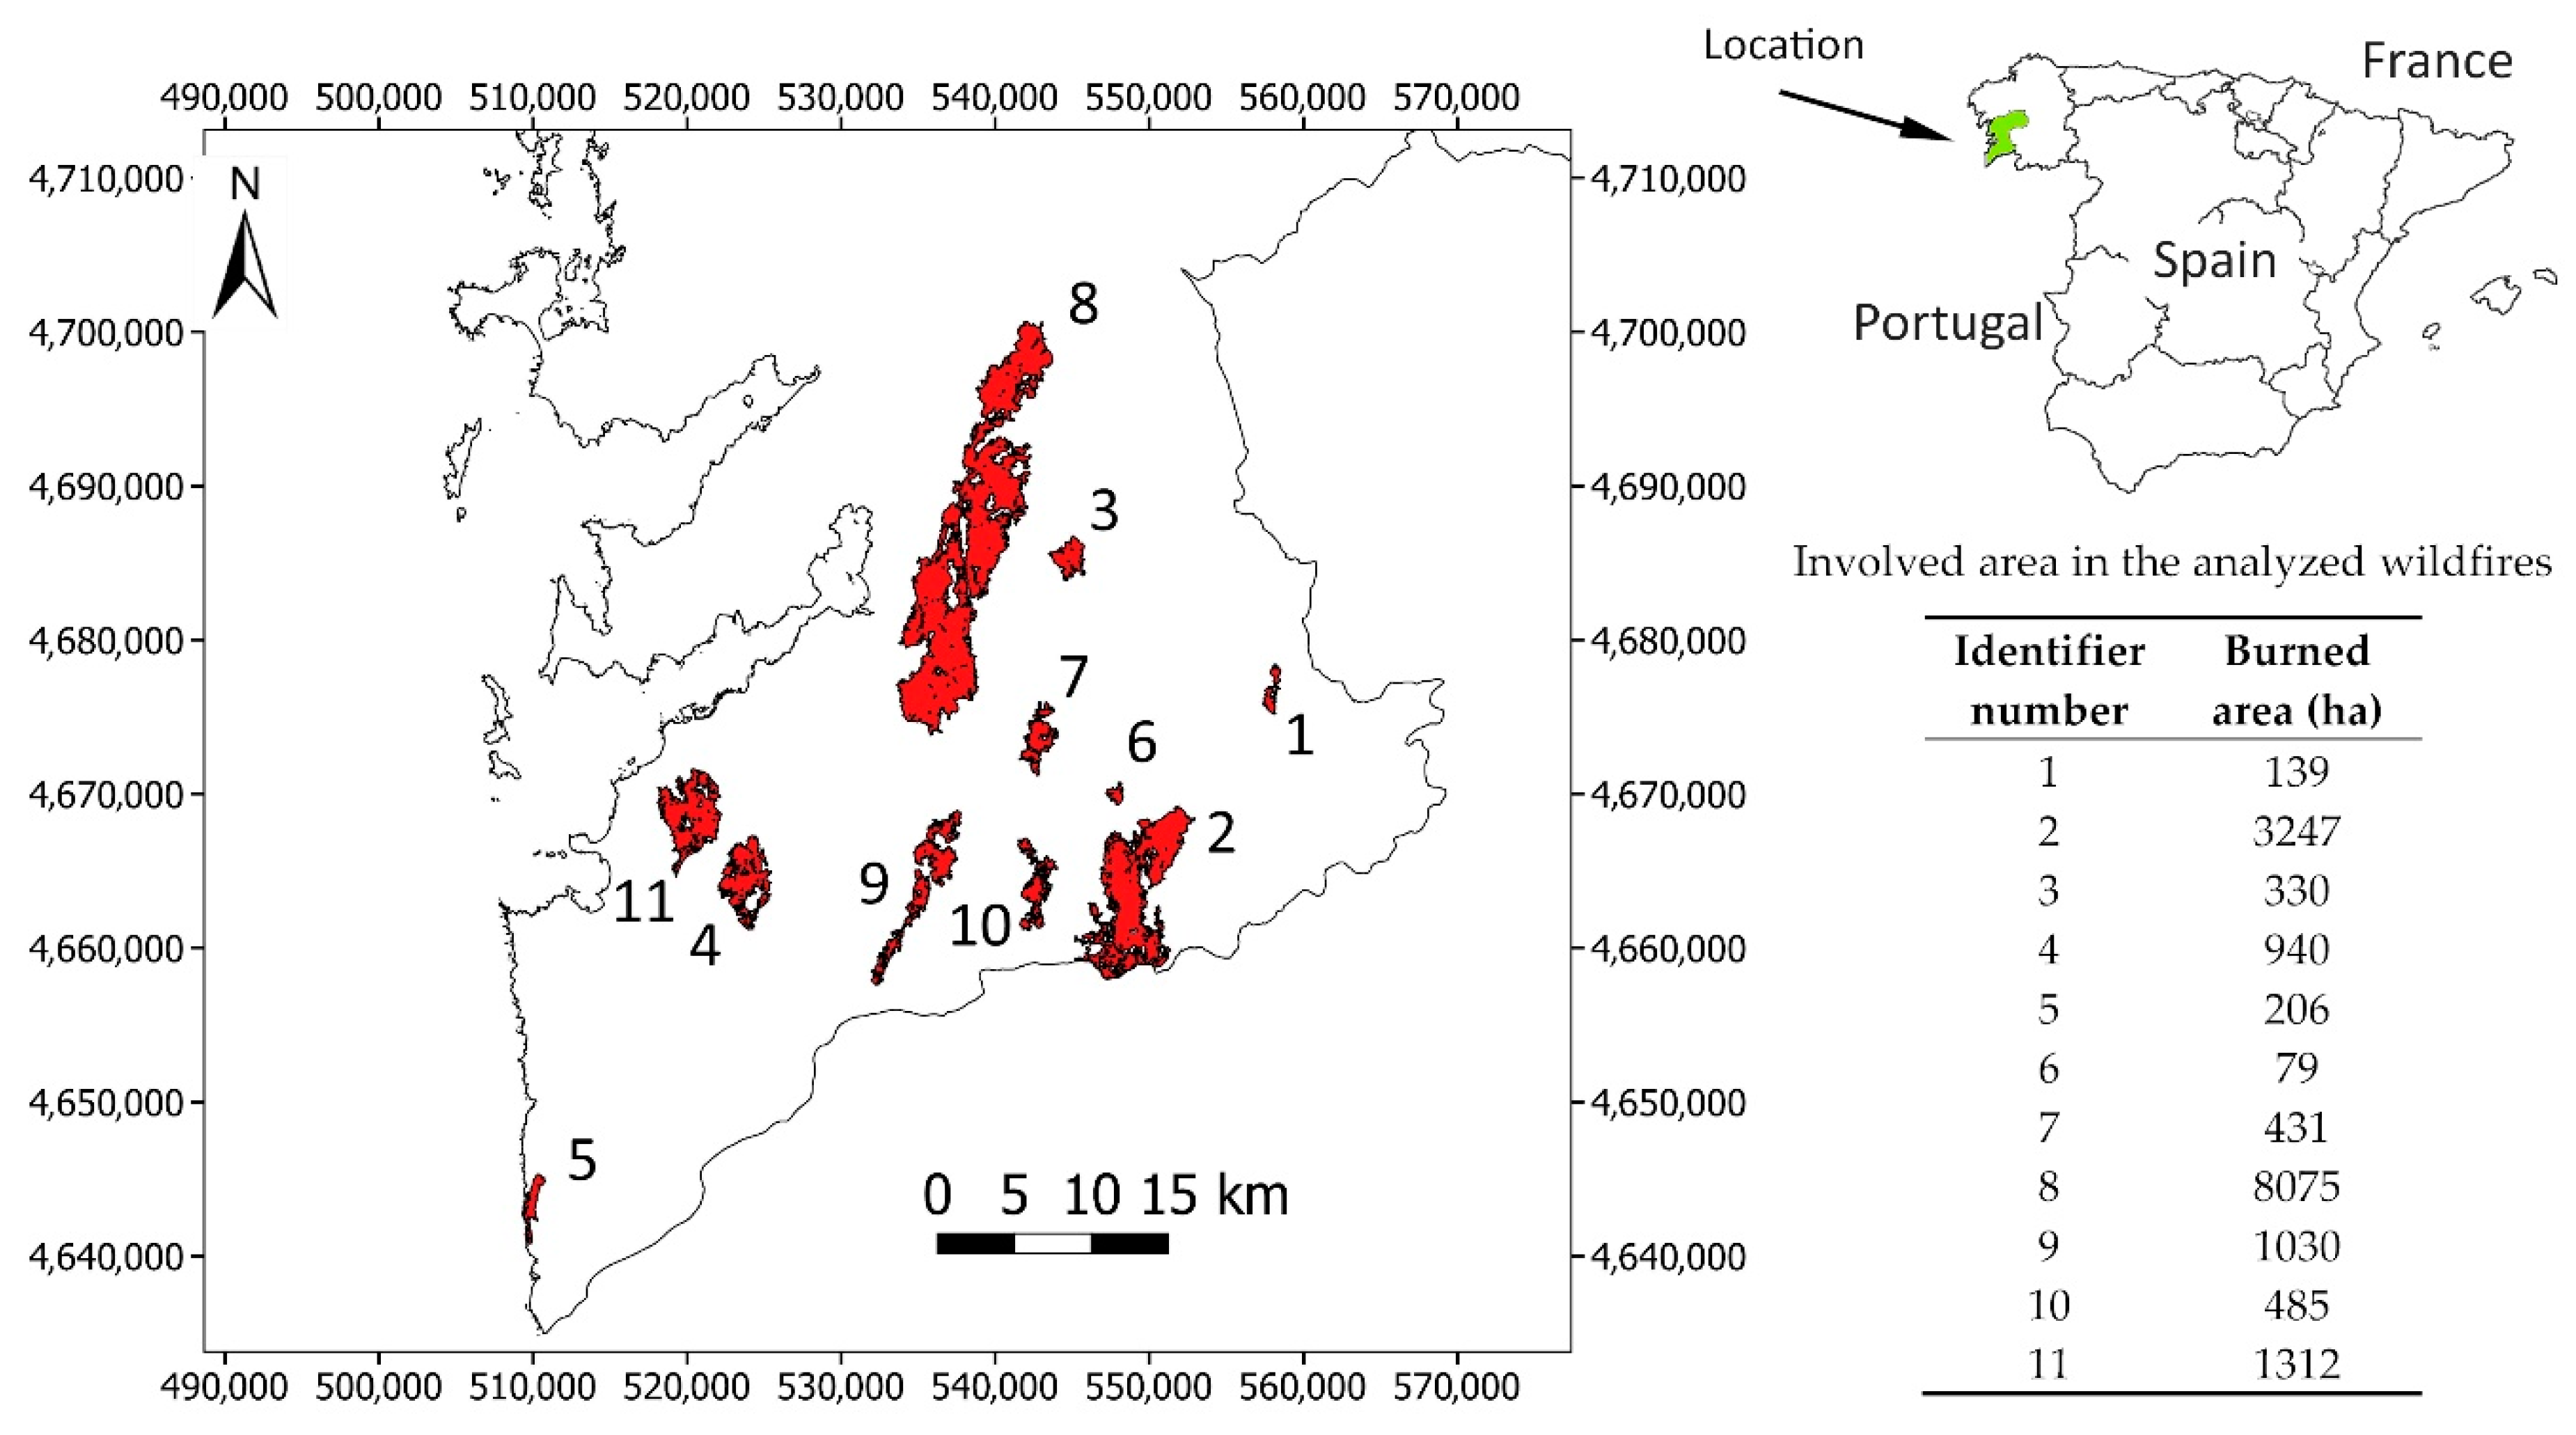
This is an event-based study: it involves the eleven largest wildfires of the 215 that arose between 14th and 16th October 2017 in Pontevedra. The location and the burned area of each wildfire are collected in Figure 1: five fires burned over 500 ha, and all of them burned over 79 ha. In that October, a total of 19,919 ha burned, and 3 fatalities occurred in Pontevedra. A drought was declared in the region in January, and it still persisted through October. The temperature reached in the affected region on 14th October ranged from 25.6 to 30.5 °C and from 26.5 to 34.8 °C on 15th October. In most of the region, between the 14th and 15th of October, the air relative humidity fell below 30% and wind speed varied from 17 to 22 m/s [55]. In brief, the fires stared under similar meteorological conditions, which was an opportunity to analyze other environmental variables that have a substantial impact on wildfire behavior.
The study was based on the imagery from Sentinel-2. It consists of a partnership of twin satellites flying in the same orbit but phased at 180° to give a revisit frequency of 5 days. These satellites are a mission of the Copernicus program designed by the European Commission in partnership with the European Space Agency (ESA). Their goal is to provide information about Earth’s surface that is useful for a wide range of applications in a variety of areas. The mean orbital altitude of these satellites is 786 km, their orbit inclination is 98.62°, and their geographical coverage consists of the band of latitude extending from 56° South (Isla Hornos, Cape Horn, South America) to 83° North (above Greenland) [56].
No geometric and radiometric corrections needed to be applied to the Sentinel-2 data acquired, since such operations are included in the product used (Level-1C). Images from Sentinel’s MSI have a radiometric resolution of 12 bits, enabling the detection of 4095 potential light intensity values [56]. The spectral band specifications are presented in Table 1.
The input images for this study were selected pursuing a low cloud percentage, a similar phenological stage, and the lowest elapsed time between the wildfires and the pre- and post-wildfire situations. They consisted of 4 images: for the northern part of Pontevedra, two images were recorded on 10 October 2017 for prefire and 30 October 2017 for postfire. For the southern part of Pontevedra, the pre- and postfire dates were 10 October 2017 and 14 November 2017. Images count with geometric and radiometric correction, which facilitates the methodology.
2.2. Methodology
The Sentinel-2 images were used to build up the fire severity map. Once the map was created, the aforementioned biophysical variables that affect fire spread and severity were analyzed. Sentinel image analysis and available regional cartography were combined. The biophysical variables were calculated and combined with severity to find possible correlations.
2.2.1. Burned Areas Detection and Fire Severity
The burned areas were detected through the NBR index; this index is sensitive to chlorophyll content, vegetation humidity, and ashes [45,57]. The NBR combines NIR and SWIR wavelengths through the Formula (1):
Prefire, healthy vegetation has very high near-infrared reflectance and low reflectance in the shortwave infrared portion of the spectrum. However, recently burned areas have relatively low reflectance in the near-infrared and high reflectance in the shortwave infrared band [58,59]. Consequently, a high NBR value generally conforms to healthy vegetation covers and bare ground, while recently burned areas present low NBR values.
The difference between NBR pre- and postfire values was used to measure the impact that fire had on the burned areas and thus to detect fires [58], as expressed by Formula (2). This magnitude, sometimes called dNBR (differenced NBR), exploits the changes in pixels caused by fire. The dNBR is currently one of the most consolidated indicators to analyze fire severity with very different fuel types among different ecosystems and geographic areas [24,60].
The discrimination of fire severity levels was carried out by establishing threshold values over the dNBR index. The threshold values were adapted from those used by Key et al. [58]. In the next sections, the relationship between fire severity and the following variables was investigated: land cover, aspect, slope, proximity to the nearest stream, and fire recurrence.
2.2.2. Land Cover
In regard to fire behavior, land cover is a critical factor since the amount of fuel and its spatial distribution strongly influence fire spread [61]. There is no land-cover cartography available in Spain dating from 2017 with a resolution comparable to Sentinel-2 products. For this reason, the land-cover mapping was calculated in this work by supervised classification of the Sentinel images. The training areas were defined based on the photointerpretation of aerial images provided by the Spanish Plan for Aerial Orthophotography (PNOA) 2015 [62].
The land cover classes were defined through a simplification of the classes used in the European program CORINE Land Cover [63], which is the base for the Information System on Land Use in Spain (SIOSE) [64]. Eight classes of land cover were considered, based on a field survey, as well as on shared characteristics and distinguishable physiognomies:
- Rocky areas: consist of scrubs on rocky outcrops.
- Crops: mainly composed of orchards, vineyards, pastures, and annual crops.
- Anthropogenic areas: composed of infrastructures and urban areas, including gardens, slopes, urban trees, and surrounding vegetation.
- Scrubland: most common scrubs are woody shrubs that can reach up to 2 m high, mainly Ulex sp., Cytisus sp., and Erica sp.
- Eucalyptus sp.
- Conifers: the most common is Pinus sp.
- Broadleaves: includes Quercus sp., Castanea sp., Acacia sp., and other typical riverside Galician species.
Training areas were distributed around all the study regions to obtain representative data according to different aspect, slope, age, and phenology. Every training sample was over 900 pixels for the scrubland cluster, equivalent to 36.4 hectares. The classification algorithm applied was the maximum likelihood, which uses probability densities for the categories to predict the inclusion of a pixel in each [65,66].
The classification was performed using Sentinel bands (resampled to 20 m). Given that the vegetation phenology varies throughout the year, the potential for canopy discrimination through remote sensing images also depends on the image date. For this reason, the land-cover classification procedure was tested on images from different seasons. The accuracy of classifications was evaluated through a sample of ground control points. The cover of the sample points was identified over the PNOA of 2015 [62]. The image that provided optimal results in terms of seasonal analysis was the one dated 24th April 2017.
2.2.3. Topography and Physiography
A second driving factor for fire spread and fire severity is the characteristics of the terrain. The wildfire spread rate is the result of a complex interaction between topography, fuel, and vegetation [67]. Most authors agree that topographic, physiographic, and fuel conditions strongly affect fire severity when weather conditions are not extreme [68,69]. Physiography is defined as the range of topographic variation encountered within a focal landscape, as aspect, slope, and distance to streams [70]. In contrast, there is disagreement when conditions are extreme, as is the case for the analyzed wildfires. Extreme meteorological conditions can induce high spatial variations in wildfires in terms of location on the fire perimeter and time of day of burning. The correlation of fuels, topography, and weather in such mixed-severity fires remains poorly understood [71]. As mentioned in Section 2.2, the weather conditions during the eleven wildfires occurred during similar weather conditions, and this facilitates the analysis of other biophysical variables.
This study considers the soil moisture in riverbanks, which is usually one of the neglected variables affecting forest fires. This moisture is absorbed by the vegetation, thus eventually resulting in lower fire severity. The spatial analysis of this moisture source remains under-investigated, as opposed to the temporal analysis in relation to a precipitation regime [72], as well as the presence of streamflows, which has been reviewed in the context of hydrologic drought [73]. The soil moisture was expected to be seriously lowered all over the studied region because of two reasons: it underwent a prolonged drought, and most of the region has primarily sandy soils [74]. In view of this, the proximity to streams was tested as an approximation of the soil moisture.
The impact of fuel and weather on wildfire severity has undergone more active research than that of topographic variables. Thus, to clarify the influence that topography and physiography have in fire severity on temperate Spanish wildland, the following variables were analyzed:
- Aspect: defined as the orientation of the slope, the aspect map was generated from the Digital Terrain Model, 5 m resolution, dating from 2009, provided by the official cartographic services [75]. The resulting values for every pixel were categorized into four sectors: 90°—amplitude: 315°–45° was north-facing, 45°–135° was east-facing, 135°–225° was south-facing, and 225–315° was west-facing.
- Terrain slope: as in the previous case, the slope map was generated from the Digital Terrain Model provided by the official cartographic services [75]. The resulting values for every pixel were categorized into four classes: below 20%, 20–40%, 40–60%, and over 60%.
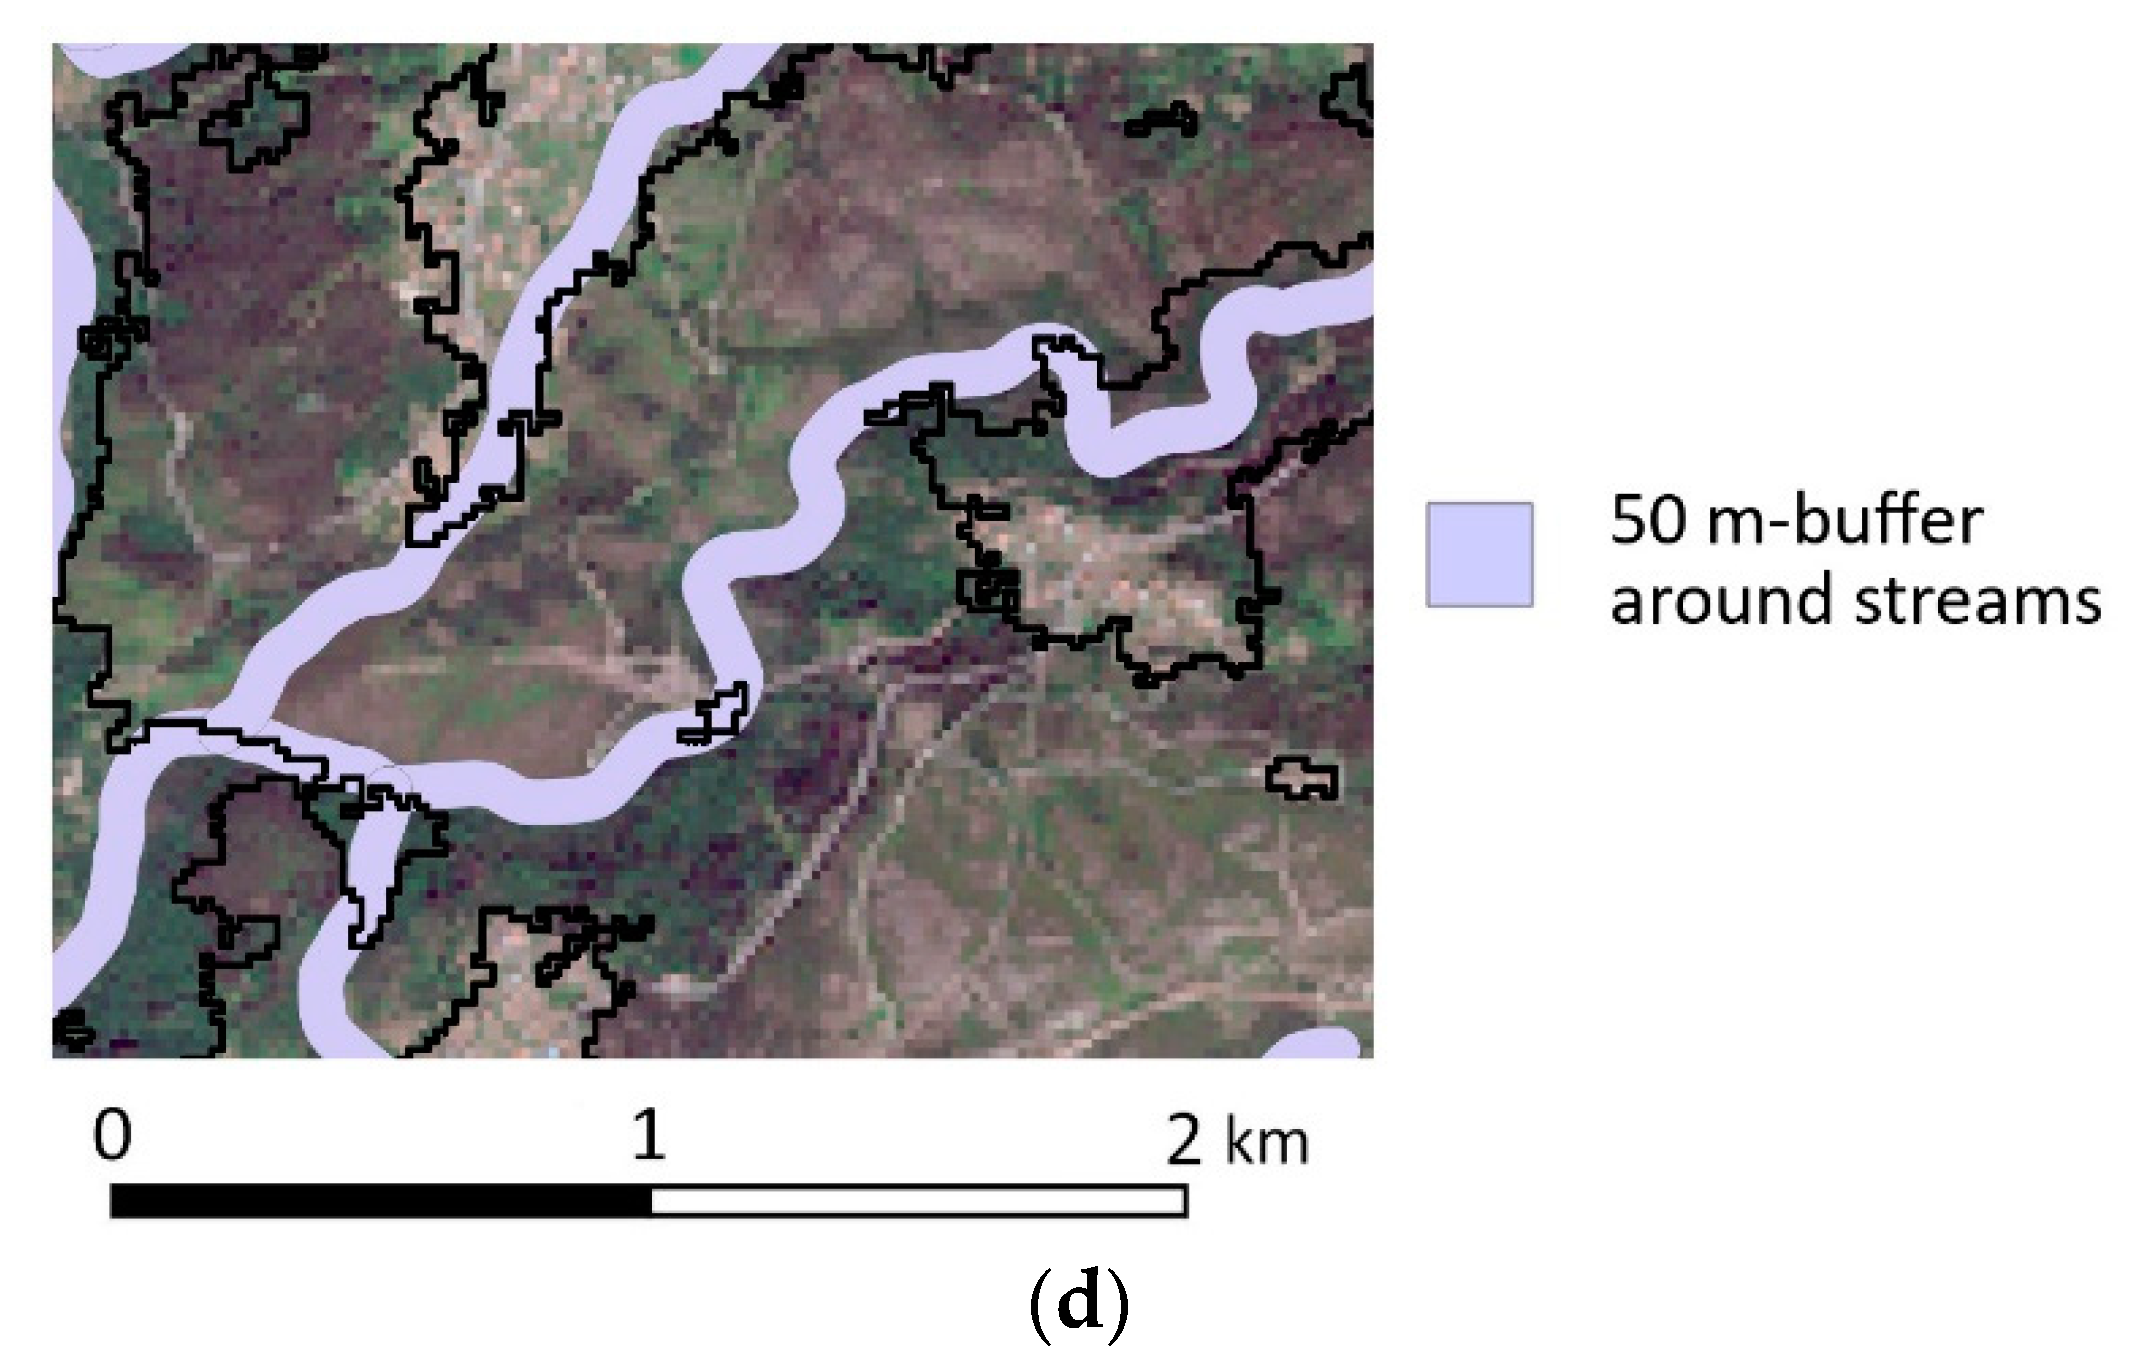
- Distance to nearest stream: the cartography of streams at a 1:10,000 scale provided by the regional official services [76] was considered to discriminate surrounding areas that could potentially benefit from the available soil moisture. A buffer of 50 m was used for the final streams map. Beyond that length, the influence provided by streams is neglected. Sentinel-2 data could not be used to provide a smaller buffer because they have not enough resolution to provide this information.
The area for every parameter in the resulting maps was obtained in hectares, and then relative values were obtained for the severity of each fire.
2.2.4. Fire Recurrence
Prescribed fires are infrequent in Galicia. Once a land burns, depending on the fire severity, most of the vegetation might be destroyed, and the soil conditions might be altered. Then, in an ecosystem such as that analyzed in this work, after a fire, the ground is rapidly covered by germinating plants, among which short-lived species are abundant [77], or by resprouting plants. Seeds can be present in the burned soil or can arrive from unburned neighboring areas [78], in which pioneer plants are dominant [79]. A different vegetation pattern would entail a different wildfire behavior.
In addition, the reduction in soil and vegetation evolution may obstruct either soil organic matter formation or limit the establishment of plant species, which foster erosive processes [80]. Erosion, in turn, impedes vegetation restoration, causing a decrease in soil moisture. The vegetation that prevails in such conditions would ignite easier and burn faster than the prefire vegetation.
Another consequence of fires is the abandonment of prefire crops. Crops usually function as firebreaks because firefighting is easier over them and because of their geographic association with human presence, facilitating a quicker response [81]. Once they are no longer exploited, unmanaged fuel begins to cover the area, increasing fire proneness.
Consequently, the occurrence of past fires determines the available fuel, the spatial patterns of fire, and the firefighting conditions, so fire recurrence should be analyzed as a factor that potentially correlates with the severity of new wildfires. The fire recurrence for the regions analyzed in the present study was extracted from Regos [82], which includes the fire recurrence of the whole Galician Spanish Region from 2000 to 2017. The author developed the fire recurrence map through the data acquired from the MODIS, specifically from the product MCD64A1. The period 2000–2016 was used to build the recurrence map.
3. Results and Discussion
3.1. Burned Area Detection and Fire Severity Mapping
Following the methodology described in Section 2.2.1, maps of burned areas and resulting dNBR were generated. They are shown in Figure 2. The fire severity discrimination was performed by applying the threshold values presented in Table 2 to the dNBR map. The determination of these values was based on the approach followed by Key et al. [58]. The first threshold, referred to as the unburned–burned threshold, was chosen at the 200 value by analyzing the frequency distribution of the dNBR values. Furthermore, four classes were considered with different levels of forest fire severity. This is in accordance with the characteristics of wildfires occurred in Pontevedra [83,84], and it matches the number of severity classes adopted by the European Forest Fire Information System (EFFIS) [85] and the United States Department of Agriculture (USDA) [86]:
- Low severity (2): this class includes areas where stems of trees and shrubs were partially affected.
- Moderate severity (3): this class includes areas where less than 50% of tree canopies were scorched, and some shrubs remained unburned.
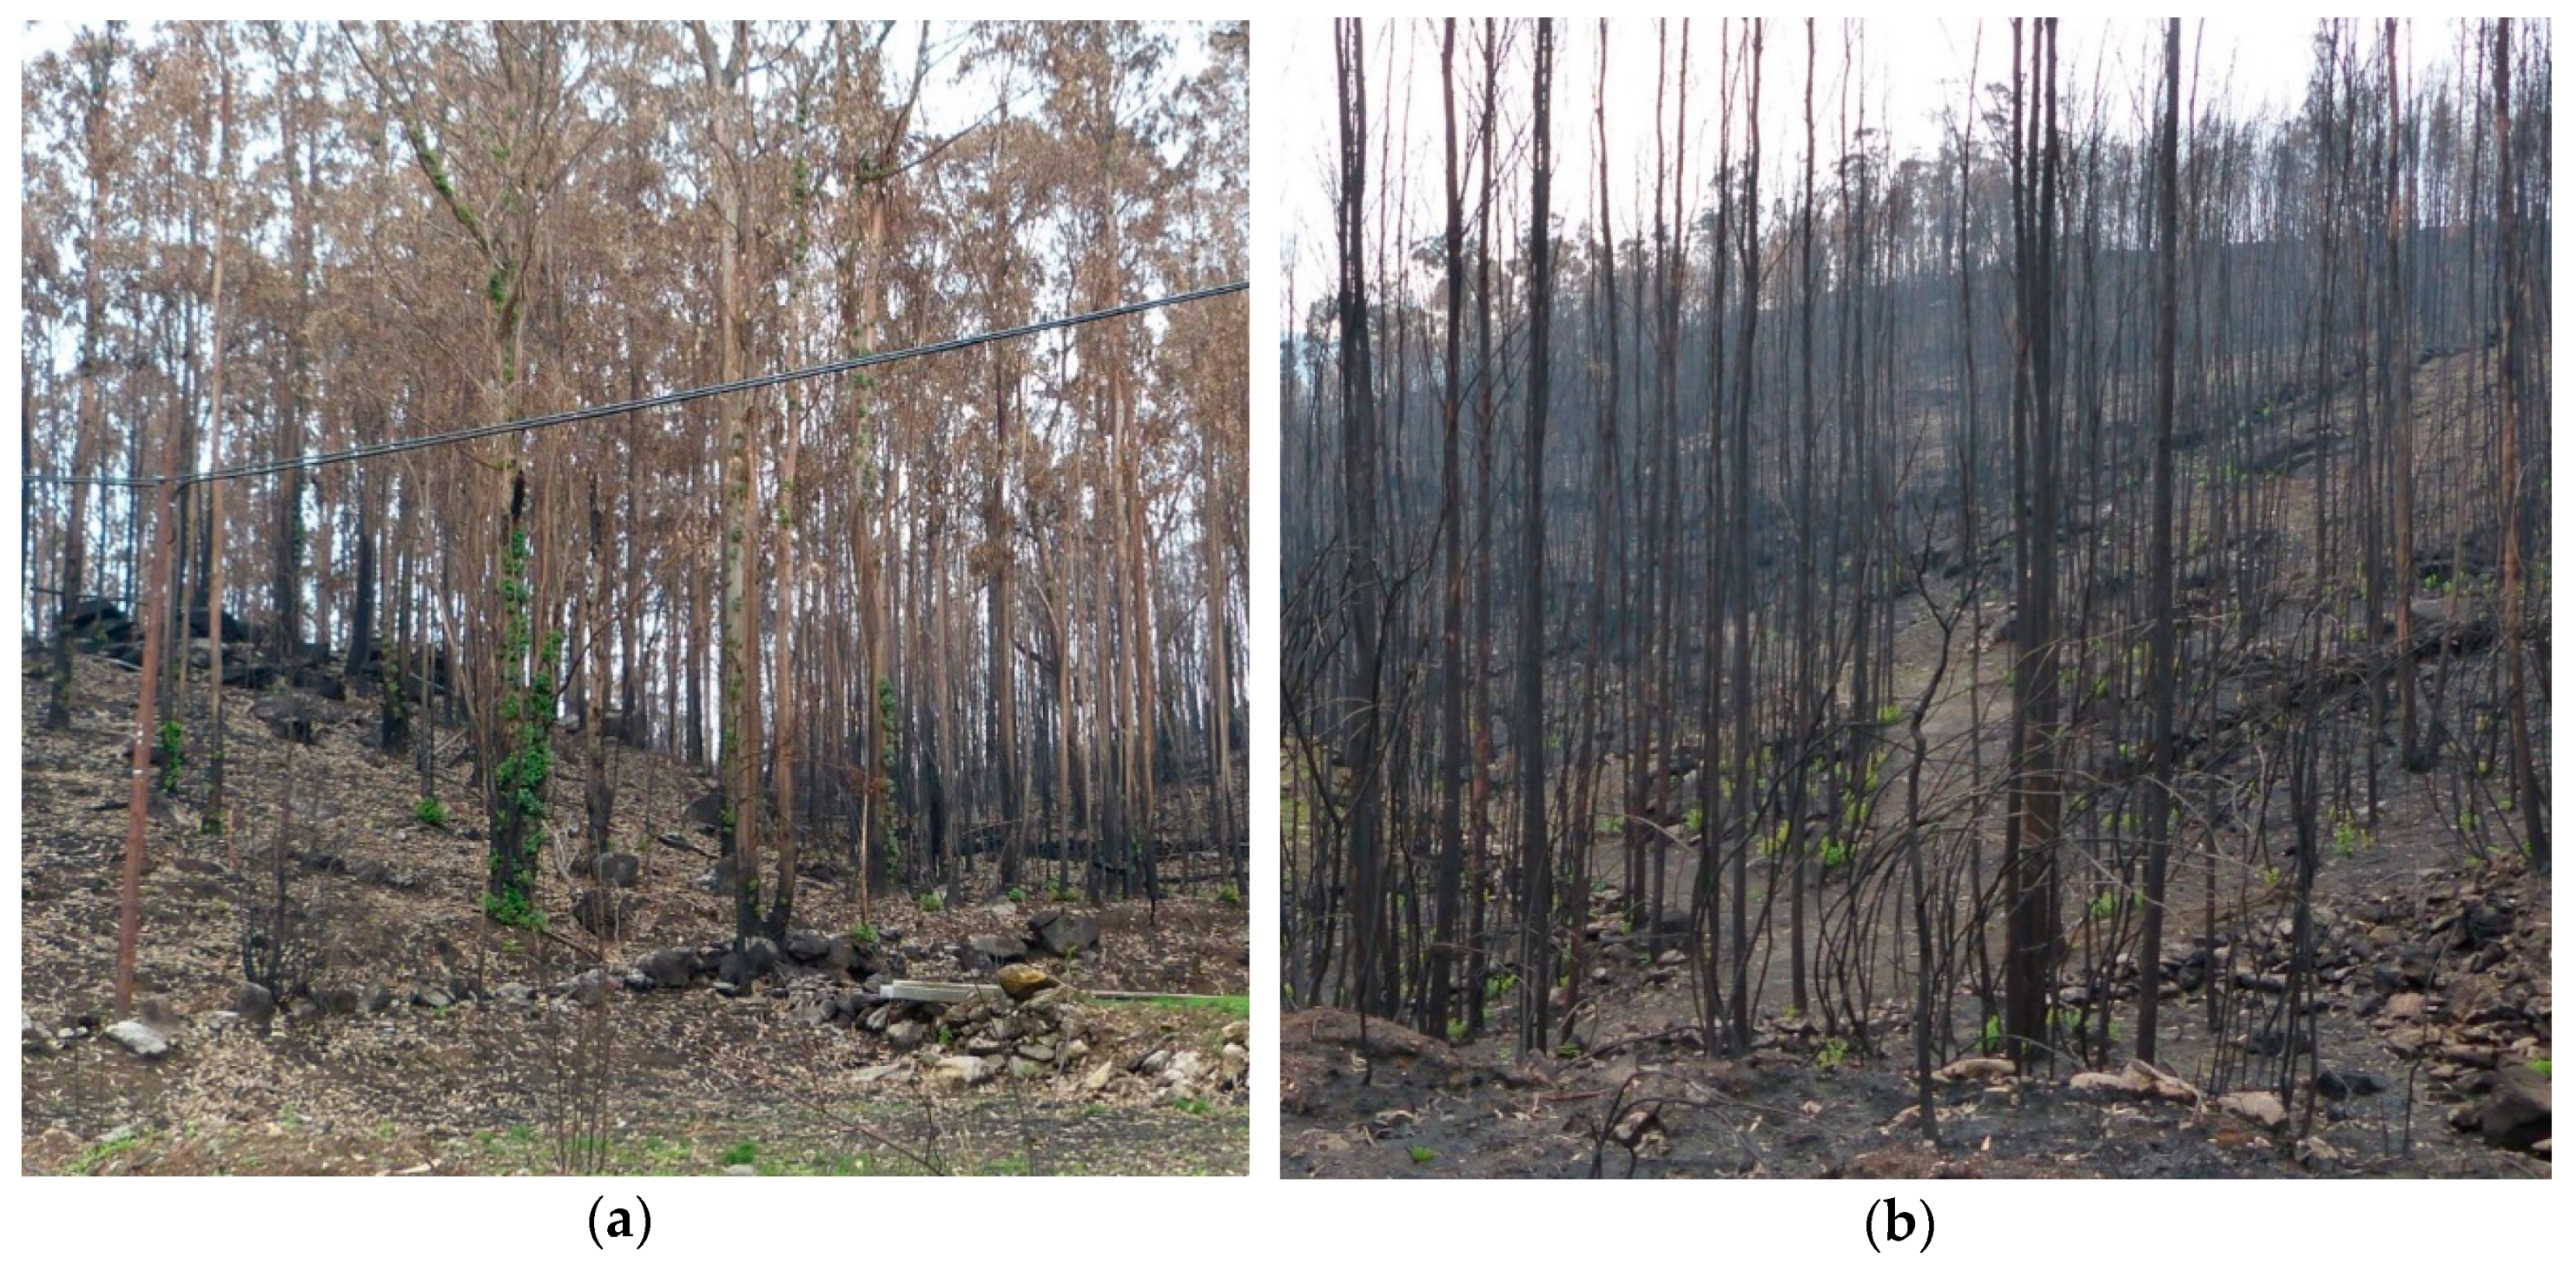
- High severity (4): a burned area falls in this class if more than 50% of tree leaves were scorched but not burned, as well as some small branches of shrubs (see Figure 3a).
- Very high severity (5): in this class, the leaves and the thin branches of trees and shrubs were burned. Just stems and thick branches remained standing (see Figure 3b).
3.2. Land Cover
As it can be appreciated in Figure 1, wildfire 8 affected the largest area by far (8075 ha). For this reason, it is shown in Figure 4 as an example of the obtained vegetation map.
The Sentinel-based classification was validated through photointerpretation of orthorectified images at 25 cm spatial resolution dating from 2015 [62]. A sample of 420 randomly distributed points around the studied area was used to compute the confusion matrix and is presented in Table 3. An overall accuracy of 89.8% was obtained for this thematic map.
The area of land-cover classes was analyzed for every severity level. The absolute and relative values were obtained. The relative values are presented in Table 4, which also includes the area-weighted average severity for every cover class. The results reveal significant differences among the types of cover. For instance, 17.7% of the low-severely damaged surface corresponds to broadleaves, while this percentage decreases to 8.7% in the very high-severely damaged areas. The most pronounced difference between the lowest and highest severity degrees is shown in scrubland: 9.7% of the surface affected by low severity corresponds to scrubland, while it rises to 25.8% in the areas with very high severity. Furthermore, this is the cover with the highest average severity. Strong differences among high–low damaged areas also appear in crops and anthropogenic areas, but in the opposite direction. Anthropogenic areas only include 1.2% of the very high severity class, whereas they account for 6.2% of the low severity areas. They both present the minimum average severity. These results seem to be linked to the available woody fuel in each type of cover. Fire suppression efforts are an important explicative factor since they are usually focused on anthropogenic areas. The proximity to streams for certain covers is another variable that may explain some of these results and is analyzed in the next section.
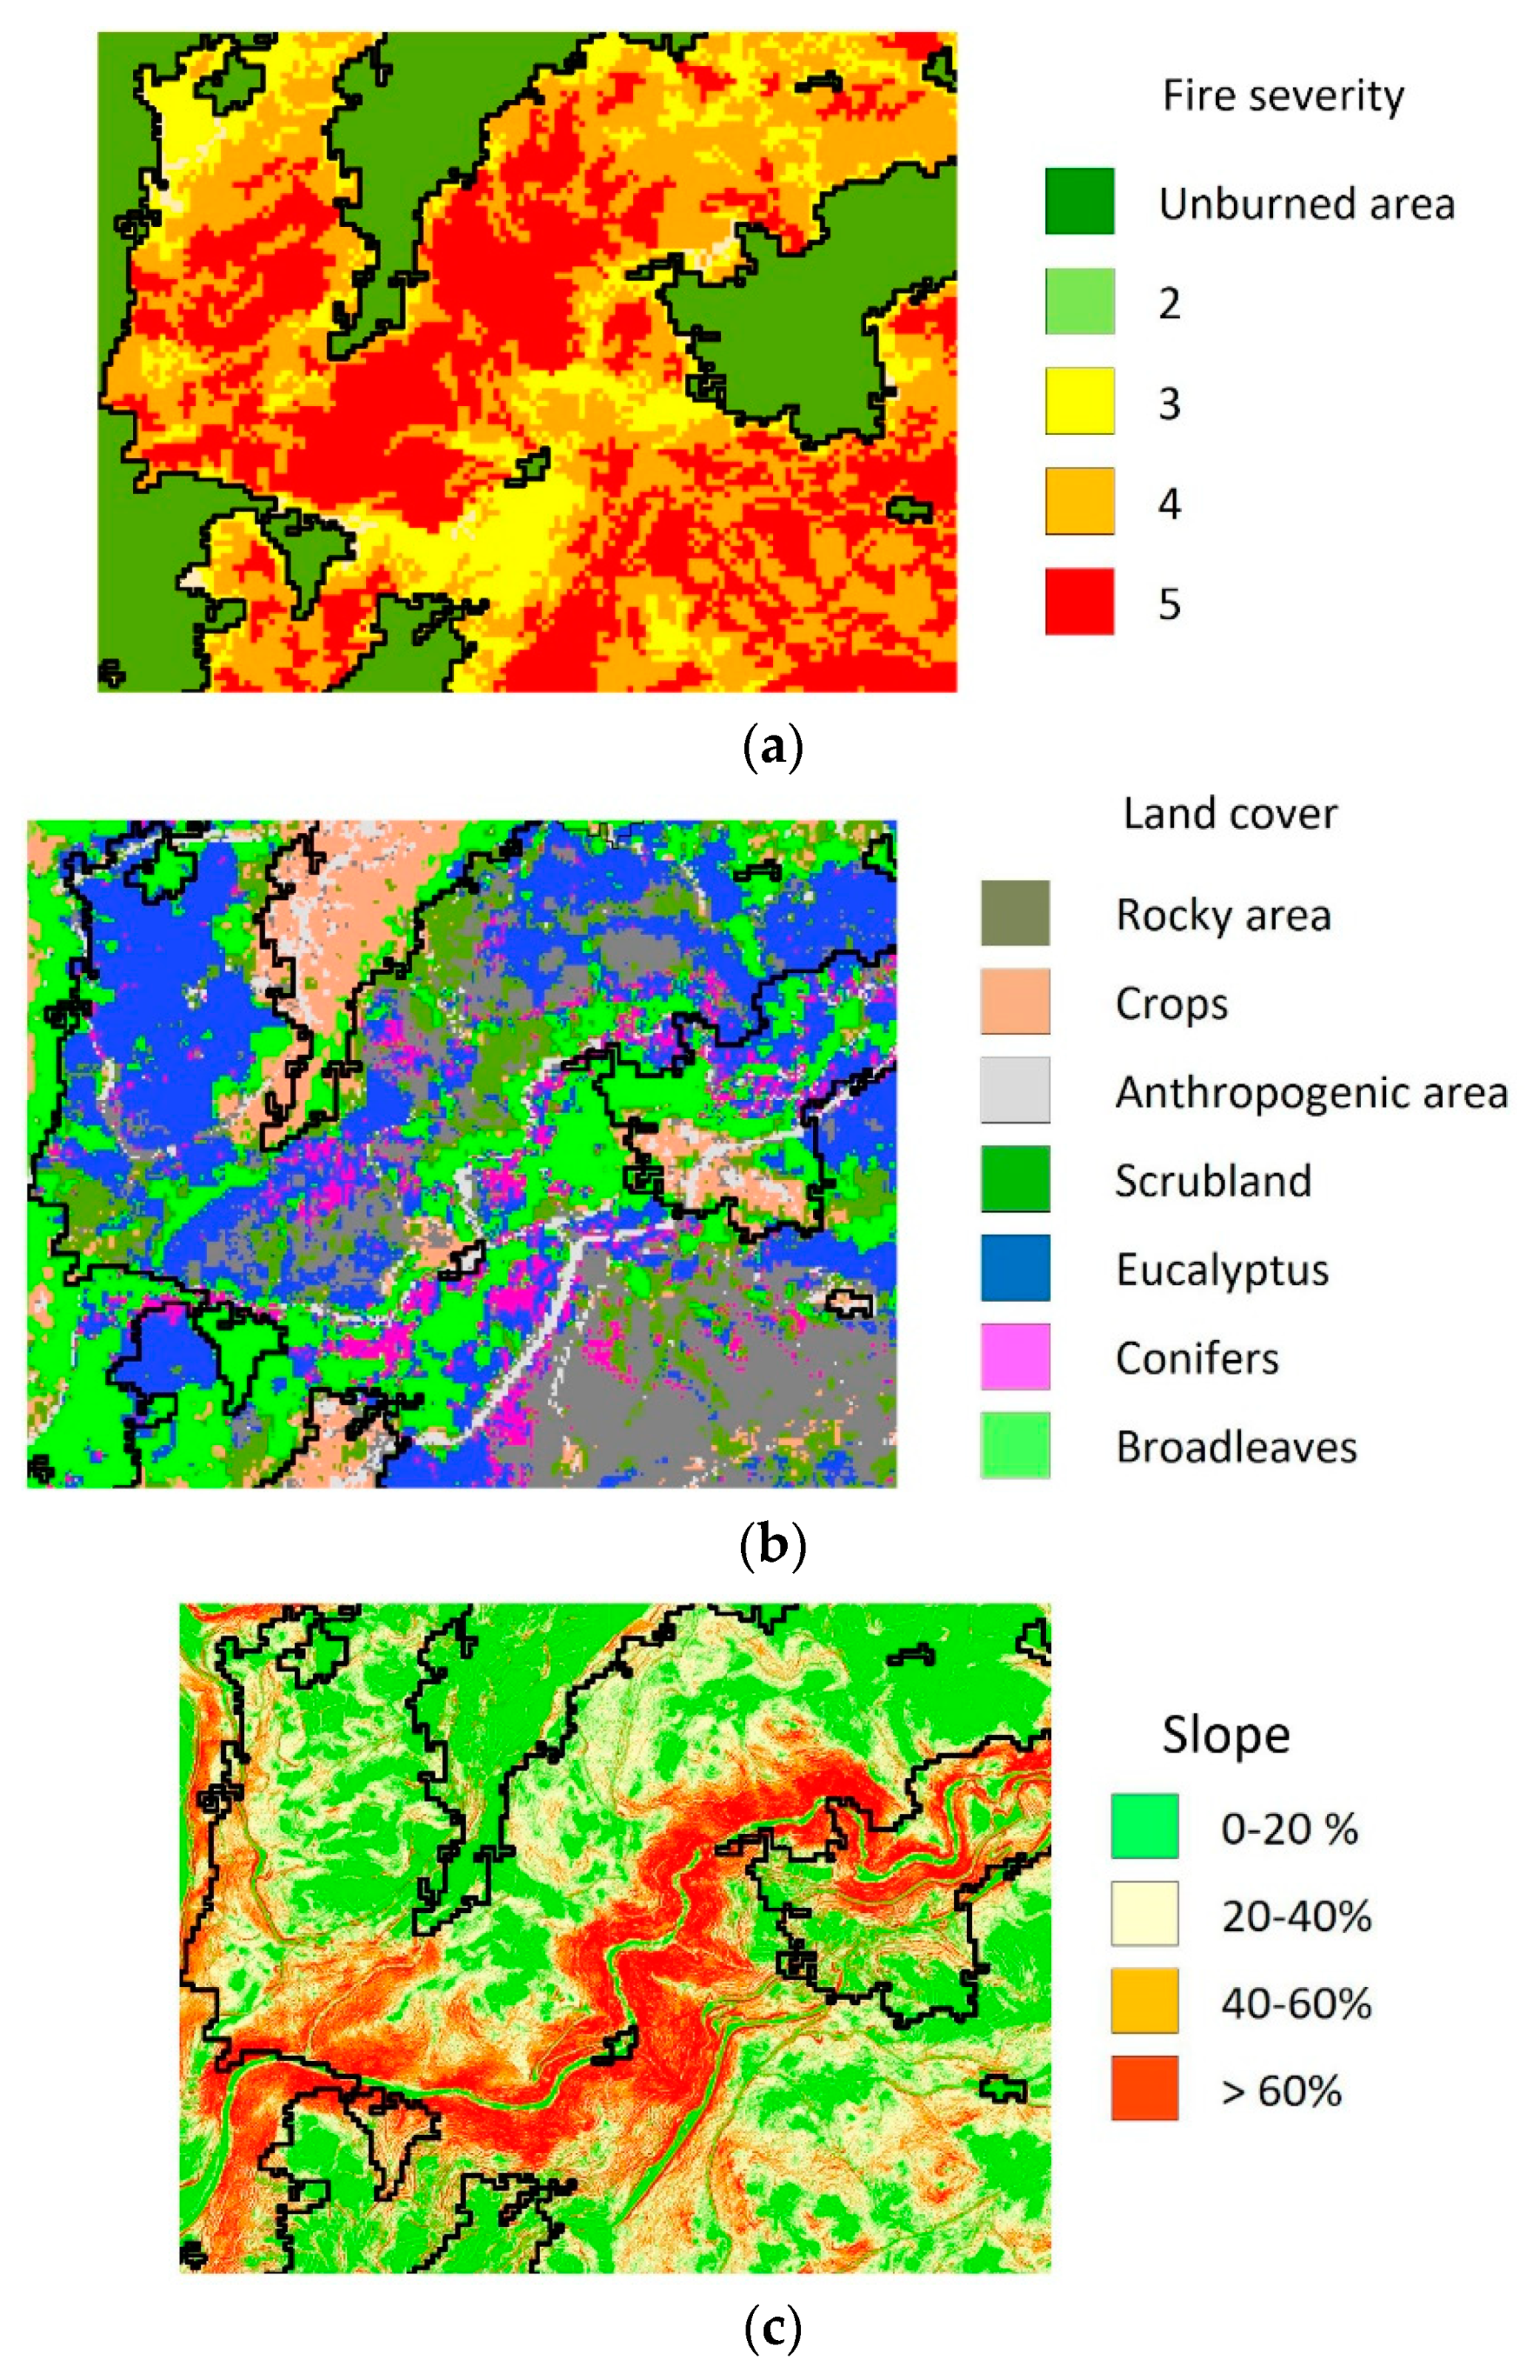
To better appreciate the aforementioned links between land cover and fire severity, Figure 5 illustrates a detail of both thematic maps for the wildfire 8. The fire was extinguished in many crops and broadleaf surfaces or caused less damage than other types of cover.
3.3. Topography and Physiography
The maps depicting aspect, slope, and distance to the closest stream were obtained for the studied fires following the methodology described in Section 2.2.3. Images for fire number 8, the largest one among the set of fires occurring within the study period, are shown in Figure 6.
The relation between fire severity and aspect of burned areas is presented in Table 5. The average fire severity for each slope shows no significant variation. However, the analysis of the relative presence of the different orientation classes in every fire severity class reveals that the west-oriented (135°–225°) hills accounted for the largest burned at all damage levels. This is consistent with the physiography of the analyzed regions since most of the hydrographic basins face this orientation. In addition, when the fires started to break out on 14th October 2017, south–southwest wind prevailed [55], which influenced the propagation of the primary fire and the induction of new fires. The relative areas also reveal that the north orientation was clearly less affected by the highest levels of severity. An example can be found in the wildfire 2 case, where the aspect map in the northern part of the affected area clearly matches the fire severity distribution.
The relation between fire severity and slope is presented in Table 6. The analysis of this parameter for every severity class shows a similar distribution: for every severity class, more than 74% of the terrain presented slopes under 40%; slopes over 60% represent 6.2% of the areas affected by severity 5 and 9.2% of the areas affected by severity 2. The average fire severity is 3.0 for every slope class. In summary, no correlation was observed between slope and fire severity. One reason may relate to the fact that, according to the slope map, the terrain in the area of study is not steep: only 8% of the burned areas have slope values over 60%, while 73% are under 40%.
As mentioned above, the soil moisture was considered from the spatial point of view by classifying the burned area into two groups, depending on their proximity to a stream. This variable was analyzed together with fire severity and is shown in Table 7. It can be seen that the higher the fire severity was, the lower the area burned near a stream. Additionally, in a visual inspection of severity, vegetation and stream maps seem to be correlated; Table 8 shows the relative values of land cover in stream areas. This analysis reveals that 27.0% of the burned riverbank was occupied by broadleaves, while they only involved 12.0% of the whole burned surface. This correlation could explain the better behavior of broadleaves to fire severity that was noted in the previous section.
The three described thematic maps of wildfire 8 are presented at a greater resolution in Figure 7: aspect, slope, and proximity to streams, together with fire severity. The contour of the burned area was added to all of them. No appreciable influence of slope on fire severity was found. North-faced (315°–45°) hills possessed a mild trend to lower severity.
As shown in these results, riverbanks are associated with fire refugia, which are of increasing interest to ecology. Biodiversity can retreat to them and, once the conditions change, expand [87].
3.4. Fire Recurrence
Finally, a recurrence map was obtained, as explained in Section 2.2.4. According to the available data, 5% of the territory has been affected by three or more fires in the period 2000 to 2016, 32% by two fires, and 35% by one fire. Figure 8 corresponds to the map built from the information gathered.
The numeric comparison between fire severity and fire recurrence is illustrated in Table 9 and Table 10. Both contain the relative values in relation to the burned area, the former for each fire severity level, and the latter for each fire occurrence category. Table 9 shows that 47.8% of the areas affected by very high severity correspond to level two of wildfire occurrence. According to Table 10, 75.2% of the burned area that experienced two previous fires underwent fire severity of high (4) or very high (5), and 77.1% for areas with three previous fires. These results reveal that the vegetation might be sufficiently restored from one wildfire to the next.
The relationship between fire occurrence and high severity levels shows that a wildfire can alter the characteristics of the vegetation. Wildfires may involve a selection of species; a biomass restoration is more likely to be performed by those species with greater postfire resprouting capabilities or that are better adapted to burned environments. The success of these species also has the consequence of a high uniformity in the ecosystem, which makes fire suppression more difficult in future fires. Additionally, soil degradation entails less soil moisture retention, which makes the biomass living there more prone to burn. Another effect lies in human postfire behavior: agriculture and forestry tend to be discontinued, and thus, prevention activities and fire suppression resources are also discontinued.
4. Conclusions
The fire severity map for the eleven largest wildfires that occurred in October 2017 in northwest Spain was created using Sentinel-2 imagery. Wildfires broke out under extreme weather conditions in terms of temperature, wind speed, and air moisture. The influence that the topographic and physiognomic variables or wildfire recurrence have on the behavior of fire under such conditions is not well known. To fill this gap, an intercomparison was performed between fire severity, aspect, slope, proximity to waterways, and fire recurrence. It was facilitated by the spatial homogeneity of meteorological conditions. The analysis includes a detailed, accurate land-cover map and the analysis of the relationship of this parameter with fire severity.
Sentinel-2 capabilities have great potential to improve the understanding of the effect that the aforementioned factors have on wildfire behavior simultaneously. In fact, the relations between the different land-cover types and fire severity were more precisely described than the current official maps allow. An overall accuracy of 89.8% in the land cover map was achieved. Considering the obtained map, the most affected cover types by fire were, from higher to lower impact, scrubland, rocky area, and Eucalyptus.
Some conclusions were derived from the integrated analysis performed through the environmental variables and fire recurrence. While research on soil moisture as a variable affecting wildfire has been focused on its temporal variation, the present work considered its spatial variation in relation to streams. Fire severity tends to be lower in areas that are not farther than 50 m from a stream. This could be caused by the prolonged drought over primarily sandy soils. Under these conditions, the gradient of soil moisture in riverbanks is high, providing moisture to riverside vegetation. Broadleaves occupied 27.0% of this area, although they accounted for only 12.0% of the total area. This challenges the assumption that Broadleaves always resist the fire spread better than conifers and Eucalyptus. The higher severity occurred in the west-faced areas, which can be explained by the orography and the wind direction during the fire.
With regard to the occurrence of fires within the 17 years before the analyzed wildfires occurred, the severity increased with two or three fire occurrences. The rationale lies in the human postfire response: agriculture, farming, and forestry tend to be discontinued, which reduces the efforts in prevention work and the resources for fire suppression.
In view of the limited research on the combination of remote sensing information and physical variables, this work describes a method to exploit state-of-the-art remote sensing imagery to find how prefire variables affected fire severity. This research aims at helping fire researchers, authority managers, and policy makers to distinguish the conditions under which the damage by fire is minimized and the resources allocated to restoration and future fire suppression are optimized.
Some remarkable future lines of research might include the precise monitoring of fire dynamics and the role played by streams and underground water in fire severity. Through open-access remote sensing products, postfire wildland management has the chance to take a major step in improving the cost and precision of the involved magnitudes—fuel type, physiography, and fire history—compared to the method of aerial photointerpretation. Then, the efficacy and the cost-effectiveness of the decision process in wildland management could be improved.
Author Contributions
J.P. conceived the research and methodology. L.A., J.A. and G.B. performed the data processing and statistical analysis. J.A. and J.P. contributed equally to the analysis of the results. J.P. provided expertise related to fire dynamics. The writing was carried out by J.A., L.A. and G.B.
Funding
This research received no external funding.
Conflicts of Interest
The authors declare no conflict of interest.
References
- Pausas, J.G.; Keeley, J.E. Wildfires as an ecosystem service. Front. Ecol. Environ. 2019, 17, 289–295. [Google Scholar] [CrossRef]
- Myers, R.L. Living with Fire: Sustaining Ecosystems & Livelihoods through Integrated Fire Management; The Nature Conservancy – Global Fire Initiative: Tallahassee, FL, USA, 2006. [Google Scholar]
- Tanase, M.A.; Kennedy, R.; Aponte, C. Fire severity estimation from space: A comparison of active and passive sensors and their synergy for different forest types. Int. J. Wildl. Fire 2015, 24, 1062–1075. [Google Scholar] [CrossRef]
- Vhengani, L.; Frost, P.; Lai, C.; Booi, N.; Van Den Dool, R.; Raath, W. Multitemporal burnt area mapping using Landsat 8: Merging multiple burnt area indices to highlight burnt areas. In Proceedings of the International Geoscience and Remote Sensing Symposium (IGARSS), Milan, Italy, 26–31 July 2015; pp. 4153–4156. [Google Scholar]
- Smith, H.G.; Sheridan, G.J.; Lane, P.N.J.; Nyman, P.; Haydon, S. Wildfire effects on water quality in forest catchments: A review with implications for water supply. J. Hydrol. 2011, 396, 170–192. [Google Scholar] [CrossRef]
- Bowman, D.M.J.S.; Williamson, G.J.; Abatzoglou, J.T.; Kolden, C.A.; Cochrane, M.A.; Smith, A.M.S. Human exposure and sensitivity to globally extreme wildfire events. Nat. Ecol. Evol. 2017, 1, 58. [Google Scholar] [CrossRef] [PubMed]
- Pausas, J.G.; Llovet, J.; Rodrigo, A.; Vallejo, R. Are wildfires a disaster in the Mediterranean basin? A review. Int. J. Wildl. Fire 2008, 17, 713–723. [Google Scholar] [CrossRef]
- Tedim, F.; Leone, V.; Amraoui, M.; Bouillon, C.; Coughlan, R.M.; Delogu, M.G.; Fernandes, M.P.; Ferreira, C.; McCaffrey, S.; McGee, K.T.; et al. Defining extreme wildfire events: Difficulties, challenges, and impacts. Fire 2018, 1, 9. [Google Scholar] [CrossRef]
- Barreiro, A.; Martín, A.; Carballas, T.; Díaz-Raviña, M. Response of soil microbial communities to fire and fire-fighting chemicals. Sci. Total Environ. 2010, 408, 6172–6178. [Google Scholar] [CrossRef]
- Urbanski, S. Wildland fire emissions, carbon, and climate: Emission factors. For. Ecol. Manag. 2014, 317, 51–60. [Google Scholar] [CrossRef]
- Kumar, A. Wildfire Emissions in the Context of Global Change and the Implications for Mercury Pollution. Michigan Technological University, 2018. Available online: https://digitalcommons.mtu.edu/etdr/765 (accessed on 18 March 2019).
- Doerr, S.H.; Santín, C. Global trends in wildfire and its impacts: Perceptions versus realities in a changing world. Philos. Trans. R. Soc. B Biol. Sci. 2016, 371, 20150345. [Google Scholar] [CrossRef]
- Earl, N.; Simmonds, I. Spatial and temporal variability and trends in 2001–2016 global fire activity. J. Geophys. Res. Atmos. 2018, 123, 2524–2536. [Google Scholar] [CrossRef]
- Fasullo, J.T.; Otto-Bliesner, B.L.; Stevenson, S. ENSO’s changing influence on temperature, precipitation, and wildfire in a warming climate. Geophys. Res. Lett. 2018, 45, 9216–9225. [Google Scholar] [CrossRef]
- Jolly, W.M.; Cochrane, M.A.; Freeborn, P.H.; Holden, Z.A.; Brown, T.J.; Williamson, G.J.; Bowman, D.M.J.S. Climate-induced variations in global wildfire danger from 1979 to 2013. Nat. Commun. 2015, 6, 7537. [Google Scholar] [CrossRef] [PubMed]
- Spreading like wildfire. Nat. Clim. Chang. 2017, 7, 755. [CrossRef]
- San-Miguel-Ayanz, J.; Durrant, T.; Boca, R.; Libertà, G.; Branco, A.; de Rigo, D.; Ferrari, D.; Maianti, P.; Artés Vivancos, T.; Costa, H.; et al. Forest Fires in Europe, Middle East and North Africa 2017. EUR 29318 EN. 2018. Available online: http://effis.jrc.ec.europa.eu/media/cms_page_media/40/Annual_Report_2017_final_pdf_uCckqee.pdf (accessed on 27 February 2019).
- Molina-Terrén, D.M.; Xanthopoulos, G.; Diakakis, M.; Ribeiro, L.; Caballero, D.; Delogu, G.M.; Viegas, D.X.; Silva, C.A.; Cardil, A. Analysis of forest fire fatalities in Southern Europe: Spain, Portugal, Greece and Sardinia (Italy). Int. J. Wildl. Fire 2019, 28, 85–98. [Google Scholar] [CrossRef]
- San-Miguel-Ayanz, J.; Schulte, E.; Schmuck, G.; Camia, A. The European Forest Fire Information System in the context of environmental policies of the European Union. For. Policy Econ. 2013, 29, 19–25. [Google Scholar] [CrossRef]
- San-Miguel-Ayanz, J.; Camia, A. Forest fires at a glance: Facts, figures and trends in the EU. In Living with Wildfires: What Science Can Tell Us; European Forest Institute: Joensuu, Finland, 2009; pp. 11–21. ISBN 978-952-5453-30-0. [Google Scholar]
- Ferreira-Leite, F.; Ganho, N.; Bento-Gonçalves, A.; Botelho, F. Iberian atmospheric dynamics and large forest fires in mainland Portugal. Agric. For. Meteorol. 2017, 247, 551–559. [Google Scholar] [CrossRef]
- San-Miguel-Ayanz, J. The European Forest Fire Information System (European Forest Fire Early Warning System) 2012. Available online: http://www.gofcgold.wur.nl/documents/wageningen13/16-04/Session 6/JSanMiguel.pdf (accessed on 25 March 2019).
- San-Miguel-Ayanz, J.; Moreno, J.M.; Camia, A. Analysis of large fires in European Mediterranean landscapes: Lessons learned and perspectives. For. Ecol. Manag. 2013, 294, 11–22. [Google Scholar] [CrossRef]
- Lentile, L.B.; Holden, Z.A.; Smith, A.M.S.; Falkowski, M.J.; Hudak, A.T.; Morgan, P.; Lewis, S.A.; Gessler, P.E.; Benson, N.C. Remote sensing techniques to assess active fire characteristics and post-fire effects. Int. J. Wildl. Fire 2006, 15, 319–345. [Google Scholar] [CrossRef]
- Thompson, J.R.; Spies, T.A.; Ganio, L.M. Reburn severity in managed and unmanaged vegetation in a large wildfire. Proc. Natl. Acad. Sci. USA 2007, 104, 10743–10748. [Google Scholar] [CrossRef]
- Vlassova, L.; Pérez-Cabello, F. Effects of post-fire wood management strategies on vegetation recovery and land surface temperature (LST) estimated from Landsat images. Int. J. Appl. Earth Obs. Geoinf. 2016, 44, 171–183. [Google Scholar] [CrossRef]
- Gitas, I.; Mitri, G.; Veraverke, S.; Polychronaki, A. Advances in remote sensing of post-fire vegetation recovery monitoring-A review. In Remote Sensing of Biomass–Principles and Applications; Fatoyinbo, L., Ed.; IntechOpen: Rijeka, Croatia, 2012. [Google Scholar] [CrossRef]
- Chen, W.; Moriya, K.; Sakai, T.; Koyama, L.; Cao, C. Monitoring of post-fire forest recovery under different restoration modes based on time series Landsat data. Eur. J. Remote Sens. 2014, 47, 153–168. [Google Scholar] [CrossRef]
- Nedkov, R.; Velizarova, E.; Molla, I.; Radeva, K. Application of remote sensing data for forest fires severity assessment. In Proceedings of the SPIE, Berlin, Germany, 2 November 2018. [Google Scholar] [CrossRef]
- Pereira, P.; Úbeda, X.; Martin, D.A. Fire severity effects on ash chemical composition and water-extractable elements. Geoderma 2012, 191, 105–114. [Google Scholar] [CrossRef]
- Tedim, F.; Remelgado, R.; Borges, C.; Carvalho, S.; Martins, J. Exploring the occurrence of mega-fires in Portugal. For. Ecol. Manag. 2013, 294, 86–96. [Google Scholar] [CrossRef]
- Kolden, C.A.; Lutz, J.A.; Key, C.H.; Kane, J.T.; van Wagtendonk, J.W. Mapped versus actual burned area within wildfire perimeters: Characterizing the unburned. For. Ecol. Manag. 2012, 286, 38–47. [Google Scholar] [CrossRef]
- Tedim, F.; Royé, D.; Bouillon, C.; Correia, F.; Leone, V. Understanding unburned patches patterns in extreme wildfire events: Evidences from Portugal. In Advances in Forest Fire Research; Viegas, D.X., Ed.; Universidade de Coimbra: Coimbra, Portugal, 2018. [Google Scholar]
- Clark, J.; Bobbe, T. Using remote sensing to map and monitor fire damage in forest ecosystems. In Understanding Forest Disturbance and Spatial Pattern: Remote Sensing and GIS Approaches; Wulder, M.A., Franklin, S.E., Eds.; CRC Press: Boca Ratón, FL, USA, 2006; pp. 113–128. ISBN 978-084-9334-25-2. [Google Scholar]
- Soverel, N.O.; Perrakis, D.D.B.; Coops, N.C. Estimating burn severity from Landsat dNBR and RdNBR indices across western Canada. Remote Sens. Environ. 2010, 114, 1896–1909. [Google Scholar] [CrossRef]
- Abatzoglou, J.T.; Williams, A.P.; Boschetti, L.; Zubkova, M.; Kolden, C.A. Global patterns of interannual climate–fire relationships. Glob. Chang. Biol. 2018, 24, 5164–5175. [Google Scholar] [CrossRef]
- Jansen, S.V.; Kolden, A.C.; Schmalz, J.H. The development of near real-time biomass and cover estimates for adaptive rangeland management using landsat 7 and landsat 8 surface reflectance products. Remote Sens. 2018, 10, 1057. [Google Scholar] [CrossRef]
- Roy, D.P.; Wulder, M.A.; Loveland, T.R.; Woodcock, C.E.; Allen, R.G.; Anderson, M.C.; Helder, D.; Irons, J.R.; Johnson, D.M.; Kennedy, R.; et al. Landsat-8: Science and product vision for terrestrial global change research. Remote Sens. Environ. 2014, 145, 154–172. [Google Scholar] [CrossRef]
- Irons, J.R.; Dwyer, J.L.; Barsi, J.A. The next Landsat satellite: The Landsat data continuity mission. Remote Sens. Environ. 2012, 122, 11–21. [Google Scholar] [CrossRef] [Green Version]
- Fardusi, M.J.; Chianucci, F.; Barbati, A. Concept to practice of geospatial-information tools to assist forest management and planning under precision forestry framework: A review. Ann. Silv. Res. 2017, 41. [Google Scholar] [CrossRef]
- Quartulli, M.G.; Olaizola, I. A review of EO image information mining. ISPRS J. Photogramm. Remote Sens. 2013, 75, 11–28. [Google Scholar] [CrossRef] [Green Version]
- Pletsch, M.A.J.S.; Körting, T.S. Information mining for automatic search in remote sensing image catalogs. Rev. Bras. Cartogr. 2019, 70. [Google Scholar] [CrossRef]
- Cardil, A.; Mola-Yudego, B.; Blázquez-Casado, Á.; González-Olabarria, J.R. Fire and burn severity assessment: Calibration of Relative Differenced Normalized Burn Ratio (RdNBR) with field data. J. Environ. Manag. 2019, 235, 342–349. [Google Scholar] [CrossRef] [PubMed]
- Rouse, J.W.; Haas, R.H.; Schell, J.A.; Deering, D.W. Monitoring Vegetation Systems in the Great Plains with ERTS. In Proceedings of the Third Earth Resources Technology Satellite-1 Symposium, Volume 1: Technical Presentations, section A. Washington, DC, USA, 10–14 December 1973; NASA/Goddard Space Flight Center: Washington, DC, USA, 1974; Volume 1, pp. 309–317. Available online: https://ntrs.nasa.gov/search.jsp?R=19740022614 (accessed on 19 February 2019).
- Key, C.H.; Benson, N.C. Measuring and remote sensing of burn severity. In Joint Fire Science Conference and Workshop; Neuenschwander, L.F., Ryan, K.C., Eds.; University of Idaho: Moscow, ID, USA, 1999; Volume 2, Available online: https://www.researchgate.net/publication/241687936_Measuring_and_remote_sensing_of_burn_severity_the_CBI_and_NBR (accessed on 11 April 2019).
- Rothermel, R.C. How to Predict the Spread and Intensity of Forest and Range Fires; United States Department of Agriculture: Ogden, UT, USA, 1983. Available online: https://www.fs.usda.gov/treesearch/pubs/24635 (accessed on 6 November 2018).
- Pereira, P.; Cerdà, A.; Lopez, A.J.; Zavala, L.M.; Mataix-Solera, J.; Arcenegui, V.; Misiune, I.; Keesstra, S.; Novara, A. Short-term vegetation recovery after a grassland fire in Lithuania: The effects of fire severity, slope position and aspect. L. Degrad. Dev. 2016, 27, 1523–1534. [Google Scholar] [CrossRef]
- Mitsopoulos, D.I.; Dimitrakopoulos, P.A. Canopy fuel characteristics and potential crown fire behavior in Aleppo pine (Pinus halepensis Mill.) forests. Ann. For. Sci. 2007, 64, 287–299. [Google Scholar] [CrossRef] [Green Version]
- Tran, N.B.; Tanase, A.M.; Bennett, T.L.; Aponte, C. Evaluation of spectral indices for assessing fire severity in Australian temperate forests. Remote Sens. 2018, 10, 1680. [Google Scholar] [CrossRef] [Green Version]
- Amos, C.; Petropoulos, G.P.; Ferentinos, K.P. Determining the use of Sentinel-2A MSI for wildfire burning & severity detection. Int. J. Remote Sens. 2019, 40, 905–930. [Google Scholar] [CrossRef]
- Colson, D.; Petropoulos, G.P.; Ferentinos, K.P. Exploring the potential of Sentinels-1 & 2 of the Copernicus Mission in support of rapid and cost-effective wildfire assessment. Int. J. Appl. Earth Obs. Geoinf. 2018, 73, 262–276. [Google Scholar] [CrossRef]
- Brown, A.R.; Petropoulos, G.P.; Ferentinos, K.P. Appraisal of the Sentinel-1 & 2 use in a large-scale wildfire assessment: A case study from Portugal’s fires of 2017. Appl. Geogr. 2018, 100, 78–89. [Google Scholar] [CrossRef]
- Ministerio de Agricultura, Pesca y Alimentación. Los Incendios Forestales en España. Decenio 2006–2015 (Spanish). 2019. Available online: https://www.mapa.gob.es/es/desarrollo-rural/estadisticas/incendios-decenio-2006-2015_tcm30-511095.pdf (accessed on 8 September 2019).
- Barreal, J.; Loureiro, M.L. Modelling spatial patterns and temporal trends of wildfires in Galicia (NW Spain). For. Syst. 2015, 24. [Google Scholar] [CrossRef] [Green Version]
- Parlamento de Galicia. Reunión da Comisión Especial de Estudo e Análise das Reformas da Política Forestal, de Prevención e Extinción de Incendios Forestais e do Plan Forestal de Galicia, Avaliando a Experiencia Acumulada Dende 2006 e, Especificamente, a Extraordinaria Vaga de Lumes que vén de Sufrir Galicia en Outubro de 2017 (Galician). Santiago de Compostela, Spain, 2018. Available online: http://www.parlamentodegalicia.es/sitios/web/AxendaParlamentaria/cnp_rpf_2018_02_15_docu_10.30.pdf (accessed on 21 April 2019).
- European Space Agency (ESA) ESA Standard Document–Sentinel-2 User Handbook 2015, 64. Available online: https://sentinel.esa.int/documents/247904/685211/Sentinel-2_User_Handbook (accessed on 19 April 2019).
- López García, M.J.; Caselles, V. Mapping burns and natural reforestation using thematic mapper data. Geocarto Int. 1991, 6, 31–37. [Google Scholar] [CrossRef]
- Key, C.H.; Benson, N.C. Landscape Assessment (LA) Sampling and Analysis Methods. In FIREMON: Fire Effects Monitoring and Inventory System; Lutes, D.C., Keane, R.E., Caratti, J.F., Key, C.H., Benson, N.C., Sutherland, S., Gangi, L.J., Eds.; USDA Forest Service–Rocky Mountain Research Station: Ogden, UT, USA, 2005; pp. 1–51. Available online: https://www.researchgate.net/publication/241688462_Landscape_Assessment_LA_Sampling_and_Analysis_Methods (accessed on 7 April 2019).
- Verbyla, D.L.; Kasischke, E.S.; Hoy, E.E. Seasonal and topographic effects on estimating fire severity from Landsat TM/ETM+ data. Int. J. Wildl. Fire 2008, 17, 527–534. [Google Scholar] [CrossRef]
- Arellano, S.; Vega, J.A.; Rodríguez y Silva, F.; Fernández, C.; Vega-Nieva, D.; Álvarez-González, J.G.; Ruiz-González, A.D. Validation of the remote sensing indices dNBR and RdNBR to assess fire severity in the Oia-O Rosal (Pontevedra) wildfire in 2013. Rev. Teledetección 2017, 49, 49–61. [Google Scholar] [CrossRef] [Green Version]
- Bajocco, S.; Ricotta, C. Evidence of selective burning in Sardinia (Italy): Which land-cover classes do wildfires prefer? Landsc. Ecol. 2008, 23, 241–248. [Google Scholar] [CrossRef]
- Instituto Geográfico Nacional (IGN) PNOA imagen–Productos (Spanish). Available online: http://pnoa.ign.es/productos (accessed on 15 May 2018).
- Gobierno de España CORINE Land Cover 2018 (España) (Spanish). Available online: https://datos.gob.es/es/catalogo/e00125901-spaignclc2018 (accessed on 19 August 2019).
- Ministerio de Fomento. Gobierno de España Plan Nacional de Observación del Territorio. Sistema de Información de Ocupación del Suelo de España (Spanish). Available online: https://www.siose.es (accessed on 24 June 2019).
- Strahler, A.H. The use of prior probabilities in maximum likelihood classification of remotely sensed data. Remote Sens. Environ. 1980, 10, 135–163. [Google Scholar] [CrossRef]
- Greig, C.; Robertson, C.; Lacerda, A.E.B. Spectral-temporal modelling of bamboo-dominated forest succession in the Atlantic Forest of Southern Brazil. Ecol. Model. 2018, 384, 316–332. [Google Scholar] [CrossRef]
- Carmo, M.; Moreira, F.; Casimiro, P.; Vaz, P. Land use and topography influences on wildfire occurrence in northern Portugal. Landsc. Urban Plan. 2011, 100, 169–176. [Google Scholar] [CrossRef] [Green Version]
- Turner, M.G.; Romme, W.H. Landscape dynamics in crown fire ecosystems. Landsc. Ecol. 1994, 9, 59–77. [Google Scholar] [CrossRef]
- Bessie, W.C.; Johnson, E.A. The relative importance of fuels and weather on fire behavior in subalpine forests. Ecology 1995, 76, 747–762. [Google Scholar] [CrossRef] [Green Version]
- Meineri, E.; Dahlberg, C.J.; Hylander, K. Using gaussian bayesian networks to disentangle direct and indirect associations between landscape physiography, environmental variables and species distribution. Ecol. Model. 2015, 313, 127–136. [Google Scholar] [CrossRef]
- Oliveras, I.; Gracia, M.; Moré, G.; Retana, J. Factors influencing the pattern of fire severities in a large wildfire under extreme meteorological conditions in the Mediterranean basin. Int. J. Wildl. Fire 2009, 18, 755–764. [Google Scholar] [CrossRef]
- Yebra, M.; Dennison, P.E.; Chuvieco, E.; Riaño, D.; Zylstra, P.; Hunt, E.R.; Danson, F.M.; Qi, Y.; Jurdao, S. A global review of remote sensing of live fuel moisture content for fire danger assessment: Moving towards operational products. Remote Sens. Environ. 2013, 136, 455–468. [Google Scholar] [CrossRef]
- Fernandes, P.M. Fire-smart management of forest landscapes in the Mediterranean basin under global change. Landsc. Urban Plan. 2013, 110, 175–182. [Google Scholar] [CrossRef] [Green Version]
- Instituto Geológico y Minero de España (IGME); Ministério de Ambiente, Ordenamento do Território e Energia. Governo de Portugal; Laboratório Nacional de Energia e Geologia (LNEG). Mapa Geológico de la Península Ibérica, Baleares y Canarias a escala 1:1.000.000, edición 2015 (Spanish). 2015. Available online: http://info.igme.es/cartografiadigital/datos/geologicos1M/Geologico1000_(2015)/pdfs/EditadoG1000_(2015).pdf (accessed on 3 October 2019).
- Centro Nacional de Información Geográfica Modelos digitales de elevaciones. Modelo Digital del—MDT05 (Spanish). Available online: http://centrodedescargas.cnig.es/CentroDescargas/index.jsp (accessed on 11 April 2019).
- Xunta de Galicia. Información Xeográfica de Galicia. Available online: http://mapas.xunta.gal/portada (accessed on 27 April 2019).
- Trabaud, L.; Lepart, J. Diversity and stability in garrigue ecosystems after fire. Vegetatio 1980, 43, 49–57. [Google Scholar] [CrossRef]
- Díaz-Delgado, R.; Lloret, F.; Pons, X.; Terradas, J. Satellite evidence of decreasing resilience in Mediterranean plant communities after recurrent wildfires. Ecology 2002, 83, 2293–2303. [Google Scholar] [CrossRef] [Green Version]
- Lloret, F. Fire, canopy cover and seedling dynamics in Mediterranean shrubland of northeastern Spain. J. Veg. Sci. 1998, 9, 417–430. [Google Scholar] [CrossRef]
- Pardini, G.; Gispert, M.; Dunjó, G. Relative influence of wildfire on soil properties and erosion processes in different Mediterranean environments in NE Spain. Sci. Total Environ. 2004, 328, 237–246. [Google Scholar] [CrossRef]
- Moreira, F.; Viedma, O.; Arianoutsou, M.; Curt, T.; Koutsias, N.; Rigolot, E.; Barbati, A.; Corona, P.; Vaz, P.; Xanthopoulos, G.; et al. Landscape–wildfire interactions in southern Europe: Implications for landscape management. J. Environ. Manag. 2011, 92, 2389–2402. [Google Scholar] [CrossRef] [Green Version]
- Regos, A. Cartografía de áreas queimadas en Galicia no século XXI: Presentación do produto e aplicación web mapping (Galician). Nov. Acta Científica Compostel. 2018, 25, 45–53. Available online: http://www.usc.es/revistas/index.php/nacc/article/download/5150/5640 (accessed on 3 April 2019).
- The National Institute for Agricultural and Food Research and Technology (INIA)—GEPRIF Project. Recomendaciones básicas para reducción de la severidad durante la ejecución de quemas prescritas basadas en resultados científicos de parcelas experimentales (Spanish). 2019. Available online: http://proyectogeprif.es/wp-content/uploads/2019/03/ProductoFinal74_FichasRecomendaciones.pdf (accessed on 17 February 2019).
- Vega, J.; Fonturbel, T.; Fernández, C.; Arellano, A.; Carballas, T.; Martín, A.; González-Prieto, S.; Merino, A.; Benito, E. Acciones Urgentes Contra la Erosión en Áreas Forestales Quemadas: Guía Para su PLANIFICACIÓN en Galicia; Xunta de Galicia: Santiago de Compostela, Spain, 2013; ISBN 978-84-8408-716-8. [Google Scholar]
- European Commission European Forest Fire Information System (EFFIS). Available online: https://effis.jrc.ec.europa.eu (accessed on 8 May 2019).
- Lutes, D.C.; Keane, R.E.; Caratti, J.F.; Key, C.H.; Benson, N.C.; Sutherland, S.; Gangi, L.J. FIREMON: Fire Effects Monitoring and Inventory System; Gen. Tech. Rep. RMRS-GTR-164; United States Department of Agriculture, Forest Service, Rocky Mountain Research Station: Fort Collins, CO, USA, 2016. [Google Scholar] [CrossRef]
- Meddens, A.J.H.; Kolden, C.A.; Lutz, J.A.; Smith, A.M.S.; Cansler, C.A.; Abatzoglou, J.T.; Meigs, G.W.; Downing, W.M.; Krawchuk, M.A. Fire refugia: What are they, and why do they matter for global change? Bioscience 2018, 68, 944–954. [Google Scholar] [CrossRef]
Figure 1.
Location and burned areas of the analyzed fires.

Figure 2.
Fire mapping: (a) prefire Normalized Burn Ratio (NBR); (b) postfire NBR; (c) dNBR; (d) fire severity.
Figure 2.
Fire mapping: (a) prefire Normalized Burn Ratio (NBR); (b) postfire NBR; (c) dNBR; (d) fire severity.


Figure 3.
Photos of forests affected by the highest fire severity levels: (a) 4; (b) 5.

Figure 4.
Land-cover map for wildfire number 8.

Figure 5.
Detail of thematic maps of wildfire 8: (a) whole affected area; (b) fire severity; (c) land cover with superimposed burned area perimeter.
Figure 5.
Detail of thematic maps of wildfire 8: (a) whole affected area; (b) fire severity; (c) land cover with superimposed burned area perimeter.

Figure 6.
Environmental variables on wildfire 8: (a) aspect; (b) slope; (c) 50 m-buffer around streams.
Figure 6.
Environmental variables on wildfire 8: (a) aspect; (b) slope; (c) 50 m-buffer around streams.

Figure 7.
Detail of the wildfire number 8 maps with the contours of burned areas: (a) fire severity; (b) orientation; (c) slope; (d) proximity to streams.
Figure 7.
Detail of the wildfire number 8 maps with the contours of burned areas: (a) fire severity; (b) orientation; (c) slope; (d) proximity to streams.


Figure 8.
Fire recurrence for wildfire 8, expressed as the number of times that the area burned from 2001 and before the analyzed wildfires occurred.
Figure 8.
Fire recurrence for wildfire 8, expressed as the number of times that the area burned from 2001 and before the analyzed wildfires occurred.


Table 1.
Specifications of spectral bands provided by Sentinel [56].
Table 1.
Specifications of spectral bands provided by Sentinel [56].
| Band | Central Wavelength (nm) | Bandwidth (nm) | Spatial Resolution (m) |
|---|---|---|---|
| Band 1—Coastal aerosol | 443 | 20 | 60 |
| Band 2—Blue | 490 | 65 | 10 |
| Band 3—Green | 560 | 35 | 10 |
| Band 4—Red | 665 | 30 | 10 |
| Band 5—Near Infrared (NIR) | 705 | 15 | 20 |
| Band 6—NIR | 740 | 15 | 20 |
| Band 7—NIR | 783 | 20 | 20 |
| Band 8—NIR | 842 | 115 | 10 |
| Band 8A—NIR narrow | 865 | 20 | 20 |
| Band 9—Water vapor | 945 | 20 | 20 |
| Band 10—Shortwave Infrared (SWIR) (Cirrus) | 1375 | 30 | 60 |
| Band 11—SWIR | 1610 | 90 | 20 |
| Band 12—SWIR | 2190 | 180 | 20 |
Table 2.
Threshold values of dNBR (×103) and burned area for each severity level.
| Severity Class | NBR Value | Surface (ha) | Surface (%) | |
|---|---|---|---|---|
| Minimum | Maximum | |||
| Unburned area | −1200 | 200 | ||
| 2 | 200 | 270 | 1412.2 | 8.7 |
| 3 | 270 | 440 | 4878.0 | 30.0 |
| 4 | 440 | 660 | 5964.3 | 36.6 |
| 5 | 660 | 1300 | 4019.8 | 24.7 |
| Total | 16,274.3 | 100.0 | ||
Table 3.
Confusion matrix of the land-cover verification for the wildfires.
| Sentinel-Based Classification | |||||||||||
|---|---|---|---|---|---|---|---|---|---|---|---|
| Reference Classes | Rocky Area | Crops | Anthropogenic Area | Scrubland | Eucalyptus | Conifers | Broadleaves | Sea | Stream | Total | Commission Error (%) |
| Rocky area | 50 | 1 | 3 | 0 | 0 | 0 | 0 | 0 | 0 | 54 | 7.4 |
| Crops | 0 | 70 | 2 | 0 | 0 | 0 | 0 | 0 | 0 | 72 | 2.8 |
| Anthropogenic area | 2 | 5 | 48 | 0 | 0 | 0 | 0 | 0 | 0 | 55 | 12.7 |
| Scrubland | 0 | 3 | 1 | 53 | 0 | 0 | 4 | 0 | 0 | 61 | 13.1 |
| Eucalyptus | 4 | 0 | 0 | 3 | 58 | 1 | 2 | 0 | 0 | 68 | 14.7 |
| Conifers | 1 | 0 | 0 | 3 | 2 | 27 | 2 | 0 | 0 | 35 | 22.9 |
| Broadleaves | 0 | 1 | 1 | 1 | 0 | 0 | 51 | 0 | 0 | 54 | 5.6 |
| Sea | 0 | 0 | 0 | 0 | 0 | 0 | 0 | 10 | 0 | 10 | 0.0 |
| Stream | 0 | 0 | 1 | 0 | 0 | 0 | 0 | 0 | 10 | 11 | 9.1 |
| Total | 57 | 80 | 56 | 60 | 60 | 28 | 59 | 10 | 10 | 420 | |
| Omission error (%) | 12.3 | 12.5 | 14.3 | 11.7 | 3.3 | 3.6 | 13.6 | 0 | 0 | ||
| Overall accuracy (%) | 89.8 | ||||||||||
Table 4.
Relative land-cover values for each severity class (%).
| Land Cover | Fire Severity Class | Area-Weighted Average Fire Severity | |||
|---|---|---|---|---|---|
| 2 | 3 | 4 | 5 | ||
| Rocky area | 13.8 | 17.0 | 24.7 | 18.7 | 3.9 |
| Crops | 12.4 | 7.9 | 5.3 | 2.5 | 3.3 |
| Anthropogenic area | 6.6 | 4.2 | 2.6 | 1.2 | 3.3 |
| Scrubland | 9.7 | 11.9 | 20.3 | 25.8 | 4.1 |
| Eucalyptus | 26.7 | 32.0 | 27.2 | 32.4 | 3.8 |
| Conifers | 13.1 | 12.3 | 9.0 | 10.7 | 3.7 |
| Broadleaves | 17.7 | 14.7 | 11.0 | 8.7 | 3.6 |
| Total (%) | 100 | 100 | 100 | 100 | 3.8 |
Table 5.
Relative values of aspect in relation to area for each fire severity (%).
| Aspect of the Burned Surface | Fire Severity Class | Area-Weighted Average Fire Severity | |||
|---|---|---|---|---|---|
| 2 | 3 | 4 | 5 | ||
| 315°–45° | 27.0 | 26.6 | 20.9 | 15.8 | 3.6 |
| 45°–135° | 20.6 | 20.2 | 21.6 | 26.2 | 3.9 |
| 135°–225° | 21.5 | 21.4 | 23.7 | 24.7 | 3.8 |
| 225°–315° | 31.9 | 32.8 | 34.5 | 33.7 | 3.8 |
| Total | 100 | 100 | 100 | 100 | |
Table 6.
Relative values of slope in relation to area for each fire severity (%).
| Slope (%) | Fire Severity Class | Area-Weighted Average Fire Severity | |||
|---|---|---|---|---|---|
| 2 | 3 | 4 | 5 | ||
| 0–20 | 39.3 | 36.2 | 34.7 | 31.8 | 3.0 |
| 20–40 | 35.2 | 38.1 | 40.0 | 43.0 | 3.0 |
| 40–60 | 17.2 | 18.1 | 18.2 | 19.3 | 3.0 |
| >60 | 9.2 | 8.5 | 7.7 | 6.2 | 3.0 |
| Total | 100 | 100 | 100 | 100 | 3.0 |
Table 7.
Relative values of the proximity to streams in relation to area for each fire severity (%).
Table 7.
Relative values of the proximity to streams in relation to area for each fire severity (%).
| Proximity to the Closest Stream | Fire Severity Class | Area-Weighted Average Fire Severity | |||
|---|---|---|---|---|---|
| 2 | 3 | 4 | 5 | ||
| >50 m | 86 | 88 | 90 | 91 | 3.7 |
| ≤50 m | 14 | 12 | 10 | 9 | 3.6 |
| Total | 100 | 100 | 100 | 100 | |
Table 8.
Relative values of the land cover in relation to area for each level of proximity (%).
| Land Cover | Distance to Nearest Stream | |
|---|---|---|
| >50 m | ≤50 m | |
| Rocky area | 10.4 | 20.9 |
| Crops | 7.3 | 5.9 |
| Anthropogenic area | 2.8 | 3.2 |
| Scrubland | 16.1 | 18.2 |
| Eucalyptus | 30.9 | 29.4 |
| Conifers | 5.5 | 11.3 |
| Broadleaves | 27.0 | 10.3 |
| Total | 100 | 100 |
Table 9.
Relative values of fire recurrence in relation to area for each fire severity (%).
| Fire Recurrence | Fire Severity Class | Area-Weighted Average Fire Severity | |||
|---|---|---|---|---|---|
| 2 | 3 | 4 | 5 | ||
| No fire occurred | 52.1 | 40.3 | 23.5 | 11.6 | 3.3 |
| 1 fire | 28.9 | 35.4 | 36.4 | 33.2 | 3.8 |
| 2 fires | 17.0 | 21.2 | 34.9 | 47.8 | 4.1 |
| 3 fires | 2.1 | 3.1 | 5.3 | 7.4 | 4.1 |
| Total | 100 | 100 | 100 | 100 | |
Table 10.
Relative values of fire severity in relation to area for each level of fire recurrence (%).
Table 10.
Relative values of fire severity in relation to area for each level of fire recurrence (%).
| Fire Recurrence | Fire Severity Class | Total | |||
|---|---|---|---|---|---|
| 2 | 3 | 4 | 5 | ||
| No fire occurred | 16.3 | 42.9 | 30.6 | 10.2 | 100 |
| 1 fire | 7.2 | 30.4 | 39.0 | 23.5 | 100 |
| 2 fires | 4.5 | 20.3 | 38.9 | 36.3 | 100 |
| 3 fires | 3.7 | 19.2 | 39.7 | 37.4 | 100 |
© 2019 by the authors. Licensee MDPI, Basel, Switzerland. This article is an open access article distributed under the terms and conditions of the Creative Commons Attribution (CC BY) license (http://creativecommons.org/licenses/by/4.0/).
Share and Cite
MDPI and ACS Style
Picos, J.; Alonso, L.; Bastos, G.; Armesto, J. Event-Based Integrated Assessment of Environmental Variables and Wildfire Severity through Sentinel-2 Data. Forests 2019, 10, 1021. https://0-doi-org.brum.beds.ac.uk/10.3390/f10111021
AMA Style
Picos J, Alonso L, Bastos G, Armesto J. Event-Based Integrated Assessment of Environmental Variables and Wildfire Severity through Sentinel-2 Data. Forests. 2019; 10(11):1021. https://0-doi-org.brum.beds.ac.uk/10.3390/f10111021
Chicago/Turabian StylePicos, Juan, Laura Alonso, Guillermo Bastos, and Julia Armesto. 2019. "Event-Based Integrated Assessment of Environmental Variables and Wildfire Severity through Sentinel-2 Data" Forests 10, no. 11: 1021. https://0-doi-org.brum.beds.ac.uk/10.3390/f10111021
Note that from the first issue of 2016, this journal uses article numbers instead of page numbers. See further details here.