Deforestation Processes in the Polish Mountains in the Context of Terrain Topography
by
 , and
, and
Radomir Bałazy
1,*, 
Mariusz Ciesielski
1,
Patryk Waraksa
1,
Michał Zasada
2 and
Tomasz Zawiła-Niedźwiecki
3 1
Department of Geomatics, Forest Research Institute, Sękocin Stary, 05-090 Raszyn, Poland
2
Institute of Forest Sciences, Warsaw University of Life Sciences-SGGW, Nowoursynowska 166, 02-787 Warszawa, Poland
3
State Forests - Coordination Center for Environmental Projects, ul. Bitwy Warszawskiej 1920 r. nr 3, 02-362 Warszawa, Poland
*
Author to whom correspondence should be addressed.
Forests 2019, 10(11), 1027; https://0-doi-org.brum.beds.ac.uk/10.3390/f10111027
Submission received: 15 October 2019
/
Revised: 7 November 2019
/
Accepted: 13 November 2019
/
Published: 14 November 2019
(This article belongs to the Section Forest Inventory, Modeling and Remote Sensing)
Abstract
:In the 1980s, the Western Sudety Mountains were affected by a forest dieback process, resulting in large-scale deforestation covering an area of about 15,000 ha. A similar phenomenon is presently being observed in the Western Beskidy and Eastern Sudety Mountains, where the course of the process and the final effects are similar. The presented study analyzed the relationships between forest dieback processes today and in the past. Among others, the impact of the following factors was examined: exposure, slope, altitude, and topographic index, which was generated based on the airborne LIDAR (also airborne laser scanning abbreviated as ALS) data. The identification of forest dieback areas in the past was carried out based on the archived Landsat satellite imagery, as well as data obtained from the Polish State Forests. The identification of forest dieback areas at present was carried out based on the ALS data (single-tree detection approach) and color infrared aerial images. In the study, inter-dependencies between forest dieback today and in the past were compared. The performed analyses show significant differences between forests’ dieback specifics in all three areas. The process first occurred at 800–900 m a.s.l., and afterwards at over 900 m. Mortality was especially intensive on the western and southwestern slopes. Below 700 m a.s.l., forests survived quite well. In the 1980s, significantly higher concentrations of hazardous chemical compounds were noted, which resulted in respectively greater deforestations on aspects open to the operation of prevailing winds (mainly west). Nowadays, a proportionately higher number of trees die on the southern aspects, which is particularly visible in the Western Sudety Mountains.
1. Introduction
Forest dieback processes were observed in Central Europe at least in the late 1970s, which were assigned to various factors, including air pollution [1,2], heavy metals [3], secondary pests, in particular bark beetles [4,5,6], climate warming [7,8], atmospheric conditions [9,10], drought [11], and finally ambient ozone, increasingly being recognized as the cause of the forest damage [12]. In the 1980s, Manion [13] described all the above-cited multiple factors, which caused the massive dieback of spruce (Picea abies (L.) H. Karst), as a “spiral disease”. There is still discussion on which of them were initiating and which were predisposing or participating in the massive dieback of spruce. Even if the roles of the specific factors are still under investigation, researchers agreed that air pollution triggered the whole range of different stress factors [7,14]. Some authors [15] indicated that land topography influenced the pollution and accumulation of heavy metals in the soil and conifer needles and finally caused the decreasing annual growth and die-off of the stands.
The dependencies between terrain topography and forest dieback in the Western Sudety Mountains (WSM) have been analyzed by various authors since the late 1980s [16,17,18,19,20]. It should be noticed that also other studies leaded in Beskidy confirmed the relation between terrain relief and forest condition [21]. Although many studies confirmed negative roles of different factors in initiating and shaping the dieback phenomenon, there is still unknown why some groups of spruce stand survived and some other do not. Even more, we do not exactly know if these forest dieback processes and patterns occurring today and in the past differ or not. Nowadays, however, thanks to archival remote sensing data, forest databases, and currently available remote sensing data, it is possible to compare the forest dieback processes in different points in time. In Poland, such data are present in the form of aerial photographs and databases [22] and archival resources of various institutions, i.e., Polish State Forests, the Institute of Geodesy and Cartography [23,24]. Due to the digitalization of the data and the linking of it to the geographic information systems (GIS), it is possible to determine the historical range of deforestation and to compare the dieback processes and their intensities today and in the past.
The purpose of the study was to analyze the spruce dieback process in the mountain areas. The research focused on three aspects:
- Determining the impact of topographic factors such as the elevation above sea level, aspect, and land slope on the spruce stands’ dieback in the WSM in the 1980s, as well as in the WBM in the period of 2005–2010—historical (past) deforestation;
- Determining the impact of topographic factors on the spruce stands’ dieback in three areas of the WSM, the ESM, and the WBM—current situation;
- Comparing the spruce stands’ dieback processes in the mountain areas in the past and nowadays.
2. Materials and Methods
2.1. Study Area
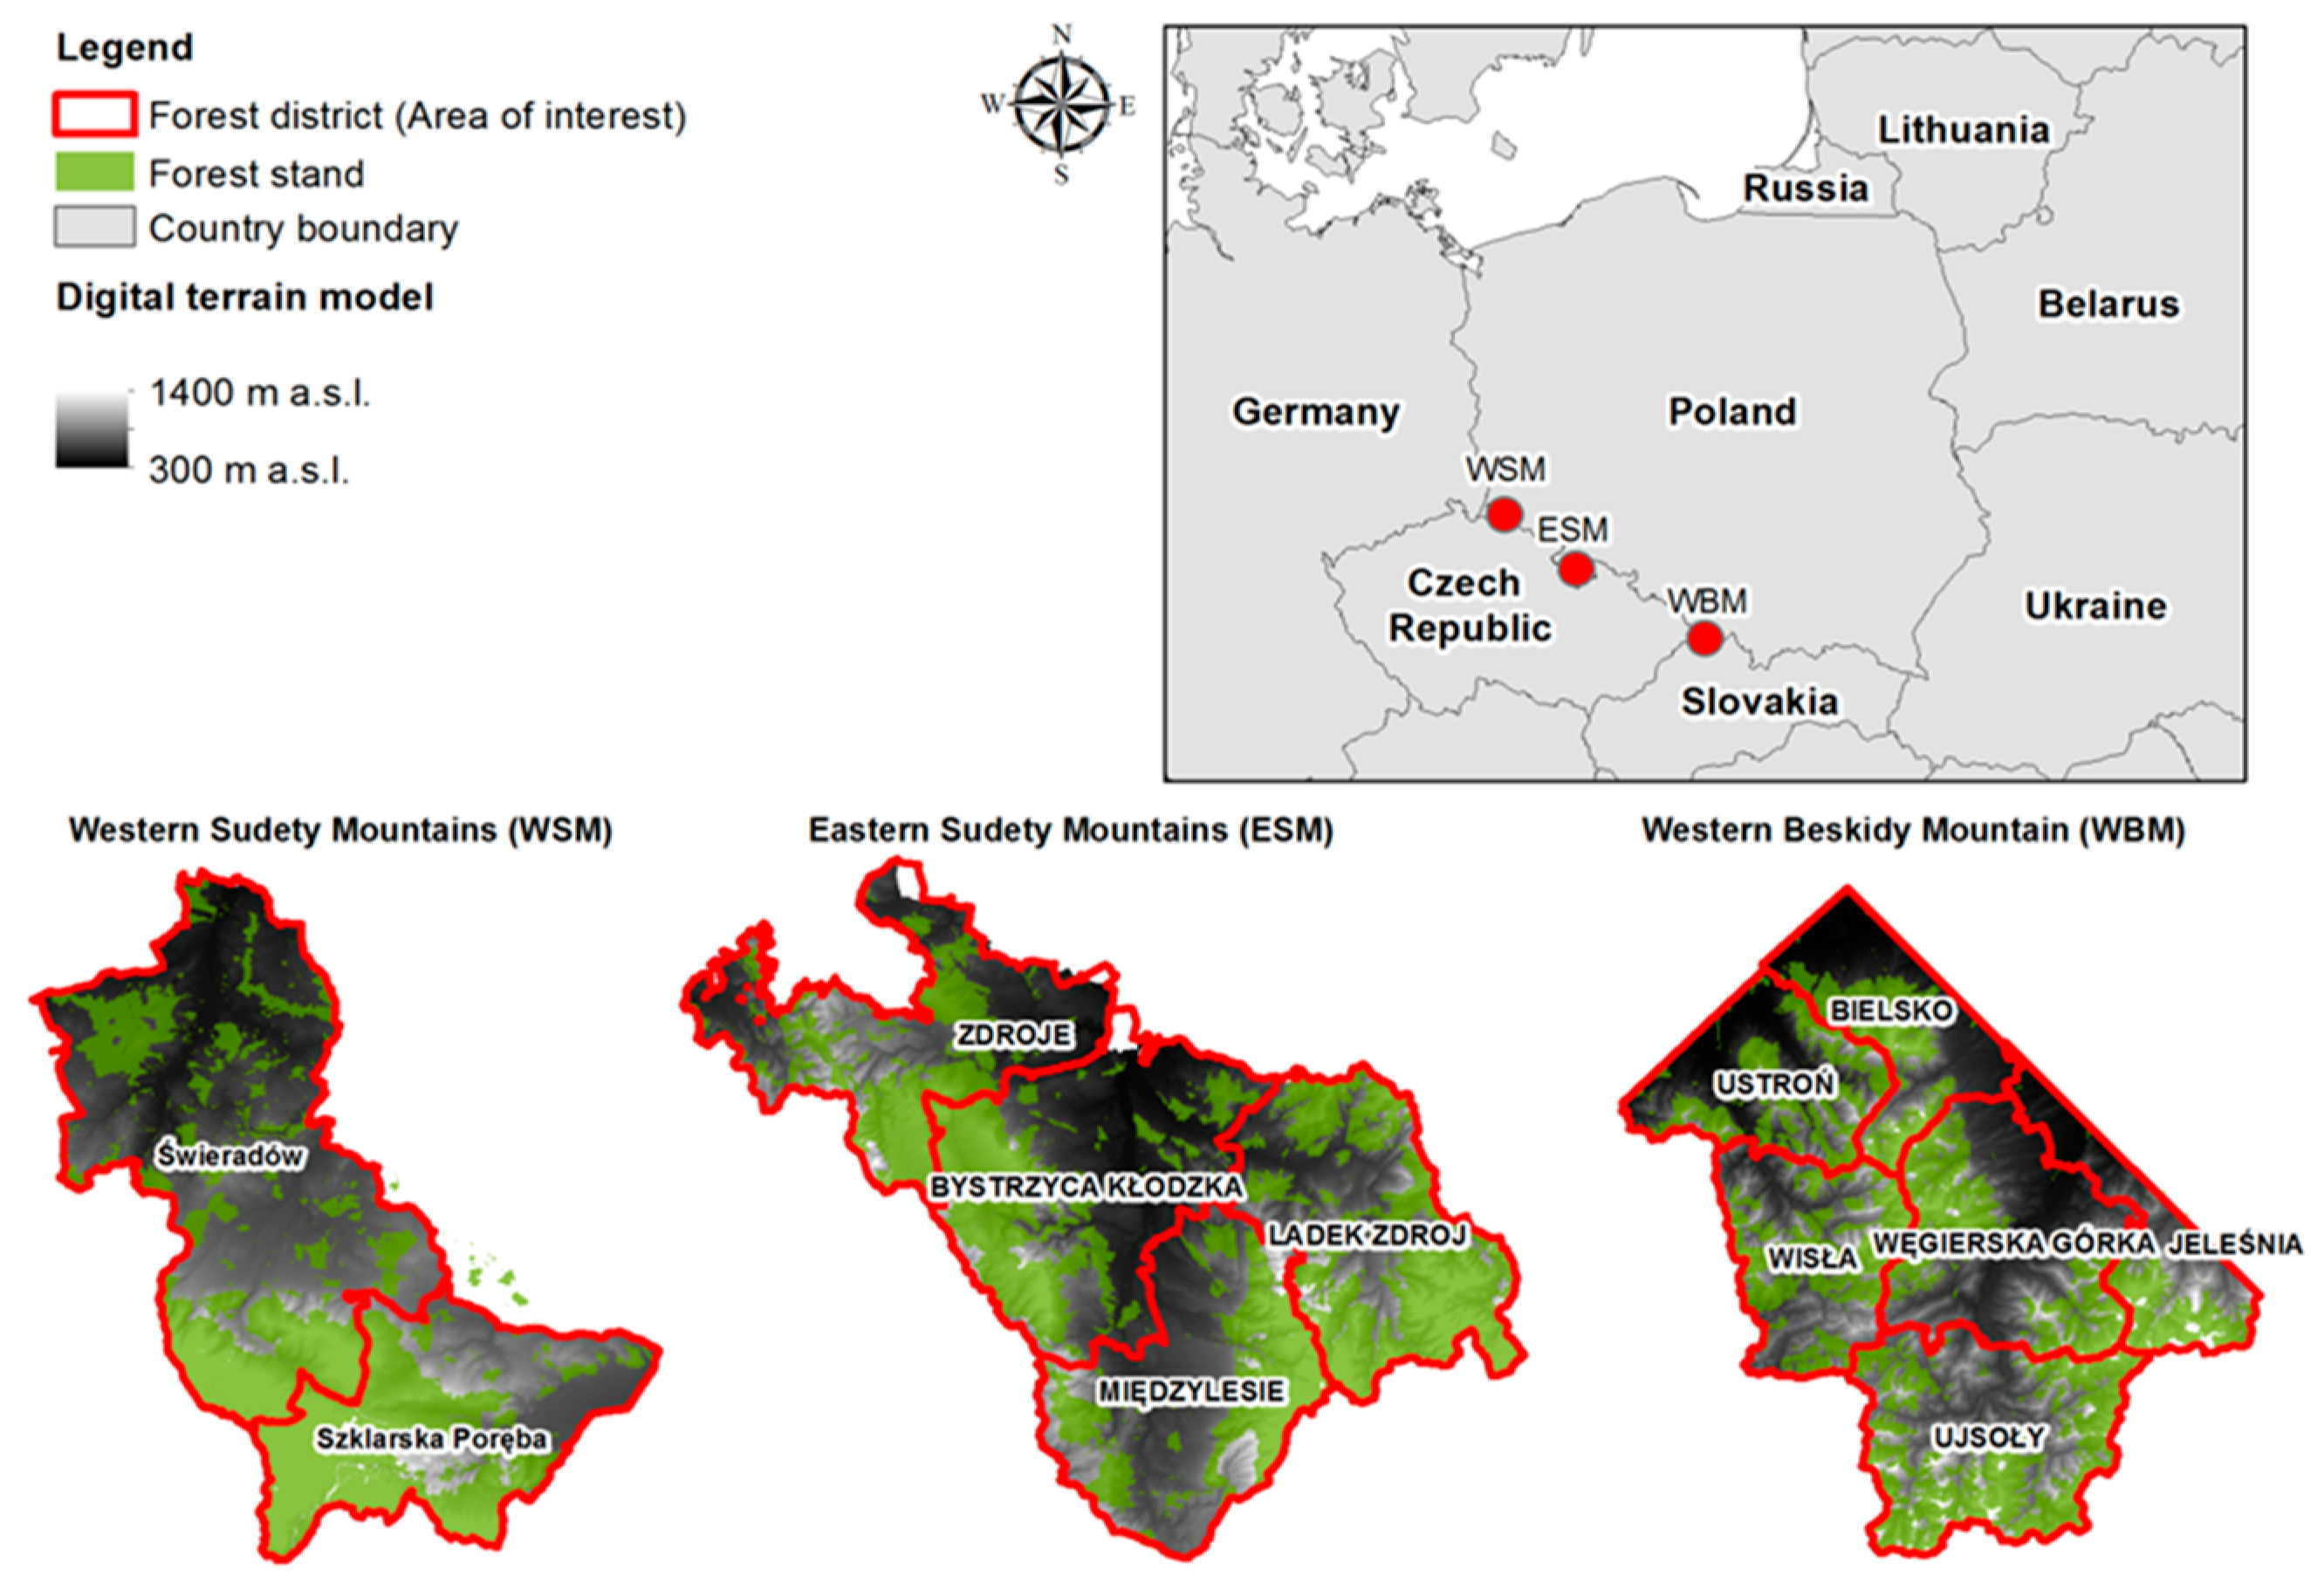
The analyses were carried out in three research areas located in the southern and southwestern parts of Poland along the Czech and Slovak borders: the WSM (area: 70.5 thousand ha), the Eastern Sudety Mountains (ESM: area: 118 thousand ha), and the Western Beskidy Mountains (WBM; area: 175.6 thousand ha) (Figure 1).
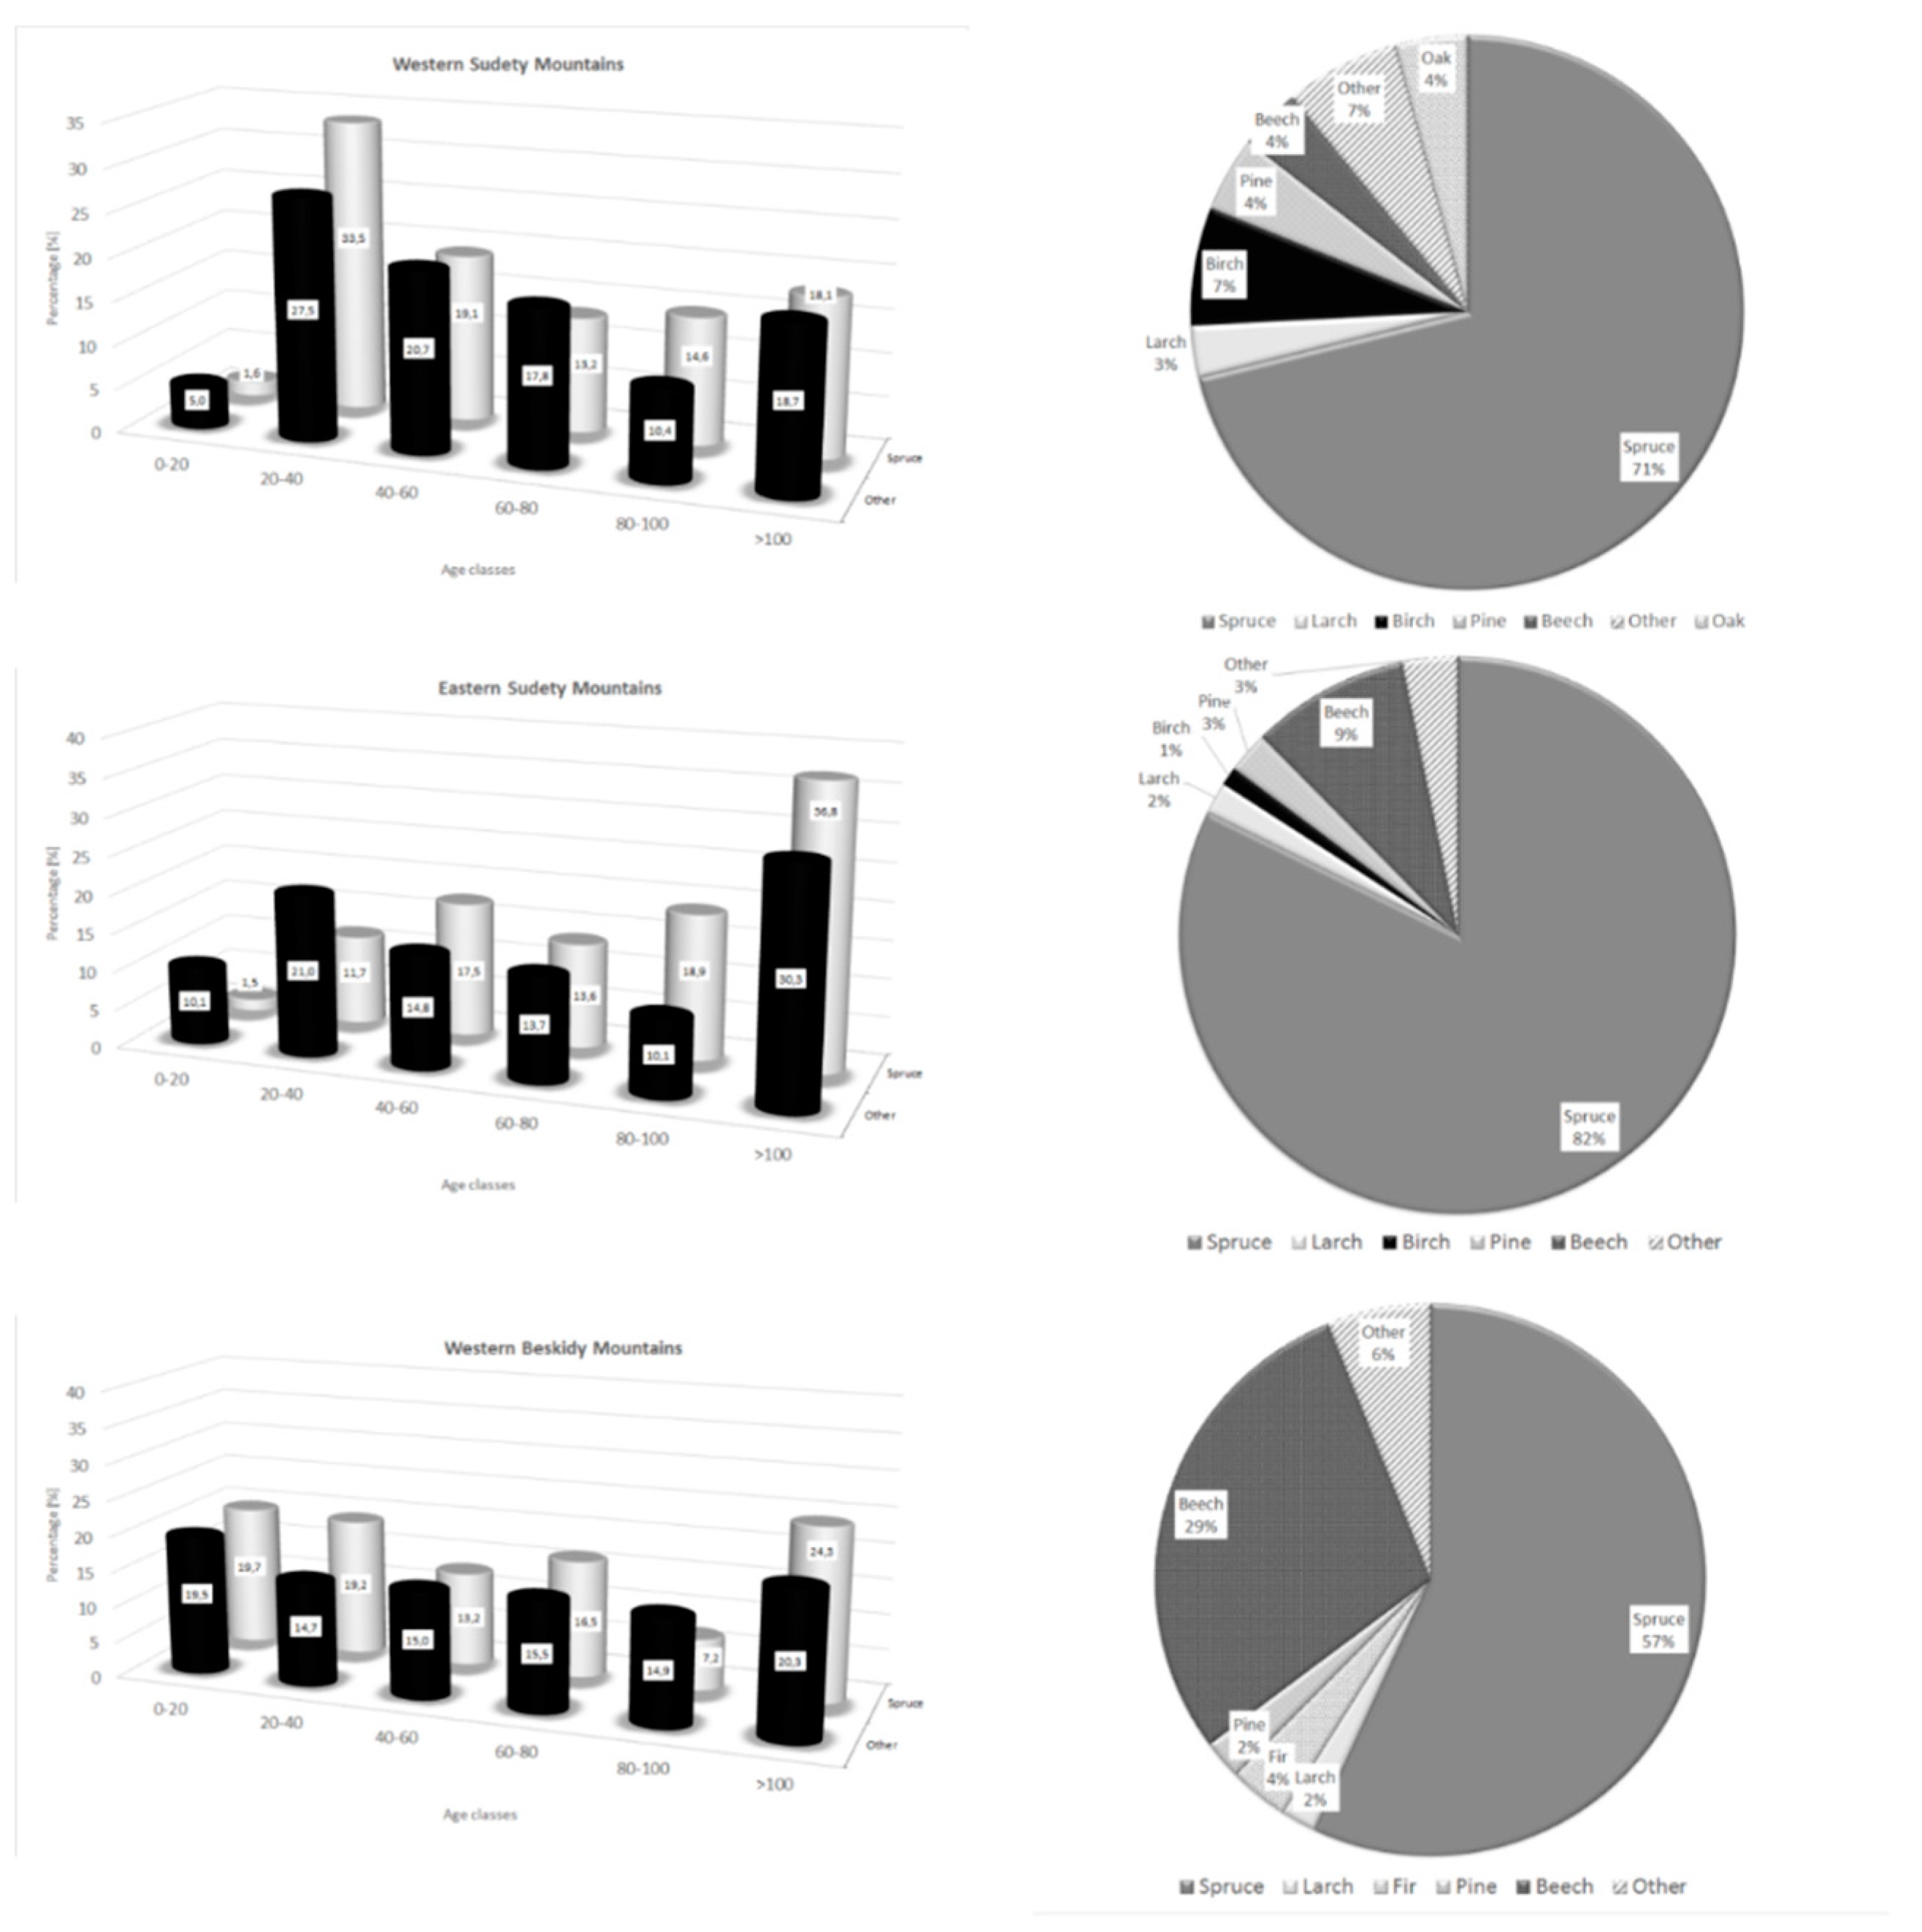
Apart from the geographic variation, the course of processes of spruce dieback was taken into account when considering the study area as three separate case studies. As a consequence, different species compositions, especially the share of Norway spruce, was observed in different mountain ranges (Figure 2). In the WSM, the ecological disaster commenced in the late 1970s, and its consequences had not ceased until 2005. In total, it affected 1667 sub-compartments of the total area of 7592 ha (26.7% of the total number of forest stands). Forest stands distorted in the past centuries by man because of industrialization (broadleaf forests were replaced mainly by spruces), and then heavy air pollutants in the 1970s and the 1980s, together with insects, caused deforestation on a mass scale. In the WBM, 4004.22 ha of forest have been cut in 606 sub-compartments. A constantly decreasing, but still high level of, spruce destruction has been observed in the WBM [25]. Forests in all the three areas are managed mostly by the Polish State Forests National Forest Holding [26].
2.2. Remote Sensing Data
The diversity of study areas imposed the application of several sets of remote sensing and spatial data for respective analysis periods. The analyses of tree stands’ dieback in the past for the areas of the WSM and the WBM were carried out with the use of information from the State Forests Information System (SILP) and the Landsat data (the WSM), whereas the current dieback and the evaluation of health conditions were carried out with data from the orthophotomaps (Figure 3.).
2.3. GIS and Remote Sensing Data Analysis
2.4. Historical Data of Health Conditions for the WSM and the WBM
SILP data constituted a basis for the historical analyses performed for the WSM and the WBM research areas. The assumptions for the research were made based on the information drawn from the Landsat satellite imagery (acquired in the 1980s), database (information about deforestation), and information received from the State Forests’ units, and they were published as a result of scientific research. Health and sanitary conditions of forests (historical analysis) in the Sudety were assessed based on IRC aerial photographs (Kodak film), allowing mapping three categories of health status, dead trees, deforestations, and renewals. Afterwards, this material as well as field verification was used to supervise classifications of Landsat TM imageries based on ERDAS software. In order to analyze the dieback of tree stands in the past, it was assumed that the areas, where the die-off process took place, were all polygons representing tree stands located in the WSM. The examined tree stands were the ones, which reached the age of 14–34 years in 2014 in the WSM, as well as all tree stands that have been established since 2005 in the WBM, i.e., those that were dead or significantly weakened in the historical periods 1980–1984 in the WSM and 2005–2010 in the WBM.
2.5. Present Data of Health Conditions for All Regions
The detection of dead and weakened trees was based on the composed color infrared aerial images (acquired in 2012 with a 20 cm resolution), consisting of green, red, blue, and infrared spectral channels. The detection process was conducted in two stages. The first stage was to conduct the supervised classification using the maximum likelihood method [27]. For the purpose of classification, a total of 1800 training areas (based on aerial photos acquired in 2012) were chosen and divided into two classes: trees in good condition and weakened or dead trees. In the next step, results of the classification were processed for an additional accuracy assessment. Afterwards, 1200 control points (from the three study areas), which represented weakened and dead trees, were randomly generated. In the next step, a layer representing control points was intersected with polygon layers containing information about weakened and dead trees obtained in the first step of analysis. The results have shown that trees (weakened and dead) were classified with a very high accuracy of 97%. In all the three study areas, the following numbers of the weakened and dead trees were estimated: 7334, 14,814, and 183,748 out of 10,425,776, 15,952,222, and 12,354,796 trees, respectively. The processes of the supervised classification and accuracy control were performed with Envi 5.0 software by Exelis (5.0, Herndom, Virginia, United States).
2.6. Topographic Data for Historical and Present Analyses
A digital terrain model (DTM) developed based on the data from the airborne laser scanning (ALS) had a spatial resolution of 0.5 m and covered all the three research areas. Information was acquired using a DMCII digital airborne camera (Leica Geosystems AG, Heerbrugg, Switzerland) and a RIEGL airborne laser scanner (LMS-Q680i, Horn, Austria) in July and August 2012. The ALS data had an average density of around 6 points per square meter, an average altitude error up to 15 cm, and an average error in grid coordinates less than 20 cm. The DTM was used for generating the slopes presented in classes of up to 5%, 5%–10%, 10%–15%, 15%–20%, 20%–25%, and >25%. An aspect raster was produced based on the DTM with a 100 m spatial resolution. This allowed us to obtain the detailed information on the entire parts and slopes, not just on a local aspect.
2.7. Development of Database
Information regarding topographic variables, such as the average altitude above sea level, the average land slope, and the dominating aspect, was assigned to all sites classified as historical deforestations for the WSM and the WBM areas. The identical information was assigned to trees, which were significantly weakened or dead in 2012 on all the three analyzed areas.
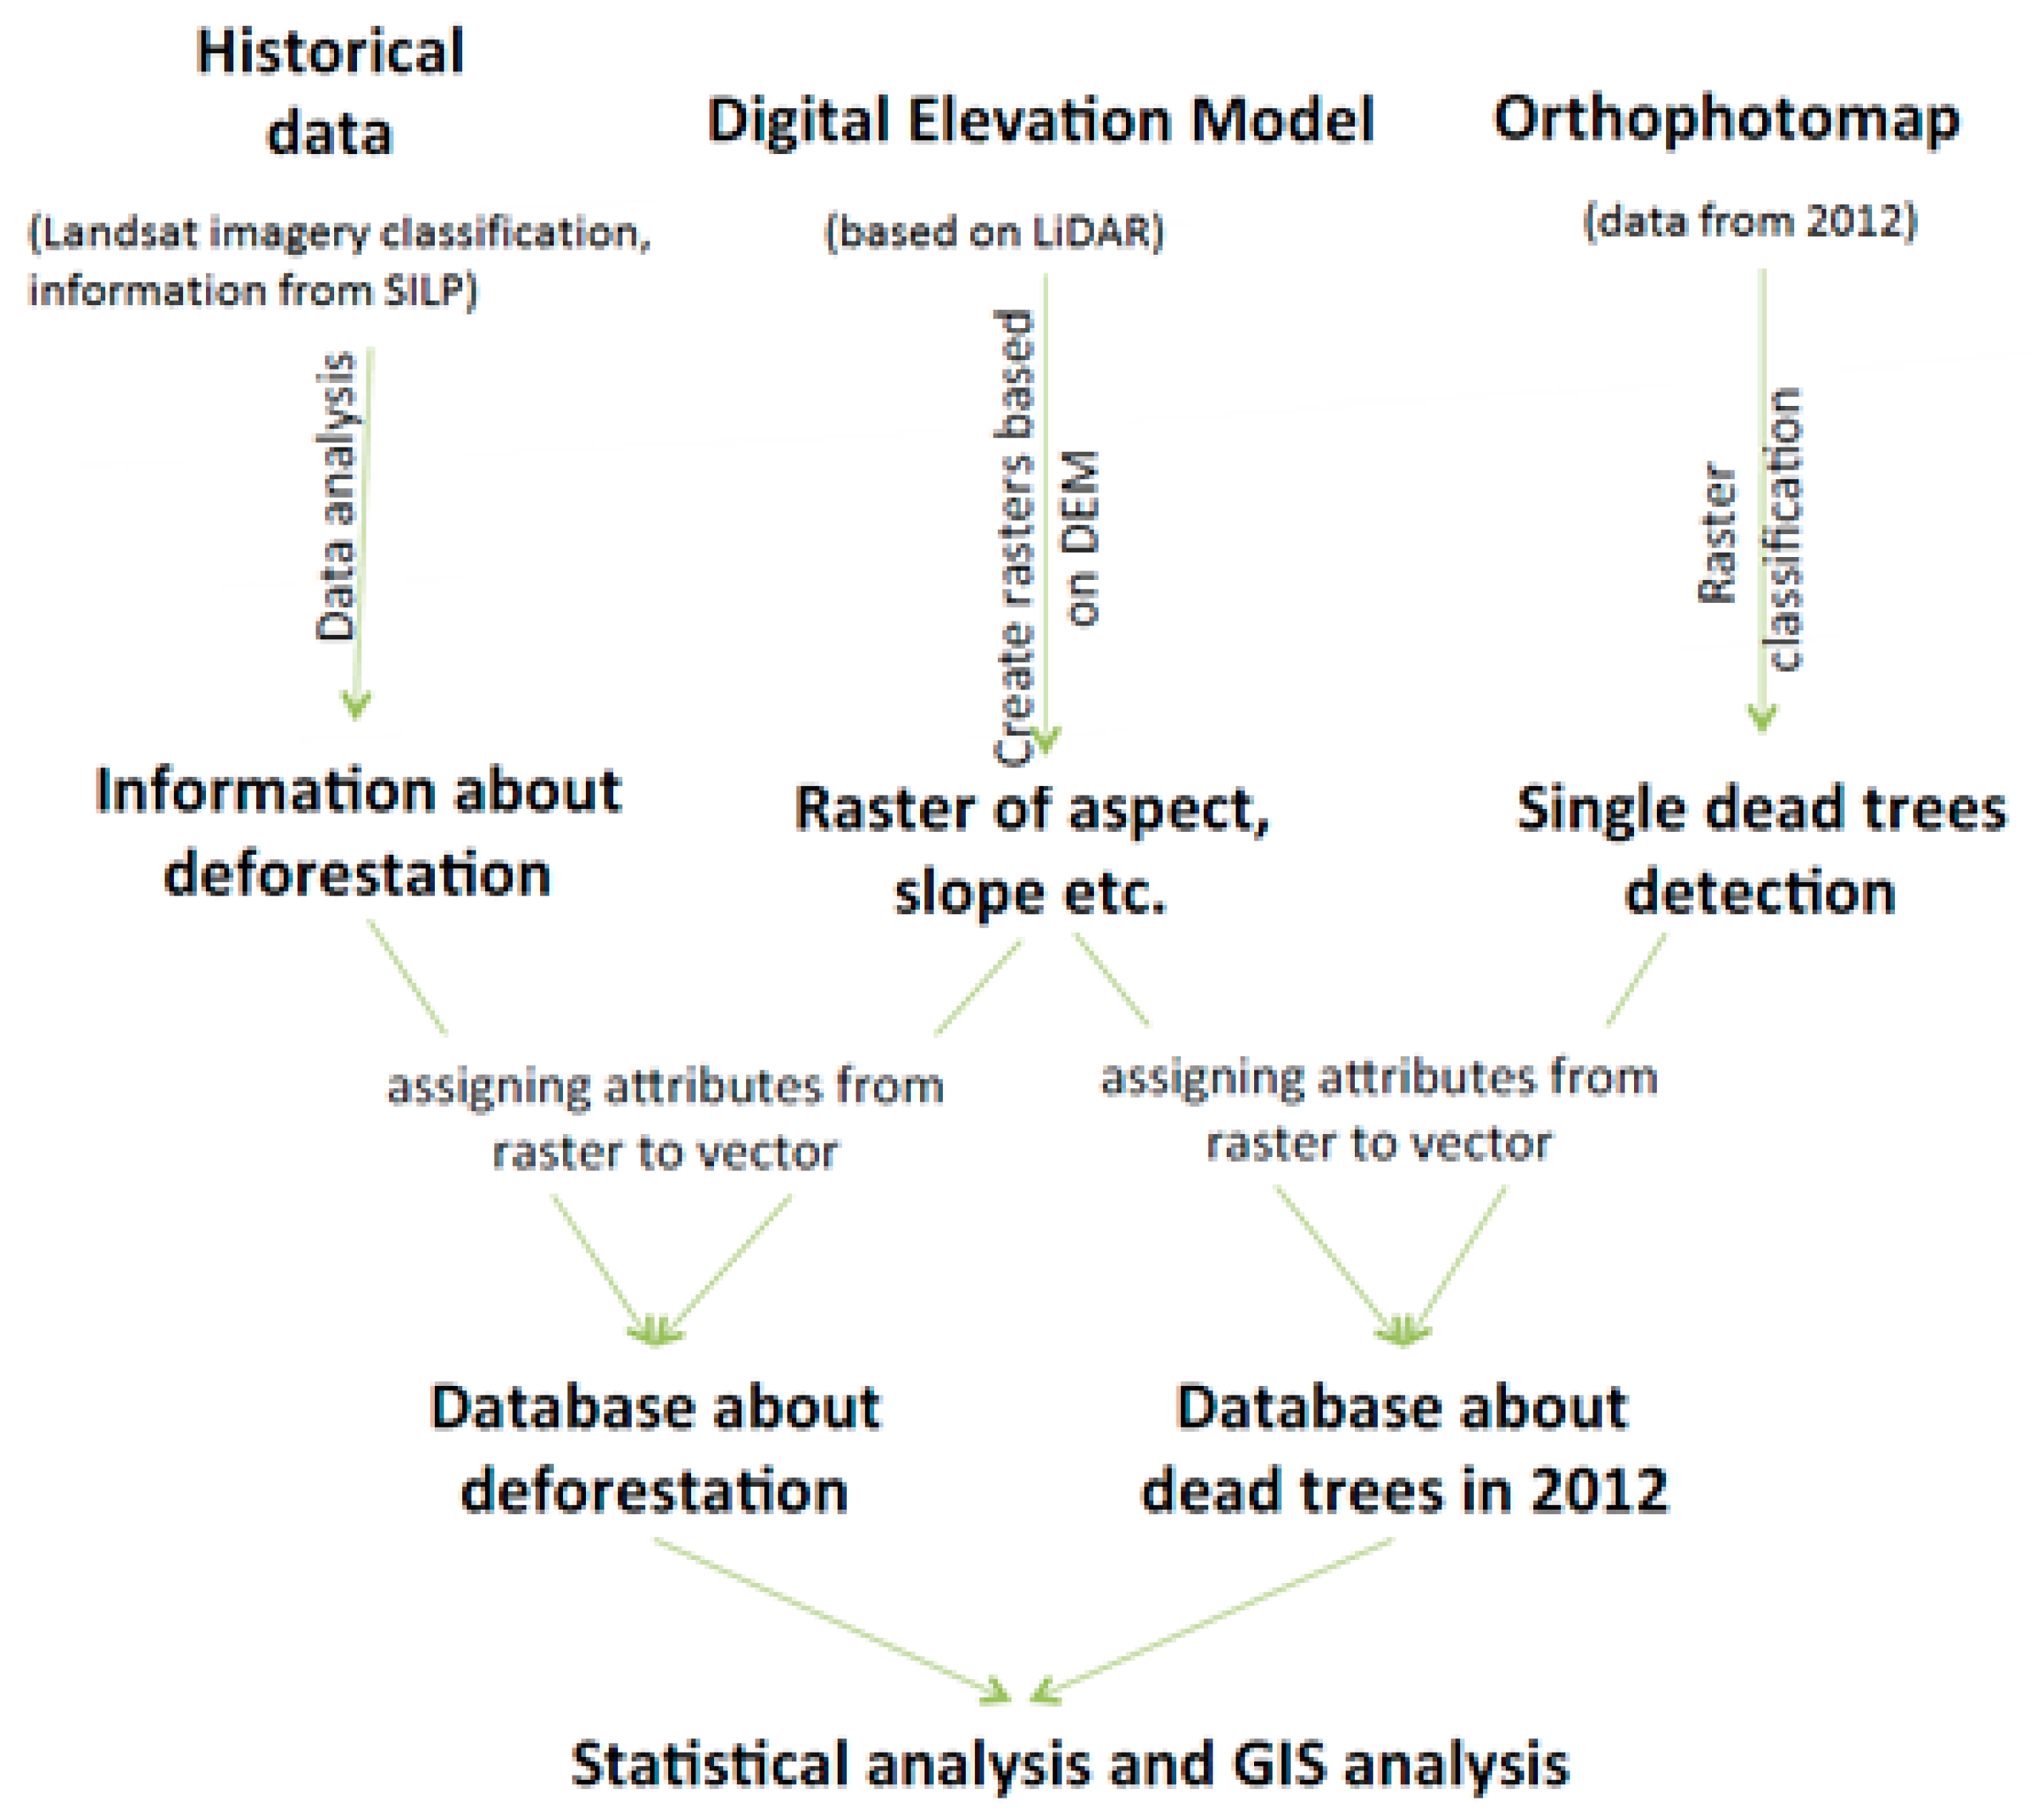
The acquired multiple source data have been processed pursuant to a scheme shown in Figure 4, assigning the detailed information regarding the elevation above sea level, slope, and exposure, respectively.
2.8. Statistical Analysis
The degree of the damage associated with every stand of the area of interest was defined as a ratio of the number of damaged trees (for the current period) to the total number of trees in the area of interest or a ratio of the area (for the historical data) to the total forested area. The significance of the differences in the percentage share of damaged trees (current data) or damaged area (historical data) was examined using a proportion test [28,29], and differences between the distribution of features for the past and present situations were examined using a Chi-square test [30]. All the analyses were performed using the prop.test and chisq.test functions of stats package in R software [31] at a 0.05 significance level. To illustrate the differences in the damage for various terrain characteristics, radar charts were applied [32,33].
3. Results
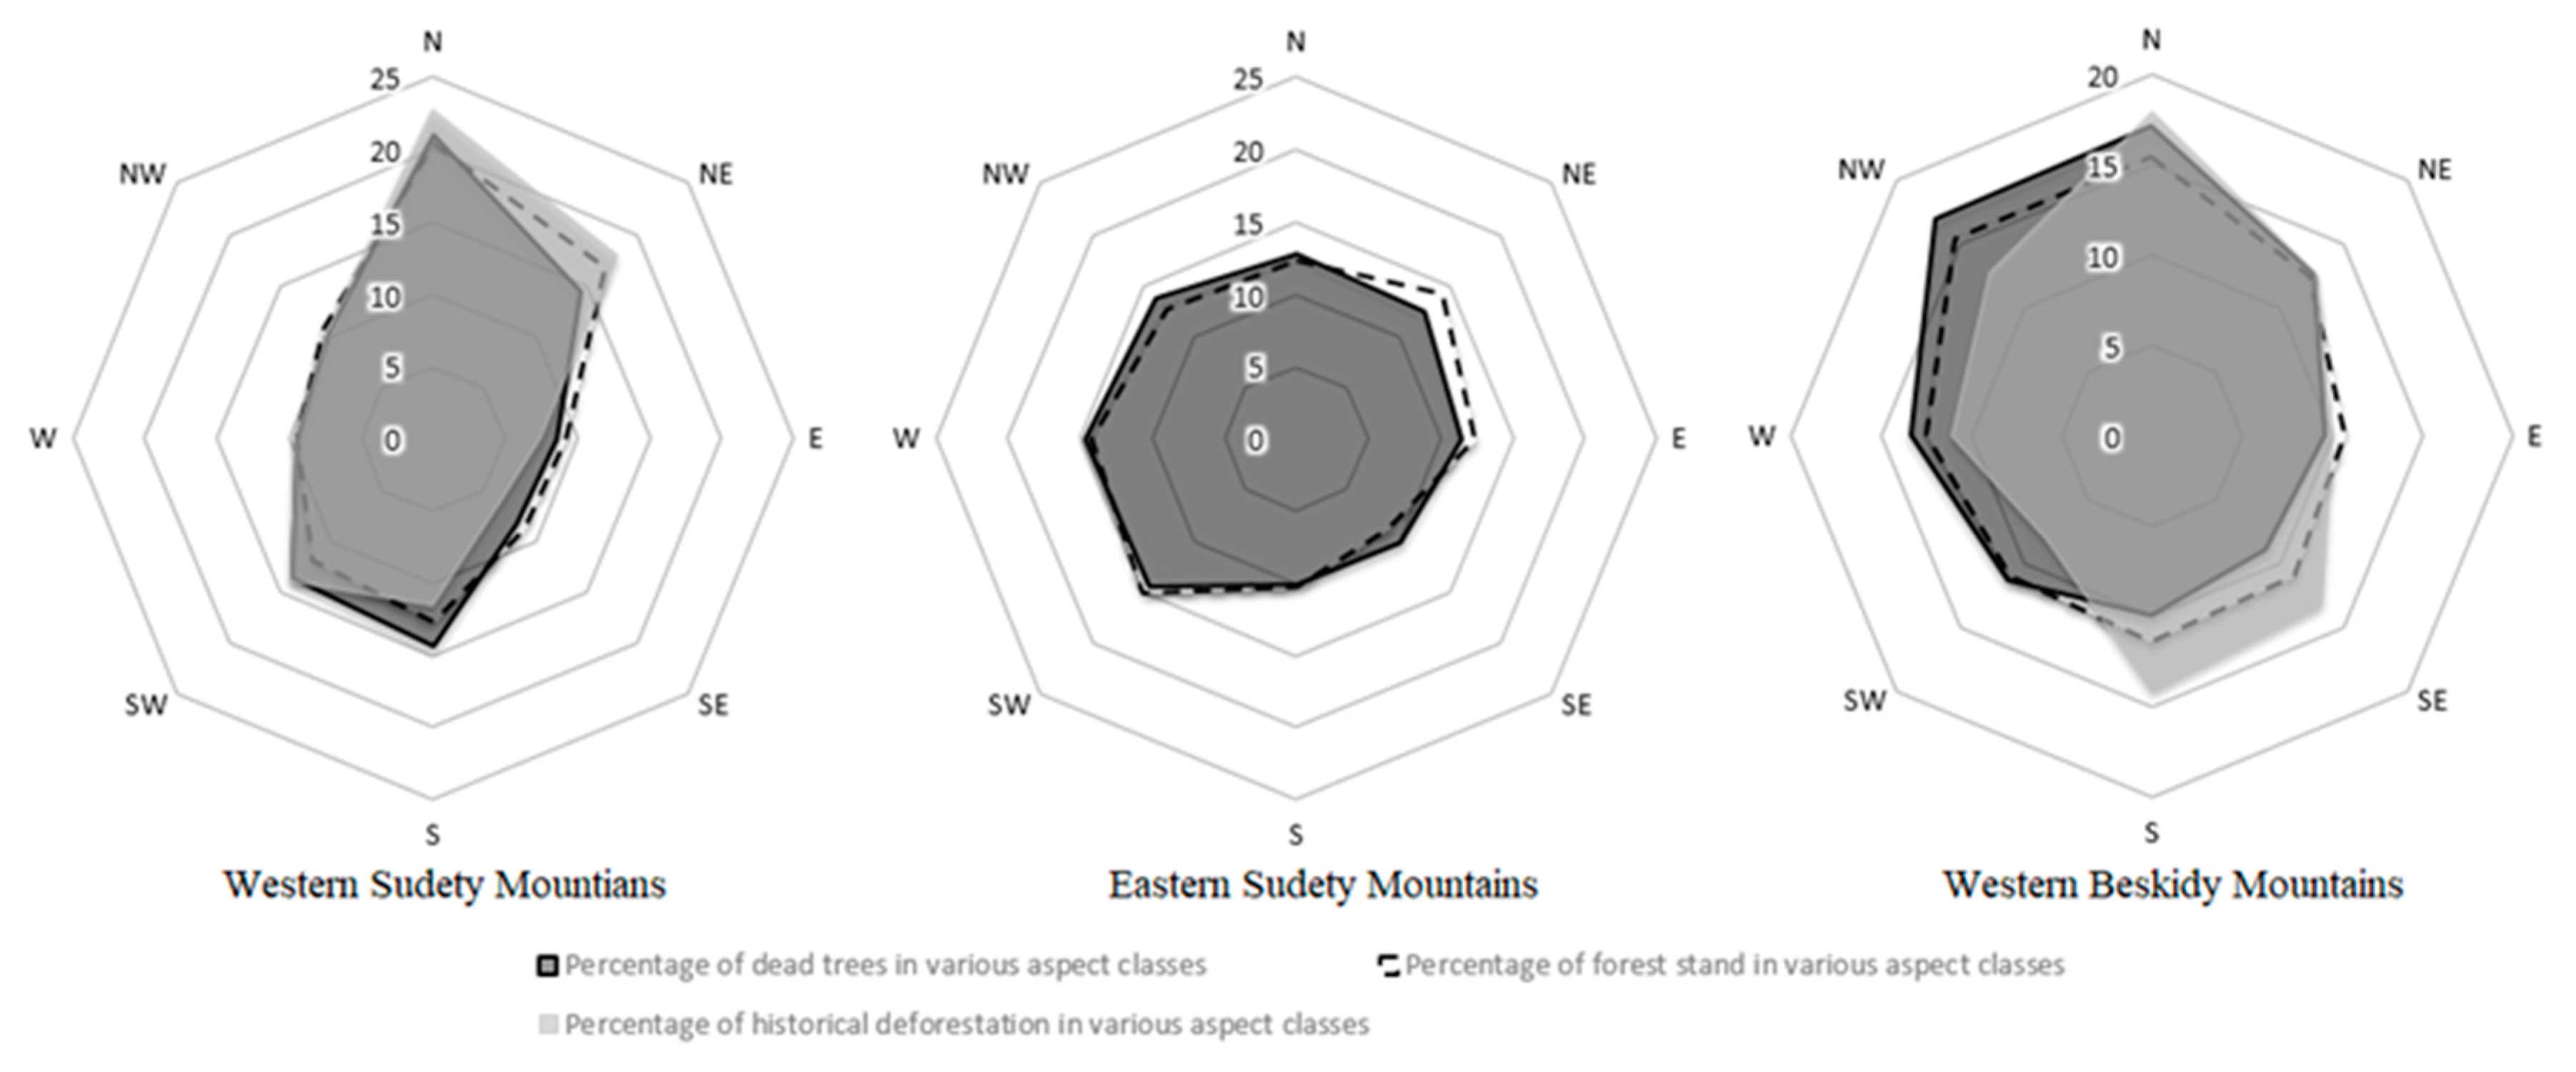
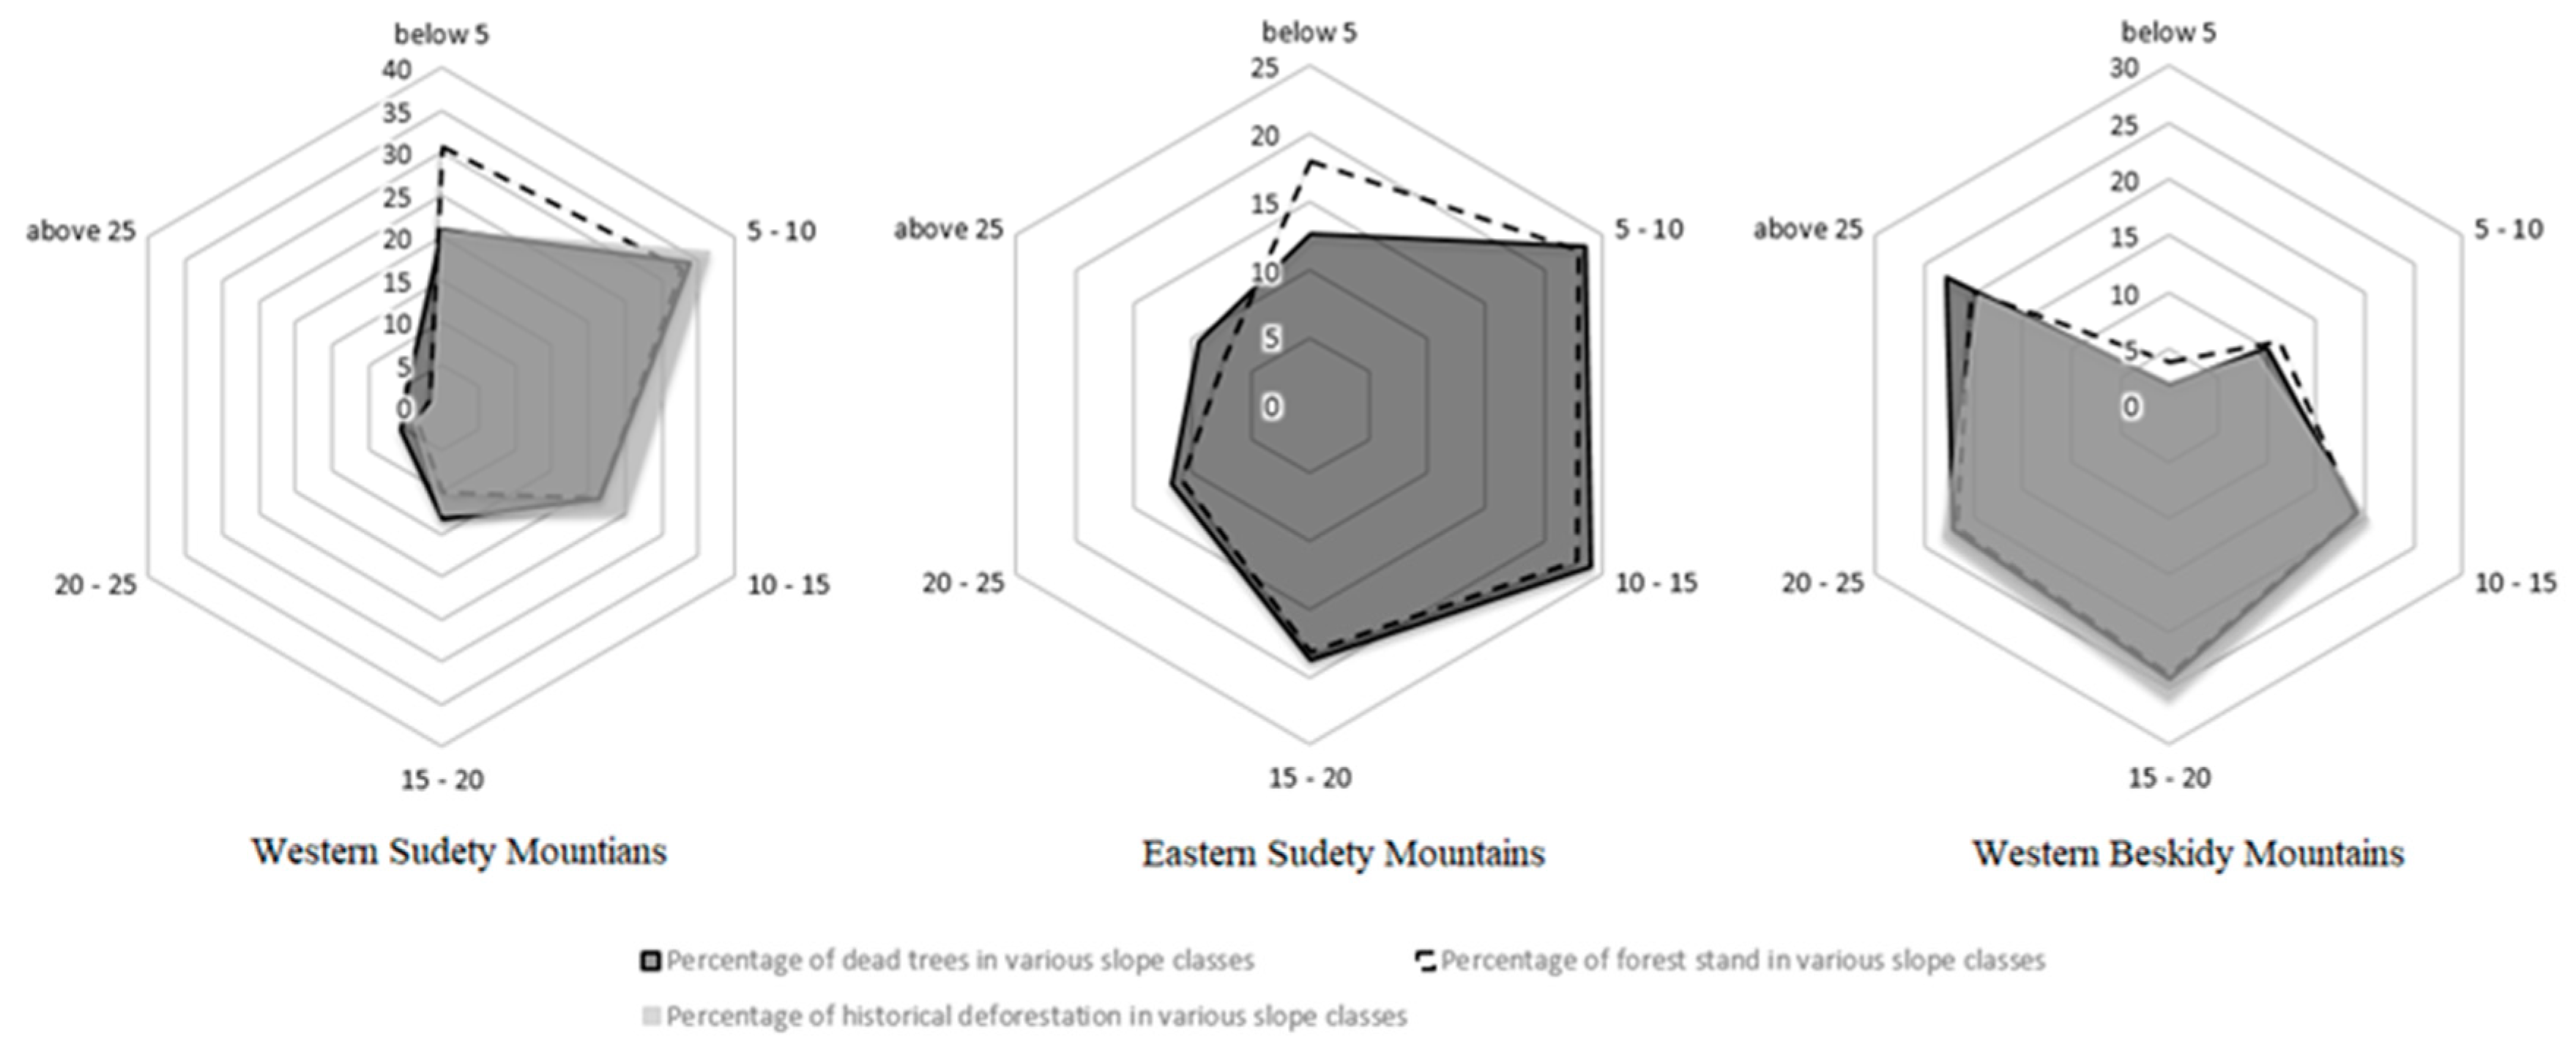
Based on the analyzed data related to the current health conditions of trees in all the three areas (Figure 5, Figure 6 and Figure 7), the greatest percentage share of dead trees were observed on the slopes of 5–10 degrees in the WSM (33.9%; Figure 7), on the slopes of 5–10 and 10–15 degrees in the ESM (23.4% and 23.9% respectively; Figure 7), and on the slopes of 15–20 degrees in the WBM (24.28%; Figure 7). The distributions of percentage shares of the dead trees in the slope classes varied significantly between the analyzed areas (p < 0.0001). The largest share of dead trees was found on the northern slopes (21.0%) in the WSM, on the western and southwestern slopes (14.5% and 14.7% respectively) in the ESM, and on the northern and northeastern slopes (17.1% and 17.0% respectively; Figure 5) in the WBM. The distributions of percentage shares of dead trees on different slope classes also varied significantly between areas (p < 0.0001).
It was stated upon the analysis of historical data that, similar to nowadays, the largest percentage of dead trees was observed in the WSM on the slopes of 5–10 degrees (37%; Figure 7) and in the WBM on the slopes of 15–20 degrees (30.9%; Figure 7). The distributions of percentage shares of dead trees in slope classes varied significantly between areas (p < 0.0001). In the WSM, the greatest shares of drawn-out points relating to damaged areas were in the classes 800–900 and 900–1000 meters above sea level (26.6% and 25.6% respectively; Figure 6), and in the WBM, the greatest share of drawn-out points relating to damaged areas was in the class of 800–900 meters above sea level (27.3%; Figure 6). The distributions of percentage shares of dead trees in height classes varied significantly between areas (p < 0.0001). The greatest shares of dead trees in the WSM and the WBM were observed on the northern slopes (24.6% and 18.4%, respectively; Figure 7). The distributions of percentage shares of dead trees in different exposures varied significantly between areas (p < 0.0001).
After stating significant differences in the type of tree damage between the analyzed areas currently and in the past, the comparison between the current and historical data within the range of each examined areas was carried out. The change of situation, i.e., the growth conditions of trees and tree stands in a given area, was proven by a significant difference in the share of damaged trees in the analyzed classes of exposure or height above sea level.
As for the WSM, the distributions of dead trees differed significantly between the historical and current data (p < 0.0001; Figure 6). Most of the dead trees were at 800–1000 m above sea level in the past and at 700–800 m above sea level nowadays. In the analysis of damaged tree share in various exposures, currently, the share of dead trees has decreased significantly in the northern exposure (from 24.6% to 18.8%, p < 0.0001), but the share of these trees has increased meaningfully in the southern exposure (from 11.6% to 15.6%, p = 0.0014; Figure 5). In the case of other exposures, the share of trees remained at a similar level, or it has only changed slightly.
As for the WBM, the distribution of dead trees differed significantly between the historical and current data (p < 0.0001; Figure 6). The greatest number of dead trees were located at 800–900 m above sea level in the past and at 700–800 m above sea level nowadays. In the context of different aspects, currently, a significant increase was observed in the number of dead trees in the northwest and southwest exposures (10.6% versus 16.9%, p < 0.0001; 7.6% versus 11.4%, p = 0.0010) with a simultaneous decrease in the number of dead trees in the south and southeast exposures (14.2% versus 9.9%, p < 0.0001; 12.6% versus 9.0%, p = 0.0004; Figure 5).
4. Discussion
The application of a high-resolution terrain model enabled the development of detailed maps of analyzed topographic features. This means a major progress in relation to GIS has worked so far in the area of the Sudety Mountains or Beskidy Mountains, which were based on a 250 × 250 meter raster (6.25 ha), allowing for the charting up to a scale of 1:50,000 [16]. More precisely, DTM models also allow observing processes from a closer perspective, which provides an opportunity to observe the local conditions. These conditions shape the harsh local microclimate of these mountains, described by several authors [9,10,34]. High-resolution data have enabled the verification of the results of research so far, as well as new conclusions. The occurrence of deforested areas over the specific aspects and the elevation above sea level stated in this work constitutes the confirmation of the previous results of analyses from the 1990s [35,36]. It is, however, necessary to emphasize that the currently used tools enabled large-area analyses, which have not previously been carried out due to technical difficulties. It was stated in Zawiła-Niedźwiecki [18] work that, in the area of the Sudety Mountains, forests below 600 m above sea level remained in relatively good condition, and mass deforestation occurred above this contour. The information confirms the research, as with the use of GIS in the 1990s this border was estimated for an elevation of 600 m. It is also the border of clear dominance of spruce in the species composition, which was mainly affected by deforestation. This species range and species composition changed over the past centuries. It should be noticed that forests covering all the three regions were used in the past centuries as a source of valuable wood for industry. Broadleaf forests, mainly beech forests, were most often cut down, and wood were used, for example, in glassworks (in the Sudety Mountains). Regardless of the history of these areas, the influence of the elevation above sea level on the risk of tree stand’s decomposition has also been confirmed in the work by Zawada [22], who stated that tree stands in the WSM, located at heights up to 800 m are moderately prone and stands at heights over 800 m are highly prone to the negative impact of industrial pollution, also demonstrated by the analyses included in our work. Grodzki [11] in his research has shown that there is a relation between the topography (elevation and exposure) and contents of sulphur in spruce needles. It was important especially when the content of this element in needles in the Beskidy Mountains as well as in the WSM exceeded generally accepted norms according to Bonneau [37] and Austrian standards [38], defoliation indexes set during the disaster in the WSM also indicates the dependency between the western exposure and the die-off of tree stands. There is a clear exposure–wind direction–defoliation relation, which is a sign as well as a consequence of stress among trees. Additionally, the latest dendrochronological research on climate [9,39] confirms the strong relation between trees growth, exposure, and winds. In particular, interesting is the fact that we have currently an increasing number of dead trees in the southern and southwestern exposures, which are relatively well shielded from winds. Additionally, the significant increase in the number of dead trees at lower heights puts a question mark on the current reason for such conditions. There is probably another reason for those trees to die, which dominated at the lower elevations. While analyzing the occurring deforestation, it is necessary to remember the species’ distribution, in particular altitude tiers, of which the distribution for this area is characterized by the clear domination of spruce, definitely the most affected by large-area deforestation.
Exposures dominating in the die-off process in the ESM are the opposite ones, and as the direction of winds would explain the weaker health in the northwestern exposure, it is still difficult to explain this process in the southwestern exposure. It is also a very similar exposure to the south, i.e., the one, where the increase of die-off processes was observed in the WSM.
Before the mass-scale deforestation process in the Beskidy Mountains, some researchers [22] based on the studies taken in 1989 and 1993 proved that contents of nitrogen, sulphur, and iron in soil (surface layers) were greater at higher elevations (800–1100 m a.s.l.) than the threshold values. Interestingly, the results obtained by the researchers have shown that the sulphur variability on particular slopes was different. Soils on the northern slopes were characterized by a higher content of this element compared to those in the other directions. In later years, it was observed that the forest dieback process in the Beskidy started in the northern exposure in places, where the content of sulphur was higher. Differences between the directions of the forest dieback process in the past and today are still visible in both the Sudety Mountains and the Beskidy Mountains. The directions of forests’ dieback in the past, presented in our work, are identical to those, which were indicated previously as the dominating ones for the whole area of the Carpathians Mountains [21]. It is interesting that it was mainly the western, the northwestern, and the northern exposures that have shown greater shares of dead trees in the last years. In the case of the Beskidy Mountains, however, the process of intensive deforestation continues, and the period between the analyzed sets of data based on single dead tree detection and SILP is very short. Similarly as in the case of the WSM, it was also observed that deforestation occurred nowadays on a lower elevation.
Studying topography may give us valuable findings about such a complicated process, which is the forest dieback. Certainly, factors like pollutants, rains, winds, dries, and temperatures are at least partial reflection of terrain morphology, and that is why it is worth knowing what the general influence of this factor on forests is.
5. Conclusions
In the WSM and the WBM, the observed dieback of trees takes place at lower elevations today than in previous years. Currently, increasingly more dead trees were observed at lower heights. This may relate to the disturbance of current distribution of age classes in individual height layers. Stands of younger age classes, as a result of deforestation, cover upper parts of hills, and they may be more resistant to the operation of certain stress factors. Differences between the deforestation and the slope, exposure or height over sea level are different in all the three areas, which can be connected with microclimate conditions, and therefore should be analyzed separately. In the WSM, the share of dead trees in the northern exposure decreased significantly; on the other side, the share of dead trees has grown significantly in the southern exposure. In the case of other exposures, the share of trees remained on a similar level, or it has only changed slightly. In the WBM, significant increases in the number of dead trees in the NW and SW exposures were observed, with a simultaneous decrease in the number of dead trees in the S and SE exposures. Although a greater share of dying trees in the NW exposure has been described before, it was related mainly to the excess of sulphur in the soil. However, the results of our research prove that even if in the historical aspect the hypothesis was right, this does not explain the current situation, i.e., the significant increase in the number of dead trees in the SW exposure. In the ESM, the most intensive process of tree dieback was observed in the western and southwestern exposures. Such distribution of trees’ dieback is surprising since in this area, as in others, pollution is of the minor importance. Particularly, striking is the fact that the greatest pollution has been noted in the opposite exposures, which could not be due to a single stress factor.
Author Contributions
conceptualization, all authors; methodology, all authors; formal analysis, R.B., M.Z., M.C.; writing of original draft preparation, all authors; writing of review and editing, all authors.
Funding
This work was supported within the project “Establishment of a forest information system covering the area of the Sudetes and the West Beskids with respect to the forest condition monitoring and assessment” financed by the General Directory of State Forest National Holding in Poland. Furthermore, this work was partly supported by the project “Influence of biotic, abiotic and anthropogenic factors on the growth dynamics of mountain stands in the Eastern Sudetes on the basis of data from aerial laser scanning and hyperspectral images”, supported by the Ministry of Science and Higher Education (241502). The ALS data in 2007 were obtained under the Interreg III A project “Coordination Center for Nature and Woodland Education and Promotion in Świeradów Zdrój”, using financing from Forest Funds for the Szklarska Poręba Forest District.
Conflicts of Interest
Authors declare any personal circumstances or interest that may be perceived as inappropriately influencing the representation or interpretation of reported research results.
References
- Baltensweiler, W. “Waldersterben”: Forest pests and air pollution. Z. Angew. Ent. 1985, 99, 77–85. [Google Scholar] [CrossRef]
- Christiansen, E. Bark beetles and air pollution. Medd. NISK 1989, 42, 101–107. [Google Scholar]
- Guderian, R. Air Pollution: Phytotoxicity of Acides Gases and Its Significance in Air Pollution Control; Springer: Berlin/Heidelberg, Germany; New York, NY, USA, 1977. [Google Scholar]
- Schelhaas, M.-J.; Nabuurs, G.-J.; Schuck, A. Natural disturbances in the European forests in the 19th and 20th centuries. Glob. Chang. Biol. 2003, 9, 1620–1633. [Google Scholar] [CrossRef]
- Svoboda, M.; Fraver, S.; Janda, P.; Bace, R.; Zenahlikova, J. Natural development and regeneration of a Central European montane spruce forest. For. Ecol. Manag. 2010, 260, 707–714. [Google Scholar] [CrossRef]
- Zhao, T.; Krokene, P.; Hu, J.; Christiansen, E.; Björklund, N.; Långström, B.; Solheim, H.; Borg-Karlson, A. Induced Terpene Accumulation in Norway Spruce Inhibits Bark Beetle Colonization in a Dose-Dependent Manner. PLoS ONE 2011, 6, e26649. [Google Scholar] [CrossRef] [PubMed]
- Althoff, J. Zur Disponierung von immissionsgeschädigten Fichtenbeständen gegenüber dem Buchdruckerbefall. Allg. Forstz 1985, 13, 277. [Google Scholar]
- Hais, M. Changes in Land Cover Temperature and Humidity Parameters Resulting from Spruce Forests Decay in the center of the Sumava National Park. Acta Univ. Carol. Geogr. 2003, 2, 97–107. [Google Scholar]
- Błaś, M. Rola Mgły w Przychodzie Wody z Atmosfery i Depozycji Zanieczyszczeń w Wybranych Ekosystemach Sudetów. Ph.D. Thesis, Praca doktorska. Zakład Meteorologii i Klimatologii Instytutu Geograficznego Uniwersytetu Wrocławskiego, Wrocław, Poland, 2000. [Google Scholar]
- Sobik, M.; Błaś, M.; Quiel, F. Udział osadów mgielnych w przychodzie wody z atmosfery i depozycji zanieczyszczeń w ekosystemach Sudetów Zachodnich. In Geoekologiczne Problemy Karkonoszy; Materiały z Sesji Naukowej; Wydawnictwo Acarus: Poznań, Poland, 1998. [Google Scholar]
- Grodzki, W. Threats to mountain forests in Poland by bark beetles. An outline. In Methodology of Forest Insect and Disease Survey in Central Europe, Proceedings of the IUFRO WP 7.03.10. Workshop, Ustroń, Poland, 21–24 April 1998; Forest Research Institute: Warsaw, Poland, 1998; pp. 167–172. [Google Scholar]
- Bytnerowicz, A.; Godzik, B.; Grodzińska, K.; Frączek, W.; Musselman, R.; Manning, W.; Badea, O.; Popescu, F.; Fleischer, P. Ambient ozone in forests of the Central and Eastern European mountains. Environ. Pollut. 2004, 130, 5–16. [Google Scholar] [CrossRef]
- Manion, P. Tree Disease Concepts; Prentice Hall Inc.: Englewood Cliffs, NJ, USA, 1981. [Google Scholar]
- Grodzki, W. Influence of Air Pollution on the Menace by Bark Beetles in Spruce Stands of Sudety Mts. in Poland. In Air Pollution and Interactions between Organisms in Forest Ecosystems, Proceedings of the 15th International Meeting of Specialists in Air Pollution Effects on Forest Ecosystems, Tharandt/Dresden, Germany, 9–11 September 1992; Tesche, M., Feiler, S., Eds.; Reidel Publishing: Tharandt/Dresden, Germany, 1992; pp. 271–275. [Google Scholar]
- Sobik, M.; Błaś, M. Natural and Human Impact on Pollutant Deposition in Mountain Ecosystems with the Sudetes as an Example. In Proceedings of the 3rd IASME/WSEAS International Conference on Energy & Environment, Cambridge, UK, 23–25 February 2008. [Google Scholar]
- Poławski, Z.; Zawiła-Niedźwiecki, T. Teledetekcja w ocenie stanu środowiska leśnego Sudetów Zachodnich. Sylwan 1987, 5, 49–60. [Google Scholar]
- Poławski, Z.; Zawiła-Niedźwiecki, T. GIS in Analysis of Sudety Forests with the use of Teledetection Data. Sylwan 1995, 8, 73–86. [Google Scholar]
- Zawiła-Niedźwiecki, T.; Glasenapp, E. Wykorzystanie numerycznego modelu terenu w ocenie stanu lasów górskich. Konferencja Naukowo-Techniczna nt. In Numeryczny Model Terenu i Jego Wykorzystanie; Katedra Urządzania Lasu i Geodezji Leśnej SGGW: Rogów, Poland, 8 December 1994; pp. 121–129. [Google Scholar]
- Ciołkosz, A.; Zawiła-Niedźwiecki, T. Ecological Disaster in the Sudety Mountains as seen on Satellite Images. In Satellite Remote Sensing Forest Atlas of Europe; Justus Perthes Verlag Gotha GmbH: Gotha, Germany, 1995; pp. 192–193. [Google Scholar]
- Bałazy, R.; Ciesielski, M.; Zasada, M.; Zawiła-Niedźwiecki, T. Forest dieback processes in the Central European mountains in the context of terrain topography and selected stand attributes. For. Ecol. Manag. 2019, 436, 106–119. [Google Scholar] [CrossRef]
- Main-Knorn, M.; Hoster, P.; Kozak, J.; Kuemmerle, T. How pollution legacies and land use histories shape post—Communist forest cover trends in the Western Carpathians. For. Ecol. Manag. 2009, 258, 60–70. [Google Scholar] [CrossRef]
- Zawada, J. Metoda oceny stanu zdrowotnego drzewostanów znajdujących się pod wpływem emisji przemysłowych. Las Pol. 1983, 10, 19–20. [Google Scholar]
- Gronet, R. Wykorzystanie zdjęć lotniczych do dokumentacji stanu i zmian środowiska w obszarach silnej autopopresji. Prace Instytutu Geodezji Kartografii 1991, 38, 58–69. [Google Scholar]
- Wężyk, P.; Matyja, W. Określenie dynamiki zmian Puszczy Niepołomnickiej na podstawie analizy ortofotomapy wygenerowanej z archiwalnych zdjęć lotniczych. Archiwum Fotogrametrii, Kartografii iTeledetekcji 2007, 17, 801–809. [Google Scholar]
- Grodzki, W. Short term forecast of more important pests and diseases of forest trees in Poland. In Proceedings of the Narada Dyrektorów RDLP, Bardo Śląskie, Poland, 13–15 November 2018. [Google Scholar]
- Forestry; Główny Urząd Statystyczny: Warszawa, Poland, 2017.
- Reutebuch, S.E.; McGaughey, R.J.; Andersen, H.E.; Carson, W.W. Accuracy of a high-resolution lidar terrain model under a conifer forest canopy. Can. J. Remote Sens, 2003, 29, 527–535. [Google Scholar] [CrossRef]
- Newcombe, R.G. Interval Estimation for the Difference Between Independent Proportions: Comparison of Eleven Methods. Stat. Med. 1998, 17, 873–890. [Google Scholar] [CrossRef]
- Wilson, E.B. Probable Inference, the Law of Succession, and Statistical Inference. J. Am. Stat. Assoc. 1927, 22, 209–212. [Google Scholar] [CrossRef]
- Agresti, A. An Introduction to Categorical Data Analysis, 2nd ed.; John Wiley & Sons: New York, NY, USA, 2007; Volume 38. [Google Scholar]
- R Core Team. R: A Language and Environment for Statistical Computing; R Foundation for Statistical Computing: Vienna, Austria, 2012; ISBN 3-900051-07-0. [Google Scholar]
- Chambers, J.M.; Cleveland, W.S.; Kleiner, B.; Tukey, P.A. Graphical Methods for Data Analysis; Chapman and Hall/Cole Publishing Company: New York, NY, USA, 1983. [Google Scholar]
- Ostermann, R. Georg von Mayrs beiträge zur statistichen graphik. Algemeines Statistiches Archiv. 1999, 83, 350–362. [Google Scholar]
- Opała-Owczarek, M.; Błaś, M.; Owczarek, P.; Sobik, M.; Godek, M. A dendroclimatological study of east- and west-facing slopes in mountainous areas subjected to strong air pollution (the Sudetes, Central Europe). Phys. Geogr. 2019, 40, 186–208. [Google Scholar] [CrossRef]
- Zawada, J. Żywotność drzewostanów świerkowych regla dolnego w kompleksie Romanki i Lipowskiej a zawartość makro—i mikroelementów w igłach drzew oraz właściwości chemiczne wierzchnich warstw gleb. Pr. Inst. Bad. Leśn. Seria A 1988, 845, 79–93. [Google Scholar]
- Zawiła-Niedzwiecki, T. Evaluation of forest state in threatened ecosystems with the use of satellite imagery and GIS. Proc. Inst. Geod. Cartogr. 1994, 41, 90. [Google Scholar]
- Bonneau, M. French research into forest decline. In Remedies for Forest Decline; DEFORPA Programme—2nd Report; Bcole Nationale du Genie Rural, des Eaux et des Forets: Nancy, France, 1991. [Google Scholar]
- Kwapis, Z. Wpływ Emisji Przemysłowych na Górskie Drzewostany Świerkowe; Sprawozdanie naukowe Inst. Bad. Leśn.: Warszawa, Poland, 1990. [Google Scholar]
- Eitel, J.; Vierling, L.; Litvak, M.; Long, D.; Schulthess, U.; Ager, A.; Krofcheck, D.; Stoscheck, L. Broadband, red-edge information from satellites improves early stress detection in a New Mexico conifer woodland. Remote Sens. Environ. 2011, 115, 3640–3646. [Google Scholar] [CrossRef]
Figure 1.
Locations of research areas: the Western Sudety Mountains (WSM), the Eastern Sudety Mountains (ESM), and the Western Beskidy Mountains (WBM).
Figure 1.
Locations of research areas: the Western Sudety Mountains (WSM), the Eastern Sudety Mountains (ESM), and the Western Beskidy Mountains (WBM).

Figure 2.
Species compositions and forest structures on three study areas: the WSM, the ESM, and the WBM (source: own elaboration based on the data from Forest Data Bank).
Figure 2.
Species compositions and forest structures on three study areas: the WSM, the ESM, and the WBM (source: own elaboration based on the data from Forest Data Bank).

Figure 3.
Historical (1980–1984) and current (since 2012) deforestations on all three analyzed areas.
Figure 3.
Historical (1980–1984) and current (since 2012) deforestations on all three analyzed areas.

Figure 4.
Data sources and process workflow for deforestation analyses (source: own elaboration).

Figure 5.
Distributions of dead trees and layouts of forest stands’ area surfaces (all) and historical deforestation in individual mountain terrains exposures.
Figure 5.
Distributions of dead trees and layouts of forest stands’ area surfaces (all) and historical deforestation in individual mountain terrains exposures.

Figure 6.
Distributions of dead trees and layouts of forest stands’ area surfaces (all) and historical deforestation at different heights.
Figure 6.
Distributions of dead trees and layouts of forest stands’ area surfaces (all) and historical deforestation at different heights.

Figure 7.
Distributions of dead trees and layouts of forest stands’ area surfaces (all) and historical deforestation on different slopes.
Figure 7.
Distributions of dead trees and layouts of forest stands’ area surfaces (all) and historical deforestation on different slopes.

© 2019 by the authors. Licensee MDPI, Basel, Switzerland. This article is an open access article distributed under the terms and conditions of the Creative Commons Attribution (CC BY) license (http://creativecommons.org/licenses/by/4.0/).
Share and Cite
MDPI and ACS Style
Bałazy, R.; Ciesielski, M.; Waraksa, P.; Zasada, M.; Zawiła-Niedźwiecki, T. Deforestation Processes in the Polish Mountains in the Context of Terrain Topography. Forests 2019, 10, 1027. https://0-doi-org.brum.beds.ac.uk/10.3390/f10111027
AMA Style
Bałazy R, Ciesielski M, Waraksa P, Zasada M, Zawiła-Niedźwiecki T. Deforestation Processes in the Polish Mountains in the Context of Terrain Topography. Forests. 2019; 10(11):1027. https://0-doi-org.brum.beds.ac.uk/10.3390/f10111027
Chicago/Turabian StyleBałazy, Radomir, Mariusz Ciesielski, Patryk Waraksa, Michał Zasada, and Tomasz Zawiła-Niedźwiecki. 2019. "Deforestation Processes in the Polish Mountains in the Context of Terrain Topography" Forests 10, no. 11: 1027. https://0-doi-org.brum.beds.ac.uk/10.3390/f10111027
Note that from the first issue of 2016, this journal uses article numbers instead of page numbers. See further details here.