Article

Response of Four Tree Species to Changing Climate in a Moisture-Limited Area of South Siberia

by
Elena A. Babushkina
1,
Dina F. Zhirnova
1,
Liliana V. Belokopytova
1,
Ivan I. Tychkov
2,
Eugene A. Vaganov
3,4 and
Konstantin V. Krutovsky
5,6,7,8,9,*
1
Khakass Technical Institute, Siberian Federal University, 655017 Abakan, Russia
2
Department of Mathematical Methods and Information Technology, Siberian Federal University, 660075 Krasnoyarsk, Russia
3
Institute of Ecology and Geography, Siberian Federal University, 660041 Krasnoyarsk, Russia
4
Department of Dendroecology, V.N. Sukachev Institute of Forest, Siberian Branch, Russian Academy of Sciences, 660036 Krasnoyarsk, Russia
5
Department of Forest Genetics and Forest Tree Breeding, Georg-August University of Göttingen, 37077 Göttingen, Germany
6
Center for Integrated Breeding Research, George-August University of Göttingen, 37075 Göttingen, Germany
7
Department of Ecosystem Science and Management, Texas A&M University, College Station, TX 77840, USA
8
Laboratory of Population Genetics, N.I. Vavilov Institute of General Genetics, Russian Academy of Sciences, 119991 Moscow, Russia
9
Laboratory of Forest Genomics, Genome Research and Education Center, Institute of Fundamental Biology and Biotechnology, Siberian Federal University, 660036 Krasnoyarsk, Russia
*
Author to whom correspondence should be addressed.
Submission received: 2 October 2019 / Revised: 5 November 2019 / Accepted: 5 November 2019 / Published: 8 November 2019
(This article belongs to the Special Issue Radial Tree-Ring Traits Variation in Relation to Climate Factors)

Abstract

:
The response of vegetation to climate change is of special interest in regions where rapid warming is coupled with moisture deficit. This raises the question of the limits in plants’ acclimation ability and the consequent shifts of the vegetation cover. Radial growth dynamics and climatic response were studied in Scots pine (Pinus sylvestris L.), Siberian larch (Larix sibirica Ledeb.), and silver birch (Betula pendula Roth.) in the forest-steppe, and for Siberian elm (Ulmus pumila L.) in the steppe of South Siberia, as indicators of vegetation state and dynamics. Climate–growth relationships were analyzed by the following two approaches: (1) correlations between tree-ring width chronologies and short-term moving climatic series, and (2) optimization of the parameters of the Vaganov–Shashkin tree growth simulation model to assess the ecophysiological characteristics of species. Regional warming was accompanied by a slower increase of the average moisture deficit, but not in the severity of droughts. In the forest-steppe, the trees demonstrated stable growth and responded to the May–July climate. In the steppe, elm was limited by moisture deficit in May–beginning of June, during the peak water deficit. The forest-steppe stands were apparently acclimated successfully to the current climatic trends. It seems that elm was able to counter the water deficit, likely through its capacity to regulate transpiration by the stomatal morphology and xylem structure, using most of the stem as a water reservoir; earlier onset; and high growth rate, and these physiological traits may provide advantages to this species, leading to its expansion in steppes.

1. Introduction

The response of vegetation to climate change is the focus of many studies, especially for areas prone to drought and the associated moisture deficit, where warming and stable or even decreasing precipitation can lead to an increase in the frequency and severity of droughts [1,2,3]. The most at risk are regions where the rate of temperature increase exceeds global trends (e.g., temperate latitudes in continental Asia—Central Asia, Mongolia, North China, and South Siberia) [4,5,6,7,8,9]. For example, Liu et al. [10] reported that warming and droughts reduced growth and increased mortality for both conifers and angiosperms, driving the eventual regional loss of many semi-arid forests in these regions. However, this response is not spatially uniform, and relationships between tree growth and climate should also be studied on a smaller spatial scale.
Other complications in the assessment of plants’ response to climatic change are due to different strategies of dealing with water stress, provided by their various morphological and physiological traits. Different (isohydric and anisohydric) strategies of water balance regulation by stomatal closure [11], the different hydraulic architecture of conifer, diffuse-porous and ring-porous wood [12], possible usage of heartwood as a water storage by angiosperms [13,14], different leaf/xylem phenology, and the storage of non-structural carbohydrates in deciduous and evergreen species [15] are just some of the internal factors affecting the drought tolerance and acclimation of trees for the permanent moisture deficit.
In the Asian part of Russia, moisture deficit is typical for the semi-arid steppe and forest-steppe zones of South Siberia, which stretch mainly along the foothills in the plains and valleys near the southern border of Russia. A typical example of such a territory is the Khakass-Minusinsk Depression. Here, the main tree species in the forest-steppes are evergreen conifer Scots pine (Pinus sylvestris L.), deciduous conifer Siberian larch (Larix sibirica Ledeb.), and diffuse-porous angiosperm silver birch (Betula pendula Roth.). For all three species, the forest-steppes are the southern/lower boundary of their distribution range, limited by moisture availability [16]. This forest-steppe ecotone is relatively stationary at the moment, whereas many places in the drier steppe zone are currently being overgrown by a savanna-like shrubbery, consisting mainly of ring-porous angiosperm Siberian elm (Ulmus pumila L.). This highly drought-resistant woody species was introduced in the region in the 1960s for shelter belts, and later spread naturally to the adjacent steppe areas and abandoned farmlands (as a result of more than a 70% reduced sowing area in the region over the past 50 years [17]). Its natural growth range stretches from Central Asia through Mongolia and North China, to the Far East and Korea [18]. It is the last tree species observed in the semi-deserts and even deserts (in river valleys) of Northern China [19]. Given the large magnitudes of temperature fluctuations there, this species is characterized by adequate frost resistance, although in Siberia it can be damaged by freezing during the coldest winters, which limits its distribution to the north [20].
The presence of woody plants as keystone species in both the steppe and forest-steppe zones of the Khakass-Minusinsk Depression allows for the use of tree growth as an indicator of these semi-arid ecosystems’ state, and indirectly, their dynamics under a changing climate using the dendroclimatic analysis of tree rings [21,22]. Along with the correlation models comparing the climatic factors and tree growth dynamics statistically [23,24], mechanistic models can also be used to describe the explicit dependencies of the growth processes on the external conditions, taking into account the ecophysiological characteristics of plants [25,26,27,28]. An example of such modeling is the process-based Vaganov–Shashkin (VS) model of tree rings formation based on the daily tree growth rate calculation from solar radiation, air temperature, and soil moisture [22]. The visual algorithm of the optimization of the VS-model’s parameters (i.e., search of the parameters’ values that provide the best fit of the model with the actual tree growth), is successfully used to assess the climatic influence and biological features of various tree species (VS-Oscilloscope) [29,30].
In this study, we attempted to answer the question about the possible shifts in the vegetation state and cover dynamics that may accompany the current and prospective climate change in the moisture-limited zones of the Khakass-Minusinsk Depression. For this purpose, we assessed the ability of acclimation to the moisture deficit and its limits for the four aforementioned tree species using two approaches. The first one was based on the correlation between tree-ring width chronologies and climatic series generalized from the daily data with a 21-day window and one-day step [17,31,32], allowing us to determine the seasonality of the significant climatic impacts in the growth season more precisely than the classically-used monthly climatic series. The second one was based on the VS-modeling the dynamics of radial growth, allowing us to estimate several biophysical characteristics of individual tree species and their ability to use climatic resources in specific habitat conditions. The obtained estimates allowed us to compare the current acclimation ability of the four species, and to contemplate their reaction to further regional warming.

2. Materials and Methods

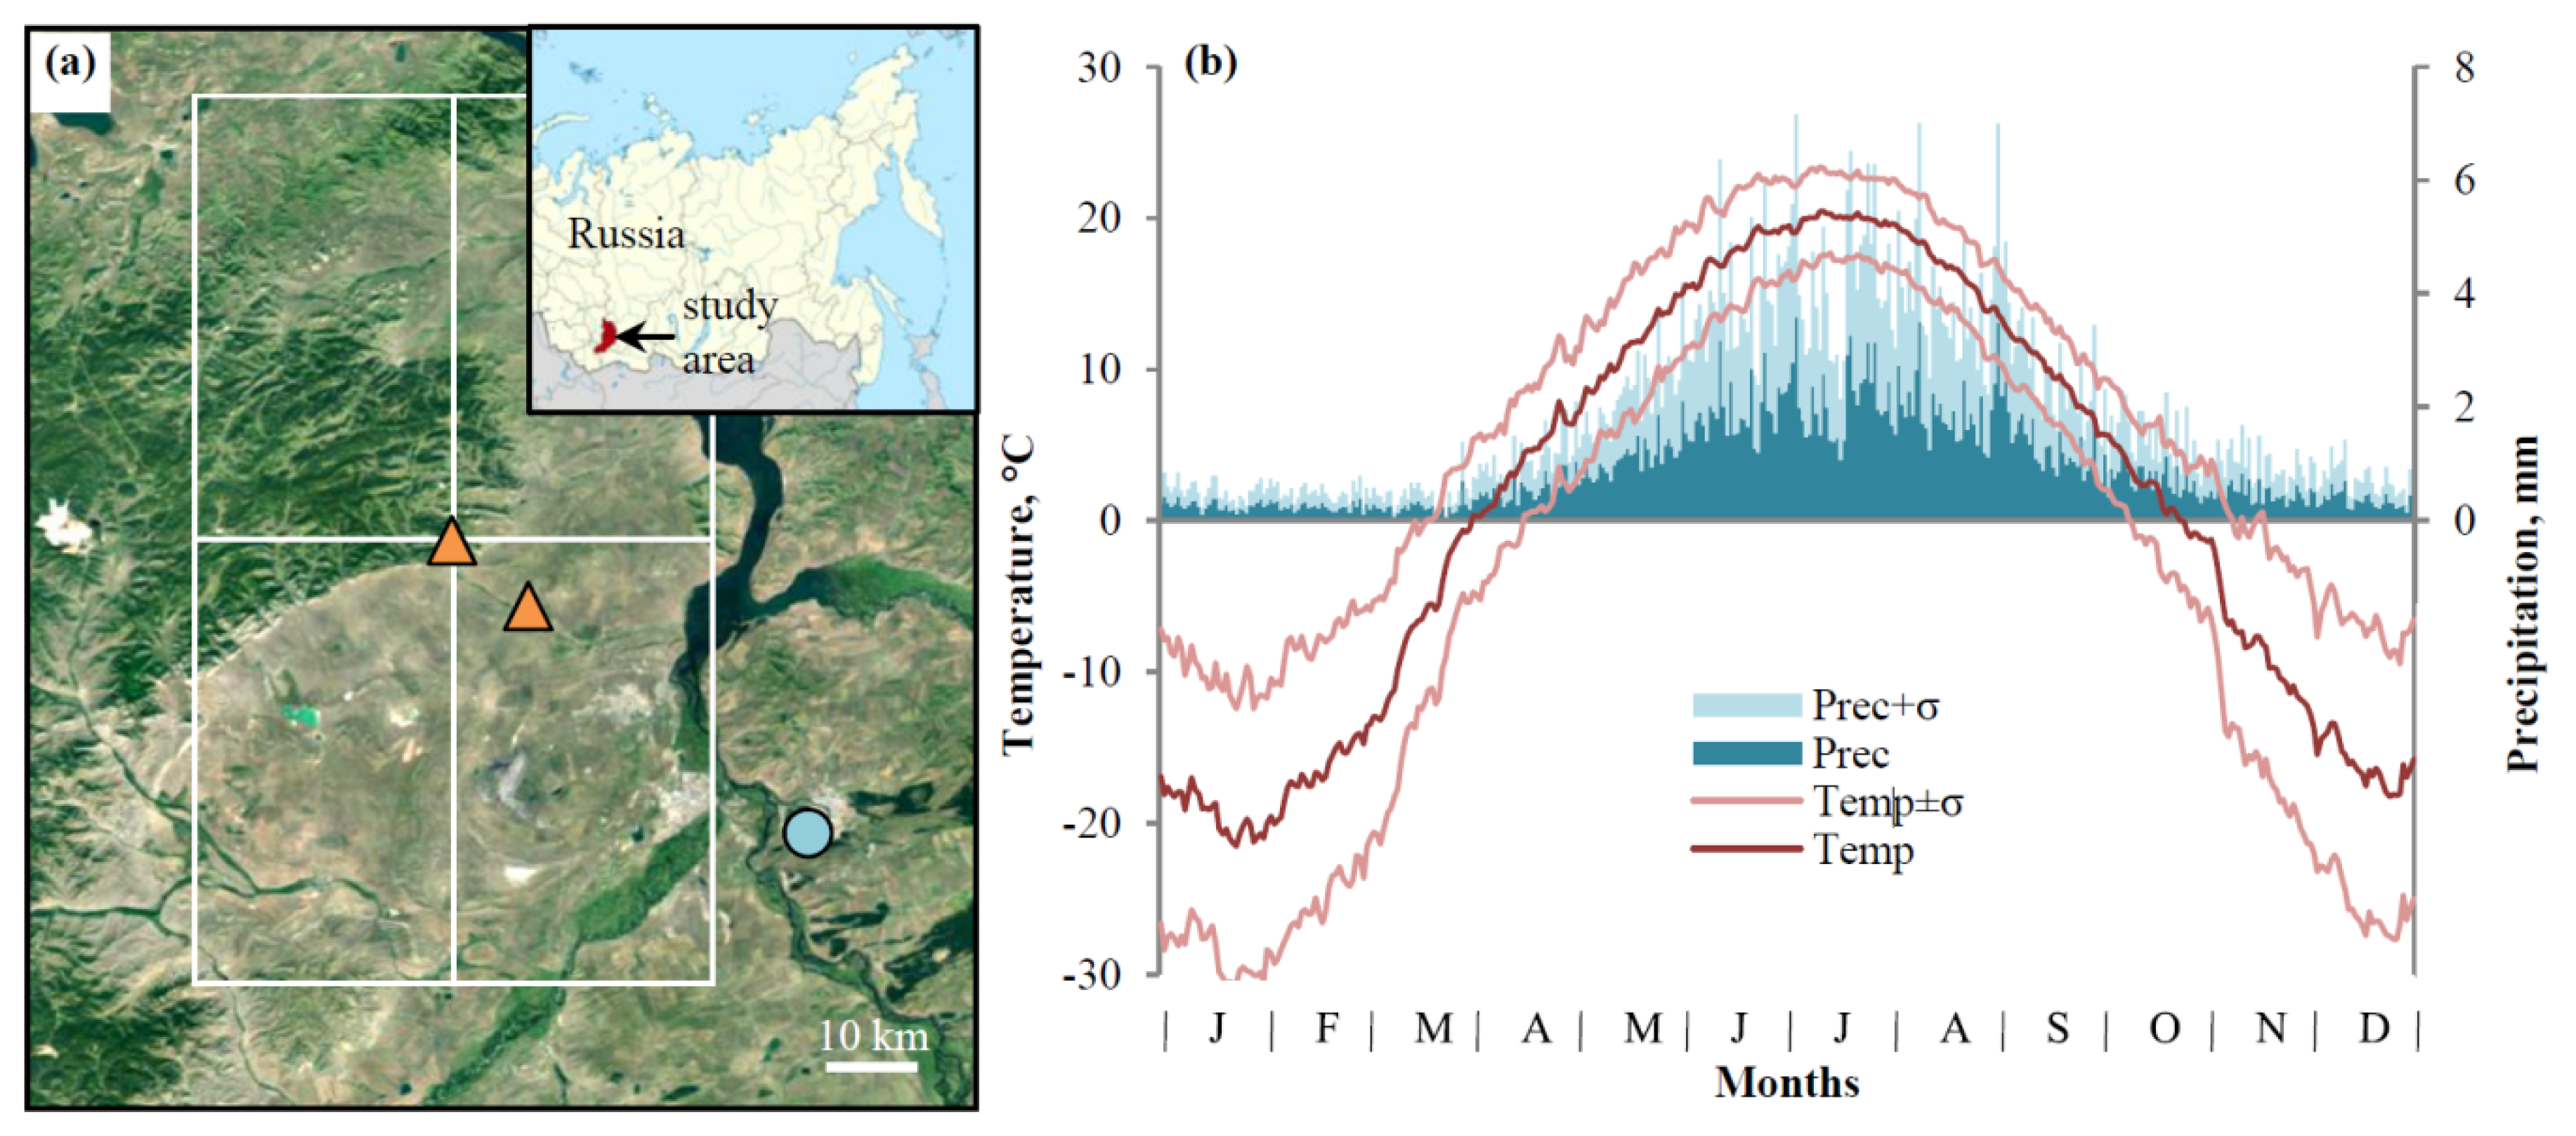
2.1. Study Area and Sampling Sites

The study was conducted in the Khakass-Minusinsk Depression and foothills of the Batenevsky Ridge in the Kuznetsk Alatau mountain system (Figure 1a). The sampling was carried out mostly at one site in the vicinity of Vershino-Bidja Village near the upper reaches of the Bidja River (Table 1 and Figure 2). This site was selected on the 15–20° southern slope, covered with an open-canopy forest on mountain gray forest soils, consisting of Pinus sylvestris (PISY), Larix sibirica (LASI), and Betula pendula (BEPE). Most of the trees were about 50–70 years old, but several older conifer trees were also found at the site. There were abundant juvenile trees of all of the three species in the undercover, with birch seedlings growing only the less dense parts of the tree stand, predominantly near its lower boundary. The adjacent northern slopes were covered by more humid and dense forest stands of the same species. In the vicinity (~15 km south-east), a shelter belt near the road, consisting of adult Ulmus pumila (ULPU) trees, was selected as the second sampling site. It has a flat landscape typical for elm habitats in Khakassia, and is located amidst crop fields and dry steppes on chernozem soils. The elm was introduced in the region only in the second half of the twentieth century, starting from urban greening, and later as a part of the shelter forest belts in agricultural areas [20,33].
The climate of the study area is extremely continental [36], with a relatively short and hot summer, a long and cold winter, and a low snow pack (Figure 1b). The average annual air temperature is 1–1.5 °C above zero. Temperatures are positive approximately from April to October (warm season). The average annual sum of precipitation is ~300–350 mm on plains, and ~400 mm in the foothills, with most of it (~90%) falling during the warm season and the maximum in July. From June to September, the temperature (T) and precipitation (P) correlate negatively (from −0.23 to −0.41, p < 0.05), as expected in Southern Siberia [37], leading to the frequent co-occurrences of low temperatures with much precipitation (favorable conditions), and high temperatures with little precipitation (drought) in the warm season (i.e., high variation of moisture supply).

2.2. Climatic Data

In this study, we used a monthly and daily series of temperature and precipitation from the Minusinsk weather station (53°41 ’N, 91°40 ’E, elevation 251 m a.s.l.) located ~60 km south-east of the main sampling site. It has a reliable monthly and daily series of the mean air temperature and the amount of precipitation over 1936–2017. Additionally, the monthly series of the same climatic variables were calculated from the Climate Research Unit Time-Series for 53.5–54.5 ‘N 90.5–91.5 ‘E area (CRU TS 4.01 [38]; Figure 1a) and compared with the Minusinsk climatic series. Correlations between the grid and station temperature series were 0.91–0.98 for separate months, and 0.95–0.97 for the series integrated over longer periods (warm and cold season, calendar year). For the precipitation series, the following relationships were weaker: 0.72–0.89 and 0.79–0.81, respectively. Nevertheless, all of the correlations were significant at p < 0.05, and exceeded 0.85 during the warm season. This supports the usage of the Minusinsk station data for the study area.
The moving series of the temperature and precipitation with a 21-day window and a one-day step were calculated from the daily data (e.g., mean temperature or precipitation sum from 20 April to 10 May, the next series covers 21 April–11 May, and so on). This window was chosen empirically as a compromise between the fine temporal scale and the stability of the correlations, and during earlier studies in the region it showed adequate results for the climatic response of tree ring width [39]. Also, the Selyaninov hydrothermal coefficient (HTC = 10·ΣP/ΣT for T > 10 °C) [40] moving series with the same window and step were calculated from the same daily data from May to September, and the monthly self-calibrating Palmer drought severity index (PDSI) series (grid series averaged for the same area as the CRU TS data) [41] were considered as indicators of the moisture regime in the study area. The HTC series were used in the detailed dendroclimatic analysis because of their finer temporal resolution and their higher sensitivity to droughts in comparison with PDSI [42]. It should be also noted that unlike HTC, PDSI has a high month-to-month correlation (0.89–0.99 for the series of the consequent months), leading to a lower but still significant year-to-year autocorrelation (0.34–0.44), because it depends more on the previous conditions than on the current ones.
The climatic dynamics were analyzed for the seasonal series of temperature and precipitation, and for the monthly series of drought indices using the following two approaches: (1) calculation of the linear trends over the entire period of instrumental observation (1936–2017), and (2) comparison of the mean values of the climatic variables between two sub-periods (1936–1976 and 1977–2017), using an independent t-test [43] to evaluate the significance of the differences.

2.3. Dendrochronological Data

Wood samples (cores) were taken at the breast height from undamaged mature individual living trees within the sites described above (Table 1). The collection, transportation, and processing of the cores were performed with the standard techniques of dendrochronology [23]. For each core, the tree ring width (TRW) of the individual series was measured to the nearest 0.01 mm using LINTABTM 5 platform and TSAP-WinTM software [44]. A cross-dating of the series was performed and verified in COFECHA computer program [45]. The individual measured series of the TRW were standardized in ARSTAN computer program [46], as follows: long-term non-climatic trends were fitted by cubic smoothing spline with a frequency response of 0.50 at 67% of the series length, and removed via the division of each measured TRW value by the respective value of trend. Then, local standard chronologies were developed from the individual standard series as a bi-weighted mean. We used the following statistical characteristics of the chronologies: standard deviation (stdev), mean sensitivity coefficient (sens) [34], mean inter-serial correlation coefficient (r-bar) [23], and expressed population signal (EPS) [35]. The climate–growth relationships were estimated by the Pearson’s correlation coefficients between the TRW standard chronologies and 21-day climatic series during two sub-periods (1936–1976 and 1977–2017: T and P), so as to take into account climate change, and during the whole period of instrumental observations (1936–2017: HTC). During the computation of the significance level of correlations, the sample size was not adjusted for autocorrelation.

2.4. Tree-Ring Formation Modeling

The VS-model is a process-based model that describes the formation of tree rings depending on the daily climatic factors (T and P) and insolation at a particular area [22,47]. TRW is evaluated as an indexed series of the modeled general growth rate summed for the whole growth season. The general growth rate is calculated as a product of three partial growth rates, driven by the daily mean air temperature (T), soil moisture (calculated using soil features, T, P, and evapotranspiration), and solar radiation, respectively. Four temperature parameters are used to describe dependence of the tree growth rate on temperature [22]. Tmin is a minimum temperature (threshold) still allowing for tree growth. The growth will stop below this temperature. Tmax is a maximum temperature (threshold) still allowing for tree growth. The growth will stop above this temperature. The Topt1 and Topt2 values define the range of optimal temperatures, when growth is not limited by temperature. Then, the temperature-dependent partial growth rate is estimated by piece-wise linear function, where the mean daily temperature (T) from the weather station (input data) is an independent variable, as follows:
G r T = { 0 , ( T T m i n ) / ( T o p t 1 T m i n ) ,     1 ,     ( T m a x T ) / ( T m a x T o p t 2 ) , 0 ,     T < T m i n T m i n < T < T o p t 1 T o p t 1 < T < T o p t 2 T o p t 2 < T < T m a x T > T m a x
The wetness-dependent partial growth rate (GrW) is calculated in the same way, using four threshold values (Wmin, Wopt1, Wopt2, and Wmax), and the modeled soil moisture (W) as an independent variable. The light-dependent partial growth rate (GrE) is a ratio of the incoming daily solar radiation to its maximum value on the summer solstice, calculated from the site latitude.
All of the numerical values of the model parameters are initially estimated from the species’ traits and sampling site description, and then corrected by the re-iterative process. In this study, a VS-Oscilloscope was used for this purpose, which is a visual parameterization tool that offers an interactive search of the optimal values of the VS-model parameters, such as optimal and extreme values of the temperature and soil moisture for the growth of a particular species, the soil features, coefficients for transpiration rate calculation, and so on. [29,30]. The criteria of optimality are estimations of the similarity between the simulated and the actual standardized tree-ring chronology, namely, their correlation and the synchronicity coefficient (the proportion of unidirectional changes of growth in actual and modeled TRW chronologies). A model parameterization was performed for each species’ chronology separately.
To test the model stability in a changing climate, the considered simulation period (covered by daily T and P series without missing values, i.e., 1936–2016) was divided into two sub-periods for longer chronologies of larch and pine, as follows: calibration (1970–2016) and verification (1936–1969) [23]. For the shorter elm and birch chronologies, the model was calibrated along the entire chronology length without verification. Additionally, the daily series and integral seasonal sums of the general and partial modeled growth rates were compared with the respective seasonal climatic conditions and the actual radial growth over several years.

3. Results

3.1. Regional Climate Change

The linear time trends in the seasonal climatic series show a significant (p < 0.05) increase in temperature (Figure 3) during the instrumental observation period (1936–2017). This warming was much faster during the cold season (season of negative mean monthly temperatures: November–March, 0.62 °C per decade) than during the warm season (April–October, 0.13 °C per decade). The overall warming of the annual temperature was 0.33 °C per decade. At the same time, the precipitation change was not significant, but we can note an increase in the warm season rainfall (~6.7 mm per decade). Over the same period, the PDSI decreased significantly (more drought). The division of observation period into two equal sub-periods (1936–1976 and 1977–2017), and the comparison of their climate in a finer resolution support these facts, namely: the difference between the temperatures of these sub-periods is significant (p < 0.05) only during the cold season, and rainfall throughout the warm season, except for July, was slightly larger in the 1977–2017 sub-period. As for the drought indices, PDSI had a significantly lower mean value and variation during the second sub-period for all of the months. At the same time, HTC had higher mean values for the second sub-period in June and August, a lower value in July, and no significant differences in May and September.

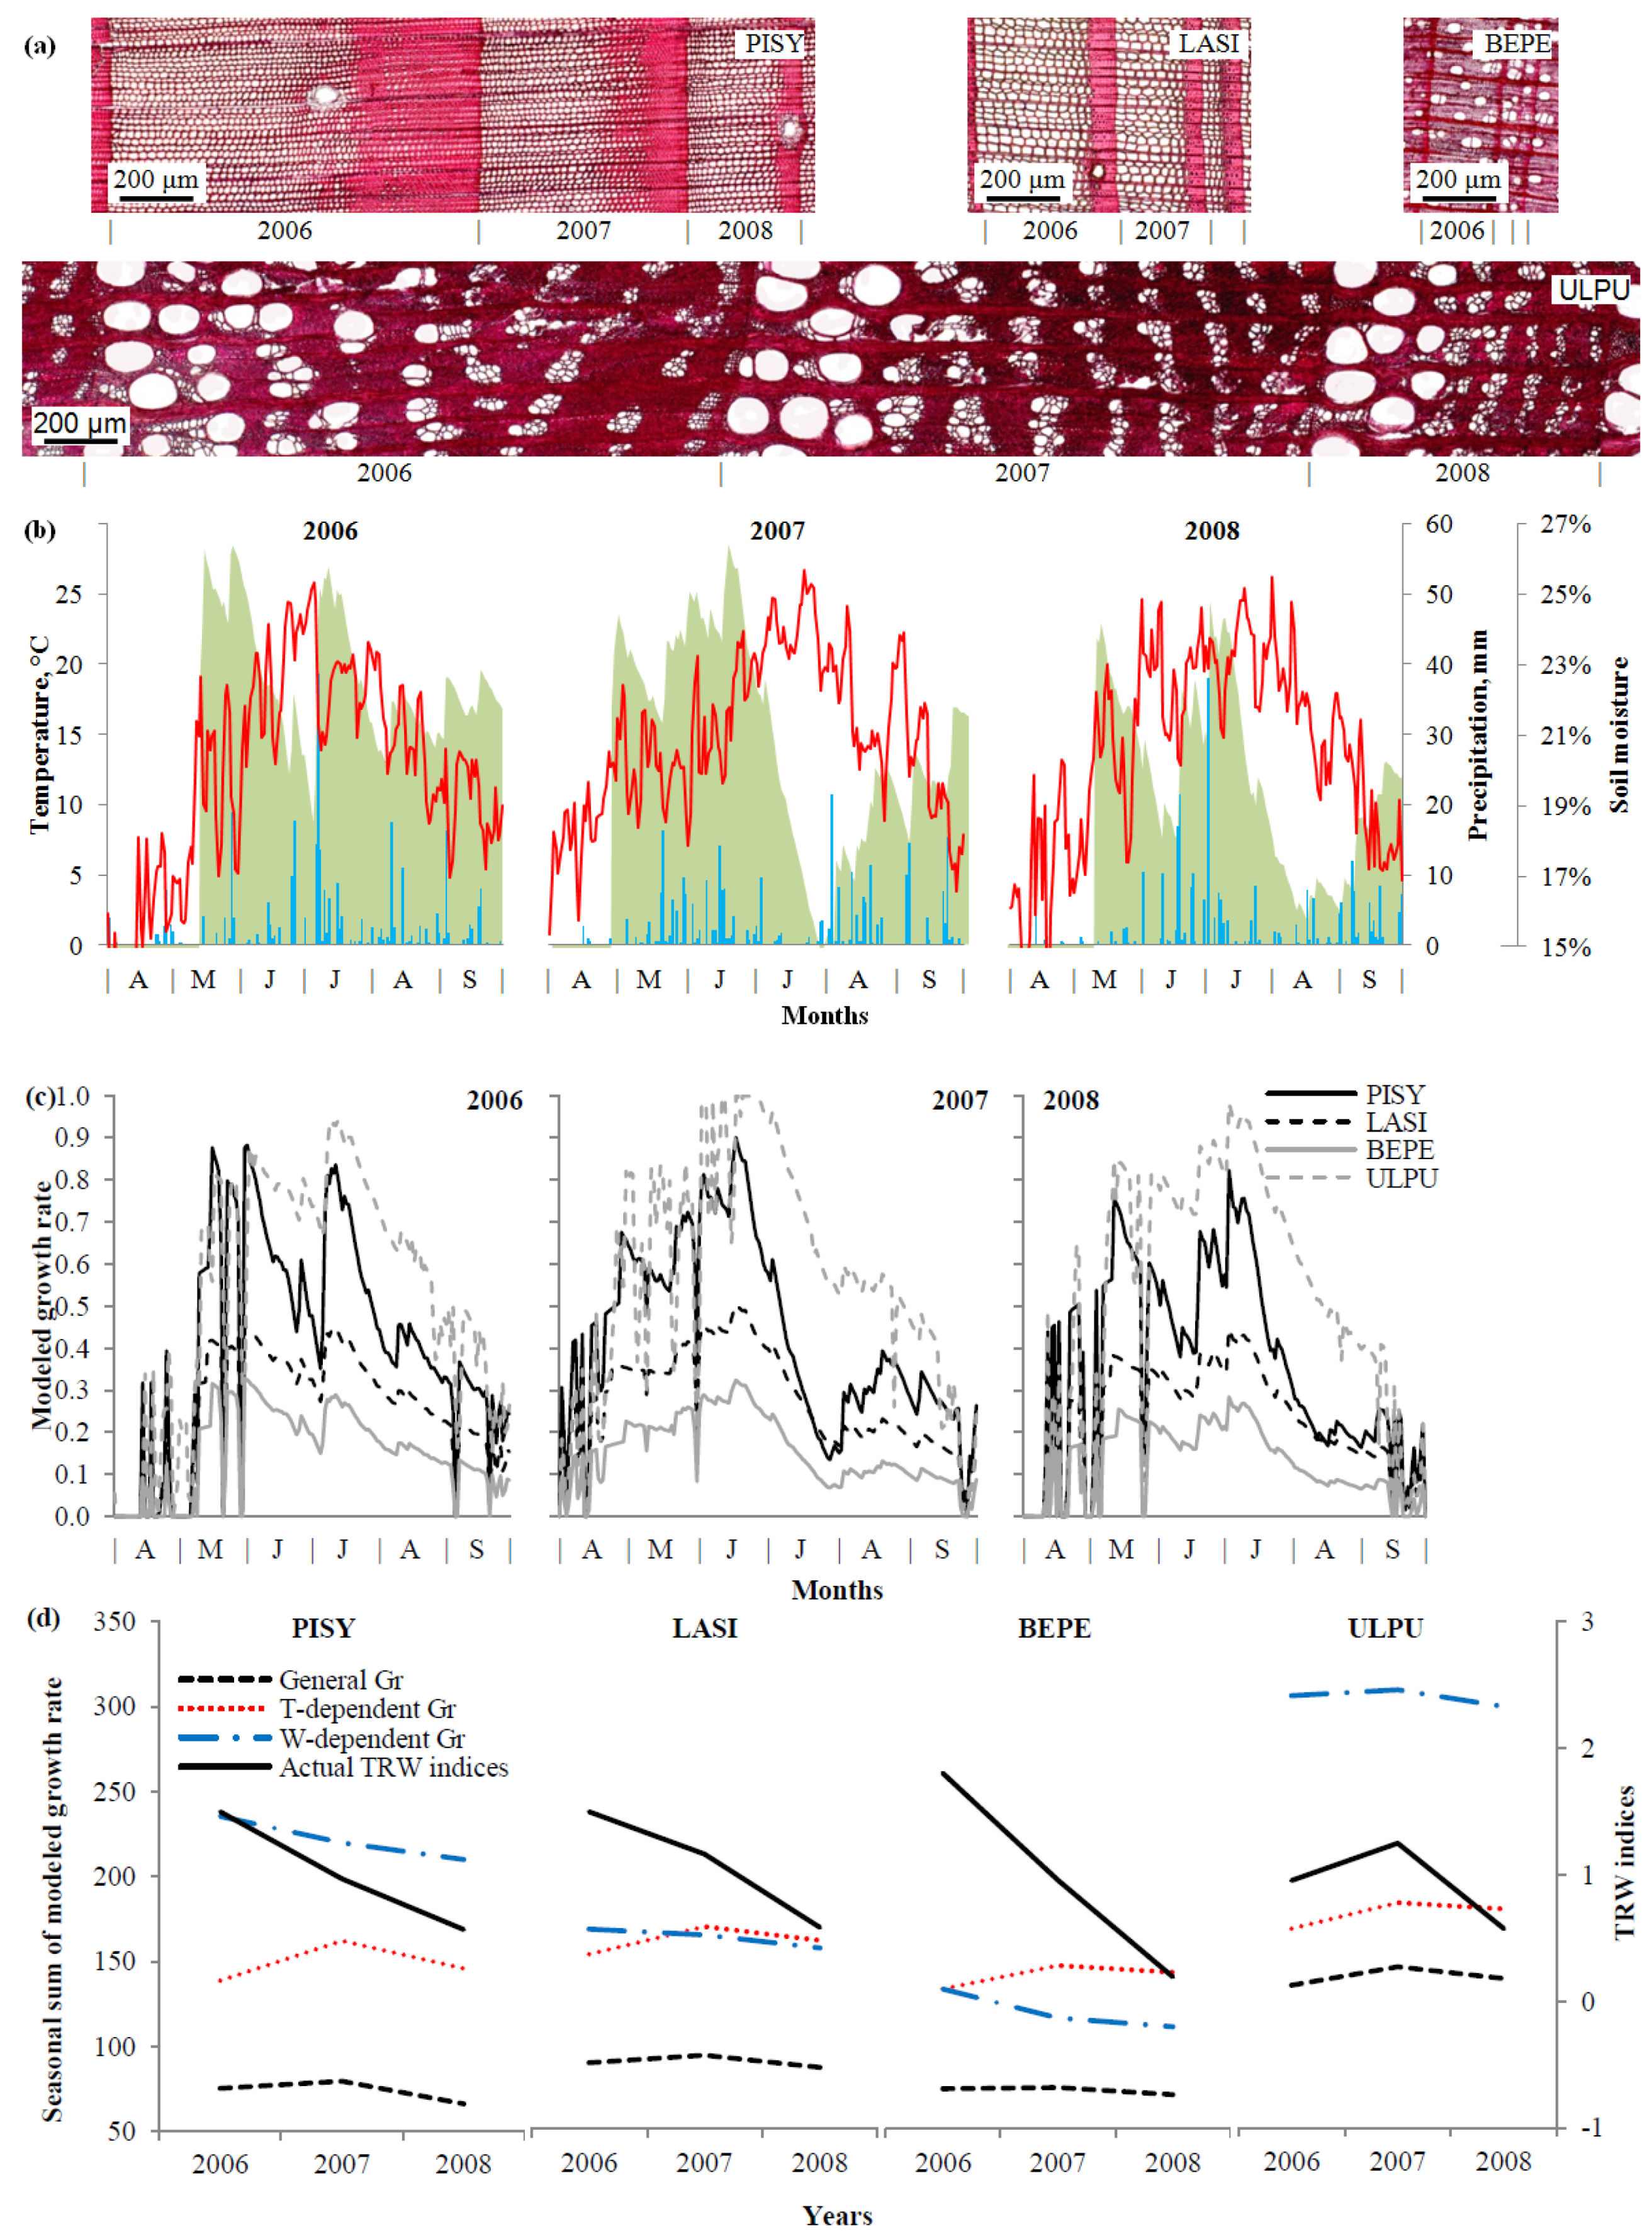
3.2. Tree-Ring Width Chronologies

The statistical characteristics of the TRW standard chronologies are presented in Table 1. The presence of several older conifer trees at the main site allowed us to extend their chronologies to 145 years for pine, and 269 years for larch, in comparison to the 63-year birch chronology. On the other hand, because of the recent introduction of the species, the oldest elm trees found in the Bidja vicinity were only 24 years old. All four species demonstrated a large variability of radial growth, both in general (standard deviations 0.23–0.52) and in regards to the year-to-year component (mean sensitivity coefficient 0.29–0.43), with the highest variation in the growth of the birch, and the lowest one in the growth of elm. At the same time, all of the series contain a strong common signal, as is shown by the inter-serial correlations above 0.5. The sample depth is sufficient during all of the periods of instrumental climatic observation for conifers, and almost all of the available lengths of broadleaf species’ chronologies (EPS > 0.85; Figure 4). At the main sampling site, all three species grow in synchrony, as is evident from the high correlations between their chronologies (Table 2). The highest correlation is observed between larch and birch; pine has lower correlations with other species. The elm growth dynamics are not synchronous with the other species—its chronology does not have significant correlations with the others.

3.3. Climate–Growth Relationships

As a result of the various lengths of the chronologies, the dendroclimatic analysis has some particularities, namely: climate–growth correlations have the same reliability for conifers over both 41-year sub-periods, and for birch over the second sub-period. On the other hand, one should be careful about the results for birch over the first sub-period and for elm, because their reliability is hampered by the short length of the series (21 year). Nevertheless, some climate–growth correlations are still significant in these cases.
The climatic response of conifers and birch is similar. The most pronounced reaction is the growth stimulation by rainfall from May to mid-July, coupled with a less strong growth limitation by the temperatures of the same season (Figure 5). The hydrothermal coefficient correlates with the tree radial growth from May to mid-July. Correlations between the radial growth of conifers and the climatic variables are less stable and had lower values in 1936–1976 than in 1977–2017, with a later onset and earlier ending of the significant response to precipitation. As for the elm chronology, its climatic reaction consists of a positive correlation with the moisture supply in May–beginning of June, and a negative relationship with the July temperatures. In the end of August and in September, the climatic correlations of elm are reversed (positive response to temperature and negative one to precipitation and HTC). The monthly PDSI series also correlates positively with the chronologies of all four species. The maximal correlations were observed in July (0.52–0.58).

3.4. Growth Modeling

The VS-modeling for all four species’ site chronologies is presented in Table 3 and Figure 4. It should be noted that the optimal parameters of the model for elm include the lowest value of minimal soil moisture and the widest range of optimal soil moisture, as well as the lowest values of coefficients for the transpiration calculation (i.e., the slowest rate of transpiration). The fraction of precipitation not caught by the crown is the highest for conifers and the lowest for elm. On the other hand, elm has the lowest minimum temperature threshold for growth. These parameters provide correlations between the actual and modeled chronologies in the range of 0.546–0.627 over the calibration period, and 0.458–0.584 over the verification period for conifers, with the synchronicity coefficients above 65%.
The daily series of the external conditions and modeled growth rates in comparison with the actual tree rings for all four species were considered using the example of 2006–2008. For more than 75% of the individual trees of each species, during these years, the TRW series had a pattern of the widest ring in 2006 and the narrowest one in 2008 (Figure 6a). This pattern was also observed in both the earlywood and latewood of the wide rings of pine and elm, and only in the earlywood of the narrow rings of birch and larch. Anomalies of the wood anatomy were not observed during these years for any species. The weather of these years was characterized by the following patterns: for 2006, late but a warm beginning in the growth season, high soil moisture during the most of summer except the end of June; for 2007, early beginning in the growth season, wet and cool May–June, and dry and warm July and August; and for 2008, warm summer with droughts in the first half of June and from mid-July (Figure 6b). The modeled dynamics of tree growth show a slower growth rate for larch and birch, a medium growth rate with severe intra-seasonal depressions (deviations from the maximal growth rate curve controlled by solar radiation) for pine, and the fastest growth rate with minimal depressions for elm (Figure 6c), which is consistent with the actual TRW. A comparison of the years shows that the modeled growth rates for all of the species have a maximal in May–beginning of June and mid-July in 2006, June in 2007, and beginning of July in 2008. At the same time, the interannual pattern of wide–medium–narrow rings observed in the actual TRW in 2006–2008 is not present in the dynamics of the integral sums of the modeled general growth rate, but only in its moisture-dependent component (Figure 6d).

4. Discussion

4.1. Growth Patterns of Considered Species

The sensitivity and variation of the considered species’ chronologies in the study area are in good agreement with their ranking by the drought tolerance (elm-pine-larch-birch, in decreasing order [48,49]). On the other hand, the sensitivity coefficient of the elm chronology can also be reduced by its young age, as many researchers have noted an age-related increase in the climatic sensitivity of tree growth [50,51,52]. The greater similarity between the dynamics of larch and birch growth is most likely due to the physiological and phenological differences of evergreen pine, due to the presence of foliage at the growth season onset, and the subsequent absence of a delay in cambium activation [15,53]. Unlike many other drought-limited areas in continental Asia, there are no sharply decreasing trends in tree radial growth and high tree mortality in the study area over the last several decades, probably because of the positive trend of precipitation partially compensating for climate warming, and thus a slower increase of PDSI [10].
While the study area is the southern/lower border of the distribution range for both the conifers and birch, the opposite is observed for elm, as its natural range is located in the more arid steppes and semi-deserts. Therefore, this is likely the reason its growth dynamics are asynchronous with the other species.

4.2. Climatic Response and Growth Modeling of Trees

In general, the combination of a positive precipitation effect on tree growth and a weaker negative impact of temperature during the first half of the growing season is typical for the semi-arid areas of the region [54,55]. It should be noted that this reaction is coherent for all three species growing at the main sampling site, indicating a similar degree of drought tolerance and a strategy of acclimation to the moisture deficit. Regarding the possible change of climatic response due to increased temperatures, the moisture limitation of tree growth in the forest-steppe has not changed significantly over recent decades. This may be due to the fact that the temperature increase is relatively slow during the growth season, and may be compensated by a positive trend in precipitation, and the decreased mean PDSI is compensated by its lesser variation (i.e., the absence of extreme droughts in the second sub-period).
Ulmus pumila is one of the most xerophytic elm species [18,56], and its strategy of acclimation in moisture-limited regions is based on several anatomical features and physiological mechanisms. Despite the very large vessels that are potentially more vulnerable to cavitation, elm has an effective phenotypic regulation of transpiration at the level of stomatal morphology [57]. As in a typical ring-porous tree, the sap flows mainly through the earlywood vessels of the last ring, and the contribution of the preceding rings does not exceed 10% [58,59], primarily because of losing the hydraulic conductivity of very large earlywood vessels in winter [60]. It likely provides a greater extent of elm acclimation to the current season conditions by the high plasticity of the hydraulic structure, first of all during the formation of earlywood. On the other hand, the heartwood of elm (i.e., most of its trunk volume) serves as a water storage (cf. other angiosperm species [13,14]). This feature differs significantly from the considered conifers, which have a wider proportion of sapwood [61,62] (cf. also observation of the last ring accounting for only 15%–20% of the hydraulic conductivity of Scots pine [63]), whereas birch does not form a heartwood at all. The differences in the elm hydraulic strategy possibly lead to a concentration of its response to precipitation and HTC in the beginning of the growth season, when earlywood is forming. If the moisture supply is sufficient at this time, excessive water can be reserved in the heartwood and used later for mitigating the effects of moisture deficit. Also, the possible onset of growth at the lower temperatures (~1 °C) gives elm an advantage of using snowmelt water. On the other hand, as the seasonal dynamics of HTC show, droughts in the study area occur more frequently in May–early June. Therefore, it is possible that later in the season, conditions are usually not extreme enough to cause a water stress and a significant growth response in elm, which is supported by the difference in the optimal values of the VS-model parameters and the less pronounced depression of the growth rate due to the soil moisture decrease (Figure 6). A negative reaction to July temperatures may be caused by heat stress. The reverse climatic response of elm in August–September, when moisture supply is usually maximal (more precipitation and higher HTC), can be caused by its low tolerance to excessive soil moisture [18,20]. There is, however, an open question whether these correlations have an ecological meaning, because at that time of season, the radial growth is mostly finished [59]. In general, the significant climatic impact on elm growth in the study area has shorter seasonal windows compared with the other considered species, which also gives it an advantage, because there are time intervals in the warm season when the moisture deficit can suppress the growth of native species, but not for elm.
Despite the different seasonality of the climatic response, the regulation of the radial growth by the soil moisture content is common for all four species. It is supported by their strong response to PDSI in July, which due to its high month-to-month autocorrelation, can be considered as an integral characteristic of water supply during most periods of tree ring formation. A weakening of the response to all of the climatic variables in August indicates that the cambial activity terminates near the end of July-beginning of August for all of the tree species in the study area, but after that the TRW still can register a climatic influence to the lesser extent—via the expansion of cells.
It has been shown before that in a dry environment, the onset of xylogenesis is regulated by both the temperature threshold and moisture supply [64]. Later, both the growth rate during the season and the timing of the growth cessation are regulated by water deficit [65]. The VS-model takes into consideration the temperature threshold explicitly as one of its parameters (Tbeg in Table 3), and includes the growth suppression by drought throughout the season. However, moderate correlations between the actual and modeled tree growth show that the algorithm used for describing the climate–growth relationships and the phenology of xylogenesis in the VS-model are not conclusive yet, and can be further improved. For example, the comparison of the growth rates for 2006–2008 suggests that, probably, a contribution of moisture limitation in the growth rate should be increased, and new parameters should be defined for the cessation of growth.

4.3. Prospects of Tree Stands Dynamics Under Climate Change

The smaller size, and less shade- and drought-tolerant nature of birch can lead to its gradual displacement to the margins and open parts of the stand. This is supported by the currently observed absence of birch seedlings in the close-canopy parts of the stand. The appreciable warming during the winter months can also have a positive effect on the tree growth, reducing the likelihood of injuries due to frost in winter, and carbohydrates cost for the restoration of hydraulic conductivity in spring. This effect is stronger for angiosperms, especially for ring-porous elm [12]. In addition, the increase in the moisture deficit during recent decades has been rather slow, which allows for forest stands in the forest-steppe zone to adapt successfully to the new climatic averages.
Despite a low possibility of observing climate change effects on elm growth directly because of the short length of the chronology, it is expected that the winter temperature increase will have a positive effect on elm, contributing to the spread of this species through the overgrowing of steppes and abandoned farmland (Figure 2f), and the relatively high rate of this process can be ensured through a short reproductive cycle and high migratory ability of this species (abundant fruiting and wind-dispersion of very light seeds).

5. Conclusions

The study showed that warming is partially compensated by the increased precipitation in the studied region. This compensation slowed down the increase in the climate aridity, allowing pine, larch, and birch to successfully acclimate to the current conditions in the forest-steppe zone. Acclimation is confirmed by the data of the dendroclimatic analysis and the modeling of the tree rings. In more arid steppe conditions, the anatomical and morphological features of elm give it advantages, contributing to the rapid replacement of steppe vegetation with savanna-like shrubs of this species.

Author Contributions

Conceptualization, E.A.B. and E.A.V.; methodology, E.A.V.; software, I.I.T.; validation, E.A.V. and K.V.K.; formal analysis, L.V.B. and I.I.T.; investigation, D.F.Z.; resources, E.A.B. and D.F.Z.; data curation, L.V.B.; writing (original draft preparation), E.A.B., D.F.Z., and L.V.B.; writing (review and editing), L.V.B., D.F.Z., and K.V.K.; visualization, L.V.B.; supervision, E.A.V.; project administration, E.A.B. and K.V.K.; funding acquisition, E.A.V. and K.V.K.

Funding

This research was funded by the Russian Science Foundation, grant numbers 19-18-00145 (“Modeling of the mutual impact of climate change processes and the development of the forestry economy: case-study of Siberian regions” PI: E.A.V.) and 19-14-00120 (“Study of genetic adaptation of trees to stress environmental factors on the basis of genome-wide and dendrochronological analysis in the context of global climate change” PI: K.V.K), and by the Ministry of Science and Higher Education of the Russian Federation, Program Science of Future, project number 5.3508.2017/4.6 (PI: V.V.S.).

Conflicts of Interest

The authors declare no conflict of interest. The funders had no role in the design of the study; in the collection, analyses, or interpretation of data; in the writing of the manuscript; or in the decision to publish the results.

References

  1. Dai, A.; Trenberth, K.E.; Karl, T.R. Global variations in droughts and wet spells: 1900–1995. Geophys. Res. Lett. 1998, 25, 3367–3370. [Google Scholar] [CrossRef]
  2. Dulamsuren, C.; Khishigjargal, M.; Leuschner, C.; Hauck, M. Response of tree-ring width to climate warming and selective logging in larch forests of the Mongolian Altai. J. Plant Ecol. 2014, 7, 24–38. [Google Scholar] [CrossRef]
  3. Flanagan, P.X.; Basara, J.B.; Xiao, X. Long-term analysis of the asynchronicity between temperature and precipitation maxima in the United States Great Plains. Int. J. Climatol. 2017, 37, 3919–3933. [Google Scholar] [CrossRef]
  4. Rogers, J.C.; Mosely-Thompson, E. Atlantic Arctic cyclones and mild Siberian winters of the 1980s. Geophys. Res. Lett. 1995, 22, 799–802. [Google Scholar] [CrossRef]
  5. Savelieva, N.I.; Semiletov, I.P.; Vasilevskaya, L.N.; Pugach, S.P. A climate shift in seasonal values of meteorological and hydrological parameters for Northeastern Asia. Prog. Oceanogr. 2000, 47, 279–297. [Google Scholar] [CrossRef]
  6. Davi, N.K.; Jacoby, G.C.; Curtis, A.E.; Baatarbileg, N. Extension of drought records for central Asia using tree rings: West-central Mongolia. J. Clim. 2006, 19, 288–299. [Google Scholar] [CrossRef]
  7. IPCC Climate Change. The Physical Science Basis. Contribution of Working Group I to the Fifth Assessment Report of the Intergovernmental Panel on Climate Change; Stocker, T.F., Qin, D., Plattner, G.K., Tignor, M., Allen, S.K., Boschung, J., Nauels, A., Xia, Y., Bex, V., Midgley, P.M., Eds.; Cambridge University Press: Cambridge, UK, 2013; p. 1535. [Google Scholar]
  8. Kattsov, V.M.; Semenov, S.M. (Eds.) Second Roshydromet Assessment Report on Climate Change and Its Consequences in Russian Federation; Roshydromet: Moscow, Russia, 2014; p. 54. [Google Scholar]
  9. Liu, X.; Pan, Y.; Zhu, X.; Yang, T.; Bai, J.; Sun, Z. Drought evolution and its impact on the crop yield in the North China Plain. J. Hydrol. 2018, 564, 984–996. [Google Scholar] [CrossRef]
  10. Liu, H.; Park Williams, A.; Allen, C.D.; Guo, D.; Wu, X.; Anenkhonov, O.A.; Liang, E.; Sandanov, D.V.; Yin, Y.; Qi, Z.; et al. Rapid warming accelerates tree growth decline in semi-arid forests of Inner Asia. Glob. Chang. Biol. 2013, 19, 2500–2510. [Google Scholar] [CrossRef]
  11. McDowell, N.; Pockman, W.T.; Allen, C.D.; Breshears, D.D.; Cobb, N.; Kolb, T.; Plaut, J.; Sperry, J.; West, A.; Williams, D.G.; et al. Mechanisms of plant survival and mortality during drought: Why do some plants survive while others succumb to drought? N. Phytol. 2008, 178, 719–739. [Google Scholar] [CrossRef]
  12. Carnicer, J.; Barbeta, A.; Sperlich, D.; Coll, M.; Peñuelas, J. Contrasting trait syndromes in angiosperms and conifers are associated with different responses of tree growth to temperature on a large scale. Front. Plant Sci. 2013, 4, 409. [Google Scholar] [CrossRef] [Green Version]
  13. Matheny, A.M.; Bohrer, G.; Garrity, S.R.; Morin, T.H.; Howard, C.J.; Vogel, C.S. Observations of stem water storage in trees of opposing hydraulic strategies. Ecosph. 2015, 6, 1–13. [Google Scholar] [CrossRef]
  14. Hu, G.; Liu, H.; Shangguan, H.; Wu, X.; Xu, X.; Williams, M. The role of heartwood water storage for semi-arid trees under drought. Agric. For. Meteorol. 2018, 256–257, 534–541. [Google Scholar] [CrossRef]
  15. Piper, F.I.; Fajardo, A. Foliar habit, tolerance to defoliation and their link to carbon and nitrogen storage. J. Ecol. 2014, 102, 1101–1111. [Google Scholar] [CrossRef]
  16. Nazimova, D.I.; Polikarpov, N.P. Forest zones of Siberia as determined by climatic zones and their possible transformation trends under global change. Silva Fenn. 1996, 30, 201–208. [Google Scholar] [CrossRef] [Green Version]
  17. Babushkina, E.A.; Belokopytova, L.V.; Zhirnova, D.F.; Shah, S.K.; Kostyakova, T.V. Climatically driven yield variability of major crops in Khakassia (South Siberia). Int. J. Biometeorol. 2018, 62, 939–948. [Google Scholar] [CrossRef]
  18. Wang, C.W. The Forests of China, with a Survey of Grassland and Desert Vegetation; Harvard University: Cambridge, UK, 1961. [Google Scholar]
  19. Wesche, K.; Walther, D.; VonWehrden, H.; Hensen, I. Trees in the desert: Reproduction and genetic structure of fragmented Ulmus pumila forests in Mongolian drylands. Flora Morphol. Distrib. Funct. Ecol. Plants 2011, 206, 91–99. [Google Scholar] [CrossRef]
  20. Mamyshev, K.V. Biology and morphological characteristics of Ulmus pumila L. in the system of belts Uybat steppe. Theor. Appl. Sci. 2014, 3, 76–80. [Google Scholar] [CrossRef]
  21. Fritts, H.C. Tree Rings and Climate; Academic Press: London, UK, 1976. [Google Scholar]
  22. Vaganov, E.A.; Hughes, M.K.; Shashkin, A.V. Growth Dynamics of Conifer Tree Rings: Images of Past and Future; Springer: Berlin, Germany, 2006. [Google Scholar]
  23. Cook, E.R.; Kairiukstis, L.A. Methods of Dendrochronology: Applications in the Environmental Sciences; Kluwer Academic Publishers: Dordrecht, The Netherlands, 1990. [Google Scholar] [CrossRef]
  24. Hughes, M.K.; Swetnam, T.W.; Diaz, H.F. (Eds.) Dendroclimatology: Progress and Prospects; Springer: New York, NY, USA, 2010. [Google Scholar]
  25. Misson, L. MAIDEN: A model for analyzing ecosystem processes in dendroecology. Can. J. For. Res. 2004, 34, 874–887. [Google Scholar] [CrossRef]
  26. Dufrene, E.; Davi, H.; Francois, C.; le Maire, G.; Le Dantec, V.; Granier, A. Modelling carbon and water cycles in a beech forest. Part I: Model description and uncertainty analysis on modelled NEE. Ecol. Modell. 2005, 185, 407–436. [Google Scholar] [CrossRef]
  27. Buckley, L.B.; Urban, M.C.; Angilletta, M.J.; Crozier, L.G.; Rissler, L.J.; Sears, M.W. Can mechanism inform species’ distribution models? Ecol. Lett. 2010, 13, 1041–1054. [Google Scholar] [CrossRef]
  28. Drew, D.M.; Downes, G.M.; Battaglia, M. CAMBIUM, a process-based model of daily xylem development in Eucalyptus. J. Theor. Biol. 2010, 264, 395–406. [Google Scholar] [CrossRef] [PubMed]
  29. Shishov, V.V.; Tychkov, I.I.; Popkova, M.I.; Ilyin, V.A.; Bryukhanova, M.V.; Kirdyanov, A.V. VS-oscilloscope: A new tool to parameterize tree radial growth based on climate conditions. Dendrochronologia 2016, 39, 42–50. [Google Scholar] [CrossRef] [Green Version]
  30. Tychkov, I.I.; Sviderskaya, I.V.; Babushkina, E.A.; Popkova, M.I.; Vaganov, E.A.; Shishov, V.V. How can the parameterization of a process-based model help us understand real tree-ring growth? Trees 2019, 33, 345–357. [Google Scholar] [CrossRef]
  31. Liang, W.; Heinrich, I.; Simard, S.; Helle, G.; Dorado Linan, I.; Heinken, T. Climate signals derived from cell anatomy of Scots pine in NE Germany. Tree Physiol. 2013, 33, 833–844. [Google Scholar] [CrossRef] [PubMed]
  32. Carrer, M.; Castagneri, D.; Prendin, A.L.; Petit, G.; von Arx, G. Retrospective analysis of wood anatomical traits reveals a recent extension in tree cambial activity in two high-elevation conifers. Front. Plant Sci. 2017, 8, 737. [Google Scholar] [CrossRef] [PubMed]
  33. Lobanov, A.I.; Varaksin, G.S. Effect of seeding method and microtopography on vegetation and condition of Siberian elm stands in shelter forest belts of arid steppe zone of Khakassia. For. J. 2012, 2, 28–34. [Google Scholar]
  34. Shiyatov, S.G. Dendrochronology of the Higher Timberline on the Urals; Nauka: Moscow, Russia, 1986. [Google Scholar]
  35. Wigley, T.M.L.; Briffa, K.R.; Jones, P.D. On the average value of correlated time series, with applications in dendroclimatology and hydrometeorology. J. Appl. Meteorol. Climatol. 1984, 23, 201–213. [Google Scholar] [CrossRef]
  36. Alisov, B.P. Climate of the USSR; Moscow State University: Moscow, Russia, 1956. [Google Scholar]
  37. Bazhenova, O.I.; Tyumentseva, E.M. The structure of contemporary denudation in the steppes of the Minusinskaya depression. Geogr. Nat. Resour. 2010, 31, 362–369. [Google Scholar] [CrossRef]
  38. Harris, I.; Jones, P.D.; Osborn, T.J.; Lister, D.H. Updated high-resolution grids of monthly climatic observations—The CRU TS3.10 Dataset. Int. J. Climatol. 2014, 34, 623–642. [Google Scholar] [CrossRef]
  39. Babushkina, E.; Belokopytova, L.; Zhirnova, D.; Barabantsova, A.; Vaganov, E. Divergent growth trends and climatic response of Picea obovata along elevational gradient in Western Sayan Mountains, Siberia. J. Mt. Sci. 2018, 15, 2378–2397. [Google Scholar] [CrossRef]
  40. Selyaniniov, G.T. Principles of agroclimatic regional planning in USSR. In Questions of Agroclimatic Zoning of the USSR; Davitaya, F.F., Shulgina, A.I., Eds.; Ministry of Agriculture of the USSR: Moscow, Russia, 1958; pp. 18–26. [Google Scholar]
  41. Van der Schrier, G.; Barichivich, J.; Briffa, K.R.; Jones, P.D. A scPDSI-based global data set of dry and wet spells for 1901–2009. J. Geophys. Res. Atmos. 2013, 118, 4025–4048. [Google Scholar] [CrossRef]
  42. Cherenkova, E.A.; Zolotokrylin, A.N. On the comparability of some quantitative drought indices. Fundam. Appl. Climatol. 2016, 2, 79–94. [Google Scholar] [CrossRef]
  43. Rice, J.A. Mathematical Statistics and Data Analysis, 3rd ed.; Thomson/Brooks/Cole: Belmont, CA, USA, 2007. [Google Scholar]
  44. Rinn, F. TSAP-Win: Time Series Analysis and Presentation for Dendrochronology and Related Applications: User Reference; RINNTECH: Heidelberg, Germany, 2003. [Google Scholar]
  45. Holmes, R.L. Computer-assisted quality control in tree-ring dating and measurement. Tree Ring Bull. 1983, 43, 68–78. [Google Scholar]
  46. Cook, E.R.; Krusic, P.J. Program ARSTAN: A Tree-Ring Standardization Program Based on Detrending and Autoregressive Time Series Modeling, with Interactive Graphics; Lamont-Doherty Earth Observatory, Columbia University: New York, NY, USA, 2005. [Google Scholar]
  47. Vaganov, E.A.; Anchukaitis, K.J.; Evans, M.N. How well understood are the processes that create dendroclimatic records? A mechanistic model of the climatic control on conifer tree-ring growth dynamics. In Dendroclimatology: Progress and Prospects; Hughes, M.K., Swetnam, T.W., Diaz, H.F., Eds.; Springer: New York, USA, 2011; pp. 37–75. [Google Scholar]
  48. Chetin, Y.I. Features of growth and drought tolerance of larch, pine, spruce and birch in cultures of the agroforestmeliorative zone of Western Siberia. In Works on Forestry of Siberia, Proceedings of the Conference on Rationalization of Siberian Forestry, Novosibirsk, Russia, 12–15 September 1957; AS USSR: Novosibirsk, Russia, 1958; Volume 4, pp. 328–338. [Google Scholar]
  49. Niinemets, Ü.; Valladares, F. Tolerance to shade, drought, and waterlogging of temperate Northern Hemisphere trees and shrubs. Ecol. Monogr. 2006, 76, 521–547. [Google Scholar] [CrossRef]
  50. Carrer, M.; Urbinati, C. Age-dependent tree-ring growth responses to climate in Larix decidua and Pinus cembra. Ecol. 2004, 85, 730–740. [Google Scholar] [CrossRef]
  51. Esper, J.; Niederer, R.; Bebi, P.; Frank, D. Climate signal age effects—Evidence from young and old trees in the Swiss Engadin. For. Ecol. Manag. 2008, 255, 3783–3789. [Google Scholar] [CrossRef]
  52. Dorado Linan, I.; Gutiérrez, E.; Heinrich, I.; Andreu-Hayles, L.; Muntán, E.; Campelo, F.; Helle, G. Age effects and climate response in trees: A multi-proxy tree-ring test in old-growth life stages. Eur. J. For. Res. 2012, 131, 933–944. [Google Scholar] [CrossRef]
  53. Kraus, C.; Zang, C.; Menzel, A. Elevational response in leaf and xylem phenology reveals different prolongation of growing period of common beech and Norway spruce under warming conditions in the Bavarian Alps. Eur. J. For. Res. 2016, 135, 1011–1023. [Google Scholar] [CrossRef]
  54. Babushkina, E.A.; Vaganov, E.A.; Belokopytova, L.V.; Shishov, V.V.; Grachev, A.M. Competitive strength effect in the climate response of Scots pine radial growth in south-central Siberia forest-steppe. Tree Ring Res. 2015, 71, 106–117. [Google Scholar] [CrossRef]
  55. Babushkina, E.A.; Belokopytova, L.V.; Shah, S.K.; Zhirnova, D.F. Past crops yield dynamics reconstruction from tree-ring chronologies in the forest-steppe zone based on low- and high-frequency components. Int. J. Biometeorol. 2018, 62, 861–871. [Google Scholar] [CrossRef]
  56. Ghelardini, L. Bud Burst Phenology, Dormancy Release and Susceptibility to Dutch Elm Disease in Elms (Ulmus spp.). Ph.D. Thesis, Swedish University of Agricultural Sciences, Uppsala, Sweden, 2007. [Google Scholar]
  57. Park, G.E.; Lee, D.K.; Kim, K.W.; Batkhuu, N.O.; Tsogtbaatar, J.; Zhu, J.J.; Jin, Y.; Park, P.S.; Hyun, J.O.; Kim, H.S. Morphological characteristics and water-use efficiency of Siberian elm trees (Ulmus pumila L.) within arid regions of northeast Asia. Forests 2016, 7, 280. [Google Scholar] [CrossRef]
  58. Tyree, M.T.; Zimmermann, M.H. Xylem Structure and the Ascent of Sap; Springer: Berlin, Germany, 2002. [Google Scholar]
  59. Solla, A.; Martín, J.A.; Corral, P.; Gil, L. Seasonal changes in wood formation of Ulmus pumila and U. minor and its relation with Dutch elm disease. N. Phytol. 2005, 166, 1025–1034. [Google Scholar] [CrossRef] [PubMed]
  60. Cochard, H.; Tyree, M.T. Xylem dysfunction in Quercus: Vessel sizes, tyloses, cavitation and seasonal changes in embolism. Tree Physiol. 1990, 6, 393–407. [Google Scholar] [CrossRef] [PubMed]
  61. Wang, X.; Wang, C.; Zhang, Q.; Quan, X. Heartwood and sapwood allometry of seven Chinese temperate tree species. Ann. For. Sci. 2010, 67, 410. [Google Scholar] [CrossRef]
  62. Millers, M. The proportion of heartwood in conifer (Pinus sylvestris L., Picea abies [L.] H. Karst.) trunks and its influence on trunk wood moisture. J. For. Sci. 2013, 59, 295–300. [Google Scholar] [CrossRef]
  63. Urli, M.; Porté, A.J.; Cochard, H.; Guengant, Y.; Burlett, R.; Delzon, S. Xylem embolism threshold for catastrophic hydraulic failure in angiosperm trees. Tree Physiol. 2013, 33, 672–683. [Google Scholar] [CrossRef]
  64. Ren, P.; Rossi, S.; Camarero, J.J.; Ellison, A.M.; Liang, E.; Peñuelas, J. Critical temperature and precipitation thresholds for the onset of xylogenesis of Juniperus przewalskii in a semi-arid area of the north-eastern Tibetan Plateau. Ann. Bot. 2017, 121, 617–624. [Google Scholar] [CrossRef]
  65. Swidrak, I.; Gruber, A.; Oberhuber, W. Xylem and phloem phenology in co-occurring conifers exposed to drought. Trees 2014, 28, 1161–1171. [Google Scholar] [CrossRef] [Green Version]
Figure 1. The study area: (a) a satellite map with two sampling sites marked by brown triangles, the Minusinsk weather station marked by a blue circle, the area of the Climate Research Unit Time-Series (CRU TS) grid climatic series integration (rectangles with spatial resolution of 0.5° × 0.5°), and an inset map of the area location in the Asian part of Russia; (b) the climatic diagram of the temperature (lines) and precipitation (bars) daily series (1936–2017) from the Minusinsk weather station—the mean values are marked with darker shades, and the ranges of variation (standard deviations) are highlighted with lighter shades.
Forests 10 00999 g001
Figure 2. Sampling sites: (a) mature larch tree at the main site; (b) mature pine tree at the main site; (c) general view of the forest stand at the main site; (d) young pine trees on the forest boundary at the main site; (e) elm shelter belt; (f) steppe overgrowing with elm.
Forests 10 00999 g002
Figure 3. Climatic dynamics in the study area, as follows: (a) Inter-annual dynamics of the temperature integrated for the warm season (April–October), the cold season (November–March), and the calendar year straight lines represent the linear trends, vertical dashed lines divide the sub-periods. (b) The same plot for precipitation. (c) Inter-annual dynamics of the Palmer drought severity index (PDSI) in July; the line represents the linear trend, the vertical dashed line divides the sub-periods. (d) A comparison of the temperature of the intra-annual dynamics averaged over the 1936–1976 (light lines) and 1977–2017 (dark lines) sub-periods, thin lines represent the daily data, thick lines represent a 21-day moving average. (e) The same plot for precipitation, 21-day moving series of the hydrothermal coefficient (HTC) for the same sub-periods are shown as an inset plot.
Forests 10 00999 g003
Figure 4. Tree ring width (TRW) chronologies of Siberian larch (LASI), Scots pine (PISY), silver birch (BEPE), and Siberian elm (ULPU). Black solid lines represent the standard indexed chronologies; the shaded area represents the number of cores for each year; the red dotted lines represent the chronologies simulated with the Vaganov–Shashkin (VS)-model. For each chronology, the beginning of the period is when EPS > 0.85, which is marked with vertical dashed line; for conifers, the verification and calibration periods of the modeling are divided by the vertical dotted line. The years of the modeled growth rates (i.e., 2006–2008) are marked by black dots on the actual chronologies.
Forests 10 00999 g004
Figure 5. Correlation coefficients between the TRW standard chronologies and the 21-day moving series of the climatic variables during April–September, namely: (a) temperature (lines) and precipitation (shaded areas) for the 1936–1976 sub-period; (b) the same plot for the 1977–2017 sub-period; (c) the hydrothermal coefficient (shaded areas) for the entire 1936–2017 period. Dashed horizontal lines are thresholds for p = 0.05.
Forests 10 00999 g005
Figure 6. Growth patterns of the four considered species and external conditions during 2006–2008, namely: (a) Examples of tree rings’ cell structure microphotographs. (b) Daily dynamics of the temperature (lines) and precipitation (bars) during April–September, and the modeled soil moisture (shaded areas), averaged for all of the considered species starting from the modeled onset of radial growth. (c) The modeled daily series of the general growth rate (in a unit share, i.e., a fraction of the maxima growth rate) for each species. (d) The total seasonal sum of the modeled growth rates (Gr; in a unit share): general growth rate (black dashed lines), temperature-dependent partial growth rate (dotted lines), wetness-dependent partial growth rate (dot dash lines), and actual TRW indices (solid lines).
Forests 10 00999 g006
Table 1. Sampling sites and the standard tree-ring width chronologies’ statistics, namely: standard deviation (stdev), mean sensitivity coefficient (sens) [34], mean inter-serial correlation coefficient (r-bar), and expressed population signal (EPS) [35].
SpeciesCoordinatesSampleChronologyPeriod of EPS > 0.85
Latitude (N)Longitude (E)Altitude, m a.s.l.Time Span, yearLength, yearNumber of Trees/Coresstdevsensr-barTime Span, yearMin Number of Trees
Pinus sylvestris54°00′90°59′600–6401874–201814513/160.3300.2990.5831899–20185
Larix sibirica54°00′90°59′600–6401750–201826922/290.3850.3380.5241900–20183
Betula pendula54°00′90°59′600–6401955–20176315/150.5180.4320.5321956–20173
Ulmus pumila53°54′91°11′~3101994–20172418/300.2290.2940.5631997–20176
Table 2. Inter-species correlation coefficients between the standard TRW chronologies.
SpeciesLarix sibiricaPinus sylvestrisBetula pendula
1955–2017 (n = 63 years)
Pinus sylvestris0.677 *
Betula pendula0.781 *0.575 *
1994–2017 (n = 24 years)
Pinus sylvestris0.626 *
Betula pendula0.775 *0.563 *
Ulmus pumila0.1160.2880.184
* p < 0.05.
Table 3. Optimal parameters and statistics of the tree growth imitation VS-model for the four species.
ParameterDescriptionPinus sylvestrisLarix sibiricaBetula pendulaUlmus pumila
TminMinimum daily temperature (low threshold) for tree growth (°C)5561
Topt1Lower end of range of optimal daily temperatures for tree growth (°C)11151915
Topt2Upper end of range of optimal daily temperatures for tree growth (°C)26242425
TmaxMaximum daily temperature (upper threshold) for tree growth, °C32303130
WminMinimum soil moisture (low threshold) for tree growth, calculated as a ratio of water volume to soil volume0.0480.0280.0550.003
Wopt1Lower end of range of the optimal soil moistures for tree growth (ratio)0.150.2750.350.175
Wopt2Upper end of range of the optimal soil moistures for tree growth (ratio)0.3250.40.40.425
WmaxMaximum soil moisture (upper threshold) for tree growth (ratio)0.6750.650.5250.55
TbegTemperature sum for initiation of growth (°C)10090115105
tbegTime period for calculation of temperature sum (days)10101010
lrDepth of root system (mm)600700650500
PmaxMaximum daily precipitation for saturated soil (mm/day)40504535
C1Fraction of precipitation penetrating soil (not caught by crown; relative unit)0.50.50.440.4
C2First coefficient for calculation of transpiration * (mm/day)0.250.210.160.12
C3Second coefficient for calculation of transpiration (relative unit per °C)0.1100.1350.1650.105
Calibration period1970–20171970–20171960–20161997–2017
RCorrelation between model and actual series0.6270.5940.6190.546
R2Coefficient of determination0.3940.3520.3830.298
SynchSynchronicity between model and actual series (%)72.972.364.976.2
Verification period1936–19691936–1969
RCorrelation between model and actual series0.5840.458
R2Coefficient of determination0.3420.210
SynchSynchronicity between model and actual series (%)73.567.6
* In the VS-model, the transpiration is calculated from the daily growth rate and temperature with a simplified equation, namely: C2·Gr·exp(C3·T).

