Article

Drought-Induced Reductions and Limited Recovery in the Radial Growth, Transpiration, and Canopy Stomatal Conductance of Mongolian Scots Pine (Pinus sylvestris var. mongolica Litv): A Five-Year Observation

1
Institute of Desertification Studies, Chinese Academy of Forestry, Beijing 100091, China
2
Research Institute for the Environment and Livelihoods, Charles Darwin University, Darwin 0810, Australia
3
Institute of Sand Fixation and Afforestation of Liaoning Province, Fuxin 123000, China
4
College of Forestry, Northeast Forestry University, Harbin 150040, China
*
Author to whom correspondence should be addressed.
Submission received: 12 November 2019 / Revised: 9 December 2019 / Accepted: 11 December 2019 / Published: 13 December 2019
(This article belongs to the Section Forest Ecophysiology and Biology)

Abstract

:
Determining plant–water relationships in response to drought events can provide important information about the adaptation of trees to climate change. The Mongolian Scots pine (Pinus sylvestris var. mongolica Litv), as one of the major tree species to control soil loss and desertification in northern China, has experienced severe degradation in recent decades. Here, we aimed to examine the impacts of a two-year consecutive drought and another year of drought on the radial growth, transpiration, and canopy stomatal conductance of Mongolian Scots pine over a five-year period, especially in terms of its recovery after drought. The study period during 2013–2017 consisted of a ‘normal’ year, a ‘dry year’, a ‘very dry’ year, a ‘wet’ year, and a ‘dry’ year, according to annual precipitation and soil moisture conditions. Based on measurements of the sap flow and diameters at breast height of 11 sample trees as well as the concurrent environmental factors, we quantified the reductions in tree radial growth, transpiration, and canopy stomatal conductance during the drought development as well as their recovery after the drought. The results showed that the tree radial growth, transpiration, and canopy stomatal conductance of Mongolian Scots pines decreased by 33.8%, 51.9%, and 51.5%, respectively, due to the two consecutive years of drought. Moreover, these reductions did not fully recover after the two-year drought was relieved. The minimum difference of these parameters between before and after the two-year consecutive drought period was 8.5% in tree radial growth, 45.1% in transpiration levels, and 42.4% in canopy stomatal conductance. We concluded that the two consecutive years of drought resulted in not only large reductions in tree radial growth and water use, but also their lagged and limited recoveries after drought. The study also highlighted the limited resilience of Mongolian Scots pine trees to prolonged drought in semi-arid sandy environmental conditions.

1. Introduction

The impact of drought on forest ecosystems has received increasing attention in recent decades due to the effects of ongoing climate change, especially in boreal forests, in which drought is considered to be particularly dangerous for tree growth and survival [1,2]. As opposed to short and mild drought where the drought-induced stress may be short-term and be alleviated or recovered with rainfall, prolonged and severe drought may lead to substantial and irreversible ecological changes in forest ecosystems, such as considerable reductions in tree growth [3,4,5], widespread forest degradation [6,7], and even large mortality [7,8,9,10,11]. Drought-induced tree growth decline, as well as tree mortality in pines, are widely reported in many species [12,13,14,15], especially for the Scots pine (Pinus sylvestris), which has a wide geographical distribution throughout southern Europe and the Mediterranean basin [16,17,18,19].
Many parameters are used to describe the variation of trees in morphological and physiological traits with the development of drought [20]. Within these parameters, the changes in transpiration and canopy stomatal conductance are essential to quantitatively evaluate the severity of drought stress, the magnitude of drought resistance, as well as the strength of drought resilience in trees [21,22,23,24,25]. In general, canopy stomatal conductance is sensitive to changes in the atmospheric and soil environments [26,27,28,29]. Therefore, change in canopy stomatal conductance is broadly used to evaluate the drought-resistance ability of trees, as well as to discover its mechanism [30,31]. However, the eco-physiological responses of trees to drought differ among tree species, showing the diversity of tree hydraulic traits [32]. So far, drought-related traits of trees have been widely discussed in many tree species (e.g., Scots pine) [30,33,34]. However, further exploration is needed in longer-term sequences, which serve as a prerequisite for predicting tree growth under climate change conditions.
The degree of drought resistance and resilience in a tree species mostly decides its geographic distribution in terms of individuals and communities [10]. Resilience is defined as the capacity of an ecosystem, community, or individual to recover to their pre-disturbed structures and functions after being disrupted [4,5]. In semi-arid regions, where plants are often exposed to water stress for extended parts of the growing season, trees may thoroughly lose resilience due to hydraulic failure under long-term and severe drought conditions [35,36]. As an application, resilience is an ideal parameter to assess the ability of trees to recover from drought disturbance [37,38,39,40,41].
Mongolian Scots pine (Pinus sylvestris var. mongolica Litv) is naturally distributed in Russia, Mongolia, and northeast China. This tree species has been widely used in afforestation in China since the 1950s, particularly in the ongoing ‘Three-North Shelter Forest Program’, a large-scale desertification project started in northern China in 1978. At present, the plantation area of Mongolian Scots pine shelterbelt forests in China is more than 8 × 10⁵ ha, playing a significant role in reducing wind erosion in northern China. However, a serious decline in the intermediate aged and mature stands of Mongolian Scots pine has been observed [42,43]. These problems have raised public concerns about the causes and mechanism of the decline, as well the degenerative processes [44,45], particularly with regard to the resilience ability of these trees after experiencing prolonged and severe drought.
Mongolian Scots pine is a kind of shallow-rooted tree species, and nearly 98% of roots are distributed within 1 m of the upper soil layer [46]. This means that Mongolian Scots pine can easily suffer from drought stress when drought occurs [47,48]. Specifically, the study area is located in sandy soil and is characterized by low water capacity and little use of groundwater due to its weak capillary rise. Meanwhile, the depth of the groundwater table at present is almost unusable because the groundwater level since 2014 has been lower than the maximum depth of the taproot of Mongolian Scots pine. All these factors indicate that the Mongolian Scots pine in this area is vulnerable to drought stress [45,49]. However, the response of Mongolian Scots pine to drought, particularly to successive and severe drought over a longer time, remains very limited. The acquisition of this knowledge is crucial for judging the resilience ability of Mongolian Scots pine to drought and ultimately helping to identify the degradation causes of Mongolian Scots pine.
The focus of this study was on the multiple-year variations in tree radial growth, transpiration, and canopy stomatal conductance for 35-year-old Mongolian Scots pine growing on sandy soil in a semi-arid environment. The objectives of this study were: (1) to describe the dynamics of tree radial growth, transpiration, and canopy stomatal conductance of mature Mongolian Scots pine during dry-wet exchange over multiple years; (2) to explore the differences in response to drought in terms of tree growth and water use; and (3) to assess the resilience ability of Mongolian Scots pine after prolonged drought.

2. Materials and Methods

2.1. Study Site

The experiment was conducted from 2013 to 2017 at the Zhanggutai National Desertification Control Experimental Station located at the southern edge of the Horqin desert area, Liaoning Province, China (122°22′ E, 42°43′ N, and 226.5 m a.s.l.). We selected a 40 ha section of a 35-year-old Mongolian Scots pine shelterbelt forest as a sample forest. Both inter-row and in-row spacings in the sample forest were 4 m, resulting in a density of 625 stems·ha−1. The climate was semi-arid and continental monsoon. The annual mean air temperature was 7.9 °C over the past 30 years (1983 to 2012), with a frost-free period of 155 days, annual pan evaporation of 1553 mm, and annual precipitation of 475.6 mm, over the same period. About 92% of precipitation falls from May to September (the main growing season). The soil is of Aeolian sand texture, consisting of 84% sand particles (>0.05 mm), 9% silt particles (0.05–0.002 mm), and 7% clay particles (<0.002 mm). The soil bulk density is 1.61 g·cm−3, the capillary porosity is 33%, and the soil is barren with a mean organic matter content of 0.65 g·kg−1 in the upper 1 m soil layer.

2.2. Experimental Layout

The size of sample trees for sap flow measurement was determined in accordance with Kostner et al. [50] and Kume et al. [51]. We randomly selected 11 sample trees in the experimental plot of 400 m2 (20 × 20 m) in the middle of the 40 ha sample forest. The sample trees had similar sizes with diameters at breast height (DBH, at 1.3 m) of 17.2 ± 0.45 cm (mean ± standard error (S.E.)) and tree heights of 9.5 ± 0.15 m (mean ± S.E.) in 2012 (Table 1). Instruments were installed in April 2013, including those for measuring tree sap flow, meteorological variables, and soil moisture, and were used until the end of 2017.

2.3. Meteorological Data

Micrometeorological data, including radiation, air temperature (Ta), relative humidity (RH), wind speed, and precipitation, were measured using an automatic weather station (AR5, Avalon Corp, Inc., Jersey, NJ, USA), located in an open area approximately 50 m away from the experimental plot. Variables were recorded every 10 min by a data logger and subsequently added to hourly and daily values. Hourly vapor pressure deficit (VPD) (kPa) was calculated based on Ta and RH [52].
VPD = 0.611 e ( 17.502 T a T a + 240.97 ) ( 1 R H )

2.4. Measurements of Tree Diameter

We measured the girth at breast height of each sample tree at the end of the growing season each year using a tape measure, which was used to calculate DBH and the tree radial growth increment. Here, we defined the growing season period of Mongolian Scots pine in a year in the study site as being from 1 May to 30 October.

2.5. Soil Moisture Measurements

We measured the volumetric soil water content (θ, cm3·cm−3) at 20 cm intervals in the upper 1 m soil layer at three places in the plot using ECH2O EC-5 probes (METER Group, Inc., Pullman, WA, USA). The data were collected at 10 min intervals and averaged to an hourly or daily scale. The sensor readings were site-specific and were calibrated using the following formula based on the soil-core method: θ = 0.99421 θsensor + 0.00128 (R2adj = 0.94, n = 202, p < 0.001; θsensor are values measured by the sensors). The field capacity (θf) in the 0–1 m soil layer was 0.18 cm3·cm−3 on average, and the permanent wilting point was 0.027 cm3·cm−3 on average. We calculated the relative extractable soil water (REW), which is defined as the quotient between the extractable water and the maximum extractable water [26], to describe relative soil moisture conditions in the site. The threshold value of REW = 0.4 proposed by several reports [26,53,54] was adopted to define soil water stress, which corresponded to a θ value of 0.086 cm3·cm−3 at our site.

2.6. Sap Flux Density Measurements and Canopy Transpiration Estimation

Sap flux density (Js, cm·s−1) in the outer 0 to 3 cm layer of xylem was measured continuously using thermal dissipation sensors (Dynamax Inc., Houston, TX, USA). We installed the sensors at 1.3 m height in the north side of the stems. The distance between the two probes of the sensors was 0.04 m. Only the upper probe was supplied with a constant power of 0.2 W. The sensors were shielded with reflective foil that extended 1 m below and 0.5 m above to minimize any effects from incident radiation. We sealed the foil with the stem above the installation to prevent ingress of raindrops and stem-flow water. The temperature difference between the two probes was recorded at 10 min intervals using SQ2040 data loggers (Grant Instruments Ltd., Cambridge, UK). The measurements continued during the entire growing season each year. Probes were removed from the trees at the end of the growing season each year and were re-installed at the beginning of the next growing season (early April) to minimize possible signal dampening [55]. Js was calculated from the measured temperature differences of the two probes using Granier’s original equation [56].
J s = 119 × 10 4 ( Δ T 0 Δ T Δ T ) 1.231
where ΔT is the measured temperature difference between the heated and reference needles. ΔT0 is the maximum ΔT when the sap flux density is close to zero, which is determined over approximately 10 consecutive measuring days, using a linear regression [57].
The total sap flow through the section of trunk in a tree (Qt, cm3·h−1) is considered to be equal to canopy transpiration. Qt was calculated based on the measured sap flux density, the correct coefficient, and the sapwood area (As, cm2) at the probe-installed section.
Q t = J s × 0.56 × A s × 3600
where Js is the measured sap flux density in the outer 0–3 cm of xylem. The sap flux density in the inner layers decreased sharply with increasing sapwood thickness due to the relative inactivity of the inner xylem. We adopted the correct coefficient 0.56 based on the radial velocity profile with the radius of Scots pine (P. sylvestris) [57,58] to estimate the averaged sap flux density along the whole sapwood thickness. As was estimated by the DBH (cm) in each year according to the relationships between As and DBH in Mongolian Scots pine using the following equation [59]:
A s = 0.7117 × DB H 1.9472 ( R 2   =   0.99 ,   n   =   25 ) .

2.7. Calculation of Canopy Stomatal Conductance

We calculated canopy stomatal conductance (Gs, cm·s−1) from canopy transpiration per unit leaf area (QL) and VPD using a simplification of the inversion of the Penman–Monteith model [60]. Gs was calculated on an hourly basis.
G s = λ Q L γ ρ c p VPD × 1 36
where λ is the latent heat of vaporization of water (MJ·kg−1); γ is the psychrometric constant (kPa·°C−1); ρ is the density of air (kg·m−3), and cp is the specific heat of air (MJ·kg−1·°C−1); QL is canopy transpiration per unit of leaf area (mm·h−1), which is calculated from canopy transpiration (Qt) and whole-tree leaf area (AL) as follows:
Q L = Q t A L × 1 1000
where AL (m2 per tree) is the leaf area of a tree calculated by the following local allometric equation [61] (Equation (7):
A L = 0.84731 × ( DB H 2 × H ) 0.52498 ( R 2   =   0.93 ,   n   =   47 ) .
We calculated Gs only when daytime VPD was greater than 0.6 kPa [62]. Daytime was defined as solar radiation above 50 W·m−2, which corresponded to the local time 05:00 to 17:00 (i.e., GMT + 8) in the early growing season (May and June), 06:00 to 17:00 in the mid-growing season (July and August), and 07:00 to 16:00 in the late growing season (September and October).

2.8. Statistical Analyses

A mixed-effects model was used in ANOVA considering the fixed effects and random effects in comparing the mean difference in DBH increment, Qt or Gs between years. The tree sample was entered as a random factor and the year was entered as a fixed factor in the mixed-effects model. ANOVA analysis was performed using SPSS 20.0 (SPSS Inc., Chicago, IL, USA) at α = 0.05 level.

3. Results

3.1. Climate Factors and Soil Moisture

We used the symbol P ¯ to denote the multiple-year annual precipitation, which was equal to 475.6 mm in the past 30 years (1983–2012) in this region. Compared with the P ¯ value, the annual precipitation in each year during 2013–2017 was 1.16, 0.81, 0.86, 1.31, and 0.71 times P ¯ , respectively. (Figure 1a).
The daily average soil moisture in the upper 1 m soil layer ( θ ¯ ) varied between 0.044 and 0.131 cm3·cm−3 during the entire study period. The yearly mean value of θ ¯ in 2013 to 2017 was 0.098, 0.070, 0.069, 0.102, and 0.083 cm3·cm−3, respectively. The monthly mean θ ¯ was highly related to recent precipitation (Figure 1a,b). According to the dynamic of θ ¯ , we divided the five-year study period into two distinct phases. The first phase lasted for 471 days from 1 May 2013 to 11 August 2015, which was characterized by θ ¯ gradually decreasing from 0.12 to 0.03 cm3·cm−3, which was close to the permanent wilting point of the soil at the study site (0.027 cm3·cm−3). The second phase lasted for 449 days from 12 August 2015 to 31 October 2017, which was characterized by a gradual relief of drought, with θ ¯ increasing from 0.03 to 0.15 cm3·cm−3. Based on the statistics on θ ¯ , about half of the time in the study period was in the condition with θ ¯ lower than the threshold value of 0.086 cm3·cm−3 (Figure 1b). In 2015, severe drought with θ ¯ lower than 0.02 cm3·cm−3 lasted for nearly 11% of days in the growing season. Based on the comparison of annual precipitation between different years, together with the comparison of soil moisture, we defined 2013 as a ‘normal’ year, 2014 as a ‘dry’ year, 2015 as a ‘very dry’ year, 2016 as a ‘wet’ year, and 2017 as a ‘dry’ year.
There was a significant difference in monthly mean VPD between months in a year (p < 0.01), rather than between years (p = 0.89). The VPD values during the early growing season of the year were generally higher than those in the mid- and late growing seasons (Figure 1c).

3.2. Tree Radial Growth

Tree DBH increased significantly from 17.2 ± 0.45 cm (mean ± S.E.) in 2012 to 20.0 ± 0.56 cm in 2017 (p < 0.01) (Figure 2a). The annual radial increment was 0.71 ± 0.05 cm·yr−1 (mean ± S.E.) in the normal year 2013 but decreased to 0.51 ± 0.07 cm·yr−1 in the first dry year (2014) (p = 0.06) and further decreased to 0.47 ± 0.04 cm·yr−1 in the second dry year (2015) (p = 0.02), compared with that in the first year (2013). The growth increment increased to 0.51 ± 0.05 cm·yr−1 in the wet year (2016) (p = 0.07) and further increased to 0.65 ± 0.05 cm·yr−1 in the following dry year (2017) (p = 0.94) (Figure 2b). Compared with that in the first year (2013), the radial increment significantly decreased in 2015 and did not fully recover even after the drought was alleviated at the end of 2016. The minimum difference in tree radial growth before and after the two-year drought period was 8.5%.

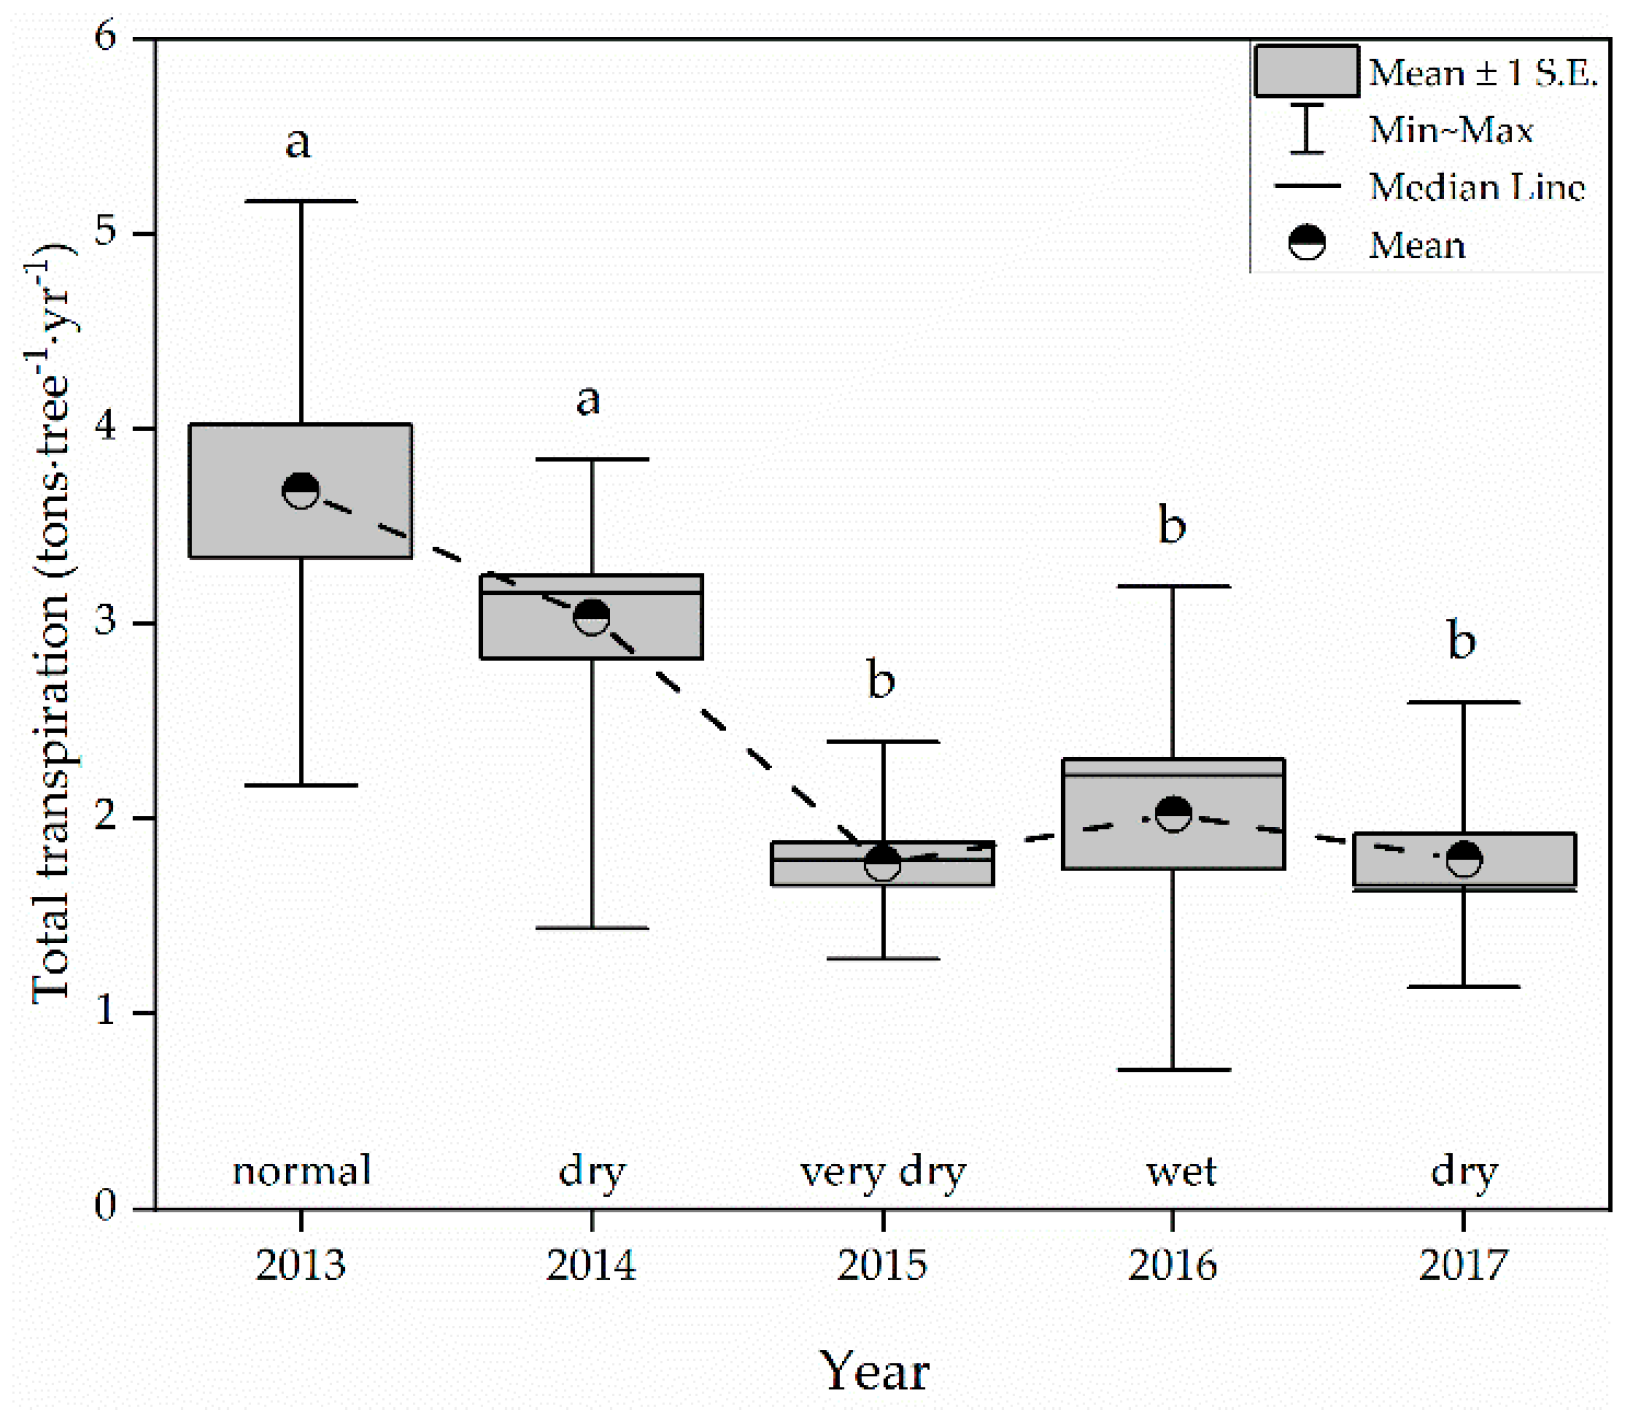
3.3. Transpiration Levels in Different Years

The total transpiration of each sample tree during the growing season was calculated based on the continuous monitoring of sap flux density and the measurement of sapwood area. The average total transpiration of the sample trees significantly differed between years (p < 0.01). On average, the total transpiration of a tree during the entire growing season was 3.68 tons·tree−1 in 2013. In comparison, total transpiration decreased by 17.6% in 2014 (p = 0.29) and decreased by 51.9% in 2015 (p < 0.01). In the ‘wet’ year (2016), total transpiration was 2.02 tons·tree−1, which was slightly higher than that in the ‘very dry’ year (2015) (p = 0.94), but still significantly lower than that in the ‘normal’ year 2013 (p < 0.01). Total transpiration in the third ‘dry’ year (2017) decreased to 1.79 tons·tree−1, representing approximately 49% of that in 2013. Transpiration in the last three years did not differ significantly (p > 0.94) (Figure 3). The annual transpiration reduction after the two-year successive drought period was at least 45.1%.

3.4. Seasonal Dynamics in Tree Transpiration

The daily transpiration per tree (Qt) of Mongolian Scots pine significantly differed between different years. The mean daily Qt was 19.7 kg·tree−1·d−1 in the ‘normal’ year (2013) (Figure 4a) but decreased to 16.5 kg·tree−1·d−1 in the ‘dry’ year (2014) and further decreased to 9.7 kg·tree−1·d−1 in the ‘very dry’ year (2015) (Figure 4b,c). In the ‘wet’ year (2016), the mean value of Qt recovered slightly to 10.7 kg·tree−1·d−1 (Figure 4d) but fell again to 10.2 kg·tree−1·d−1 (52% of that in 2013) in the following ‘dry’ year (2017) (Figure 4e). The maximum daily values of Qt in each year during 2013–2017 were 40.2, 30.9, 16.5, 24.0, and 17.5 kg·tree−1·d−1, respectively.
Statistics on daily Qt in different parts of the growing season in each year showed that, except for the ‘wet’ year 2016, the average daily Qt values differed significantly between the early, middle, and late parts of the growing season in each year (p < 0.01) (Table 2). The mean daily Qt in the early part of the growing season (May to June) was 16.1 kg·tree−1·d−1 for the five years, which decreased in the mid-part of the growing season (July to August) to 13.7 kg·tree−1·d−1 and further decreased to 10.4 kg·tree−1·d−1 in the late part of the growing season (September to October), on average. In 2016, although Qt in the early part and mid-part of the growing season were higher than that in the late part of the growing season, the difference was not significant (p = 0.19).

3.5. Seasonal Dynamics in Canopy Stomatal Conductance

The canopy stomata conductance (Gs) of Mongolian Scots pine during the growing season differed significantly between different years (p < 0.01). In the ‘normal’ year (2013), mean daily Gs performed strongly with a mean value of 0.33 cm·s−1 (Figure 5a). The mean Gs significantly decreased to 0.26 cm·s−1 in the ‘dry’ year (2014) and further decreased to 0.16 cm·s−1 in the ‘very dry’ year (2015) (Figure 5b,c). The mean Gs value increased slightly to 0.17 cm·s−1 in the ‘wet’ year (2016) (Figure 5d), and again increased to 0.19 cm·s−1 in the third ‘dry’ year (2017), which still only accounted for 56% of that in 2013 (Figure 5e). The minimum difference in Gs before and after the two-year drought period was 42.4%. The maximum daily Gs values in each year during 2013–2017 were 0.63, 0.59, 0.36, 0.38, and 0.50 cm·s−1, respectively.
A comparison of the mean daily Gs values in different parts of the growing season in the year shows that the mean daily Gs values between different parts of the growing season significantly differed in ‘dry’ years (2014, 2015, 2017) (p < 0.01) rather than in ‘normal’ and ‘wet’ years (2013 and 2016) (p = 0.26). On average, the mean daily Gs in the mid-part of the growing season was the highest, with a mean of 0.23 cm·s–1. In the ‘very dry’ year (2015), however, both the mean daily Gs and the mean daily Qt in the mid-part of the growing season were significantly lower than those in the early or late part of the growing season, with a slight increase in the late part due to several intensive rainfall events (Table 2). Overall, for each stage of the growing season, there was a significant difference in Gs between different years (p < 0.01) (Table 2), as was also the case for Qt.

3.6. Diurnal Courses of Qt and Gs in Different Years and Different Parts of the Growing Season

We compared the diurnal courses of Qt and Gs on typical sunny days among the ‘normal’ year (2013), the ‘very dry’ year (2015), and the ‘wet’ year (2016). Generally, Qt showed diurnal patterns in different years, with a peak occurring around noon (12:00–13:00) in a day (Figure 6). However, the peak value of Qt in a day obviously differed between different years, with the maximum in the ‘normal’ year (2013) and the minimum in the ‘very dry’ year (2015). The peak value of Gs showed similar variation to Qt between different years. Additionally, Gs increased rapidly in the early morning in a day, with a peak about 0–2 h earlier than that of Qt.
Diurnal courses of Qt and Gs on typical sunny days showed similar patterns in different parts of the growing season. In ‘normal’ and ‘wet’ years (2013 and 2016), the peak values of Qt and Gs in the mid-part of the growing season were higher than those in the early and late parts of the growing season. However, in the ‘very dry’ year (2015), the minima of the peak values of Qt and Gs appeared in the mid-part of the growing season.

4. Discussion

4.1. Drought-Induced Tree Radial Growth Decline

Drought-induced declines in tree growth and increased mortality have been widely reported [8,10,14,41,63]. However, the causes are still controversial and worth exploring further in a larger scope. In this study, the radial increment in Mongolian Scots pine decreased by 34% after a drought that lasted for more than two consecutive years. This significant decline in tree growth due to drought has also been found in other tree species, such as Scots pine. For example, in an inner alpine valley, the radial growth of Scots pines decreased by 10–31% during drought [64]; in Mediterranean mountain areas, radial growth decreased by 25% [65]. Under drought conditions, the shortening of the duration phases of the xylem cell differentiation and the radial-enlargement, which depends on an adequate turgor pressure of expanding cells, resulted in low growth rates and the formation of narrow rings [66,67]. This may be the immediate reason for the drought-induced decline in growth. In general, the drought-induced reduction of cambial activity of trees can be quickly restored once soil moisture conditions improve [68]. However, increases in drought intensity and frequency cause serious damage, which greatly increase the risk of tree growth decline or mortality [4,5].
In this study, compared to the ‘normal’ year (2013), the radial increment of Mongolian Scots pine declined by 28% in the ‘wet’ year (2016) and continued to decline by 8% in the third ‘dry’ year (2017). The radial increment recovered incompletely after the two-year successive drought (Figure 2b). The observation that the recovery of tree growth in Mongolian Scots pine after two consecutive years of drought lagged behind the improvement in soil moisture conditions is in accordance with findings on species of Scots pine and black pine [67]. Deep-rooted tree species exhibit a drought legacy, with reduced growth within four years after a severe drought [41]. These drought legacy effects also appeared in Mongolian Scots pine in our site after the two-year successive drought. The drought legacy effects supported the idea that trees experiencing severe drought redistribute water in favor of rebuilding the root system rather than radial growth [69].

4.2. Drought-Induced Reduction of Water Use

Scots pine responded to drought by rapidly closing the stomata to reduce transpiration in response to drought stress [69]. In this five-year study, the substantial differences in annual precipitation provided an opportunity to study the characteristic of tree water use as a function of seasonal changes in soil moisture. The results indicate that the transpiration of Mongolian Scots pine varied greatly with annual precipitation. The transpiration decreased by 52% after the two-year drought. This drought-induced decline in water use is consistent with previous reports in Scots pine, where transpiration was reduced by 65% during severe drought in 41-year-old Scots pine [69], while transpiration was reduced by 60% in 39-year-old Scots pine [65]. However, we found that when the two-year drought was alleviated, transpiration levels remained 45–51% lower in the last two years than that in the first year (2013) (Figure 3). The ability of water use during the drought-alleviated period had not been fully restored.
Trees absorb water mainly by fine roots, so the turnover of fine roots in a year has a significant impact on the water absorption capability of trees. It was reported that the turnover ratio of the fine roots in Scots pine was about 30% to 86% each year [70]. As the soil dries, the death rate of fine roots increases rapidly, while the productivity of new fine roots increases slowly after drought [71]. In Mongolian Scots pine, more than 85% of roots are located in the upper 0.4 m soil layer. Although this spatial distribution of roots is conducive to maximizing the water capture efficiency in rain-fed ecosystems [46,49], it is not conducive to Mongolian Scots pine using water resources in a wider range, and thus makes the species susceptible to drought. Therefore, a prolonged drought likely causes great mortality of the fine roots, which may be the main reason why it was still difficult for the water use of Mongolian Scots pine to return to its original level in the final year. In order to provide direct evidence for this interpretation, fine measurement of the root distribution before, during, and after severe drought conditions are needed in the future.
Scots pines have migrated to the southern end of their geographical distribution region, which approaches the limit of their adaptability to prolonged and/or repeated droughts [65]. The Mongolian Scots pine trees in this study had been introduced away from their natural distribution area, which is about 1000 km (10° difference in latitude) north of this study site in distance. In the natural distribution area, air temperatures are lower, growing seasons are shorter, and annual precipitation is higher. All of these environmental conditions are conductive to form low atmospheric evaporation conditions as well as the conservative water use traits in Mongolian Scots pine. Considering that the Mongolian Scots pines from relatively lower latitude areas use water less sparingly than Scots pines in higher latitude areas [72], it seems to be reasonable to infer that the Mongolian Scots pine trees growing in the semi-arid sandy land in this study region are susceptible to drought stress due to high atmospheric water demand.

4.3. Limited Recovery after a Prolonged Drought Relief

Drought occurs frequently in semi-arid areas. Most drought events may be short-lived, as they are alleviated effectively in the next few days up to several months if there is strong rainfall. However, long-term and severe droughts can trigger large and irreversible changes in physiological activities and even serious ecological consequences [3,20]. In characterizing a tree’s adaptability to severe drought, it is important to distinguish between the immediate impact from the drought event and the extent to which the physiological activities of the tree after drought relief have returned to normal levels [6]. In our study, after a two-year successive drought during 2014–2015, the tree radial growth incompletely recovered in 2016 and 2017 (only 72–92% of the first year); similarly, transpiration during 2016–2017 accounted for 49–55% of that in 2013, and canopy stomatal conductance during 2016–2017 accounted for 52–58% of that in 2013. The significant declines in canopy stomatal conductance with the decrease in the soil moisture of the Mongolian Scots pine plantation was in line with extensive observations in P. sylvestris [65,73,74,75], indicating a positive response of Scots pines to soil drought.
Trees seem to benefit from declines in Gs because sensitive stomatal regulation is critical to prevent trees from approaching their threshold of critical vulnerability due to excessive loss of water [76,77]. The fine roots in Scots pine die almost immediately when the soil turns dry [71]. This implies that the death of a large number of roots after severe drought directly leads to a reduction in soil–root water transportation, as well as declines in Qt and Gs in Mongolian Scots pines. It was reported that the influence of drought events on tree transpiration and canopy stomatal conductance could be traced back to droughts that occurred six weeks prior [78]. In our study, the legacy effects of drought on water use carried over into the next two years (Figure 3). The reduced resilience of water transfer in Mongolian Scots pine was in accordance with reports on the species of Scots pine [33], P. halepensis Miller [32], and P. palustris Mill [77].

5. Conclusions

This study compared the water use of Mongolian Scots pine by measuring sap flow and environmental factors over a five-year period with contrasting levels of annual precipitation. The drought lasting for nearly two years induced large reductions in tree radial growth increment, transpiration, and daily canopy stomatal conductance by 33.8%, 51.9%, and 51.5% in Mongolian Scots pine, respectively. After the drought was effectively relieved by plenty of rainfall, tree radial growth, transpiration, as well as canopy stomatal conductance recovered, albeit incompletely, during the following two years. The smallest gap between before and after the two-year drought period was 8.5% in tree radial growth, 45.1% in transpiration levels, and 42.4% in canopy stomatal conductance. The results highlight large drought-induced reductions in tree growth and water use, as well as the limited recovery of Mongolian Scots pine in response to two consecutive years of drought.

Author Contributions

H.D. and P.L. provided the idea for this research. H.D. prepared the investigation and the original manuscript. W.Y. and P.L. helped in the analysis and interpretation of the results. H.H. and J.Z. collected the data in the study site.

Funding

This research was funded by the National Natural Science Foundation of China (No. 31570704), the Fundamental Research Funds for the Central Non-profit Research Institution of CAF (No. CAFYBB2014MA013), and the Major State Basic Research Development Program of China (973 Program) (No. 2013CB429901).

Acknowledgments

We would like to thank Lizhen Zhang for his useful discussions and suggestions. Field support for this research was provided by Zhanggutai, the National Studies Station for Desert Ecosystem of China (CDERN).

Conflicts of Interest

The authors declare no conflict of interest.

References

  1. Ryan, M.G. Tree responses to drought. Tree Physiol. 2011, 31, 237–239. [Google Scholar] [CrossRef] [PubMed] [Green Version]
  2. Aaltonen, H.; Lindén, A.; Heinonsalo, J.; Biasi, C.; Pumpanen, J. Effects of prolonged drought stress on Scots pine seedling carbon allocation. Tree Physiol. 2017, 37, 418–427. [Google Scholar] [CrossRef] [PubMed] [Green Version]
  3. Vetter, S. Drought, change and resilience in South Africa’s arid and semi-arid rangelands. S. Afr. J. Sci. 2009, 105, 29–33. [Google Scholar] [CrossRef]
  4. Scheffer, M.; Carpenter, S.; Foley, J.A.; Folke, C.; Walker, B. Catastrophic shifts in ecosystems. Nature 2001, 413, 591. [Google Scholar] [CrossRef]
  5. Folke, C.; Carpenter, S.; Walker, B.; Scheffer, M.; Elmqvist, T.; Gunderson, L.; Holling, C.S. Regime shifts, resilience, and biodiversity in ecosystem management. Annu. Rev. Ecol. Evol. Syst. 2004, 35, 557–581. [Google Scholar] [CrossRef] [Green Version]
  6. Martínez-Vilalta, J.; López, B.C.; Loepfe, L.; Lloret, F. Stand-and tree-level determinants of the drought response of Scots pine radial growth. Oecologia 2012, 168, 877–888. [Google Scholar] [CrossRef]
  7. Ciais, P.; Reichstein, M.; Viovy, N.; Granier, A.; Ogée, J.; Allard, V.; Aubinet, M.; Buchmann, N.; Bernhofer, C.; Carrara, A.; et al. Europe-wide reduction in primary productivity caused by the heat and drought in 2003. Nature 2005, 437, 529–533. [Google Scholar] [CrossRef]
  8. Bigler, C.; Bräker, O.U.; Bugmann, H.; Dobbertin, M.; Rigling, A. Drought as an inciting mortality factor in Scots pine stands of the Valais, Switzerland. Ecosystems 2006, 9, 330–343. [Google Scholar] [CrossRef] [Green Version]
  9. McDowell, N.; Pockman, W.T.; Allen, C.D.; Breshears, D.D.; Cobb, N.; Kolb, T.; Plaut, J.; Sperry, J.; West, A.; Williams, D.G.; et al. Mechanisms of plant survival and mortality during drought: Why do some plants survive while others succumb to drought? New Phytol. 2008, 178, 719–739. [Google Scholar] [CrossRef]
  10. Choat, B.; Jansen, S.; Brodribb, T.J.; Cochard, H.; Delzon, S.; Bhaskar, R.; Bucci, S.J.; Feild, T.S.; Gleason, S.M.; Hacke, U.G.; et al. Global convergence in the vulnerability of forests to drought. Nature 2012, 491, 752. [Google Scholar] [CrossRef] [Green Version]
  11. Allen, C.D.; Breshears, D.D.; McDowell, N.G. On underestimation of global vulnerability to tree mortality and forest die-off from hotter drought in the Anthropocene. Ecosphere 2015, 6, 1–55. [Google Scholar] [CrossRef]
  12. Linton, M.; Sperry, J.; Williams, D. Limits to water transport in Juniperus osteosperma and Pinus edulis: Implications for drought tolerance and regulation of transpiration. Funct. Ecol. 1998, 12, 906–911. [Google Scholar] [CrossRef] [Green Version]
  13. Piñol, J.; Sala, A. Ecological implications of xylem cavitation for several Pinaceae in the Pacific Northern USA. Funct. Ecol. 2000, 14, 538–545. [Google Scholar] [CrossRef]
  14. Allen, C.D.; Macalady, A.K.; Chenchouni, H.; Bachelet, D.; McDowell, N.; Vennetier, M.; Kitzberger, T.; Rigling, A.; Breshears, D.D.; Hogg, E.T.; et al. A global overview of drought and heat-induced tree mortality reveals emerging climate change risks for forests. For. Ecol. Manag. 2010, 259, 660–684. [Google Scholar] [CrossRef] [Green Version]
  15. Hereş, A.-M.; Voltas, J.; López, B.C.; Martínez-Vilalta, J. Drought-induced mortality selectively affects Scots pine trees that show limited intrinsic water-use efficiency responsiveness to raising atmospheric CO2. Funct. Plant Biol. 2014, 41, 244–256. [Google Scholar] [CrossRef] [Green Version]
  16. Martínez-Vilalta, J.; Prat, E.; Oliveras, I.; Piñol, J. Xylem hydraulic properties of roots and stems of nine Mediterranean woody species. Oecologia 2002, 133, 19–29. [Google Scholar] [CrossRef]
  17. Rebetez, M.; Dobbertin, M. Climate change may already threaten Scots pine stands in the Swiss Alps. Theor. Appl. Climatol. 2004, 79, 1–9. [Google Scholar] [CrossRef] [Green Version]
  18. Ge, Z.-M.; Kellomäki, S.; Peltola, H.; Zhou, X.; Wang, K.-Y.; Väisänen, H. Impacts of changing climate on the productivity of Norway spruce dominant stands with a mixture of Scots pine and birch in relation to water availability in southern and northern Finland. Tree Physiol. 2011, 31, 323–338. [Google Scholar] [CrossRef] [Green Version]
  19. Timofeeva, G.; Treydte, K.; Bugmann, H.; Rigling, A.; Schaub, M.; Siegwolf, R.; Saurer, M. Long-term effects of drought on tree-ring growth and carbon isotope variability in Scots pine in a dry environment. Tree Physiol. 2017, 37, 1028–1041. [Google Scholar] [CrossRef]
  20. Bucci, S.J.; Scholz, F.G.; Goldstein, G.; Hoffmann, W.A.; Meinzer, F.C.; Franco, A.C.; Giambelluca, T.; Miralles-Wilhelm, F. Controls on stand transpiration and soil water utilization along a tree density gradient in a Neotropical savanna. Agric. For. Meteorol. 2008, 148, 839–849. [Google Scholar] [CrossRef]
  21. Verbeeck, H.; Steppe, K.; Nadezhdina, N.; de Beeck, M.O.; Deckmyn, G.; Meiresonne, L.; Lemeur, R.; Čermák, J.; Ceulemans, R.; Janssens, I.A. Stored water use and transpiration in Scots pine: A modeling analysis with ANAFORE. Tree Physiol. 2007, 27, 1671–1685. [Google Scholar] [CrossRef] [PubMed] [Green Version]
  22. Hereş, A.-M.; Camarero, J.J.; López, B.C.; Martínez-Vilalta, J. Declining hydraulic performances and low carbon investments in tree rings predate Scots pine drought-induced mortality. Trees 2014, 28, 1737–1750. [Google Scholar] [CrossRef]
  23. Børja, I.; Svĕtlík, J.; Nadezhdin, V.; Čermák, J.; Rosner, S.; Nadezhdina, N. Sap flux—A real time assessment of health status in Norway spruce. Scand. J. For. Res. 2016, 31, 450–457. [Google Scholar] [CrossRef]
  24. Peters, M.P.; Iverson, L.R.; Matthews, S.N. Long-term droughtiness and drought tolerance of eastern US forests over five decades. For. Ecol. Manag. 2015, 345, 56–64. [Google Scholar] [CrossRef] [Green Version]
  25. Macinnis-Ng, C.; Wyse, S.; Veale, A.; Schwendenmann, L.; Clearwater, M. Sap flow of the southern conifer, Agathis australis during wet and dry summers. Trees 2016, 30, 19–33. [Google Scholar] [CrossRef]
  26. Granier, A.; Breda, N.; Biron, P.; Villette, S. A lumped water balance model to evaluate duration and intensity of drought constraints in forest stands. Ecol. Model. 1999, 116, 269–283. [Google Scholar] [CrossRef]
  27. Nadezhdina, N. Sap flow index as an indicator of plant water status. Tree Physiol. 1999, 19, 885–891. [Google Scholar] [CrossRef]
  28. Bovard, B.; Curtis, P.; Vogel, C.; Su, H.-B.; Schmid, H. Environmental controls on sap flow in a northern hardwood forest. Tree Physiol. 2005, 25, 31–38. [Google Scholar] [CrossRef] [Green Version]
  29. Hernandez-Santana, V.; Rodriguez-Dominguez, C.M.; Fernández, J.E.; Diaz-Espejo, A. Role of leaf hydraulic conductance in the regulation of stomatal conductance in almond and olive in response to water stress. Tree Physiol. 2016, 36, 725–735. [Google Scholar] [CrossRef] [Green Version]
  30. Poyatos, R.; Aguadé, D.; Galiano, L.; Mencuccini, M.; Martínez-Vilalta, J. Drought-induced defoliation and long periods of near-zero gas exchange play a key role in accentuating metabolic decline of Scots pine. New Phytol. 2013, 200, 388–401. [Google Scholar] [CrossRef]
  31. Meir, P.; Mencuccini, M.; Dewar, R.C. Drought-related tree mortality: Addressing the gaps in understanding and prediction. New Phytol. 2015, 207, 28–33. [Google Scholar] [CrossRef] [PubMed]
  32. Tatarinov, F.; Rotenberg, E.; Maseyk, K.; Ogée, J.; Klein, T.; Yakir, D. Resilience to seasonal heat wave episodes in a Mediterranean pine forest. New Phytol. 2016, 210, 485–496. [Google Scholar] [CrossRef] [PubMed] [Green Version]
  33. Merlin, M.; Perot, T.; Perret, S.; Korboulewsky, N.; Vallet, P. Effects of stand composition and tree size on resistance and resilience to drought in sessile oak and Scots pine. For. Ecol. Manag. 2015, 339, 22–33. [Google Scholar] [CrossRef] [Green Version]
  34. Anderegg, W.R.; Konings, A.G.; Trugman, A.T.; Yu, K.-L.; Bowling, D.R.; Gabbitas, R.; Karp, D.S.; Pacala, S.; Sperry, J.S.; Sulman, B.N.; et al. Hydraulic diversity of forests regulates ecosystem resilience during drought. Nature 2018, 561, 538. [Google Scholar] [CrossRef] [PubMed] [Green Version]
  35. Choat, B.; Brodribb, T.J.; Brodersen, C.R.; Duursma, R.A.; Lopez, R.; Medlyn, B.E. Triggers of tree mortality under drought. Nature 2018, 558, 531–539. [Google Scholar] [CrossRef] [PubMed]
  36. Klein, T.; Zeppel, M.J.; Anderegg, W.R.; Bloemen, J.; De Kauwe, M.G.; Hudson, P.; Ruehr, N.K.; Powell, T.L.; von Arx, G.; Nardini, A. Xylem embolism refilling and resilience against drought-induced mortality in woody plants: Processes and trade-offs. Ecol. Res. 2018, 33, 839–855. [Google Scholar] [CrossRef]
  37. Lloret, F.; Keeling, E.G.; Sala, A. Components of tree resilience: Effects of successive low-growth episodes in old ponderosa pine forests. Oikos 2011, 120, 1909–1920. [Google Scholar] [CrossRef]
  38. Walter, J.; Nagy, L.; Hein, R.; Rascher, U.; Beierkuhnlein, C.; Willner, E.; Jentsch, A. Do plants remember drought? Hints towards a drought-memory in grasses. Environ. Exp. Bot. 2011, 71, 34–40. [Google Scholar] [CrossRef]
  39. Fleta-Soriano, E.; Munné-Bosch, S. Stress memory and the inevitable effects of drought: A physiological perspective. Front. Plant Sci. 2016, 7, 143. [Google Scholar] [CrossRef] [Green Version]
  40. Peltier, D.M.; Fell, M.; Ogle, K. Legacy effects of drought in the southwestern United States: A multi-species synthesis. Ecol. Monogr. 2016, 86, 312–326. [Google Scholar] [CrossRef]
  41. Wu, X.-C.; Liu, H.-Y.; Li, X.-Y.; Ciais, P.; Babst, F.; Guo, W.; Zhang, C.; Magliulo, V.; Pavelka, M.; Liu, S.; et al. Differentiating drought legacy effects on vegetation growth over the temperate Northern Hemisphere. Glob. Chang. Biol. 2018, 24, 504–516. [Google Scholar] [CrossRef] [PubMed]
  42. Jiao, S.-R. Report on the causes of the early decline of Pinus slyvestris var. mongolica shelterbelt and its preventative and control measures in Zhanggutai of Liaoning Province. Sci. Silvae Sin. 2001, 37, 131–138. [Google Scholar]
  43. Zhu, J.-J.; Zeng, D.-H.; Kang, H. Decline of Pinus Sylvestris var. Mongolica Plantations on Sandy Land; Chinese Forestry Press: Beijing, China, 2005. [Google Scholar]
  44. Zhu, J.; Li, F.; Xu, M.; Kang, H.; Wu, X. The role of ectomycorrhizal fungi in alleviating pine decline in semiarid sandy soil of northern China: An experimental approach. Ann. For. Sci. 2008, 65, 304. [Google Scholar] [CrossRef] [Green Version]
  45. Zheng, X.; Zhu, J.; Yan, Q.; Song, L. Effects of land use changes on the groundwater table and the decline of Pinus sylvestris var. mongolica plantations in southern Horqin Sandy Land, Northeast China. Agric. Water Manag. 2012, 109, 94–106. [Google Scholar] [CrossRef]
  46. Jiang, F.-Q.; Cao, C.-Y.; Zeng, D.-H. Degradation and Restoration of Ecosystems on Keerqin Sandy Land; Chinese Forestry Press: Beijing, China, 2002. [Google Scholar]
  47. Song, L.-N.; Zhu, J.-J.; Yan, Q.-L.; Li, M.-C.; Yu, G.-Q. Comparison of intrinsic water use efficiency between different aged Pinus sylvestris var. mongolica wide windbreaks in semiarid sandy land of northern China. Agrofor. Syst. 2015, 89, 477–489. [Google Scholar] [CrossRef]
  48. Song, L.; Zhu, J.; Li, M.; Zhang, J.; Zheng, X.; Wang, K. Canopy transpiration of Pinus sylvestris var. mongolica in a sparse wood grassland in the semiarid sandy region of Northeast China. Agric. For. Meteorol. 2018, 250, 192–201. [Google Scholar] [CrossRef]
  49. Song, L.; Zhu, J.; Li, M.; Yu, Z. Water utilization of Pinus sylvestris var. mongolica in a sparse wood grassland in the semiarid sandy region of Northeast China. Trees 2014, 28, 971–982. [Google Scholar] [CrossRef]
  50. Köstner, B.; Biron, P.; Siegwolf, R.; Granier, A. Estimates of water vapor flux and canopy conductance of Scots pine at the tree level utilizing different xylem sap flow methods. Theor. Appl. Climatol. 1996, 53, 105–113. [Google Scholar] [CrossRef]
  51. Kume, T.; Onozawa, Y.; Komatsu, H.; Tsuruta, K.; Shinohara, Y.; Umebayashi, T.; Otsuki, K. Stand-scale transpiration estimates in a Moso bamboo forest:(I) Applicability of sap flux measurements. For. Ecol. Manag. 2010, 260, 1287–1294. [Google Scholar] [CrossRef]
  52. Campbell, G.S.; Norman, J.M. An Introduction to Environmental Biophysics, 2nd ed.; Springer-Verlag: New York, NY, USA, 1998; pp. 37–50. [Google Scholar]
  53. Bernier, P.; Bréda, N.; Granier, A.; Raulier, F.; Mathieu, F. Validation of a canopy gas exchange model and derivation of a soil water modifier for transpiration for sugar maple (Acer saccharum Marsh.) using sap flow density measurements. For. Ecol. Manag. 2002, 163, 185–196. [Google Scholar] [CrossRef]
  54. Poyatos, R.; Llorens, P.; Gallart, F. Transpiration of montane Pinus sylvestris L. and Quercus pubescens Willd. forest stands measured with sap flow sensors in NE Spain. Hydrol. Earth Syst. Sci. 2005, 2, 1011–1046. [Google Scholar] [CrossRef] [Green Version]
  55. Moore, G.W.; Bond, B.J.; Jones, J.A.; Meinzer, F.C. Thermal-dissipation sap flow sensors may not yield consistent sap-flux estimates over multiple years. Trees 2010, 24, 165–174. [Google Scholar] [CrossRef]
  56. Granier, A. Evaluation of transpiration in a Douglas-fir stand by means of sap flow measurements. Tree Physiol. 1987, 3, 309–320. [Google Scholar] [CrossRef] [PubMed]
  57. Lu, P.; Urban, L.; Zhao, P. Granier’s thermal dissipation probe (TDP) method for measuring sap flow in trees: Theory and practice. Aata Bot. Sin.Engl. Ed. 2004, 46, 631–646. [Google Scholar]
  58. Nadezhdina, N.; Čermák, J.; Ceulemans, R. Radial patterns of sap flow in woody stems of dominant and understory species: Scaling errors associated with positioning of sensors. Tree Physiol. 2002, 22, 907–918. [Google Scholar] [CrossRef] [PubMed] [Green Version]
  59. Han, H.; Bai, X.-F.; Xu, G.-J.; Zhang, B.-X.; You, G.-C.; Liu, S.; Gu, Y.; Shang, S. Others Trunk sap flux density of Pinus sylvestris var. mongolica in Zhanggutai area. J. Northeast For. Univ. 2013, 41, 27–82. [Google Scholar]
  60. Bartkowiak, S.M.; Samuelson, L.J.; McGuire, M.A.; Teskey, R.O. Fertilization increases sensitivity of canopy stomatal conductance and transpiration to throughfall reduction in an 8-year-old loblolly pine plantation. For. Ecol. Manag. 2015, 354, 87–96. [Google Scholar] [CrossRef]
  61. Jiao, S.-R. Structure and Function of Forestry Ecosystem for Sand-Fixation in Zhanggutai Area; Liaoning Science and Technology Press: Shenyang, China, 1989. [Google Scholar]
  62. Ewers, B.E.; Oren, R. Analyses of assumptions and errors in the calculation of stomatal conductance from sap flux measurements. Tree Physiol. 2000, 20, 579–589. [Google Scholar] [CrossRef] [Green Version]
  63. Gazol, A.; Ribas, M.; Gutiérrez, E.; Camarero, J.J. Aleppo pine forests from across Spain show drought-induced growth decline and partial recovery. Agric. For. Meteorol. 2017, 232, 186–194. [Google Scholar] [CrossRef]
  64. Pichler, P.; Oberhuber, W. Radial growth response of coniferous forest trees in an inner Alpine environment to heat-wave in 2003. For. Ecol. Manag. 2007, 242, 688–699. [Google Scholar] [CrossRef]
  65. Llorens, P.; Poyatos, R.; Latron, J.; Delgado, J.; Oliveras, I.; Gallart, F. A multi-year study of rainfall and soil water controls on Scots pine transpiration under Mediterranean mountain conditions. Hydrol. Process. 2010, 24, 3053–3064. [Google Scholar] [CrossRef]
  66. Gruber, A.; Strobl, S.; Veit, B.; Oberhuber, W. Impact of drought on the temporal dynamics of wood formation in Pinus sylvestris. Tree Physiol. 2010, 30, 490–501. [Google Scholar] [CrossRef] [PubMed] [Green Version]
  67. Guada, G.; Camarero, J.J.; Sánchez-Salguero, R.; Cerrillo, R.M.N. Limited growth recovery after drought-induced forest dieback in very defoliated trees of two pine species. Front. Plant Sci. 2016, 7, 418. [Google Scholar] [CrossRef] [PubMed]
  68. Eilmann, B.; Dobbertin, M.; Rigling, A. Growth response of Scots pine with different crown transparency status to drought release. Ann. For. Sci. 2013, 70, 685–693. [Google Scholar] [CrossRef] [Green Version]
  69. Irvine, J.; Perks, M.P.; Magnani, F.; Grace, J. The response of Pinus sylvestris to drought: Stomatal control of transpiration and hydraulic conductance. Tree Physiol. 1998, 18, 393–402. [Google Scholar] [CrossRef]
  70. Fogel, R. Root turnover and productivity of coniferous forests. In Tree Root Systems and Their Mycorrhizas; Springer-Verlag: New York, NY, USA, 1983; pp. 75–85. [Google Scholar]
  71. Vanguelova, E.; Nortcliff, S.; Moffat, A.; Kennedy, F. Morphology, biomass and nutrient status of fine roots of Scots pine (Pinus sylvestris) as influenced by seasonal fluctuations in soil moisture and soil solution chemistry. Plant Soil 2005, 270, 233–247. [Google Scholar] [CrossRef]
  72. Palmroth, S.; Berninger, F.; Nikinmaa, E.; Lloyd, J.; Pulkkinen, P.; Hari, P. Structural adaptation rather than water conservation was observed in Scots pine over a range of wet to dry climates. Oecologia 1999, 121, 302–309. [Google Scholar] [CrossRef]
  73. Poyatos, R.; Llorens, P.; Piñol, J.; Rubio, C. Response of Scots pine (Pinus sylvestris L.) and pubescent oak (Quercus pubescens Willd.) to soil and atmospheric water deficits under Mediterranean mountain climate. Ann. For. Sci. 2008, 65, 306. [Google Scholar] [CrossRef]
  74. Morán-López, T.; Poyatos, R.; Llorens, P.; Sabaté, S. Effects of past growth trends and current water use strategies on Scots pine and pubescent oak drought sensitivity. Eur. J. For. Res. 2014, 133, 369–382. [Google Scholar] [CrossRef]
  75. Wieser, G.; Gruber, A.; Oberhuber, W. Sap flow characteristics and whole-tree water use of Pinus cembra across the treeline ecotone of the central Tyrolean Alps. Eur. J. For. Res. 2014, 133, 287–295. [Google Scholar] [CrossRef]
  76. Jones, H.G. Plants and Microclimate: A Quantitative Approach to Environmental Plant Physiology, 3rd ed.; Cambridge University Press: Cambridge, UK, 2014; pp. 122–152. [Google Scholar]
  77. Addington, R.N.; Mitchell, R.J.; Oren, R.; Donovan, L.A. Stomatal sensitivity to vapor pressure deficit and its relationship to hydraulic conductance in Pinus palustris. Tree Physiol. 2004, 24, 561–569. [Google Scholar] [CrossRef] [PubMed] [Green Version]
  78. Zeppel, M.J.; Murray, B.R.; Barton, C.; Eamus, D. Seasonal responses of xylem sap velocity to VPD and solar radiation during drought in a stand of native trees in temperate Australia. Funct. Plant Biol. 2004, 31, 461–470. [Google Scholar] [CrossRef]
Figure 1. Environmental factors: (a) anomalies in monthly precipitation from the long-term averages, (b) monthly mean volumetric soil moisture content ( θ ¯ ) in the 0–1 m soil layer, (c) monthly mean vapor pressure deficit (VPD). The error bars represent standard error (S.E.). P ¯ is the multiple-year annual precipitation, based on measurements over the 30 years period during 1983–2012. The horizontal line in (b) indicates the lower limit of relative extractable soil water, i.e., 0.4 [56], corresponding to a value of θ ¯ 0.086 cm3·cm−3 in this study. The five years in the study period during 2013–2017 are marked as a ‘normal’ year, a ‘dry’ year, a ‘very dry’ year, a ‘wet’ year, and a ‘dry’ year, respectively, according to annual precipitation and soil moisture conditions.
Forests 10 01143 g001
Figure 2. Diameter at breast height (DBH, cm) measured at the end of the season (a), and annual radial increment in DBH (cm·yr−1) of sample trees (b), from 2013 to 2017 in Zhanggutai, Liaoning Province, China. The value is the average of the 11 sample trees. Different lowercase letters indicate a significant difference (p = 0.05).
Forests 10 01143 g002
Figure 3. Total transpiration per year (tons·tree−1) during 2013–2017. Values presented are the statistical values of 11 sample trees. Different lowercase letters indicate significant difference between the means (p < 0.05).
Forests 10 01143 g003
Figure 4. Seasonal dynamics of daily transpiration per tree (Qt, kg·tree−1·d−1) during the growing season in each year during 2013–2017 were plotted in (ae), respectively. The circles represent the daily averages, and the whisker lines indicate the standard error (±S.E.) for the 11 sample trees. The dashed lines represent the averages of daily transpiration.
Forests 10 01143 g004
Figure 5. Seasonal dynamics of daily mean canopy stomatal conductance (Gs, cm·s−1) in the daytime of the growing season during 2013–2017 were plotted in (ae), respectively. The circles represent daytime averages. The whisker lines indicate the standard error (±S.E.) from 11 sample trees. The dashed line is the average for the year.
Forests 10 01143 g005
Figure 6. Diurnal courses of transpiration (Qt) on sunny days in the early, mid-, and late parts of the growing season in 2013 (the ‘normal’ year), 2015 (the ‘very dry’ year), and 2016 (the ‘wet’ year) were plotted in (ac), respectively. Canopy stomata conductance (Gs) from the same periods were plotted in (df), respectively. The maxima of daily VPD values on sunny days were 2.5 kPa in the early and mid-part of the growing season, with 1.5 kPa in the late part of the growing season, over the entire study period. Three sunny days were selected from the early, mid-, and late parts of the growing season, which were DOY 155, DOY 222, and DOY 285 in 2013; DOY 160, DOY 216, and DOY 278 in 2015; and DOY 149, DOY 233, and DOY 272 in 2016. The bars indicate standard errors from 11 sample trees. The value of Gs was calculated only when hourly VPD > 0.6 kPa. DOY: Day of the year.
Forests 10 01143 g006
Table 1. The initial diameter at breast height (DBH), tree height (H), height to live crown (Hb), and sapwood area at DBH height (As) for all sample trees measured before the experiment (in 2012).
Sample No.DBH (cm)H (m)Hb (m)As (cm2)
114.39.14.14127
215.19.83.89141
316.19.33.91159
416.98.23.96175
517.79.64.00192
617.79.73.80192
717.89.74.01194
818.19.74.01200
918.29.73.73202
1018.69.84.04211
1119.19.94.09222
Mean17.29.53.96183
Standard Error (S.E.)0.450.150.048.9
Table 2. Daily transpiration and canopy stomatal conductance in different parts of the growing season from 2013 to 2017. Comparisons in each part were calculated using a mixed-effects model.
YearMean Daily Transpiration (kg·tree−1·d−1)Mean Daily Canopy Stomatal Conductance (cm·s−1)
Early Season 1Mid-SeasonLate SeasonEarly SeasonMid-SeasonLate Season
201322.8 ± 2.3 Aa23.9 ± 2.6 Ac13.8 ± 1.2 Ba0.30 ± 0.03 Aa0.39 ± 0.04 Ac0.31 ± 0.03 Ab
201420.8 ± 1.6 Aa16.7 ± 1.2 Aa11.9 ± 0.9 Bab0.26 ± 0.02 Aa0.26 ± 0.02 Aa0.19 ± 0.01 Ba
201511.6 ± 0.8 Bb8.5 ± 0.5 Ab9.2 ± 0.6 Abc0.14 ± 0.01 ABb0.11 ± 0.01 Bb0.16 ± 0.01 Aa
201612.6 ± 2.3 Ab12.6 ± 2.0 Aab7.7 ± 1.0 Ac0.15 ± 0.03 Ab0.18 ± 0.03 Aab0.19 ± 0.03 Aa
201711.5 ± 0.9 Ab11.2 ± 0.8 Aab7.6 ± 0.6 Bc0.13 ± 0.01 Ab0.19 ± 0.02 Bab0.17 ± 0.01 ABa
mean16.1 ± 1.01 A13.7 ± 1.07 A10.4 ± 0.51 B0.20 ± 0.01 A0.23 ± 0.02 A0.20 ± 0.01 A
pyears<0.01<0.01<0.01<0.01<0.01<0.01
ptrees0.290.530.240.350.150.51
1 The early season means the early part of the growing season in the year, running from 1 May to 30 June, the mid-season is from 1 July to 31 August, and the late season is from 1 September to 31 October. Values presented are the statistical value of 11 sample trees (mean ± S.E.). Different lowercase letters indicate a significant difference between different years. Different uppercase letters indicate a significant difference between different parts of the growing season in each year.

