Article

Mite Communities (Acari, Mesostigmata) in the Initially Decomposed ‘Litter Islands’ of 11 Tree Species in Scots Pine (Pinus sylvestris L.) Forest

by
Jacek Kamczyc
1,*,
Marcin K. Dyderski
2,
Paweł Horodecki
2 and
Andrzej M. Jagodziński
2
1
Department of Game Management and Forest Protection, Faculty of Forestry, Poznań University of Life Sciences, Wojska Polskiego 71c, PL-60625 Poznań, Poland
2
Institute of Dendrology, Polish Academy of Sciences, Parkowa 5, PL-62035 Kórnik, Poland
*
Author to whom correspondence should be addressed.
Submission received: 4 April 2019 / Revised: 6 May 2019 / Accepted: 7 May 2019 / Published: 9 May 2019
(This article belongs to the Special Issue Impacts, Monitoring and Management of Forest Pests and Diseases)

Abstract

:
Replacement of native deciduous forests by coniferous stands was a common result of former European afforestation policies and paradigms of forest management and led to considerable ecological consequences. Therefore, the most popular management strategy nowadays in multi-functional forestry is the re-establishment of mixed or broadleaved forests with native species on suitable habitats. However, our knowledge about the effects of tree species introduced into coniferous monocultures on soil mesofauna communities is scarce. We investigated abundance, species richness and diversity of Mesostigmata mite communities in decomposed litter of seven broadleaved (Acer platanoides L., A. pseudoplatanus L., Carpinus betulus L., Fagus sylvatica L., Tilia cordata Mill., Quercus robur L., Q. rubra L.) and four coniferous (Abies alba Mill., Larix decidua Mill., Picea abies [L.] Karst., Pinus sylvestris L.) species. We collected 297 litterbags after 6, 12 and 18 months of exposition in Scots pine (Pinus sylvestris) monocultures in Siemianice Experimental Forest (SW Poland). Generally, species richness and diversity in litter samples were much lower than in the soil mite pool. The highest abundance was found in P. sylvestris and A. alba litter, while the lowest was found in A. platanoides. The most abundant families were Zerconidae, Parasitidae, Veigaiidae, and Trachytidae. Our study revealed that neither species richness nor diversity were affected, but that mite abundance was affected, by the tree species (litter quality). The mite communities were similarly comprised in both high- and low-quality litter and mite abundance decreased during the decomposition process in nutrient-poor Scots pine forests. Moreover, few mite species benefited from the decomposed litter. Additionally, a litter of various tree species was inhabited mainly by eu- and hemiedaphic mite species. Mite assemblages in A. alba, P. sylvestris, and Q. robur litter had higher abundances. Exposition time seems to be an important driver in shaping the mite community during the early stages of litter decomposition.

1. Introduction

In recent centuries, almost all European forest ecosystems have been altered by forest management of varying intensities [1]. Forest management has replaced natural broadleaved forests with coniferous monocultures, mainly due to economic benefits. However, this transformation also has negative ecological consequences, e.g., even-aged coniferous forests provide less diverse habitats for many species [2] and are susceptible to global warming [3,4], pests, diseases or wind-throw, and create more acidic soils [5], which can impact the soil fauna. Therefore, to improve the resistance of the monocultures, additional (admixture) tree species are introduced into the even-aged monocultures. Planting multiple species can gain numerous economic, environmental and social benefits [6], e.g., some species can have nurse effects on other tree species, and mixtures of fast-growing and slower-growing tree species can produce timber and more valuable wood products while reducing risks of soil erosion and providing shelter and protection against frost or pests [7], or mixed forests sustain higher species richness than pure stands [8]. Therefore, the question of how the additional (both coniferous and broadleaved) tree species impact even-aged monocultures are critical in sustainable forestry.
Plant litter decomposition is one of the most important biogeochemical process in the cycling of carbon and nutrients in terrestrial ecosystems [9] and is driven by the interactions among three main factors, i.e., physicochemical environment (climate and soil conditions), litter quality and soil organisms [10]. Previous studies indicated that decomposition decreases with altitude [11] and differs between forests with various stages of anthropogenic impact [12]. This suggests that the environment (climate or/and soil) plays a crucial role in this process. However, there is still a gap in knowledge of how decomposed litter of various tree species affects soil fauna communities in nutrient poor coniferous monocultures.
One of the soil fauna groups related to decomposition processes is mites (Acari). Among them, soil Mesostigmata are very important for soil ecosystems, both in terms of species and function [13]. Most Mesostigmata—free-living predators among the soil mesofauna—have a crucial position in the soil food web, contributing significantly to energy and matter turnover [14]. Moreover, the majority of Gamasina (a subset of Mesostigmata) by affecting population growth of other fauna such as nematodes, Collembola, enchytraeids, insect larva, and other mites, they regulate the population size of soil fauna communities [15]. Thus, they can indirectly induce a strong influence on decomposition dynamics [9]. On the other hand, their abundance might depend on the dynamics of their prey, which have different sensitivity to microhabitat conditions [10]. They are also highly susceptible to anthropogenic and natural disturbances and perturbations [15], which makes them good indicators of ecosystem processes [16].
Studies on decomposition processes associated with soil fauna in forest ecosystems have been conducted in various forest types [10,11,17,18] and with various intensities [19,20]. A majority of the research took place in broadleaved forests, and focused on decomposition of leaves and root litter [9,11,21,22,23], and only a few studies were carried out in coniferous forests [12,18,22,24].
Previous studies indicated that species richness of various groups of soil invertebrates depends on environmental factors such as light variability, soil temperature and soil and litter chemistry [25]. This may suggest that the litter quality (tree species) is an important driver in shaping soil fauna communities. Additionally, published data focused on the decomposition process of autochthonic (native) [22,26,27], or allochthonic (foreign) litter [28]; however, there is still a gap in knowledge as to how the litter of both coniferous and broadleaved species impact the soil fauna communities. Recent studies have focused on the home-field advantage effect (HFA), which means that the plant detritus in litterbags placed into native (‘home’) forests decomposes faster than ‘foreign’ litter, due to well-adapted soil biota communities [29], or on the substrate quality–matrix quality interaction, where the interaction between soil biota and decomposed litter is also affected by variations in litter quality and palatability for decomposers [30]. Although Keiser et al. [31] suggested that microbes are mostly responsible for the HFA effect, recent studies have also focused on animals from higher trophic levels such as decomposer mites (Oribatida) and springtails (Collembola) [32]. These studies indicated that Collembola communities were similar between oak (Quercus cerris) and pine (Pinus sylvestris) litter, but they differed from black locus (Robinia pseudoacacia) litter. On the other hand, they also reported different abundances between the sampling dates. This suggests that the impact of litter on soil fauna communities can be specific and that it changes with time during the decomposition process. Therefore, studies are needed that connect the decomposition process, soil fauna, and ‘native’ and ‘foreign’ litter types in nutrient-poor coniferous monocultures. This is very interesting, assuming that the differences in structural compounds between the litters of coniferous and broadleaved species support different energy channels (bacterial and fungal) in the soil food web.
We hypothesized that (1) mite abundance, species richness and diversity of their communities depend on the litter quality (tree species) that is placed in nutrient-poor Scots pine forests, (2) high-quality and easily decomposable litter of various tree species affects mite communities similarly, and (3) mite abundance decreases during the decomposition process, due to low amount of available resources for their prey and changes in available niches.

2. Material and Methods

2.1. Study Site

The study was conducted in the Siemianice Experimental Forest near Biadaszki, SW Poland, which belongs to the Poznań University of Life Sciences. For this study we chose an experimental site with a Scots pine (Pinus sylvestris) stand established in 1974. In 1973, prior to establishment of the experiment, the soil was recognized as podsolic, sandy, and nutrient-poor, and vegetation cover was defined as Leucobryo-Pinetum [33]. The mature Scots pine (Pinus sylvestris) stand was cut, stumps and coarse roots were dug up and removed and deep ploughing was done (60–70 cm). In the spring of 1974 two-year-old Scots pine seedlings were planted in nine different spacings (3 replicates/spacing; area of each plot is 0.11 ha, 27 m × 41 m; 3.07 ha in total with buffer zone), with initial stand densities from 2500 to 20,833 trees per ha. From the onset of the experiment, no cleanings and thinnings were done, and stand density was reduced only as a result of natural mortality.
The climate of the region is transitional (between maritime and continental) with low mean annual precipitation (591 mm) and mean annual temperature of 8.2 °C [34]. During the experiment, mean monthly temperature ranged from −6.6 °C (January 2010; Table A1 in Appendix A) to 19.4 °C (July 2009) and monthly precipitation sum ranged from 9.4 (April 2009) to 224.6 mm (July 2009).
For the decomposition study we chose three research stands (plots) with the same initial density (11,111 trees/ha) and covered with circa (=ca.) 35-year-old stands, to exclude the influence of initial stand density on ecosystem processes [35,36,37]. In the years 2002–2007, extensive data collection was done on this experimental site. Based on these data, the experimental stands used for the study (three plots) may be described as follows (means ± SE): DBH—9.4 ± 0.28 cm, tree height—12.9 ± 0.15 m, stand basal area—37.4 ± 0.90 m2/ha, stand density—4908 ± 399 trees/ha, litter biomass of the organic horizon—30.45 ± 2.10 Mg/ha, annual litterfall—2.89 ± 0.16 Mg/ha, pHKCl of Oll horizon—4.04 ± 0.04, pHH2O of Oll horizon—4.39 ± 0.08, pHKCl of Ol horizon—4.03 ± 0.08, pHH2O of Ol horizon—4.71 ± 0.09, pHKCl of Of horizon—3.02 ± 0.03, pHH2O of Of horizon—3.91 ± 0.06. The checklist of mites from the studied forests was presented by Skorupski et al. [38], who recorded 28 species from the soil environment.

2.2. Soil Sampling and Litterbag Experiment Design

The experiment was conducted in three study plots (numbers: 5, 13 and 27) where Scots pine seedlings were planted with an initial spacing of 0.6 m × 1.5 m. Simultaneously with the placement of litterbags we collected 25 soil samples from each plot (75 samples in total) using a steel corer (40 cm2; soil depth 5 cm), to characterize the species pool, abundance and diversity of Mesostigmata mites. The litter for the litterbag experiment was collected from plots of the common garden experiment located ca. 500 m from the Scots pine forest. The complete characteristics of the litter, which originated from the common garden experiment and was used in the present study, was described by Hobbie et al. [34] The litter included 11 tree species, consisting of seven broadleaved and four coniferous species. The broadleaved species were represented by Norway maple (Acer platanoides L.), Sycamore maple (A. pseudoplatanus L.), European hornbeam (Carpinus betulus L.), European beech (Fagus sylvatica L.) and small-leaved lime (Tilia cordata Mill.), English oak (Quercus robur L.) and invasive Northern red oak (Q. rubra L.). The coniferous species included silver fir (Abies alba Mill.), European larch (Larix decidua Mill.), Norway spruce (Picea abies [L.] Karst.) and Scots pine (native, collected from Scots pine forest). The litter for the experiment was oven-dried at 65 °C for at least 3 days to eliminate the living animals including mites and to obtain a constant dry mass. We used this initial mass to calculate the mass loss in relation to the initial litter mass for each litterbag. The homogenous litter of each tree species was placed in nylon bags with the mesh size of 1 mm to allow free access of living animals to migrate into the sample with organic matter. The prepared litterbags (~18 × 18 cm) of 11 tree species were randomly tied to one rope (length ca. 6 m) with equal distances of 0.5 m; therefore, we set up 27 ropes with randomly distributed litterbags. Such prepared litterbags were randomly placed in the experimental Pinus sylvestris forest plots.
The experiment started on the 14th of October 2008 and lasted 18 months. Firstly, the ropes with litterbags were laid on the spacing between rows. The distance between the parallel ropes were ca. 70 cm. In total, 75 soil samples and 297 litterbags (11 tree species × 3 plots × 3 replications per plot × 3 sampling periods) were collected in our study. The litterbags overwintered and were sampled in equal numbers (99 litterbags), three times at six-month intervals, on 15 April 2009, 19 October 2009, and after the second overwintering on 16 April 2010.

2.3. Mite Extraction and Identification

Soil samples and litterbags were placed in plastic bags and transported in a portable cooler to the laboratory. Mites were extracted from samples in Tullgren funnels which is recommended for species inventory in highly organic soils such as those in the Pinus sylvestris forest floors in this study [39,40]. Extraction started as quickly as possible, within 5 hours after sampling and lasted over a period of 7 days. Among all animals extracted, Mesostigmata mites were selected and identified to species level and developmental stages using taxonomical keys of Karg [41], Ghilarov and Bregetova [42] and Micherdziński [43].

2.4. Data Analysis

Mite abundances coming from the same plots, terms, and litter types were pooled to allow conclusions about diversity within sample plots. This reduced the number of replications per each variant to three but allowed conclusions about diversity of mites at the plot level. In the case of the control sample (soil mite pool), we also pooled data from 25 cores per each plot into single observations. We used them as reference values to describe succession of mites. We evaluated species richness using number of taxa recorded within the study plot, species diversity using Shannon index, and abundance per sample. All mean values are followed by the standard error (SE). To assess differentiation between soil mite communities during the experimental setup (initial species pool) we used the Bray-Curtis dissimilarity index calculated for the binary representation of species composition. For this, we used the vegdist function from the vegan package [44].
To assess the impact of collection date, litter quality (expressed by its identity, which can be linked with measured litter traits) and its decomposition rate (k constant—calculated with use a single-exponential decomposition model proposed by Wieder and Lang [45]) we used generalized linear mixed models (GLMM). We assumed that mite abundance and species richness have Poisson distributions while the Shannon’s index has a normal distribution. As we assumed the Poisson distribution of mite abundance, we did not recalculate abundance per sample mass, as Poisson distributions assume integer values.
We evaluated random effects connected with plot identity, to exclude plot-specific factors, which could affect the results. Models were developed using the lme4 package [46], while the statistical significance of variables was calculated using z-values implemented in the lmerTest package [47]. For all GLMMs, we evaluated the parsimony of models using Akaike’s Information Criterion (AIC). We also provided AIC0–AIC of models with intercept and random effects only. To evaluate differences between litter origin and collection dates in the models we used Tukey posteriori tests.
To assess the importance of such factors in shaping mite species communities we used Redundancy Analysis (RDA), implemented in the vegan package [44]. RDA is the method of constrained ordination of the multidimensional dataset (here—abundances of particular mite species). In contrast to unconstrained ordination, RDA also allows evaluation of the importance of environmental variables in ordered sample coordinates within reduced space of the ordination. The importance of factors was tested using permutation analysis of variance (PERMANOVA), also implemented in the vegan package [44]. Prior to analysis, we transformed species abundances using Hellinger’s square root transformation. We selected variables for the final models based on AIC. Statistical analyses were conducted using R software [48].

3. Results

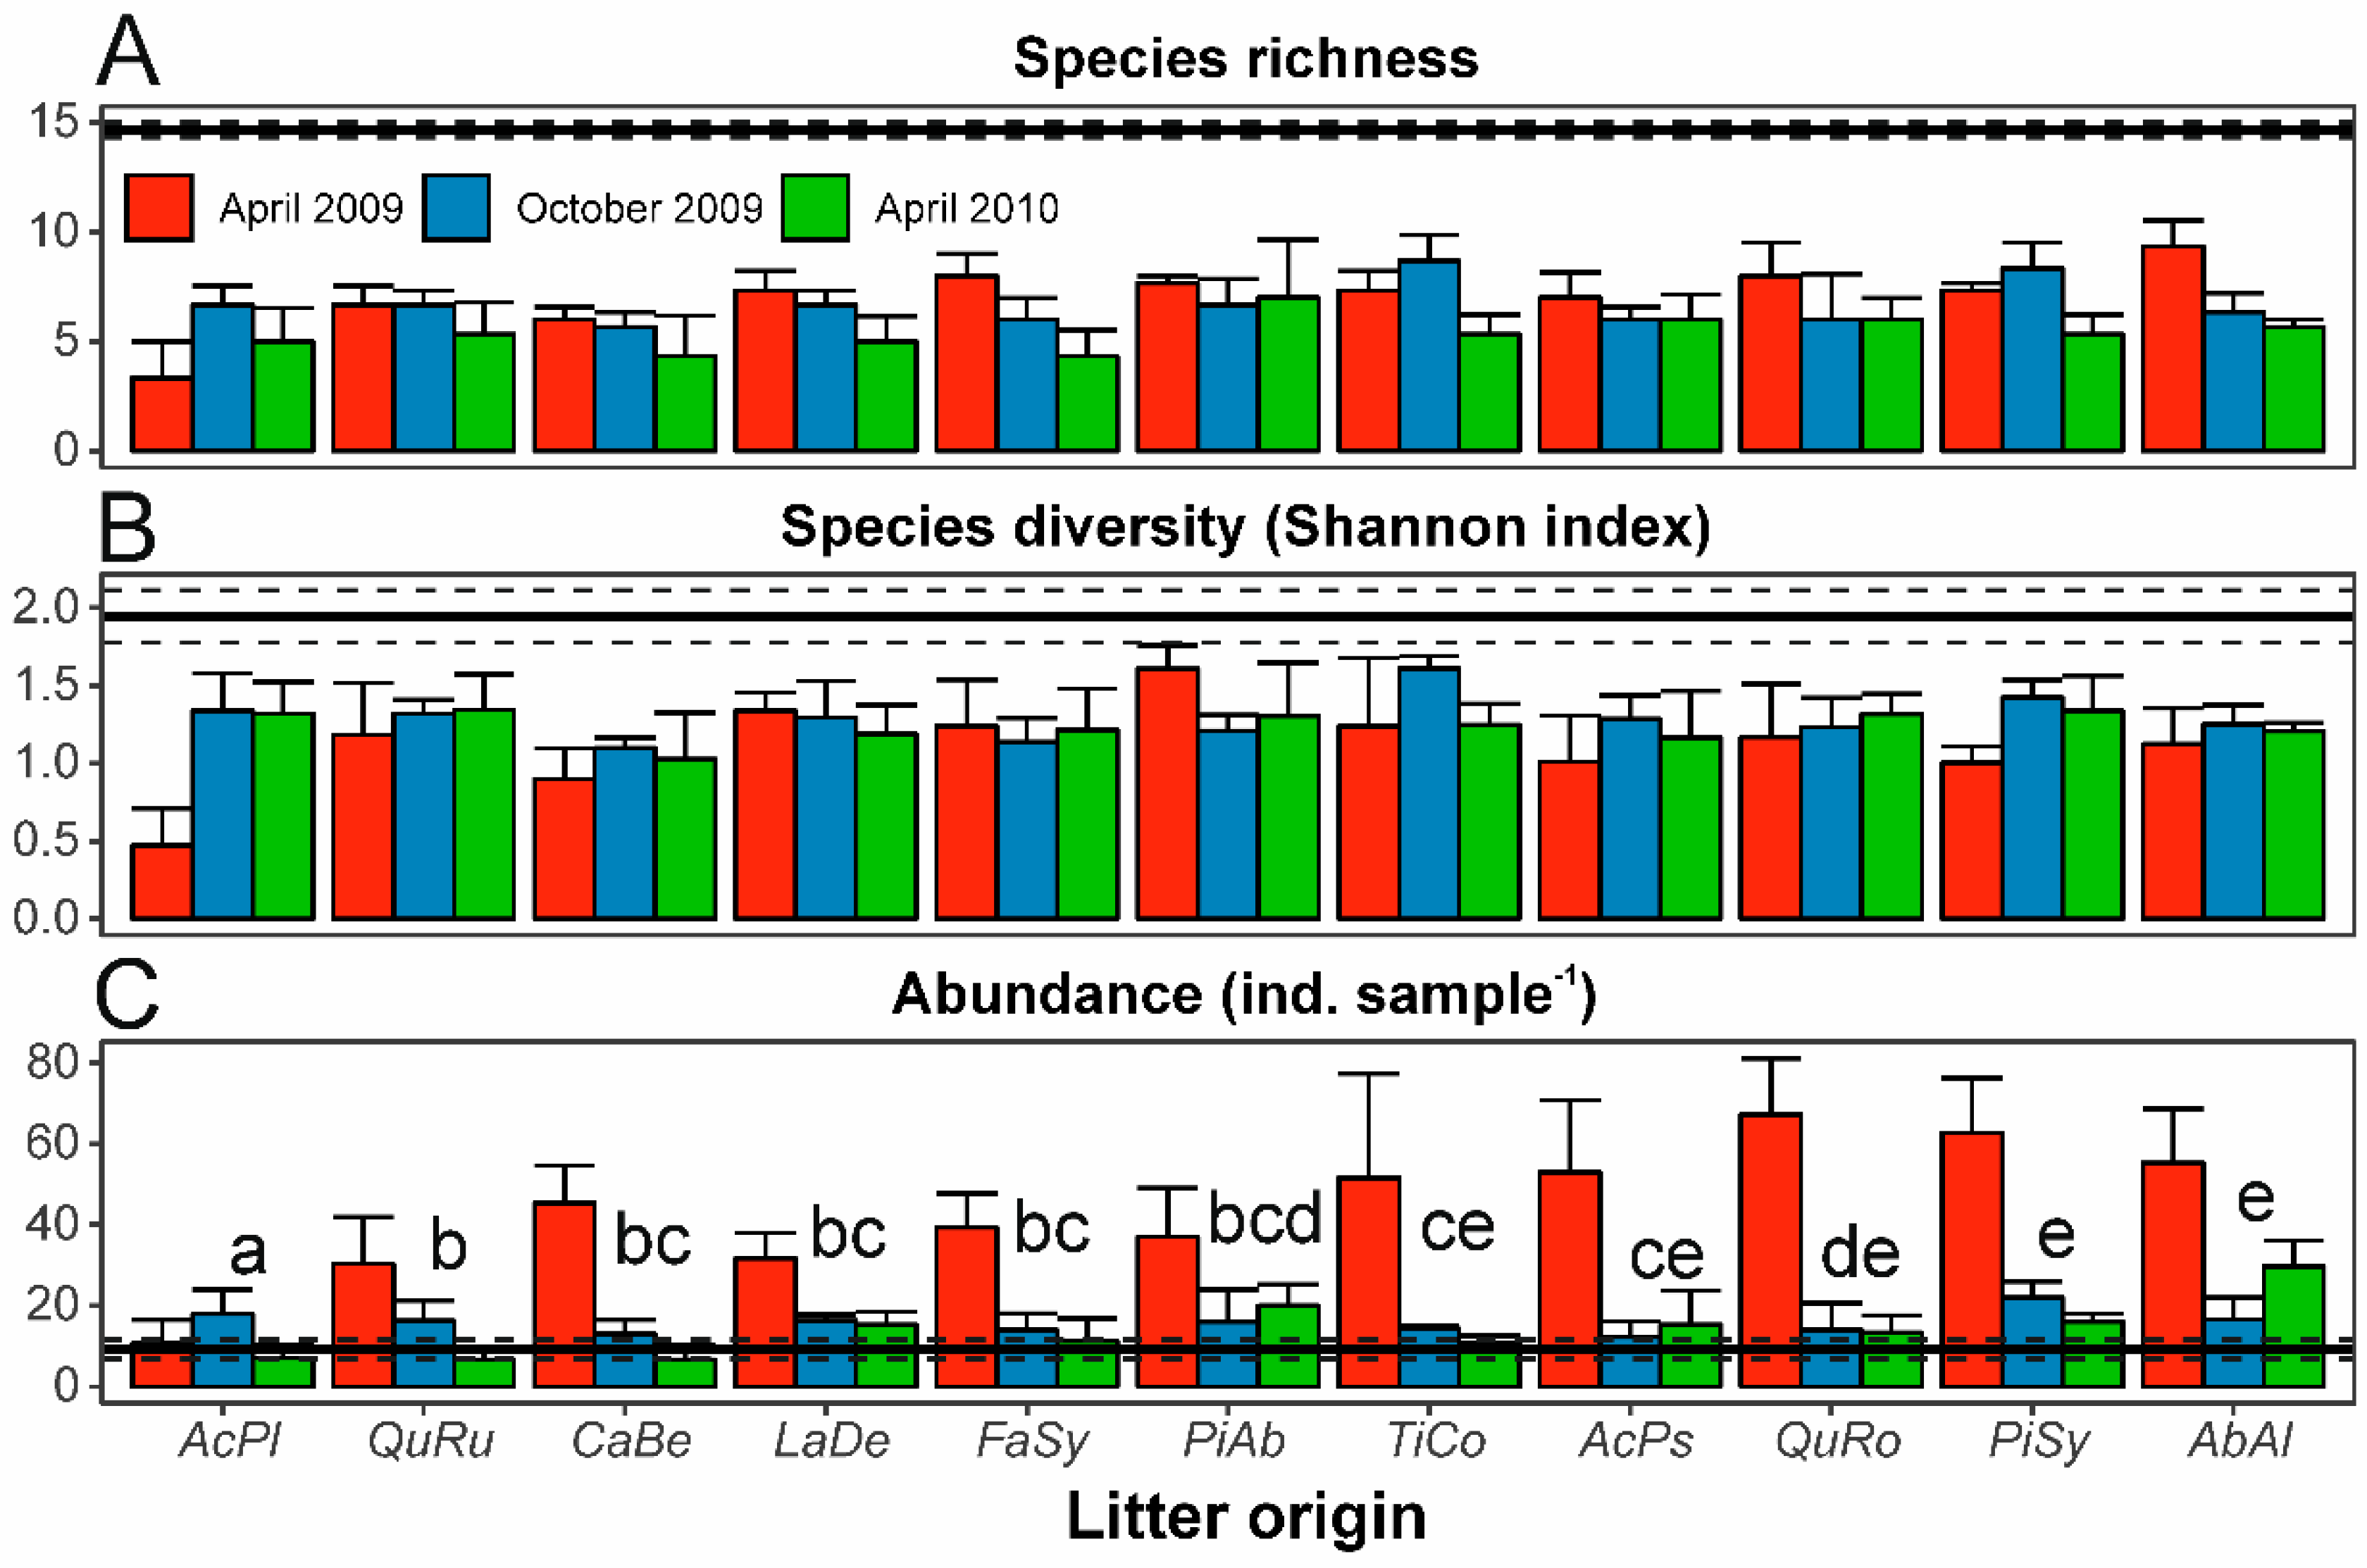
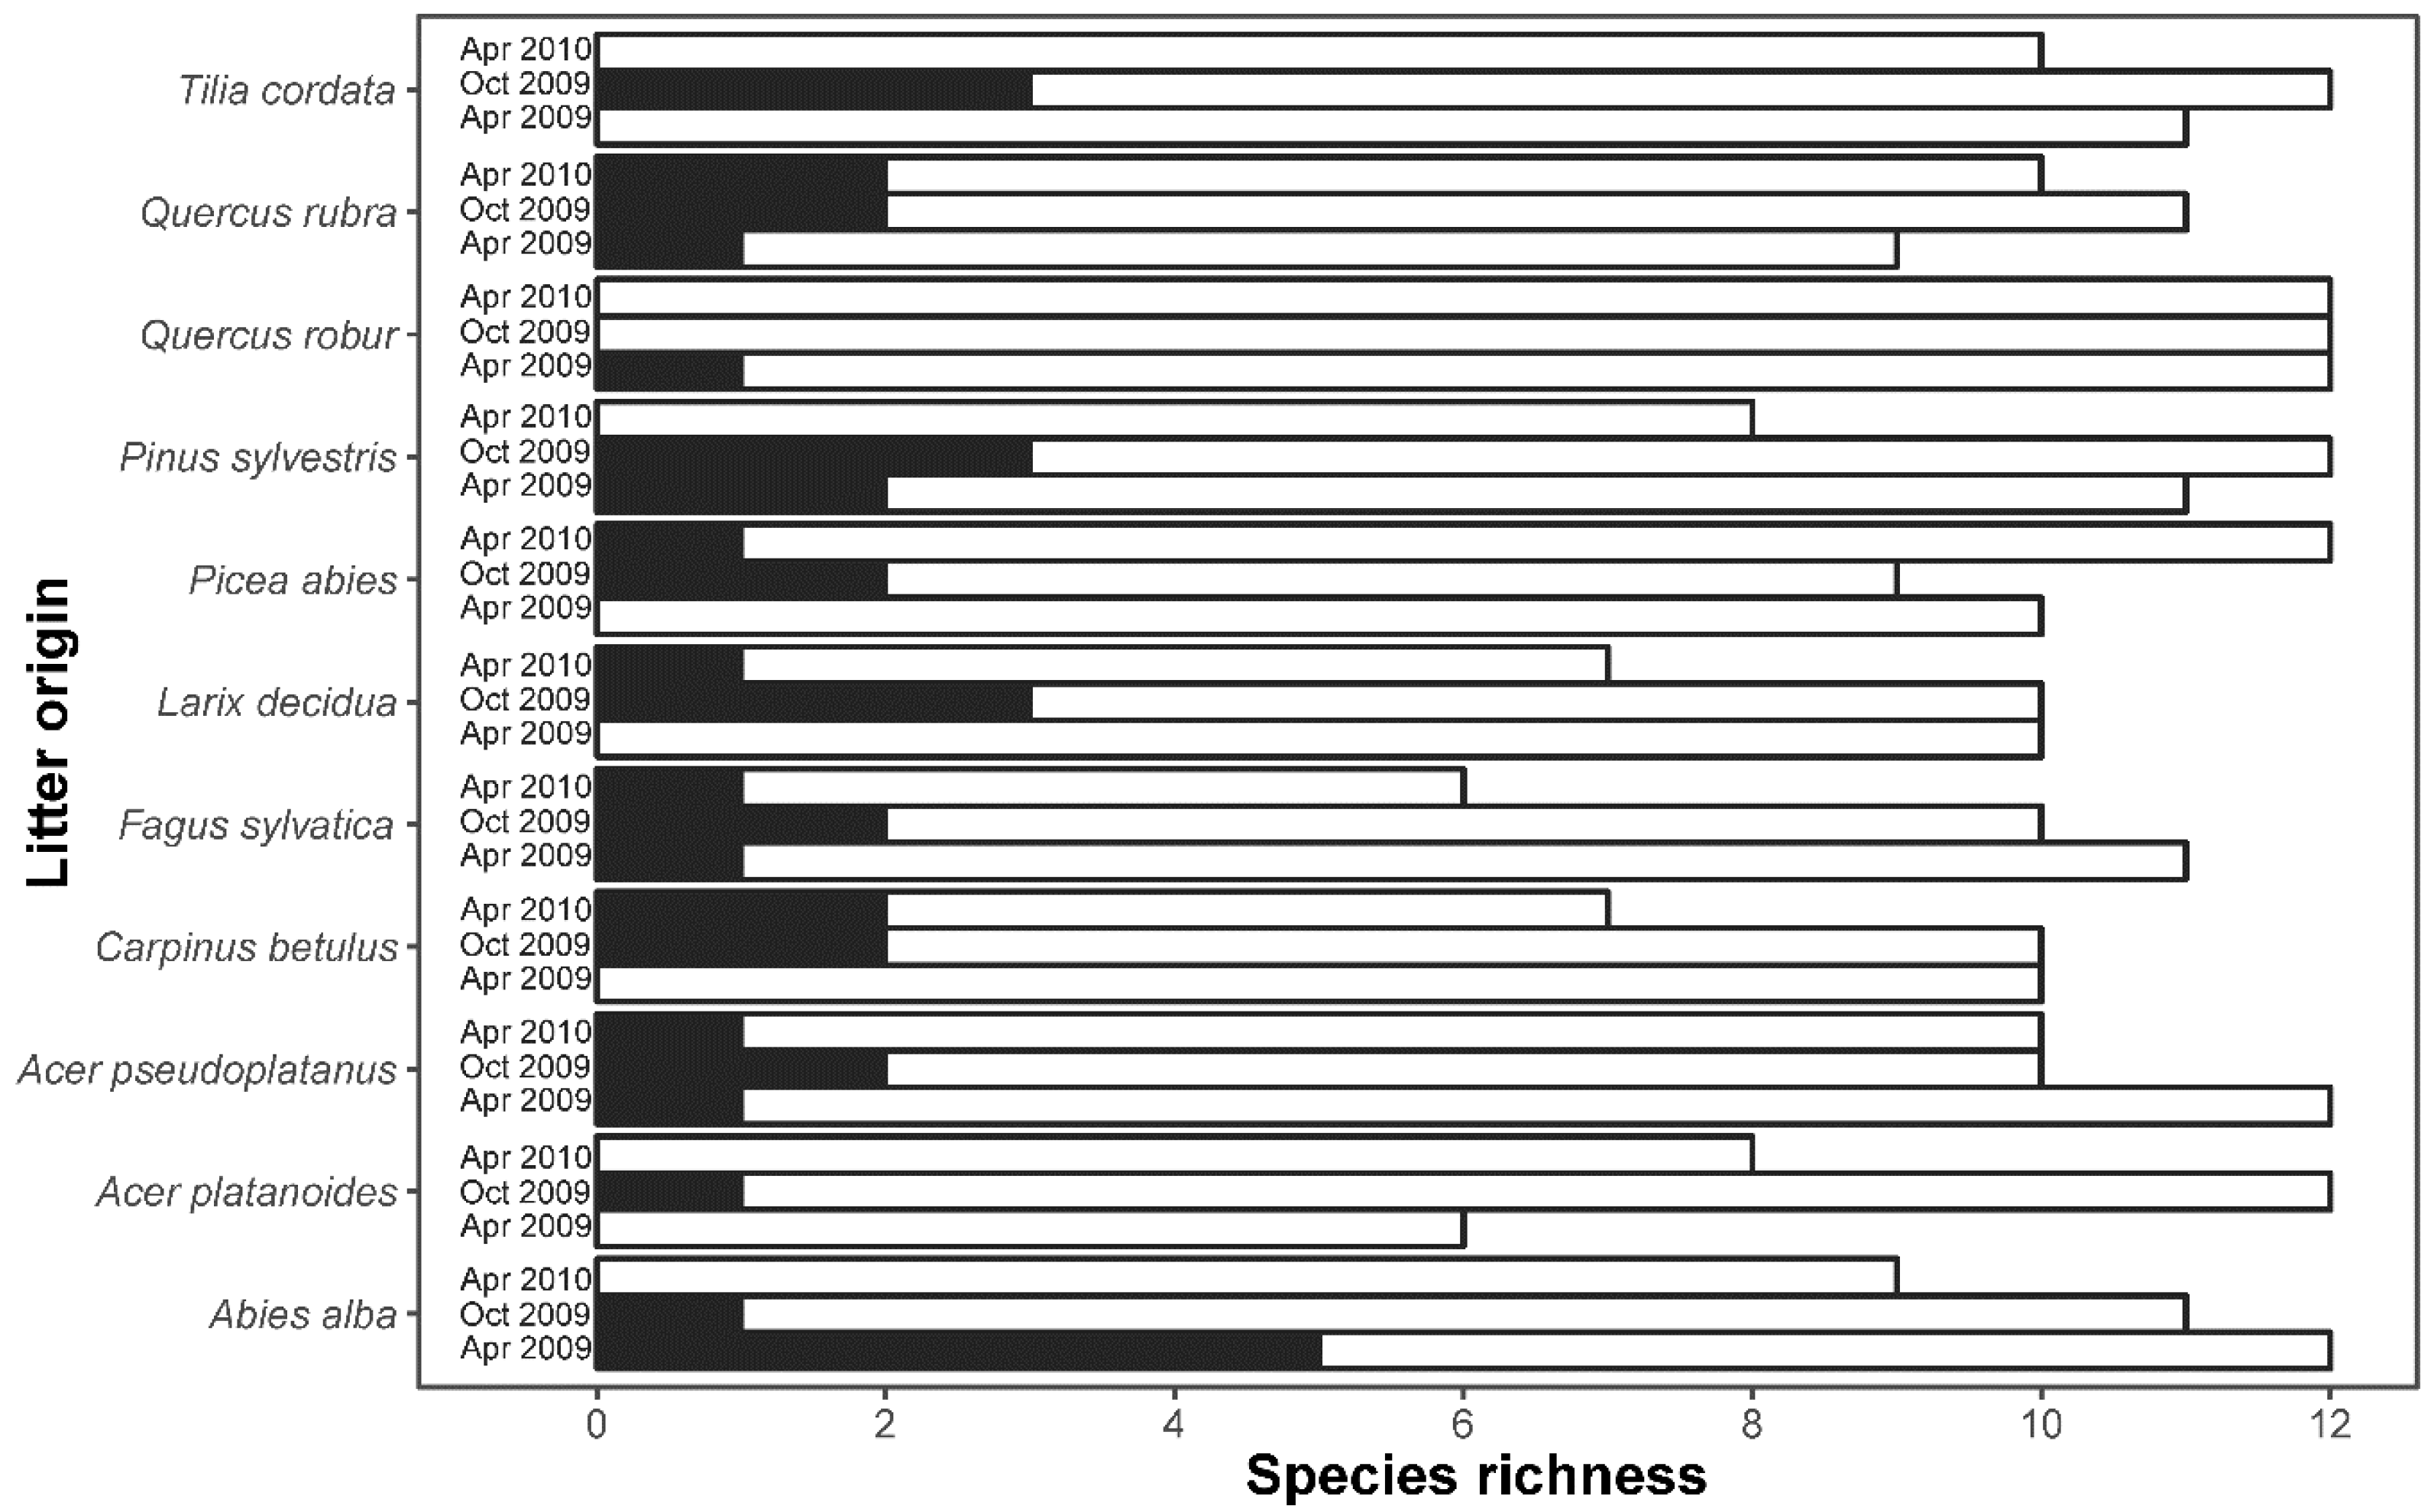
3.1. Mite Abundance, Species Richness, and Diversity

In total, 7887 mites were identified and classified into 31 species (Table A2 in Appendix A). The total abundance differed among the sampling dates and also between the soil samples (698 mites) and litterbags (7189 mites in total). The highest total abundance (4326 mites) was recorded in April 2009, six months after the beginning of the experiment; it then decreased from October 2009 (1524) to April 2010 (1339). All collected mites from litterbags represented two suborders: Gamasina (eight families; 6903 individuals (=ind.)) and Uropodina (two families; 286 ind.). Overall, the most abundant families were Zerconidae (3016 mites), Parasitidae (2399), Veigaiidae (1383) and Trachytidae (274). Moreover, among all recorded species, the most abundant were Zercon peltatus (41.80% of all mites), Veigaia nemorensis (18.68), Paragamasus jugincola (Athias-Henriot) (11.52) and Vulgarogamasus kraepelini (Berlese) (9.63) as well as P. runcatellus (Berlese) (6.01). Our study revealed that proportional abundance of the most abundant species changed in time. In April 2009, Z. peltatus reached the proportional abundance of 61.63% of all collected mites, then it decreased in October 2009 to 1.57% and increased in April 2010 to 23.53%. Additionally, the proportional abundance of V. nemorensis reached 9.27% of all mites in April 2009; then it increased to 42.19% in October 2009 and decreased to 22.33% in the next spring (April 2010).
Analysis of the soil cores taken at the time the experiment began revealed that mean species richness of mites per plot was 14.7 ± 0.3, species diversity was H’ = 1.950 ± 0.167 and mite abundance was 9.3 ± 2.4 ind. sample−1. In general, species richness and diversity in litter samples were much lower than in the soil mite pool (Figure 1). Mean mite abundance depended statistically significantly on collection date and litter origin (Table 1; AIC = 1116.7, AIC0 = 1984.2). The highest abundance was found in the P. sylvestris and A. alba litter, while the lowest was in A. platanoides. Abundances were statistically significantly higher in April 2009 than at other collection times. Mean species richness of mites depended on collection date and decomposition constant (Table 1; AIC = 428.6, AIC0 = 433.3). Species richness was the highest in April 2009, while the lowest was in April 2010. Additionally, species richness in October 2009 did not differ statistically significantly from other dates. Although statistically not significant, mite species richness was negatively correlated with decomposition constant k. Species diversity of mites was the best explained by the model with decomposition constant only (Table 1; AIC = 76.9, AIC0 = 77.0); however, influence of decomposition constant was statistically insignificant.
RDA of soil mite communities in litterbags (Figure 2) revealed that 89.8% of explained variability was connected with unconstrained factors (i.e., species composition), while constrained factors (i.e., environmental constraints and collection date) explained 10.2%. Constraining by collection date was the only factor in the most parsimonious models—litter type and decomposition constant were not included and not significant. Points representing mite communities sampled in April 2009 and 2010 were separated from plots from October 2009 along the RDA2 axis, while samples from April 2009 were separated from others along RDA1. We did not observe patterns connected with litter origin, except clustering of coniferous species in positive values of RDA1 and RDA2. Zercon peltatus C.L. Koch was connected with the April 2009 sampling date while Veigaia nemorensis C.L. Koch was connected with October 2009.

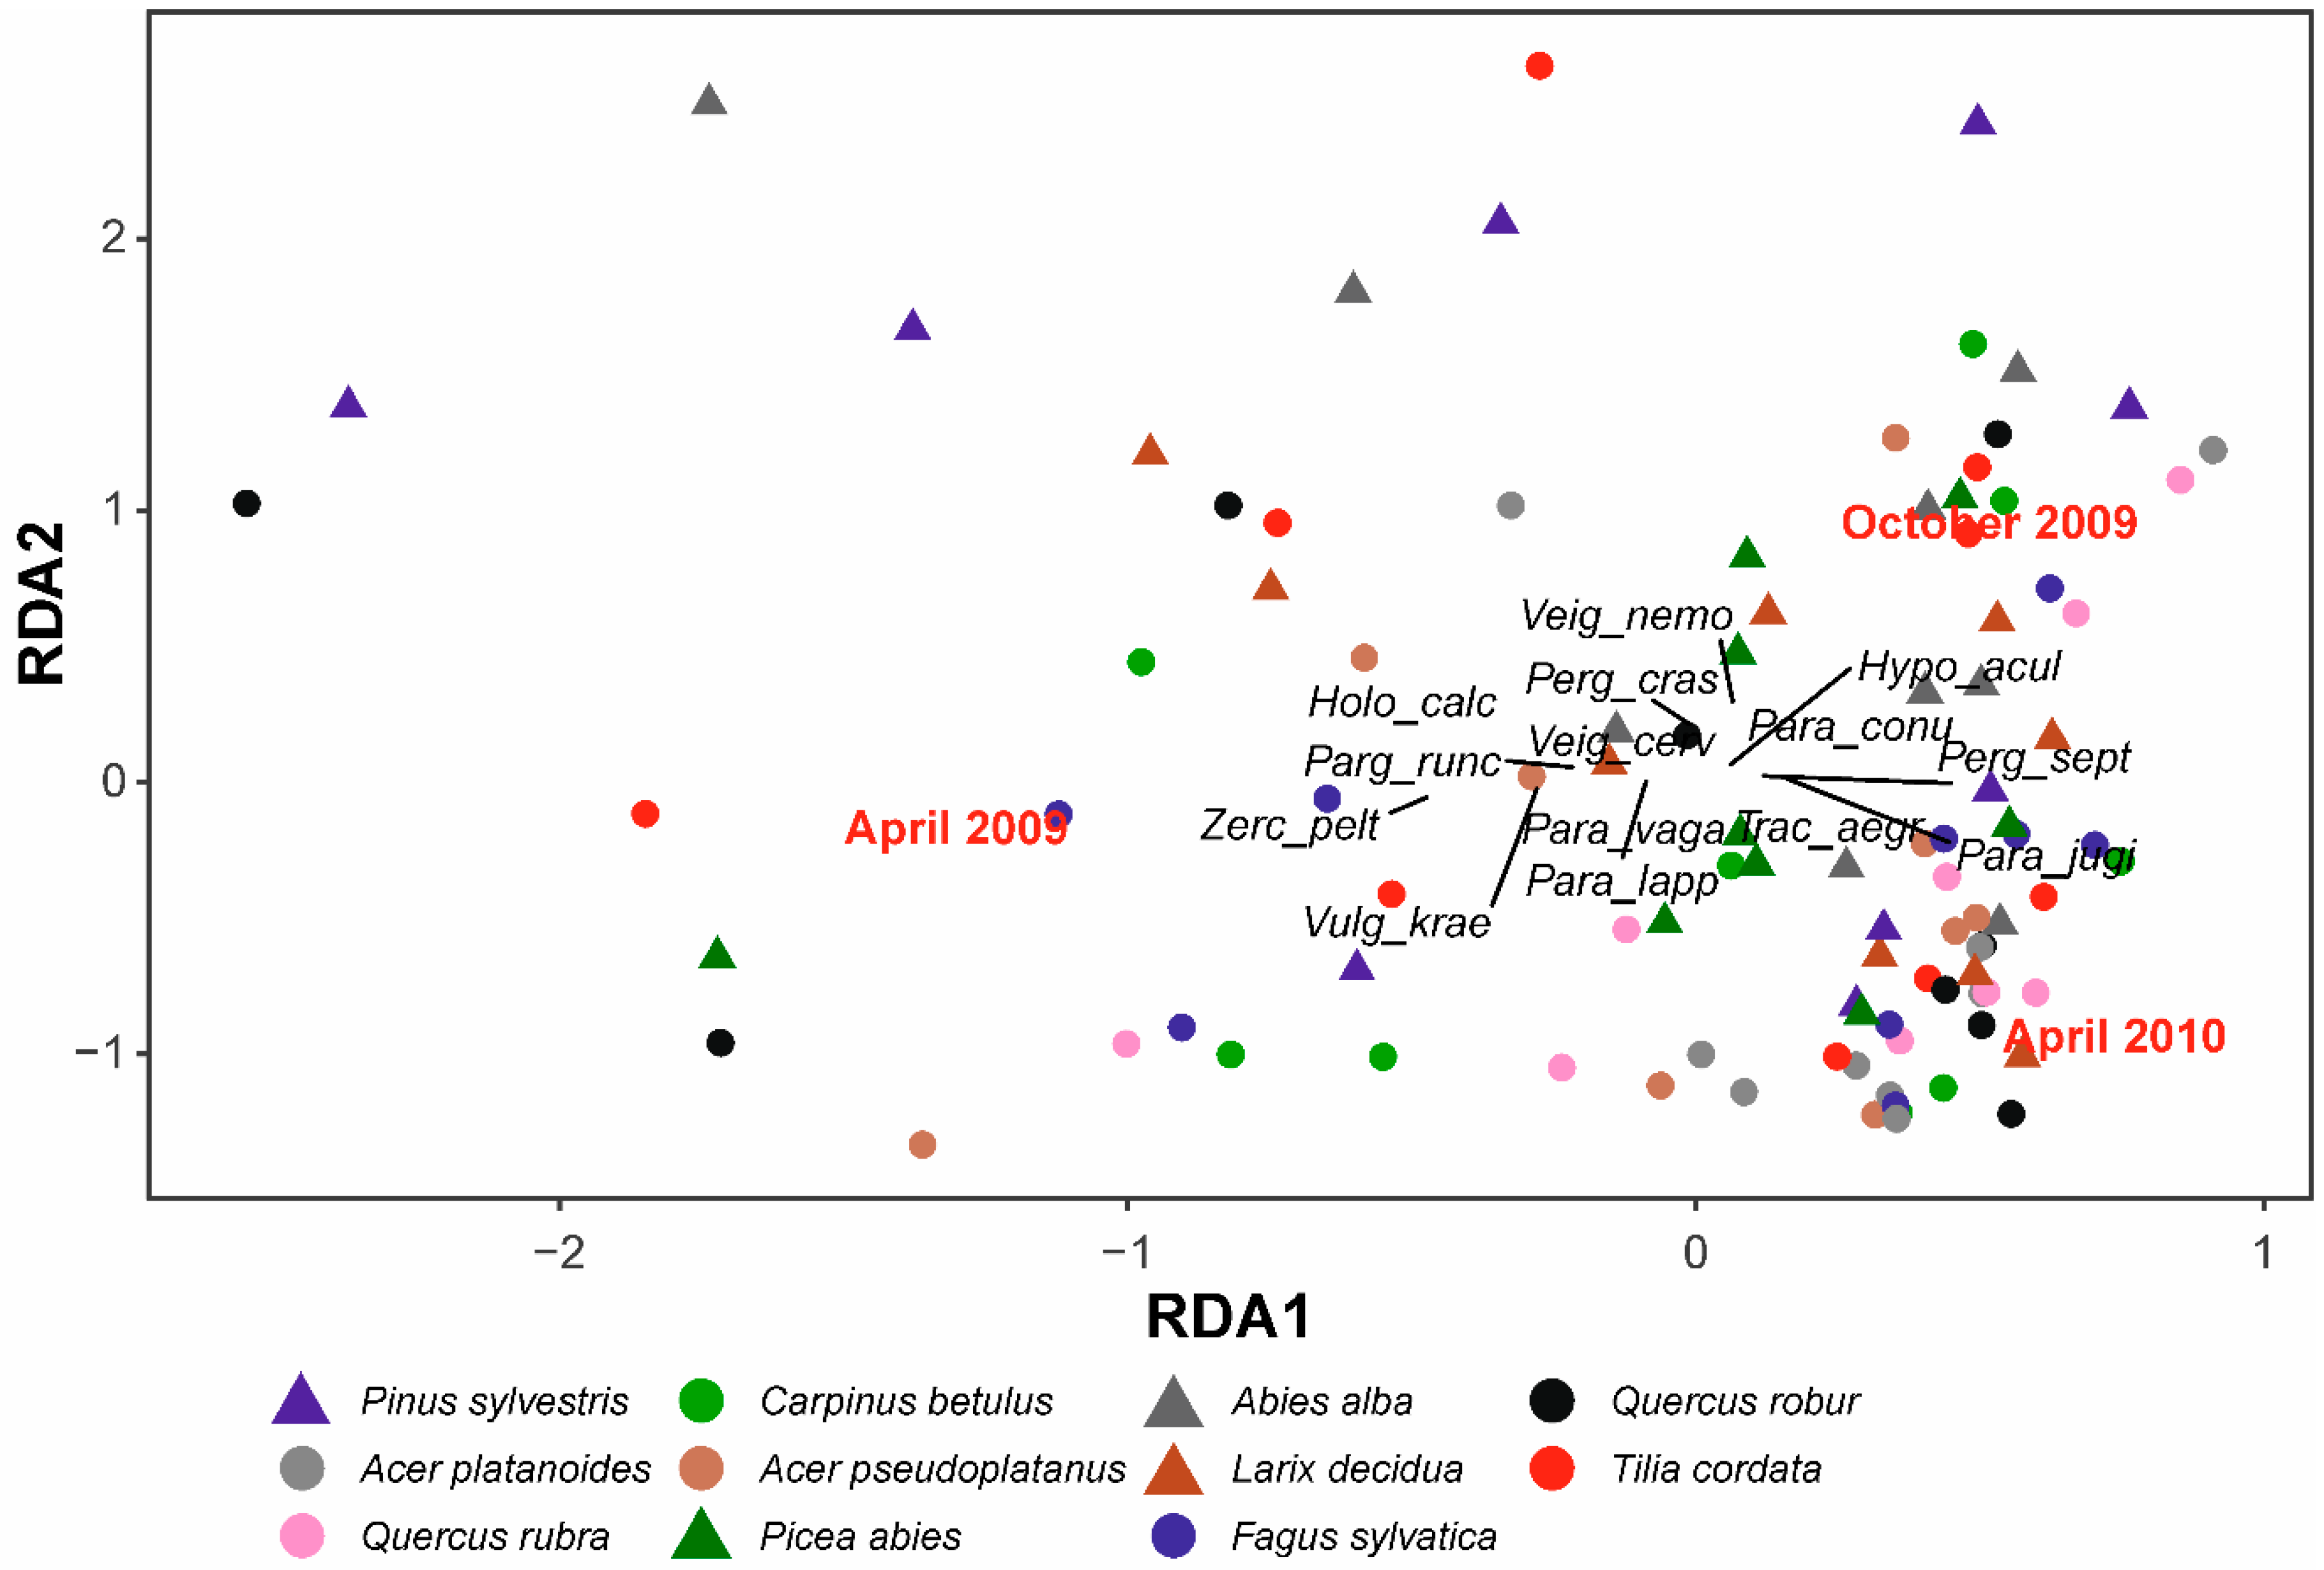
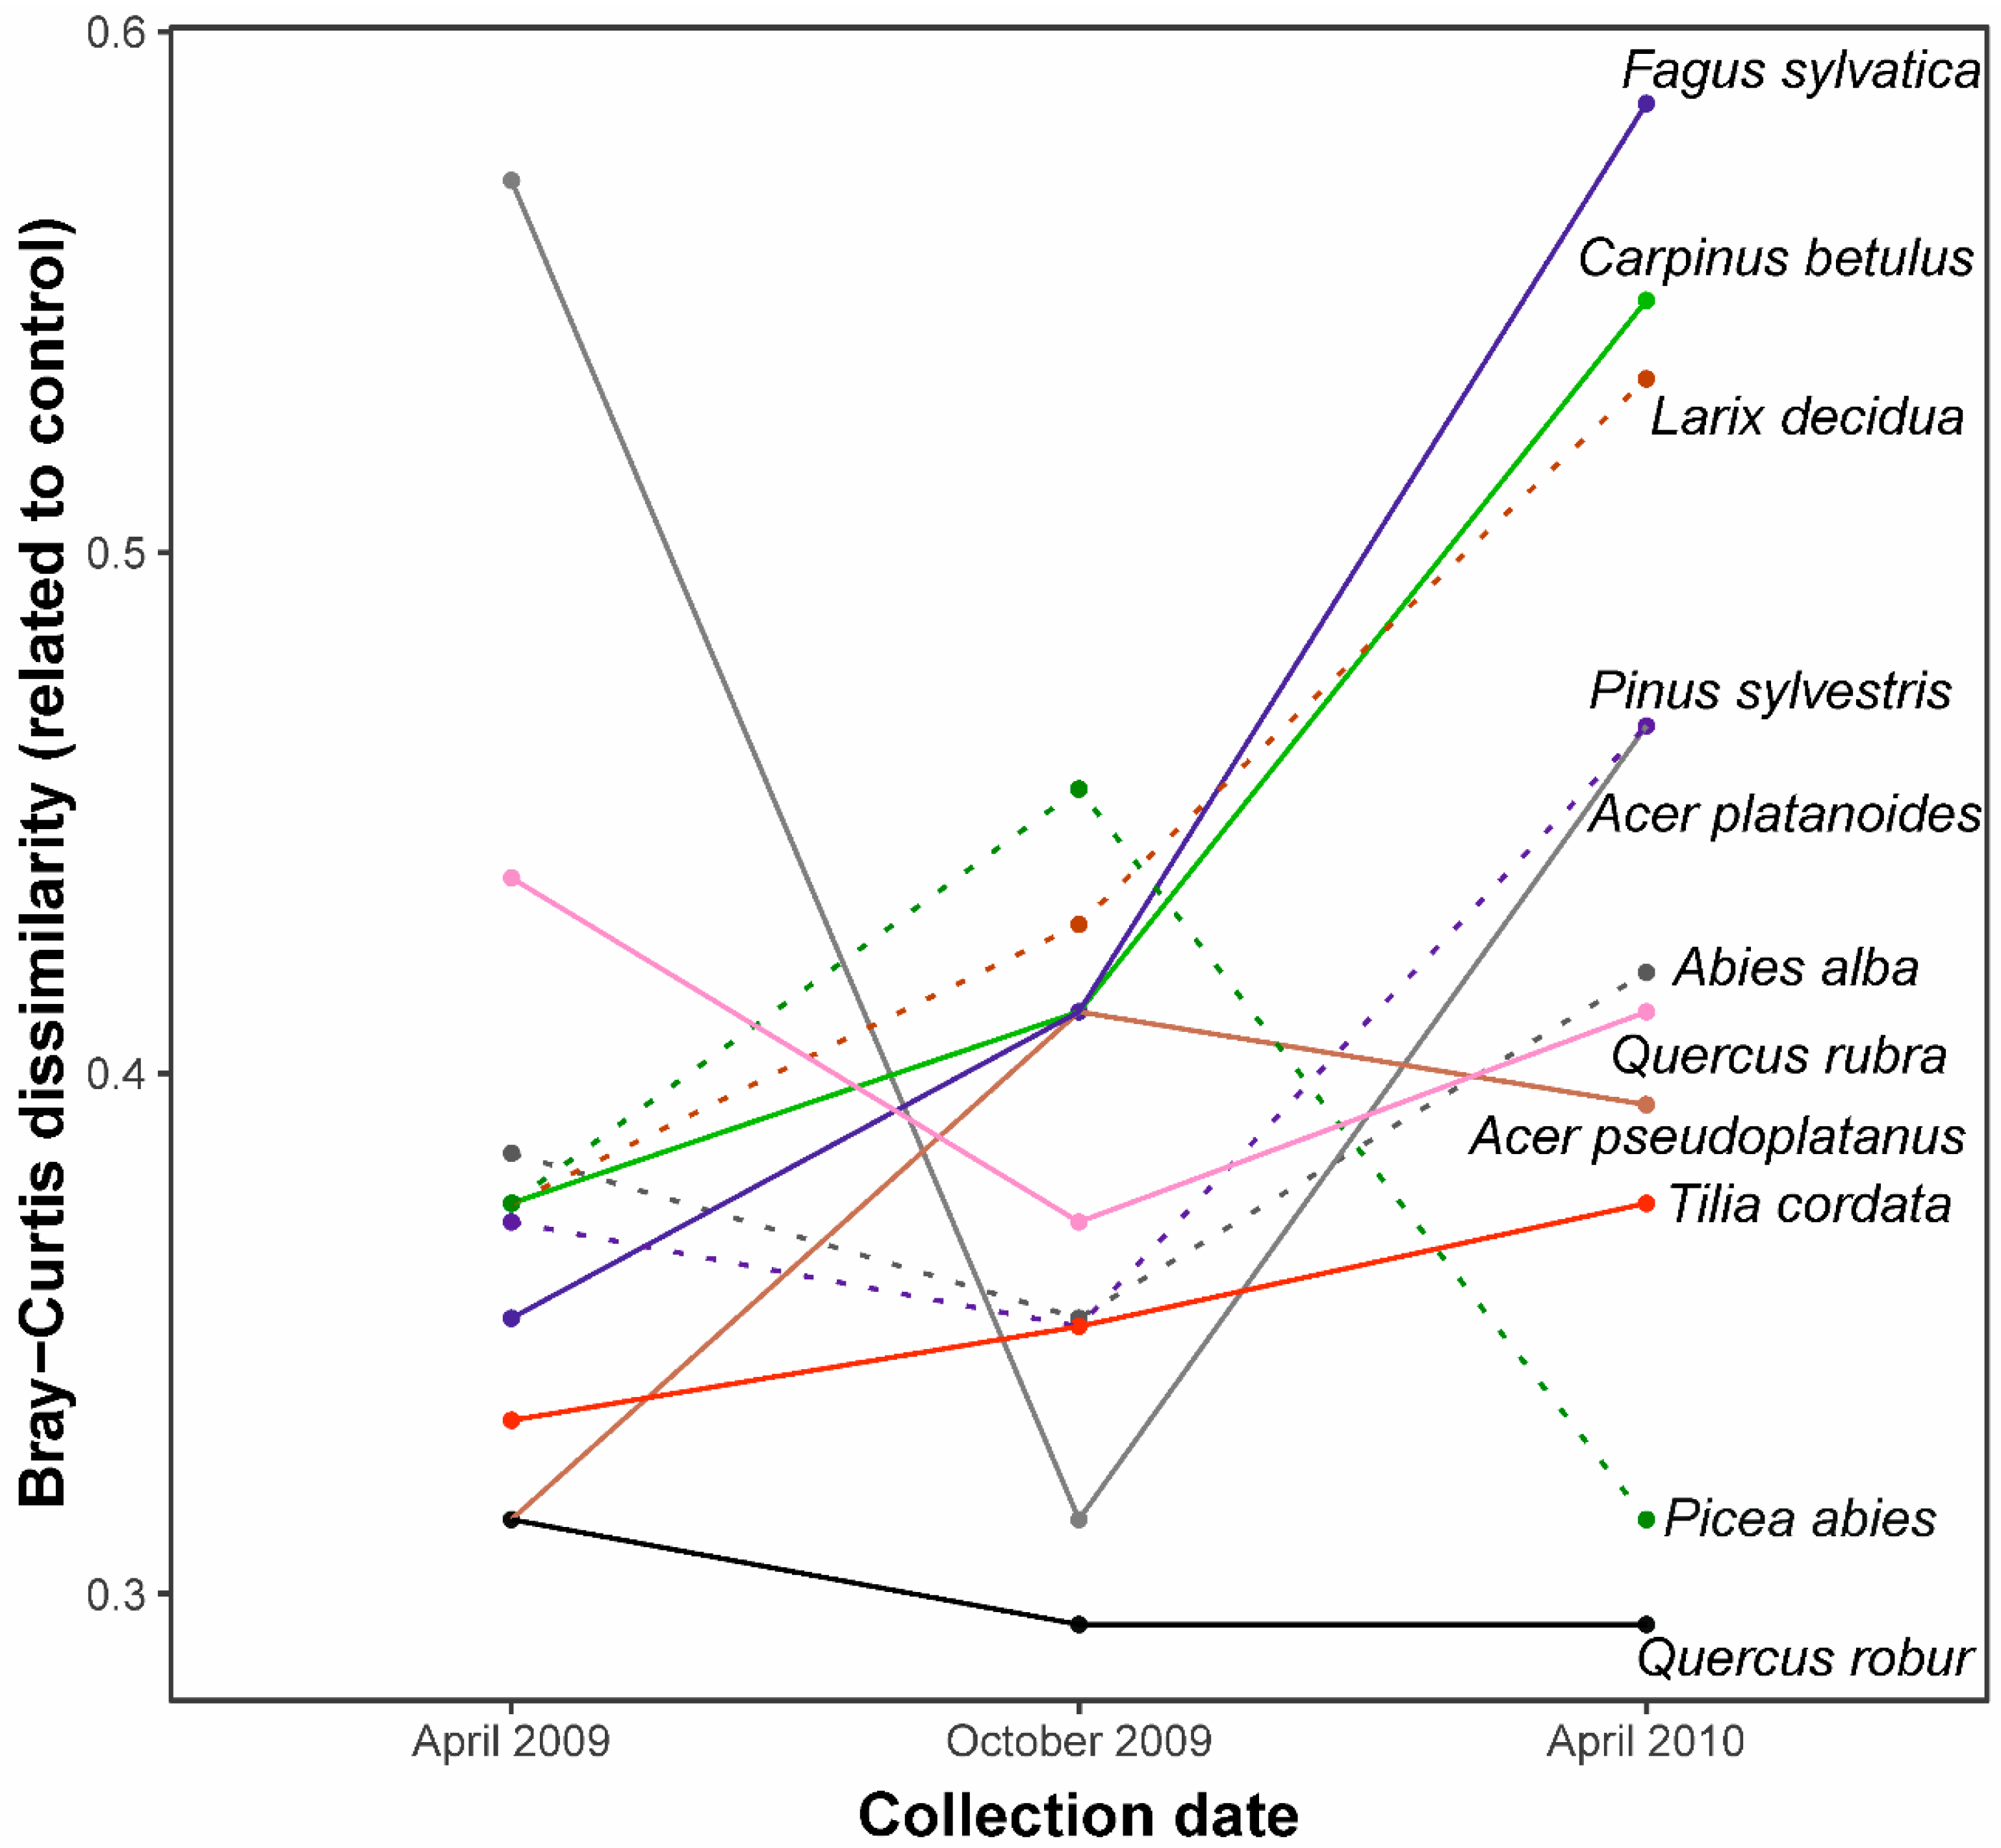
3.2. Similarity between Litterbag and Soil Mite Pool Community

At the time of experiment setup, the soil mite community included 22 species (Table A2 in Appendix A). Analysis of community dissimilarity to the initial species pool revealed that mite communities in litter of three tree species was the most distinct from the initial soil mite pool community (Figure 3): F. sylvatica, C. betulus, and L. decidua. A similar level of dissimilarity was found after six months in the case of A. platanoides. Most of the species increased their dissimilarity to the control during the experiment, but to lower degrees, reaching dissimilarity indices between 0.29 (Q. robur) and 0.46 (P. sylvestris). However, most of the species occurring in the litter studied were the same as in soil; species not recorded during the control were rare, and we did not identify any pattern of their richness during litter decomposition (Figure 4).

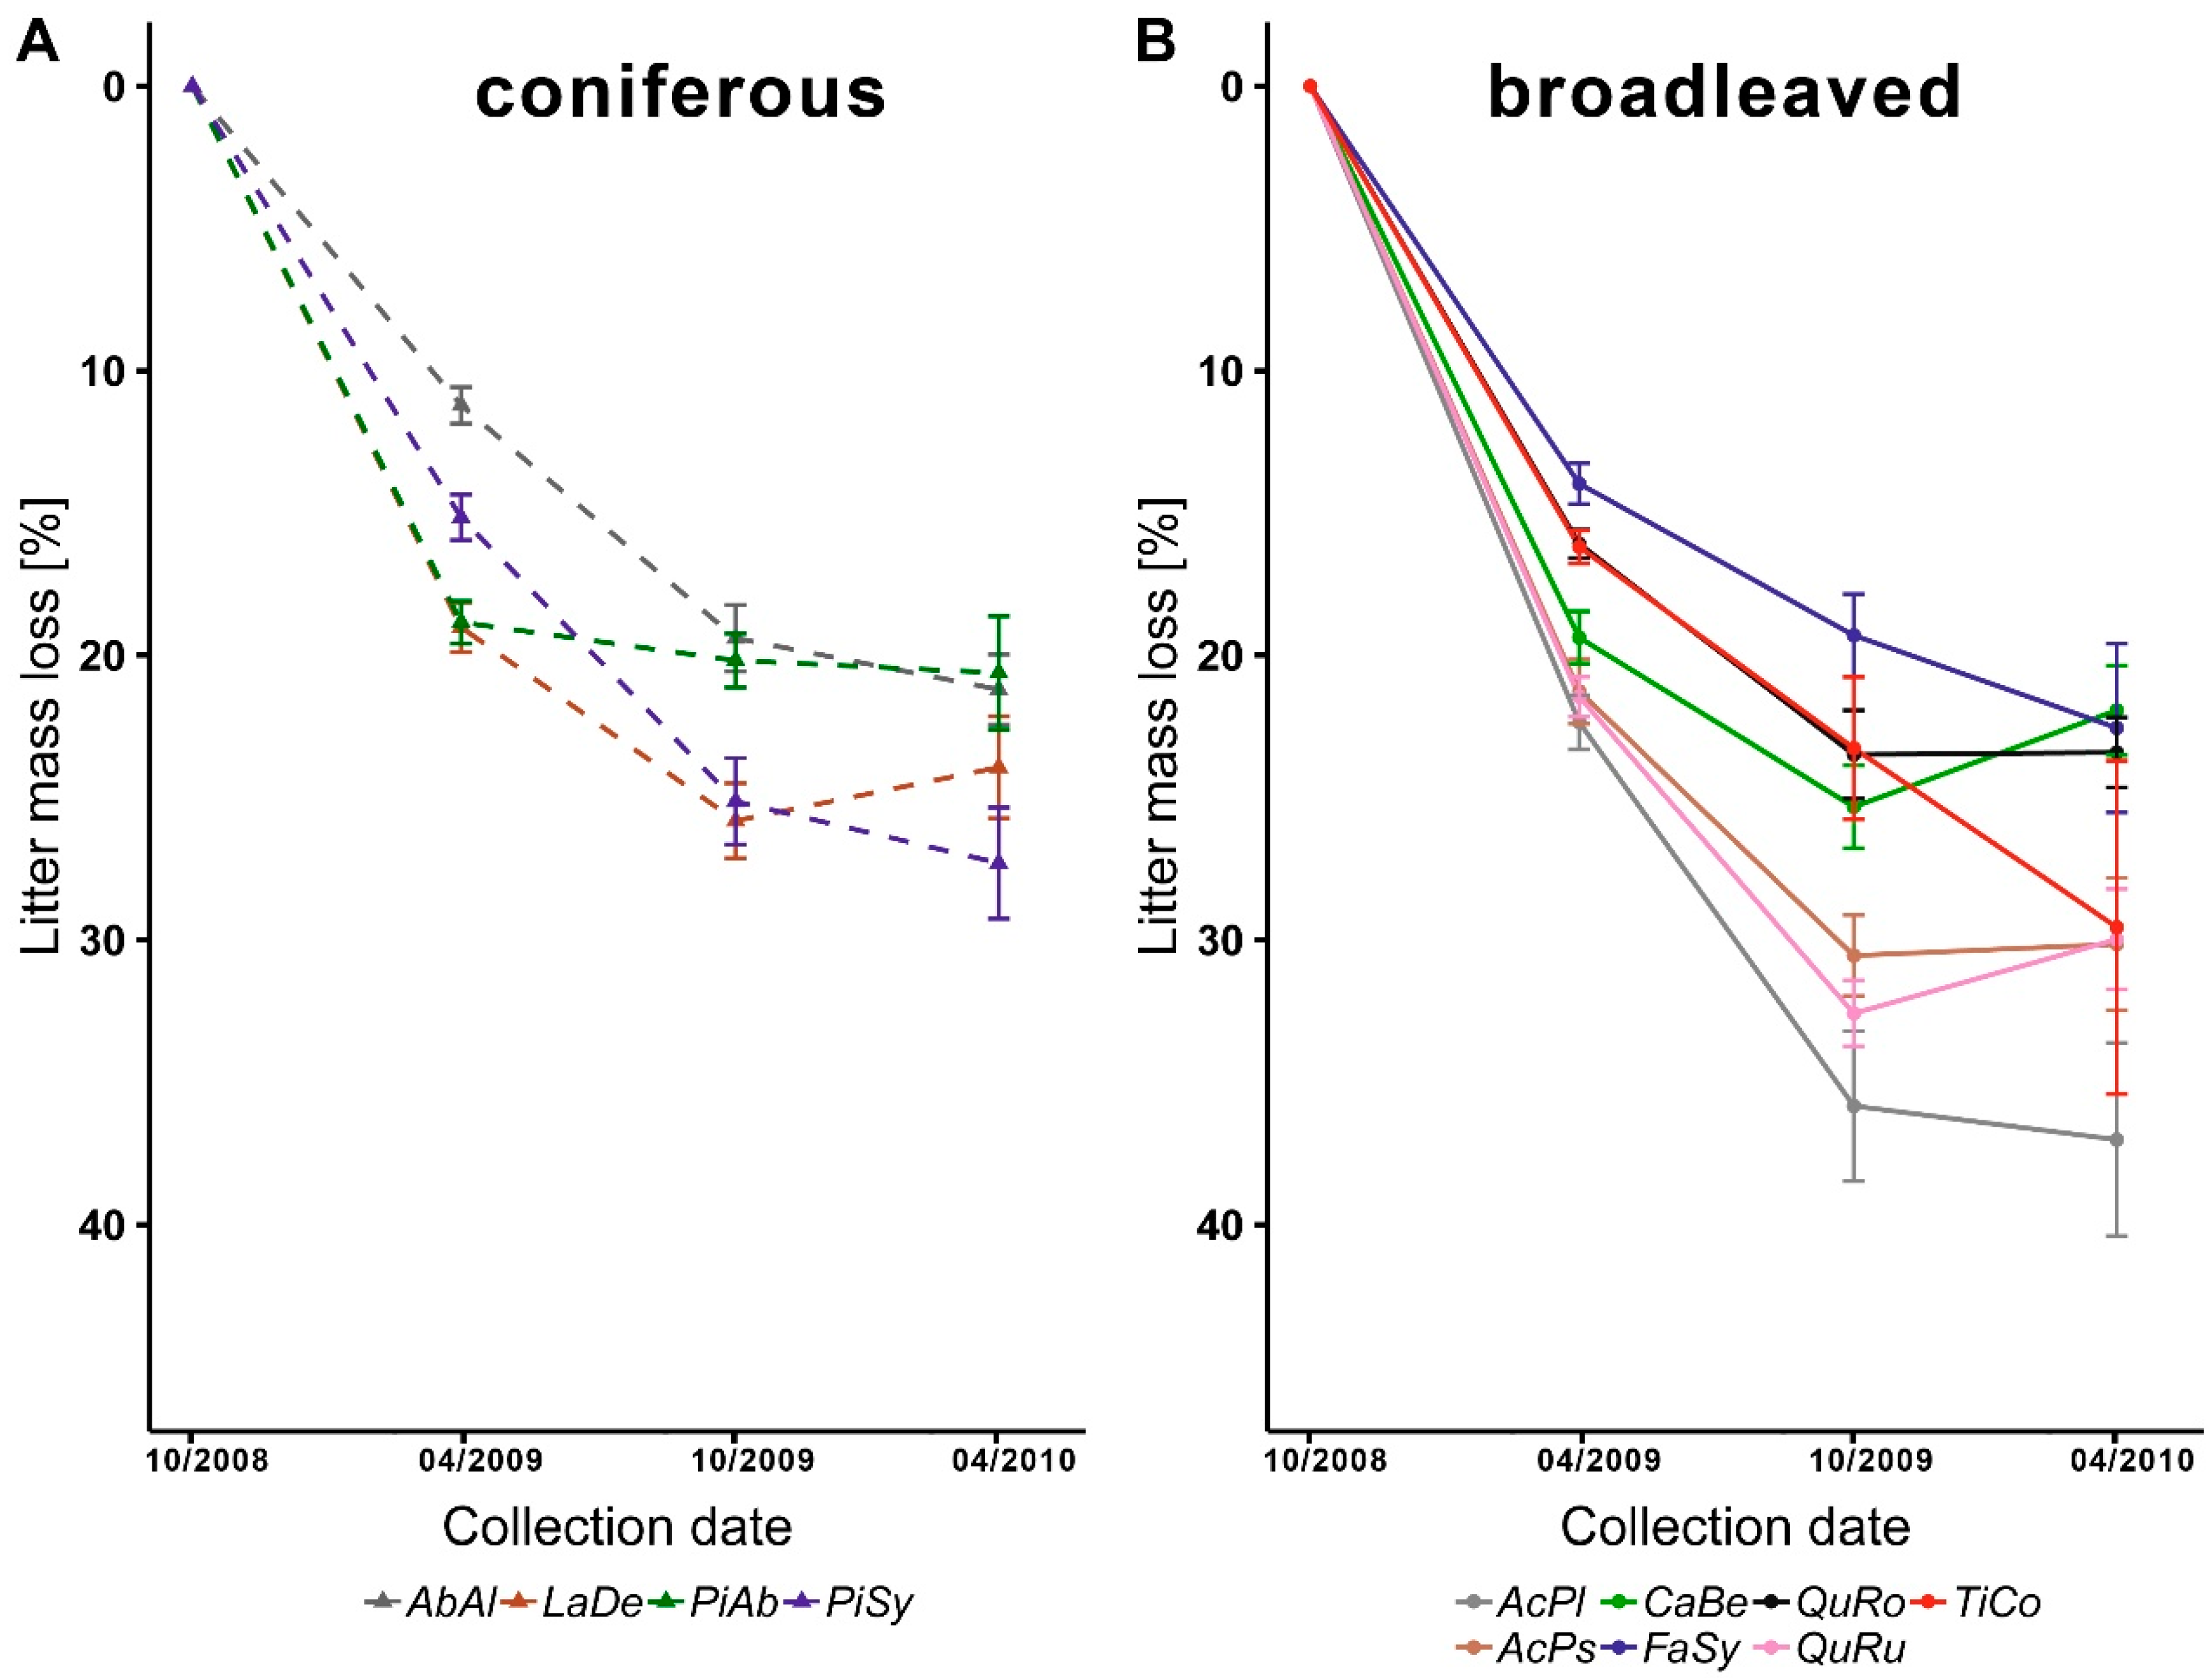
3.3. Litter Decomposition

Generally, tree species differed in the litter mass loss (df = 10, F = 10.3829, p < 0.0001) (Figure 5). Among coniferous species the lowest litter mass loss was recorded for A. alba (21.21%) and P. abies (20.62) after 18 months, with the highest for P. sylvestris (27.31). Moreover, litter of A. alba decomposed the slowest among conifers studied in April (11.22%) and October 2009 (19.4). Among broadleaved species, the lowest litter mass loss was recorded for C. betulus (21.94%) and F. sylvatica (22.56), whereas the highest for A. platanoides (37.01) in April 2010. Similarly, among all broadleaved species studied the lowest litter mass loss was recorded for F. sylvatica in April 2009 (13.97%) and October 2009 (19.3).

4. Discussion

Neither species richness nor diversity, but rather mite abundance, was affected by the tree species (litter quality). The mite communities were similarly comprised for both high- and low-quality litter, and the mite abundance decreased during the decomposition process in nutrient-poor Scots pine forests. Moreover, few mite species benefited from the decomposed litter.
The highest decomposition rates were recorded for broadleaved Acer platanoides (k = 0.37 per year), Q. rubra (0.31), A. pseudoplatanus (0.30), whereas the lowest were noted for coniferous A. alba (0.18), P. abies (0.20) and broadleaved F. sylvatica (0.19). Similar patterns were recorded by Hobbie et al. [34], who proved slower decay rates for L. decidua, A. alba and F. sylvatica and higher for C. betulus, Q. rubra and Acer spp. (ca. 500 m from our study site). Our results are also partly in line with Horodecki and Jagodziński [49] and Horodecki et al. [28], who recorded lower decomposition rates for litter of F. sylvatica and Q. rubra in Scots pine stands, but higher rates in mixed stands. Studies on Quercus prinus litter demonstrated that the leaves ‘disappeared’ slowly and that there was minimal faunal influence on decomposition rates [50]. On the other hand, the large increase in colonization of litterbags in the second year did not change the effect of microarthropods on decomposition rates, which remained similar in both years [27]. The studies of Heneghan et al. [23] on the decomposition of Q. prinus indicated that microarthropod assemblages did not influence litter mass loss in temperate forest sites.
Our study indicated that the litter quality (litter origin) of various tree species affected only the mite abundances. This is in contrast to Mueller et al. [25], who found that many environmental factors (e.g., light availability, soil properties or nutrient availability), including litter and tree species affected species richness of many invertebrate groups, and that the response of the animal group can be taxon specific. Therefore, our results can suggest that the input of the high-quality litter in the nutrient-poor Scots pine forests do not affect the species richness, and that it only support some of the mite species, that inhabit the soil for a longer time. This result is in line with studies of Gergócs and Hufnagel [32], who indicated that litter type affects the mesofauna and microbiota abundance and the relationships between these two animal groups. Similarly, Gonzáles et al. [22] recorded three times higher mite (Oribatida) density in aspen (Populus tremuloides Michx.) than in lodgepole pine (Pinus contorta Douglas ex Loudon) litter. On the other hand, faunal abundance was not correlated with mass loss in single-species litter of Quercus serrata Murray and Pinus densiflora Sieb. et Zucc. [51]. The litter did not impact the density of microinvertebrates, macroinvertebrates, and predators in Quercus gambelli Nutt. and Cecropia scheberiana Miq. litterbags [52]. Moreover, Gergócs et al. [53] recorded similar Oribatida abundance in oak (Quercus cerris L.) and pine (P. sylvestris) litter but abundance was reduced by one third in black locust (Robinia pseudoacacia L.) litter. Differences in Mesostigmata mite abundances were also recorded between oak (Q. robur) and silver birch (Betula pendula Roth.), Scots pine (P. sylvestris) and alder (Alnus glutinosa (L.) Gaertn.) [12]. Urbanowski et al. [12] found ca. 25% higher abundance in oak litter, when compared to all other litter types. In the present study, the difference of mite abundance between oak and Scots pine litter was low (ca. 6% of the abundance in Scots pine litter), which may indicate that high-quality litter similarly affects mite assemblages as ‘native’ litter in coniferous monocultures.
Our study revealed that the mean species richness and diversity did not depend on litter quality. Similar results were obtained for Oribatida by Gergócs et al. [53], who indicated that oak (Q. cerris) and pine (P. sylvestris) litter are equally favorable for mites, but both differed from black locust (R. pseudoacacia). We have not analyzed R. pseudoacacia litter; however, other tree species that were used in the present study had similar characteristic (e.g., Q. robur, C. betulus or T. cordata) and mite species richness did not differ. It is difficult to discuss the species richness of Mesostigmata, because only a few studies have focused on these animals in decomposed litter in litterbags. Previous studies, conducted in reclaimed spoil heap and adjacent forest habitats, indicated that species richness was higher in forest habitats, compared to spoil heap [12]. Moreover, litter type impacts on species richness were found, with significantly higher species richness recorded from oak litter, lower richness from pine and alder and the lowest from silver birch. In contrast, species richness did not differ between oak and pine litter in the present study.
Although the relationships between the litter decomposition and soil microarthropods have been widely studied [54], little is known about the changes in Mesostigmata mite communities in the short term. Repeated measurements of litter mass loss and fauna extraction allow checking whether the changes in species number and abundance in decomposed litter is successional, as has been proposed by Usher [55], seasonal or driven by abiotic factors [24]. Interestingly, our study revealed that the mean species richness in the ‘soil mite pool’ was higher than in the decomposed litter, regardless of tree species. We found that five mite species, i.e., Paragamasus jugincola, P. runcatellus, Z. peltatus, Rhodacarus coronatus, and V. nemorensis, reached high proportional abundances, which may indicate that only some species among the ‘soil mite pool’ benefit from the litter in early stages of decomposition. Some of them, such as Zerconidae or Veigaiidae, represent the K-selected traits with slow development and low dispersal, which are associated with forests [56]. This is in line with Urbanowski et al. [12], who reported a high proportional abundance of Z. peltatus within six months in a silver birch forest. Our study indicated that the same mite species dominated the mite community in the litterbags in pooled data; however, their abundance changed slightly. For instance, the nematophagous Z. peltatus, which occupied the soil in modest numbers (10% of mites), dominated in the litter (42%). Interestingly, the density of this species peaked at 62% in April 2009. This may suggest the pattern of mite community succession in nutrient-poor Scots pine forests, associated with the availability of nematodes or springtails. These animals are a food source for predatory Mesostigmata [15,57]. This can be explained by the high density of nematophagous Z. peltatus [58]. In the present study, the total mite abundance rapidly decreased with sampling dates, especially from April to October 2009, indicating that the availability of the niches changed during the decomposition process. The limiting effect of forest floor litter on soil mites may be determined not by the volume, but rather the quality of food and habitat source [59], and by the fact that plant material of high quality, such as used in our study, is immediately decomposed and utilized by soil fauna. This result is supported by the RDA analysis that revealed the differences between the mite communities in April 2009 and both October 2009 and April 2010 (Figure 2). Our study also indicated the importance of time in the early stages of litter decomposition for mite abundance.

5. Conclusions

Our study indicated that neither species richness nor diversity, but rather the abundance of Mesostigmata mites, was affected by the litter quality added to nutrient-poor Scots pine forests. Moreover, only some species from the ‘soil mite pool’ colonized the litter, regardless of its quality, and the abundance of few taxa increased rapidly after six months of decomposition. Additionally, litter of various tree species was inhabited mainly by eu- and hemiedaphic mite species. Mite assemblages in A. alba, P. sylvestris, and Q. robur litter had higher abundances. Exposition time seems to be an important driver in shaping the mite community during the early stages of litter decomposition. The impact of the tree species on Mesostigmata species richness and biodiversity depend on many environmental predictors, which are associated with the certain tree species [25]. Our result also highlights the crucial role of tree species and its’ environment for the soil fauna, although in early stages of decomposition the changes are reflected in the abundance. This highlights the residence times of broadleaved trees in forest ecosystem, which allow development of their own soil fauna communities. For that reason, broadleaved admixtures in coniferous monocultures are especially important in shaping soil mite biodiversity.

Author Contributions

Conceptualization, A.M.J. and J.K.; Methodology, A.M.J. and J.K.; Software, A.M.J., J.K., M.K.D. and P.H.; Validation, J.K., A.M.J., M.K.D. and P.H.; Formal Analysis, J.K., M.K.D., A.M.J. and P.H.; Investigation, J.K., A.M.J., P.H. and M.K.D.; Resources, J.K., A.M.J., P.H. and M.K.D.; Data Curation, J.K., A.M.J., P.H. and M.K.D.; Writing—Original Draft Preparation, J.K., A.M.J., M.K.D. and P.H.; Writing—Review & Editing, J.K., A.M.J., M.K.D. and P.H.; Visualization, J.K., P.H., M.K.D. and A.M.J.; Supervision, J.K. and A.M.J.; Project Administration: A.M.J. and J.K.; Funding Acquisition: A.M.J. and J.K.

Funding

The study was financially supported by the Institute of Dendrology, Polish Academy of Sciences, Kórnik, Poland, and Faculty of Forestry, Poznań University of Life Sciences, Poznań, Poland. The publication is co-financed within the framework of Ministry of Science and Higher Education programme as "Regional Initiative Excellence" in years 2019–2022, project number 005/RID/2018/19.

Acknowledgments

The authors would like to thank Katarzyna Strzymińska, Bartosz Bartków, Jakub Szeptun, Daniel Szemis for their assistance in laboratory works. We kindly thank Lee E. Frelich (University of Minnesota, Centre for Forest Ecology, USA) for linguistic support. The study was financially supported by the Institute of Dendrology, Polish Academy of Sciences, Kórnik, Poland.

Conflicts of Interest

The authors declare no conflict of interests.

Appendix A

Table A1. Monthly mean temperatures and precipitation sums recorded during the experiment in Biadaszki Forest Experimental Station (ca. 1 km from study site). Setup and collection dates are marked by * and **, respectivelly.
Month and YearMean Temperature [°C]Precipitation Sum [mm]
October 2008 *8.346.9
November 20084.935.7
December 20080.825.2
January 2009−3.511.5
February 2009−1.320.1
March 20093.514.8
April 2009 **12.09.4
May 200913.696.5
June 200915.3169.3
July 200919.4224.6
August 200919.084.3
September 200915.156.9
October 2009 **6.9146.6
November 20095.666.4
December 2009−0.882.3
January 2010−6.661.3
February 2010−1.622.9
March 20103.450.7
April 2010 **8.770.7
Table A2. Checklist of mite species recorded from soil samples and litterbags with leaf litter of 11 tree species in Scots pine forests. Symbols indicate: “+”—abundance 1–9 ind., “++”—10–99 ind., “+++”—>100 ind. (number of individuals in litterbags were summed from three dates of mite collection).
No.Mite SpeciesSoil PoolLitterbags with Various Litter Types
Abies albaAcer platanoidesAcer pseudoplatanusCarpinus betulusFagus sylvaticaLarix deciduaPicea abiesPinus sylvestrisQuercus roburQuercus rubraTilia cordata
1Alliphis halleri (G. & R. Canestrini, 1881)----------+-
2Amblyseius sp.+------+-+--
3Arctoseius cetratus (Sellnick, 1940)-----------+
4Arctoseius semiscissus (Berlese, 1892)--------+---
5Asca aphidioides (Linnaeus, 1758)-+-++++-+-++
6Gamasellodes bicolor Berlese, 1918++-----++-++
7Holoparasitus calcaratus (C.L. Koch, 1839)+++++++++++-+
8Hypoaspis aculeifer (Canestrini, 1883)++++++++++-+
9Hypoaspis praesternalis Willmann, 1949-+----------
10Hypoaspis procera Karg 1965-+-----++---
11Hypoaspis vacua (Michael, 1891)-+--+-++---+-
12Laelapsis astronomica (Koch, 1839)-+----------
13Oodinychus ovalis C.L. Koch, 1839+---+----+++
14Paragamasus conus Karg, 1971++++++++++++++++++++++
15Paragamasus jugincola (Athas-Henriot, 1967)+++++++++++++++++++++++++++
16Paragamasus lapponicus Tragardh, 1910++++++-++++--
17Paragamasus vagabundus (Karg, 1968)++++++++++++++++
18Pargamasus runcatellus (Berlese, 1903)+++++++++++++++++++++++++
19Pergamasus crassipes Linnaeus, 1758++++++++++-+
20Pergamasus mediocris Berlese, 1904+----------+
21Pergamasus septentrionalis Oudemans, 1902-+++++++++++
22Rhodacarellus silesiacus Willmann, 1936+-------+---
23Rhodacarus coronatus Berlese, 1921++-+---+--+++
24Trachytes aegrota (C. L. Koch, 1841)+++++++++++++++++++++++
25Trichouropoda obscura (C.L. Koch, 1836)+-----------
26Veigaia cervus (Kramer, 1876)+++++-+++++++-
27Veigaia nemorensis (C. L. Koch, 1839)++++++++++++++++++++++++++++++++
28Vulgarogamasus kraepelini (Berlese, 1904)++++++++++++++++++++++++
29Zercon peltatus C.L. Koch, 1836++++++++++++++++++++++++++++++++++
30Zercon triangularis C.L. Koch, 1836+---++---+++
31Zercon zelawaiensis Sellnick, 1944+-----+-----

References

  1. Vanbergen, A.J.; Woodcock, B.A.; Watt, A.D.; Niemela, J. Effect of land-use heterogeneity on carabid communities at the landscape scale. Ecography 2005, 28, 3–16. [Google Scholar] [CrossRef]
  2. Hunter, M.L. Maintaining Biodiversity in Forest Ecosystems; Cambridge University Press: Cambridge, UK, 1999. [Google Scholar]
  3. Young, R.; Giese, R. Introduction to Forest Ecosystem Science and Management, 3rd ed.; Wiley: Hoboken, NJ, USA, 2003. [Google Scholar]
  4. Dyderski, M.K.; Paź, S.; Frelich, L.E.; Jagodziński, A.M. How much does climate change threaten European forest tree species distributions? Glob. Chang. Biol. 2018, 24, 1150–1163. [Google Scholar] [CrossRef]
  5. Götmark, F.; Friedman, J.; Kempe, G.; Nord, B. Broadleaved tree species in conifer-dominated forestry: Regeneration and limitation of saplings in southern Sweden. For. Ecol. Manag. 2005, 214, 142–157. [Google Scholar] [CrossRef]
  6. Alem, S.; Pavlis, J.; Urban, J.; Kucera, J. Pure and mixed plantations of Eucalyptus camaldulensis and Cupressus lusitanica: Their growth interactions and effect on diversity and density of undergrowth woody plants in relation to light. Open J. For. 2015, 5, 375. [Google Scholar]
  7. Liu, C.L.C.; Kuchma, O.; Krutovsky, K.V. Mixed-species versus monocultures in plantation forestry: Development, benefits, ecosystem services and perspectives for the future. Glob. Ecol. Conserv. 2018, 15, 1–13. [Google Scholar] [CrossRef]
  8. Migge, S.; Maraun, M.; Scheu, S.; Schaefer, M. The oribatid mite community (Acarina) of pure and mixed stands of beech (Fagus sylvatica) and spruce (Picea abies) of different age. Appl. Soil Ecol. 1998, 9, 115–121. [Google Scholar] [CrossRef]
  9. Wang, S.; Ruan, H.; Wang, B. Effects of soil microarthropods on plant litter decomposition across an elevation gradient in the Wuyi Mountains. Soil Biol. Biochem. 2009, 41, 891–897. [Google Scholar] [CrossRef]
  10. Fujii, S.; Takeda, H. Succession of soil microarthropod communities during the aboveground and belowground litter decomposition processes. Soil Biol. Biochem. 2017, 110, 95–102. [Google Scholar]
  11. Franca, M.; Sandmann, D.; Krashevska, V.; Maraun, M.; Scheu, S. Altitude and decomposition stage rather than litter origin structure soil microarthropod communities in tropical montane rainforests. Soil Biol. Biochem. 2018, 263–274. [Google Scholar]
  12. Urbanowski, C.K.; Horodecki, P.; Kamczyc, J.; Skorupski, M.; Jagodziński, A.M. Succession of mite assemblages (Acari, Mesostigmata) during decomposition of tree leaves in forest stands growing on reclaimed post-mining spoil heap and adjacent forest habitats. Forests 2018, 9, 718. [Google Scholar] [CrossRef]
  13. Petersen, H.; Luxton, M. A comparative analysis of soil fauna populations and their role in decomposition processes. Oikos 1982, 39, 288–388. [Google Scholar] [CrossRef]
  14. Ruf, A.; Beck, L. The use of predatory soil mites in ecological soil classification and assessment concepts, with perspectives for oribatid mites. Ecotoxicol. Environ. Saf. 2005, 62, 290–299. [Google Scholar] [CrossRef]
  15. Koehler, H.H. Predatory mites (Gamasina, Mesostigmata). Agric. Ecosyst. Environ. 1999, 74, 395–410. [Google Scholar] [CrossRef]
  16. Gulvik, M. Mites (Acari) as indicators of soil biodiversity and land use monitoring: A review. Pol. J. Ecol. 2007, 415–440. [Google Scholar]
  17. Gan, H.; Zak, D.R.; Hunter, M.D. Chronic nitrogen deposition alters the structure and function of detrital food webs in a northern hardwood ecosystem. Ecol. Appl. 2013, 23, 1311–1321. [Google Scholar] [CrossRef]
  18. Berg, M.P.; Kniese, J.P.; Bedaux, J.J.M.; Verhoef, H.A. Dynamics and stratification of functional groups of micro- and mesoarthropods in the organic layer of a Scots pine forest. Biol. Fertil. Soils 1998, 26, 268–284. [Google Scholar] [CrossRef]
  19. Magcale-Macandog, D.B.; Manlubatan, M.B.T.; Javier, J.M.; Edrial, J.D.; Mago, K.S.; De Luna, J.E.I.; Nayoos, J.; Porcioncula, R.P. Leaf litter decomposition and diversity of arthropod decomposers in tropical Muyong forest in Banaue, Philippines. Paddy Water Environ. 2018, 16, 265–277. [Google Scholar] [CrossRef]
  20. Vasconcelos, H.L.; Laurance, W.F. Influence of habitat, litter type, and soil invertebrates on leaf-litter decomposition in a fragmented Amazonian landscape. Oecologia 2005, 144, 456–462. [Google Scholar] [CrossRef] [Green Version]
  21. Elkins, N.Z.; Whitford, W.G. The role of microarthropods and nematodes in decomposition in a semi-arid ecosystem. Oecologia 1982, 55, 303–310. [Google Scholar] [CrossRef]
  22. González, G.; Seastedt, T.R.; Donato, Z. Earthworms, arthropods and plant litter decomposition in aspen (Populus tremuloides) and lodgepole pine (Pinus contorta) forests in Colorado, USA. Pedobiologia 2003, 47, 863–869. [Google Scholar] [CrossRef]
  23. Heneghan, L.; Coleman, D.C.; Zou, X.; Crossley, D.A.; Haines, B.L. Soil microarthropod contributions to decomposition dynamics: Tropical–temperate comparisons of a single substrate. Ecology 1999, 80, 1873–1882. [Google Scholar]
  24. Lindo, Z.; Winchester, N.N. Oribatid mite communities and foliar litter decomposition in canopy suspended soils and forest floor habitats of western redcedar forests, Vancouver Island, Canada. Soil Biol. Biochem. 2007, 39, 2957–2966. [Google Scholar] [CrossRef]
  25. Mueller, K.E.; Eisenhauer, N.; Reich, P.B.; Hobbie, S.E.; Chadwick, O.A.; Chorover, J.; Dobies, T.; Hale, C.M.; Jagodziński, A.M.; Kałucka, I.; et al. Light, earthworms, and soil resources as predictors of diversity of 10 soil invertebrate groups across monocultures of 14 tree species. Soil Biol. Biochem. 2016, 92, 184–198. [Google Scholar] [CrossRef] [Green Version]
  26. Blair, J.M.; Crossley, D.A.; Callaham, L.C. Effects of litter quality and microarthropods on N dynamics and retention of exogenous 15N in decomposing litter. Biol. Fertil. Soils 1992, 12, 241–252. [Google Scholar] [CrossRef]
  27. Seastedt, T.R.; Crossley, D.A. Nutrients in forest litter treated with naphthalene and simulated throughfall: A field microcosm study. Soil Biol. Biochem. 1983, 15, 159–165. [Google Scholar] [CrossRef]
  28. Horodecki, P.; Nowiński, M.; Jagodziński, A.M. Advantages of mixed tree stands in restoration of upper soil layers on postmining sites: A five-year leaf litter decomposition experiment. Land Degrad. Dev. 2019, 30, 3–13. [Google Scholar] [CrossRef]
  29. Gholz, H.L. Long-term dynamics of pine and hardwood litter in contrasting environments: Toward a global model of decomposition. Glob. Change Biol. 2000, 6, 751–765. [Google Scholar] [CrossRef]
  30. Freschet, G.T.; Aerts, R.; Cornelissen, J.H.C. Multiple mechanisms for trait effects on litter decomposition: Moving beyond home-field advantage with a new hypothesis. J. Ecol. 2012, 100, 619–630. [Google Scholar] [CrossRef]
  31. Keiser, A.D.; Strickland, M.S.; Fierer, N.; Bradford, M.A. The effect of resource history on the functioning of soil microbial communities is maintained across time. Biogeosciences 2011, 8, 1477–1486. [Google Scholar] [CrossRef] [Green Version]
  32. Gergócs, V.; Hufnagel, L. The effect of microarthropods on litter decomposition depends on litter quality. Eur. J. Soil Biol. 2016, 75, 24–30. [Google Scholar] [CrossRef]
  33. Ceitel, J. Zmiany mikroklimatu przygruntowej warstwy powietrza oraz morfologii drzew ze wzrostem upraw sosnowych założonych w różnych więźbach początkowych; Katedra Hodowli Lasu, Akademia Rolnicza w Poznaniu. Ph.D. Thesis, Department of Silviculture, Agricultural University, Poznań, Poland, 1982. [Google Scholar]
  34. Hobbie, S.E.; Reich, P.B.; Oleksyn, J.; Ogdahl, M.; Zytkowiak, R.; Hale, C.; Karolewski, P. Tree species effects on decomposition and forest floor dynamics in a common garden. Ecology 2006, 87, 2288–2297. [Google Scholar] [CrossRef]
  35. Jagodziński, A.M.; Oleksyn, J. Ecological consequences of silviculture at variable stand densities. I. Stand growth and development. Sylwan 2009, 153, 75–85. [Google Scholar]
  36. Jagodziński, A.M.; Oleksyn, J. Ecological consequences of silviculture at variable stand densities. II. Biomass production and allocation, nutrient retention. Sylwan 2009, 153, 147–157. [Google Scholar]
  37. Jagodziński, A.M.; Oleksyn, J. Ecological consequences of silviculture at variable stand densities. III. Stand stability, phytoclimate and biodiversity. Sylwan 2009, 153, 219–230. [Google Scholar]
  38. Skorupski, M.; Dalik, J.; Ceitel, J. Species composition of mites from the order Mesostigmata in experimental pine and spruce tree stands planted in various initial spacing. Sci. Pap. Agric. Univ. Poznan For. 2003, 49–56. [Google Scholar]
  39. Crossley, D.A.; Blair, J.M. Proceedings of the International Workshop on Modern Techniques in Soil Ecology Relevant to Organic Matter Breakdown, Nutrient Cycling and Soil Biological Processes A high-efficiency, “low-technology” Tullgren-type extractor for soil microarthropods. Agric. Ecosyst. Environ. 1991, 34, 187–192. [Google Scholar] [CrossRef]
  40. Edwards, C.A. The assessment of populations of soil-inhabiting invertebrates. Agric. Ecosyst. Environ. 1991, 34, 145–176. [Google Scholar] [CrossRef]
  41. Karg, W. Acari (Acarina), Milben Parasitiformes (Anactinochaeta), Cohors Gamasina Leach. Raubmilben. Die Tierwelt Deutschlands; VEB Gustav Fischer Verlag: Jena, Germany, 1993.
  42. Ghilarov, M.C.; Bregetova, N.G. Opredelitel obitajuscich v Pocve Klescej-Mesostigmata (Key to the Soil Mites—Mesostigmata); Nauka: Leningrad, Russia, 1977. [Google Scholar]
  43. Micherdziński, W. Die Familie Parasitidae Oudemans, 1901 “(Acarina, Mesostigmata)”; Państwowe Wydawnictwo Naukowe: Kraków, Poland, 1969. [Google Scholar]
  44. Oksanen, J.; Blanchet, F.; Legendre, P.; Michin, P.; O’Hara, R.; Simpson, G.; Solymos, P.; Henry, M.; Stevens, H.; Wagner, H. “vegan” 2.3.3.–Community Ecology Package. Available online: https://cran.r-project.org/web/packages/vegan/vegan.pdf (accessed on 8 May 2019).
  45. Wieder, R.K.; Lang, G.E. A critique of the analytical methods used in examining decomposition data obtained from litter bags. Ecology 1982, 63, 1636–1642. [Google Scholar] [CrossRef]
  46. Bates, D.; Mächler, M.; Bolker, B.; Walker, S. Fitting linear mixed-effects models using lme4. J. Stat. Softw. 2015, 67, 1–48. [Google Scholar] [CrossRef]
  47. Kuznetsova, A.; Brockhoff, P.B.; Christensen, R.H.B. lmerTest package: Tests in linear mixed effects models. J. Stat. Softw. 2017, 82, 1–26. [Google Scholar] [CrossRef]
  48. R Core Team R: A Language and Environment for Statistical Computing. Available online: https://www.R-project.org/ (accessed on 14 March 2019).
  49. Horodecki, P.; Jagodziński, A.M. Tree species effects on litter decomposition in pure stands on afforested post-mining sites. For. Ecol. Manag. 2017, 406, 1–11. [Google Scholar] [CrossRef]
  50. Seastedt, T.R. The role of microarthropods in decomposition and mineralization processes. Annu. Rev. Entomol. 1984, 29, 25–46. [Google Scholar] [CrossRef]
  51. Kaneko, N.; Salamanca, E. Mixed leaf litter effects on decomposition rates and soil microarthropod communities in an oak–pine stand in Japan. Ecol. Res. 1999, 14, 131–138. [Google Scholar] [CrossRef]
  52. González, G.; Seastedt, T.R. Comparison of the abundance and composition of litter fauna in tropical and subalpine forests. Pedobiologia 2000, 44, 545–555. [Google Scholar] [CrossRef]
  53. Gergócs, V.; Rétháti, G.; Hufnagel, L. Litter quality indirectly influences community composition, reproductive mode and trophic structure of oribatid mite communities: A microcosm. Exp. Appl. Acarol. 2015, 67, 335–356. [Google Scholar] [CrossRef]
  54. Kampichler, C.; Bruckner, A. The role of microarthropods in terrestrial decomposition: A meta-analysis of 40 years of litterbag studies. Biol. Rev. 2009, 84, 375–389. [Google Scholar] [CrossRef] [PubMed]
  55. Usher, M.B. Studies on a wood-feeding termite community in Ghana, West Africa. Biotropica 1975, 7, 217–233. [Google Scholar] [CrossRef]
  56. Minor, M.A.; Cianciolo, J.M. Diversity of soil mites (Acari: Oribatida, Mesostigmata) along a gradient of land use types in New York. Appl. Soil Ecol. 2007, 35, 140–153. [Google Scholar] [CrossRef]
  57. Walter, D.E.; Proctor, H. Mites: Ecology, Evolution & Behaviour–Life at a Microscale|David Evans Walter, Springer; CABI Publishing: New York, NY, USA, 1999. [Google Scholar]
  58. Martikainen, E.; Huhta, V. Interactions between nematodes and predatory mites in raw humus soil: A microcosm experiment. Rev. DÉcologie Biol. Sol 1990, 27, 13–20. [Google Scholar]
  59. Hasegawa, M.; Okabe, K.; Fukuyama, K.; Makino, S.; Okochi, I.; Tanaka, H.; Goto, H.; Mizoguchi, T.; Sakata, T. Community structures of Mesostigmata, Prostigmata and Oribatida in broad-leaved regeneration forests and conifer plantations of various ages. Exp. Appl. Acarol. 2013, 59, 391–408. [Google Scholar] [CrossRef] [PubMed]
Figure 1. Mean (+SE) species richness (A), diversity (B) and mite abundance (C) in litterbags. The thick horizontal line represents the mean and dashed lines represent the range of SE for the control soil mite pool at the time of experiment setup. Litter origin marked by the same letter did not differ statistically significantly (p > 0.05), according to Tukey posteriori test.
Forests 10 00403 g001
Figure 2. RDA analysis of mite community species composition. Each point represents the community from litterbags per plot per date. Red labels indicate the centroids of factors constraining analysis results (significance test Table 2). Black labels indicate scores of species which occurred at least 10 times among the 16 species; names are first four letters of genera name and first four letters of the species name.
Forests 10 00403 g002
Figure 3. Dissimilarity between mite communities and the control (mite community in the soil during experiment setup), expressed by Bray-Curtis dissimilarity index. Solid line—broadleaved species; dashed line—coniferous species.
Forests 10 00403 g003
Figure 4. The richness of species noted in the control (during experiment setup—white) and not noted (colonizers—black) in mite communities studied.
Forests 10 00403 g004
Figure 5. Litter mass loss [%] of coniferous (A) and broadleaved (B) species in litterbags. Data are presented as mean ± SE.
Forests 10 00403 g005
Table 1. Generalized linear mixed models explaining mite abundance, species richness, and diversity.
ResponseTermEstimateSEzPr (>|z|)
Abundance(Intercept)4.09450.077053.1450<0.0001
Litter origin—Acer platanoides−1.03760.1125−9.2250<0.0001
Litter origin—Quercus rubra−0.63530.0978−6.4980<0.0001
Litter origin—Carpinus betulus−0.43740.0918−4.7630<0.0001
Litter origin—Acer pseudoplatanus−0.22150.0863−2.56800.0102
Litter origin—Picea abies−0.32140.0887−3.62200.0003
Litter origin—Abies alba0.00990.08120.12200.9031
Litter origin—Larix decidua−0.46340.0926−5.0060<0.0001
Litter origin—Fagus sylvatica−0.44260.0920−4.8110<0.0001
Litter origin—Quercus robur−0.06150.0826−0.74400.4571
Litter origin—Tilia cordata−0.26800.0874−3.06700.0022
Date—October 2009−1.02950.0511−20.1360<0.0001
Date—April 2010−1.15670.0536−21.5720<0.0001
Random effect—plotVariance0.0070SD0.0839
Richness(Intercept)2.23310.210210.6240<0.0001
Decomposition constant (k)−1.14240.7384−1.54700.1218
Date—October 2009−0.05720.0937−0.61000.5420
Date—April 2010−0.27350.0994−2.75200.0059
Random effect—plotVariance0.0197SD0.1405
Shannon(Intercept)1.38270.19617.0500<0.0001
Decomposition constant (k)−0.66340.5996−1.10600.2710
Random effect—plotVariance0.0444SD0.2107
Table 2. PERMANOVA test of the influence of litter identity and collection date on mite species communities in RDA reduced space. AIC0 refers to the null model (unconstrained analysis).
TermdfVarianceFPr (>F)
Collection date20.069175.46960.001
Residual960.60690--
AIC−44.43AIC0−37.75-

