Article

Quantifying Impacts of National-Scale Afforestation on Carbon Budgets in South Korea from 1961 to 2014

1
Environmental GIS/RS Center, Korea University, Seoul 02841, Korea
2
Ecosystem Services and Management Program, International Institute for Applied Systems Analysis (IIASA), Schlossplatz 1, A-2361 Laxenburg, Austria
3
Department of Environmental Science and Ecological Engineering, Korea University, Seoul 02481, Korea
4
Institute of Life Science and Natural Resources, Korea University, Seoul 02481, Korea
*
Author to whom correspondence should be addressed.
Submission received: 31 May 2019 / Revised: 3 July 2019 / Accepted: 9 July 2019 / Published: 11 July 2019

Abstract

:
Forests play an important role in regulating the carbon (C) cycle. The main objective of this study was to quantify the effects of South Korean national reforestation programs on carbon budgets. We estimated the changes in C stocks and annual C sequestration in the years 1961–2014 using Korea-specific models, a forest cover map (FCM), national forest inventory (NFI) data, and climate data. Furthermore, we examined the differences in C budgets between Cool forests (forests at elevations above 700 m) and forests in lower-altitude areas. Simulations including the effects of climate conditions on forest dynamics showed that the C stocks of the total forest area increased from 6.65 Tg C in 1961 to 476.21 Tg C in 2014. The model developed here showed a high degree of spatiotemporal reliability. The mean C stocks of the Cool forests and other forests increased from 4.03 and 0.43 Mg C ha−1, respectively, to 102.43 and 73.76 Mg C ha−1 at a rate of 1.82 and 1.36 Mg C ha−1 yr−1 during the same period. These results imply that, although the total Cool forest area of South Korea occupied only about 12.3% (772,788 ha) of the total forest area, the Cool forests play important roles in C balances and forest ecosystems in South Korea. Annual C sequestration totals are projected to decrease at a low rate in the near future because the overall growth rate of a mature forest decreases as the stand ages. Our results quantified forest C dynamics in South Korean forests before and after national reforestation programs. Furthermore, our results can help in development of regional and national forest management strategies to allow for sustainable development of society and to cope with climate change in South Korea.

1. Introduction

The success of climate change mitigation and adaptation and implementing sustainable development goals depends on a diverse array of ecosystem services provided by forests. Over the coming century, these and other forest-derived ecosystem services will need to be sustained to meet the increasing demands of a growing human population [1]. The difficulty of this task is exacerbated by the impacts of anthropogenic climate change [2]. In addition, deforestation is a major driver of both climate change and biodiversity loss [3]. The various worldwide problems and damage caused by deforestation and climate change have been well-documented. Therefore, many countries, including India [4], China [5], New Zealand [6], Finland [7], the UK [8], and South Korea [9], have formulated and implemented a number of policies and programs aimed at forest conservation, afforestation, and reforestation.
South Korea is a rare, exemplary model of full-scale reforestation [10]. After the Korean War, almost half of its forestland was destroyed. Since 1973, following this period of serious deforestation, the South Korean government has implemented national plantation programs to promote forest recovery. After about 40 years of these efforts, South Korean forests have successfully recovered, and the stocking stem volume increased from 8.2 m3 ha−1 in 1954 to 150.0 m3 ha−1 in 2015 [11]. Furthermore, this success has spread to several different sectors with positive outcomes in the realms of land restoration, flood prevention, biodiversity recovery, and increases in water supply and recreational forests [12,13,14,15]. One of the major management issues that the forest sector in South Korea is faced with is understanding the impact of climate change and optimizing the use of forest resources [16]. There are numerous impacts of climate change associated with social, environmental, and economic problems, and a number of countries are creating mitigation and adaptation plans for climate change [17]. Carbon storage and sequestration are essential attributes of forests and important components of mitigation and adaptation strategies. However, this in turn indicates that forests are also subject to impacts of climate change [18,19].
Studies on forest carbon (C) stocks and balances in South Korea over the past few decades have been conducted for many years. Previous research based on the national forest inventory (NFI) and theoretical models has shown that the biomass C stocks of South Korean forests increased gradually in recent decades [9,15,20,21,22,23,24]. Lee et al. [24] estimated the forest carbon storage in the period of 1990–1997 as a part of estimating the changes in annual CO2 fluxes in Korea. Choi et al. [15] analyzed the temporal variations in forest biomass, forest carbon density, and forest carbon uptake rate in the period of 1954–2000 and reported that Korean forests had a higher carbon uptake rate (Mg C ha−1 yr−1) in the late 1990s than in earlier years. It was concluded that this high carbon uptake rate resulted from the high growth rate of young trees present as a consequence of the 30 year reforestation and forest management program. However, there were some limitations to that study, such as (1) a relatively short simulation period of not more than two decades, (2) the large spatial scale of the simulation units, (3) insufficient spatial validation, and (4) the lack of an annual climate impact on forest stand dynamics.
In addition, Cool forests, defined at the 2018 International Boreal Forest Research Association Conference as forests at elevations above 700 m, have recently needed more careful monitoring and assessment than other forests. This is because Cool forests have been assessed as highly sensitive and vulnerable to climate change in South Korea and worldwide [18,25,26,27,28]. Therefore, comparison of C dynamics between the Cool forests and other forests through systematic observation and spatial-temporal modeling is required.
The primary objective of this study was to estimate C stocks and their changes in South Korean forests, including climate impacts on forest growth during the post-war period (1961–2014) using a Korea-specific dynamic model. To estimate the spatial distribution of forest C stocks, we constructed a spatial data set for Korean forests using the fifth NFI and the fifth Forest Cover Map (FCM). The model was validated by comparing estimated stem volumes with the observational data in the fifth and the sixth NFI on multiple spatial scales. Finally, we compared C stocks and annual C sequestration of Cool forests with those of other forests in South Korea.

2. Materials and Methods

2.1. Spatial Data for South Korean Forests
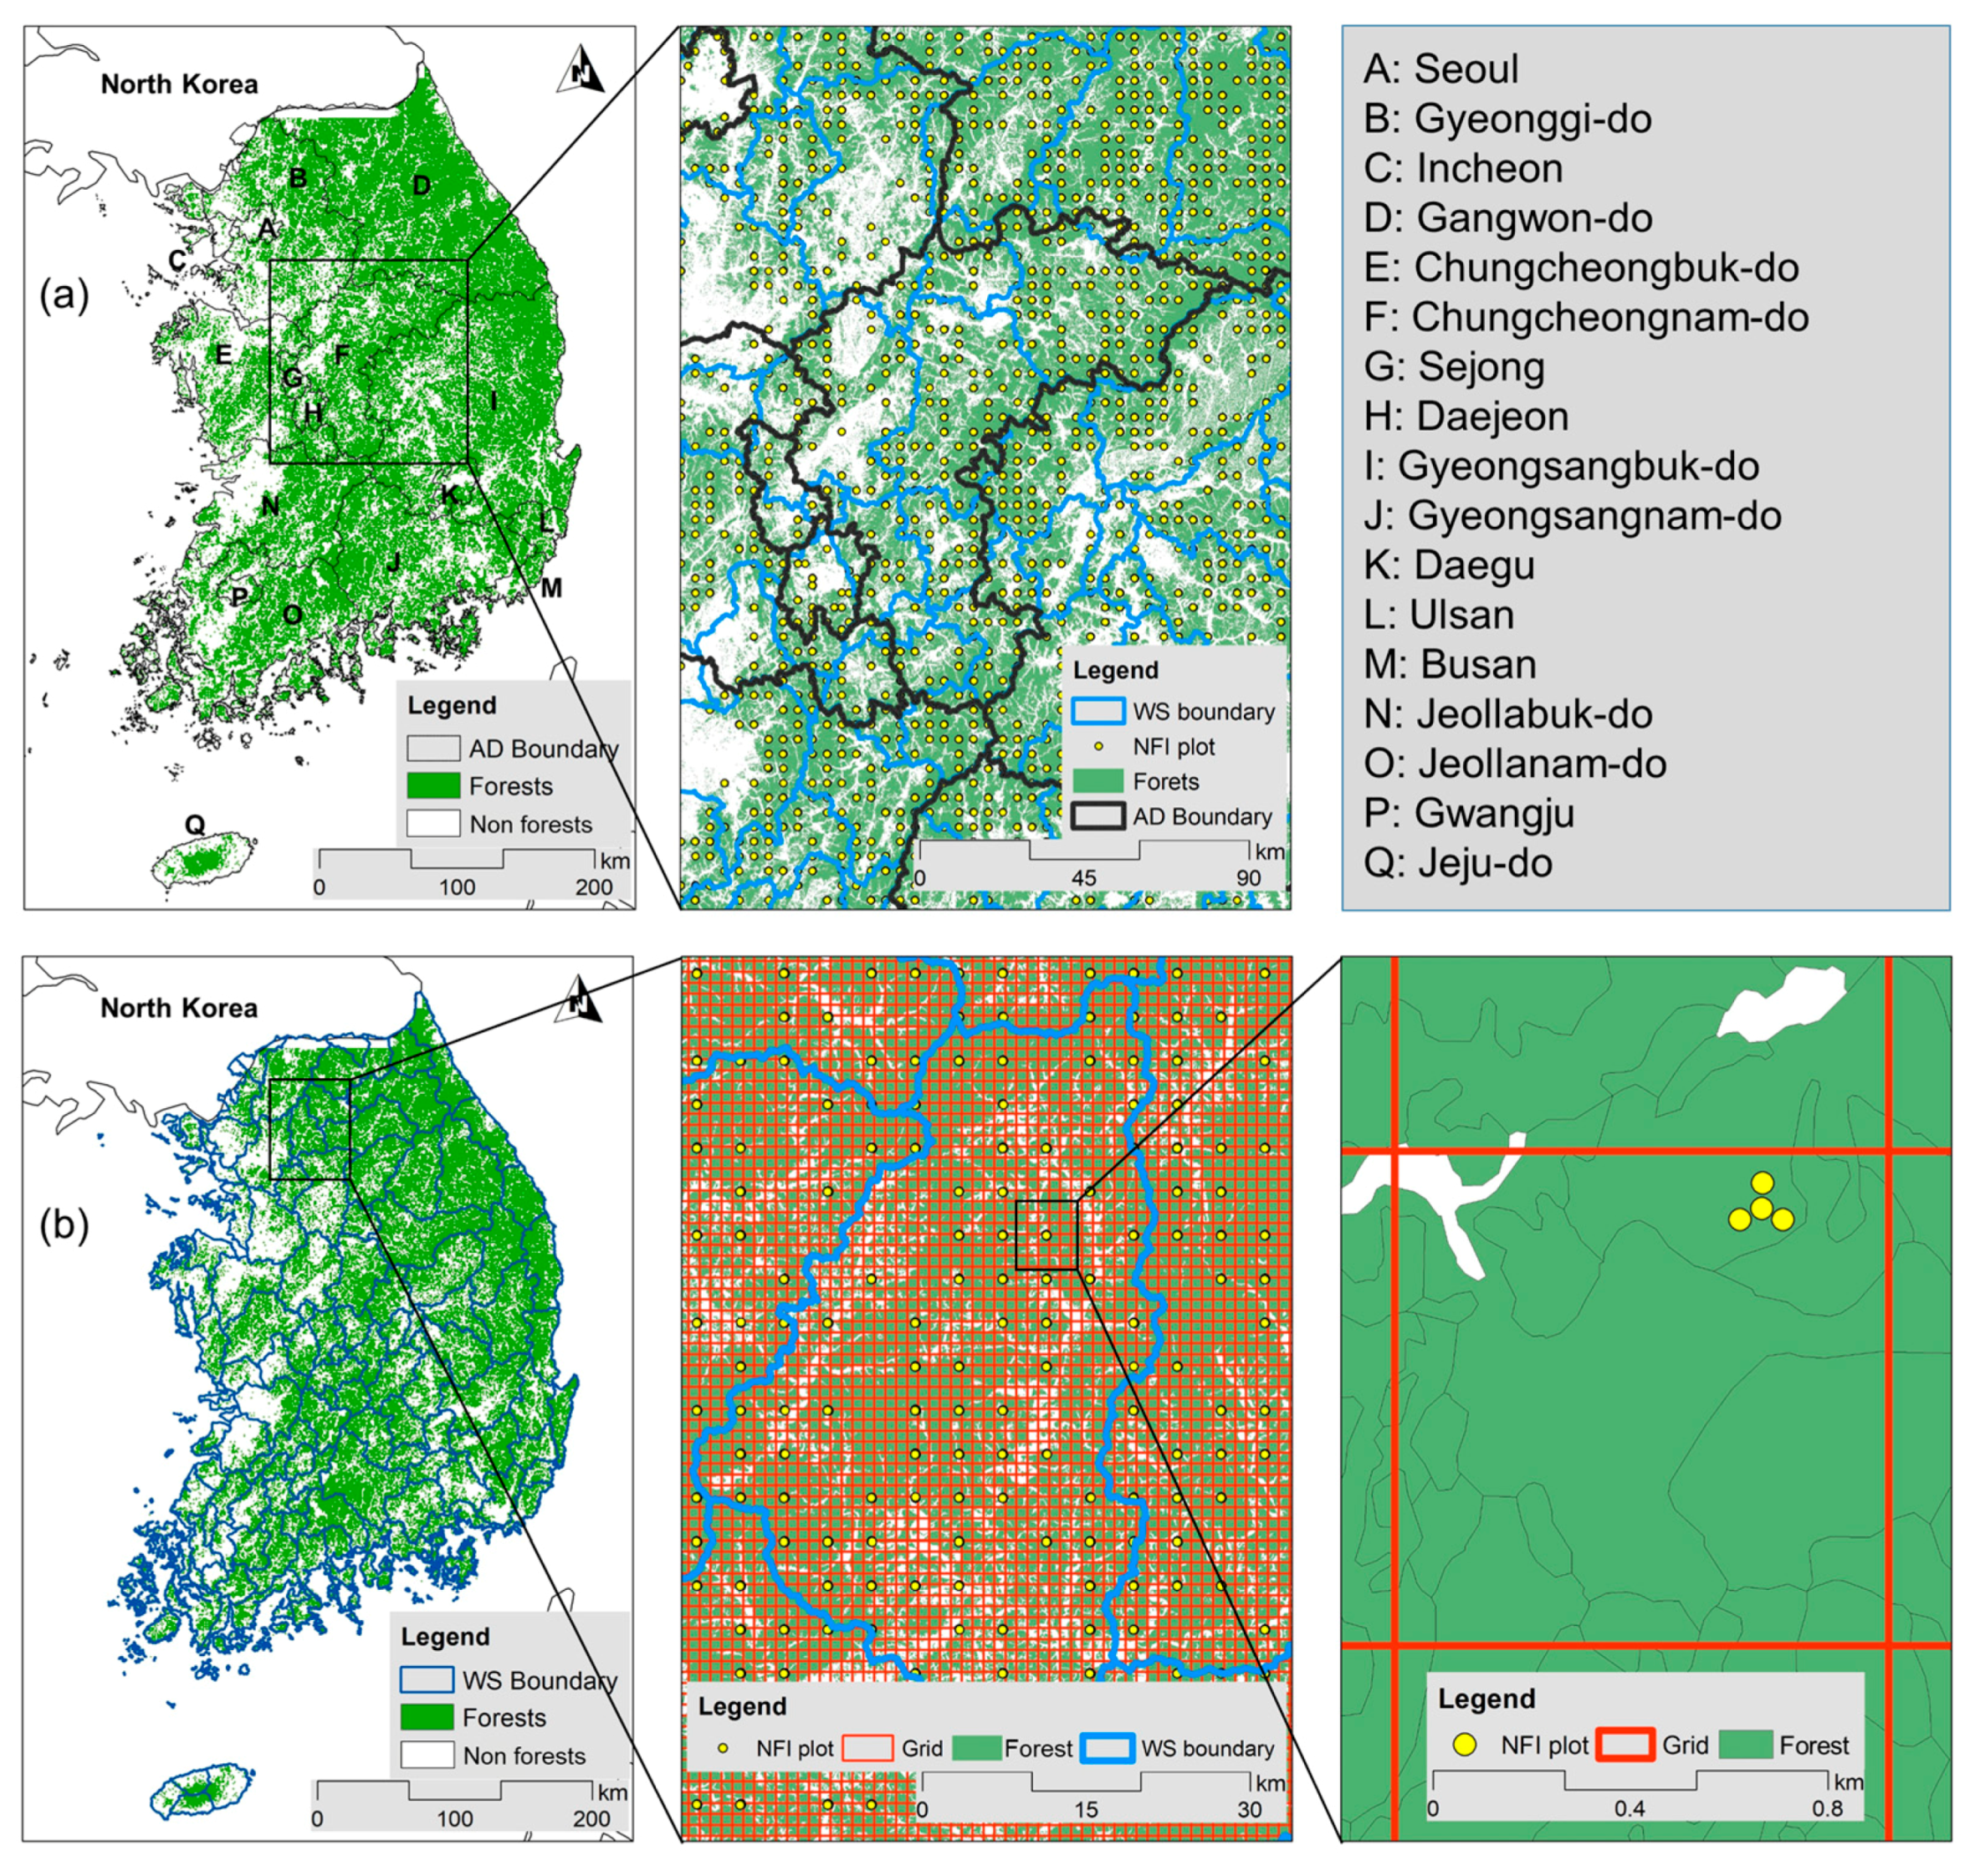
2.1.1. Study Area

South Korea is a peninsula located in mid-latitude East Asia and has a temperate climate. Annual average precipitation is 1000–1800 mm, and 50–60% of the precipitation is concentrated in the summer (June to August) (Figure 1a). The average annual temperature is 10–15 °C. More than 60% of the country is mountainous, and the terrain is high in the east and low in the west (Figure 1b). Most of the forests in South Korea are located in mountainous areas. Forests cover about 63.7% (6,369,000 ha) of the total land area of South Korea, and evergreen forests (mainly Pinus densiflora), deciduous broad-leaved forests (mainly Quercus spp.), and mixed forests made up approximately 40.5%, 27%, and 29.3%, respectively, of the total forest area in 2017 [11].
Cool forests were defined at the 2018 International Boreal Forest Research Association (IBFRA) Conference. Boreal and mountain forests develop over many thousands of years in regions with cold climates. They make up more than one-third of global forests, forming the largest terrestrial vegetation ecosystem. They are found from the circumpolar belt in the northern hemisphere to high-elevation forests spread over the entire planet. Forests on permafrost show many similarities with those in boreal and high mountain ecozones—especially with respect to species and growth patterns and in response to climate exposure. The 2018 IBFRA defined a Cool forest in the temperate zone as a forest at an elevation above 700 m. When this definition is applied, the total Cool forest area in South Korea is an estimated 772,788 ha based on high spatial resolution (30 m × 30 m) digital elevation model data (Figure 1c).
The Korea Meteorological Administration provided climate data, including monthly mean temperature, mean daily minimum temperature, and total precipitation, from 75 weather stations across South Korea from 1961 to 2014. The data were interpolated with a 0.01° grid size (≈1 km) using kriging and inverse distance weighting, considering the absolute temperature and precipitation lapse rate by elevation [29]. These datasets were resampled into a 0.01° spatial resolution. Figure 1d shows the annual mean temperature and the annual precipitation of South Korean forests area in 1961–2014. The annual mean temperatures of Cool and other forest areas rose by 1.53 °C and 0.78 °C, respectively, in this time. In addition, the annual precipitation of Cool and other forest areas rose by 362.7 and 299.4 mm, respectively, during the same period. These data imply that there was tendency for Cool forest areas to warm more quickly than the other forest areas during the last five decades.

2.1.2. National Forest Inventory Data and Forest Cover Map

The fifth NFI was conducted for the entirety of South Korean forests from 2006 to 2010 [30]. The survey design consisted of systematic sampling at intervals of 4 km (longitude) × 4 km (latitude) across South Korea (Figure 2a). Four circular sample plots were located at the intersection of each 4 km × 4 km grid line. Each sample plot (16.0 m radius) covered 0.08 ha. Forest characteristics [tree species, age, height, diameter at breast height (DBH), site index, and number of trees] and topographical factors (coordinates, elevation, slope, and aspect) were measured at all sites [30]. The sixth NFI was conducted from 2011 to 2015. Each permanent plot was surveyed five years after its previous survey.
A forest cover map (FCM) was used to predict the present stem volume. This map (at a scale of 1:5000) was produced from visual interpretation of aerial photographs and NFI data, and it outlined forest stands classified by tree species, DBH, age class, and canopy closure [31]. Seventeen categories of tree species were specified. The DBH and the age of stands were expressed as “DBH class,” (6–16 cm, 16–30 cm, and over 30 cm), and 10 year “age class” ranges.

2.2. Investment in the National Forestation Program

2.2.1. Establishing a Time Series of Forest Stock Maps

Information about the changes in forest areas in the Republic of Korea during 1961–2014 was provided only as statistical data, and there are no official spatial data. In addition, the forest area in the land cover data from the 1960s to 2014 is similar to that in the forest statistics. In other words, the change in the forest stock is not reflected in the statistics, as only the total forest area is provided. For this reason, in this study, the concept of a forest cover map was applied [9]. The ages of forest areas were estimated using a different method.
Spatial data for the time series of forest areas stocked though the national forestation program in the five decades of concern was produced using the FCM and the fifth NFI. We determined stand age information in the 2000s using these two date sources. In the FCM, stand age was assumed to be 5, 15, 25, 35, 45, and over 55 for age classes I, II, III, IV, V, and VI, respectively (Figure 2c). First, the representative age class was determined as the age class occupying the largest area of each grid. Second, for grids that represented age classes I, II, III, or IV, the stand age of each grid cell was calculated as an area-weighted average value of each stand within the grid cell. Third, the stand ages of grids that were representative of age class V were determined within a range from 51 to 107 based on the statistics of the fifth NFI. The larger the area of age class V in each grid was, the older the stand age was assumed to be. The probability distribution of stand age for grids that represented age class V followed the distribution of stand age in the fifth NFI data (Figure 2e). The probability distribution of estimated stand age showed a trend similar to that of observed stand age in the NFI data on a national scale. As the results were similar, it could be inferred that the model successfully reflected the trends in stem volume of Korean forests, further suggesting successful reconstruction of age distribution at a national scale, although uncertainties remained for individual stands.

2.2.2. Preparation of Inventory Data on Past and Present Forest Status

Four independent Korea-specific models, including height growth, tree mortality, DBH growth, and growth modifier models, were used to simulate annual stem volume and carbon stock changes. The connection among these models did not necessitate complex methods. The overall process used to estimate stem volume through the four different models in this study is summarized as follows: (1) estimation of growth of stand mean height and dominant tree height based on age and site index of each stand using regression models, as suggested by the Korea Forest Service (KFS) [32]; (2) estimation of stand density (trees per ha) change using a stand-level mortality model [33]; (3) estimation of annual stand mean DBH growth reflecting topographic and climatic conditions using regression models and a growth modifier developed by Piao et al. [34] and Kim et al. [35]; and (4) using the information from the previous three steps to estimate forest volume and carbon stocks using regression models, basic wood density (BWD), and biomass extension factors (BEFs) developed by the National Institute for Forest Science (NIFoS) [36].
SI is defined by the KFS as the height of the dominant tree species at 30 years of age. Therefore, to estimate the dominant tree height (ho) of each stand, we used a functional formula (Equation (1)):
h o i = S I · ( 1 e a · A 1 e a · 30 ) b
where ho is dominant tree height (m), SI is site index, A is stand age (years), i is the identification number of the stand, and a and b are species–specific coefficients. Coefficients proposed by the KFS [31] are shown in Table S1 in Supplementary Material. Regression equations and coefficients developed by the KFS [32] for the tree species that dominated each stand were applied in Equation (2).
hm = f(ho)
where hm is mean tree height (m). Dominant tree height (ho) is one of the most commonly used indicators of site productivity because there is a close correlation between stem volume and site index, and it is generally accepted that ho is minimally affected by competition. A Korea-specific self-thinning model was used to estimate change in stand density [33]. This model was derived from Sterba’s theory based on the competition density (C-D) effect and dominant tree height; it showed a high degree of reliability (R2 = 0.55–0.81) and no obvious dependencies or patterns in residuals for major Korean tree species. Coefficients for each tree species are shown in Table S1 in Supplementary Material:
Δ S N i = a · e b · S N i M S N i · ( M S N i M S N i + 1 )
where i is stand age (years), SNi is stand density at time i, MSNi is the maximum stem number at time i, ΔSN is the number of dying trees from i to i + 1, and a and b represent the self-thinning index.
The DBH of each stand was estimated by incorporating not only stand-level factors such as stand age, SI, and stand density but also topographic and climatic factors to reflect various conditions of forests nationwide. For this, two different growth models were modified and integrated. First, Korea-specific regression models were used to calculate the basic (standard) pattern of DBH development by SI and stand age. These models, as described by Piao et al. [34], were developed to estimate the growth of DBH. These regression models were developed based on stand-level factors such as age, site index, and stand density using the fifth NFI. They showed relatively good performance with high correlation (0.710–0.789) for surveyed stand-level DBH at the national scale. To reflect the diameter growth response of trees to topographic and annual climatic variation, annual diameter growth by SI and age was calculated based on the derivative of these regression models with respect to age. Second, to reflect the annual diameter growth response of trees to topographic and climatic variation in DBH development, the estimated standard growth (eSG) model, as described by Kim et al. [35], was used as a growth modifier. To calibrate the differences between the impact of annual in-situ climate conditions on diameter growth of each stand and average climate conditions for each tree species in forests nationwide, we applied the growth modifier used in Kim et al. [35]. The following equation describes the growth modifier used here (Equation (4)):
d b h i + 1 = d b h i + 2 · Δ r i j · ( e S G i j m e S G p )
where i is each year from 1961 to 2014, j is the identification number of the stand, p is the total period (1961–2014), Δr is the mean estimated radial change from a differential regression model, eSG is the estimated standard growth, and meSG is the mean estimated standard growth of each species during the total period. The eSGij can be normalized using meSGp. Because the normalized eSGij is integrated into the radial growth model, radial growth increments can be estimated from topographic and annual climatic conditions.
The KFS regression model was used to calculate the stem volumes of individual stands (Equation (5)). The coefficient of each tree species for Equation (4) was derived by the NIFoS [36]. To estimate all forest biomass carbon stocks (CS) from stem volume, a biomass expansion factor (BEF, defined as the ratio of all stand biomass to growing stock volume), which converts timber volume to mass and accounts for noncommercial components (such as branches and leaves), and root/shoot ratio (RS) were applied (Equation (6)). As with the previous research [37,38], the annual carbon sequestration (CSE) in forests biomass was calculated based on the difference between the CS of this year and the CS of the previous year (Equation (7)).
V i j = a · d b h i j b · h m i j c · N i j · B W D 1 / 1000
C S i j = V i j · B E F · R S · 0.5
C S E i j = C S i j C S i j 1
where V is stem volume (m3 ha−1); CS is forest biomass carbon stocks (Mg ha−1); CSE is annual carbon sequestration in forests biomass (Mg ha−1 yr−1); dbh is the mean stand diameter (cm); N is the number of trees per ha; BWD, BEF, and RS are the basic wood density, biomass expansion factors, and root/shoot ratio, respectively, proposed by the NIFoS [36] (Table 1); i is the year; j is the identification number of each stand; and a, b, and c are species-specific coefficients.
For this study, Korean forests were divided into seven major forest types: red pine (Pinus densiflora), Japanese larch (Larix kaempferi), Korean pine (Pinus koraiensis), cork oak (Quercus variabilis), Mongolian oak (Quercus mongolica), mixed forest A (Mixed-A: red pine and cork oak), and mixed forest B (Mixed-B: red pine and Mongolian oak) based on FCM classification. For the purposes of this study, other coniferous tree species were classified as red pine, which comprise the highest proportion of tree species in South Korea. Other broad-leaved tree species in low (below 700 m) and high (over 700 m) altitude were defined as cork oak and Mongolian oak based on the fifth NFI [30].

2.3. Validation

In this study, the stem volume of each stand in South Korean forests from 1960–2014 was estimated by applying the integrated model then validated using the fifth and the sixth NFI, statistical data and other research. We compared model results for stem volume to those of the statistical yearbooks of forestry in South Korea between 1960 and 2014 and estimated R2 and the Root Mean Squared Error (RMSE) to indirectly validate the estimated biomass C stocks.
In addition, we attempted to directly spatially validate the model results using NFI plot data for three spatial-scale approaches as follows: (1) the plot level—comparison between the estimated stem volume of a stand and the mean stem volume of one NFI plot, which is composed of one center plot and three sub-plots; (2) the watershed level—comparison between the mean estimated stem volumes of forest areas within each watershed area and the mean stem volumes of NFI plots in each watershed area; (3) the administrative level—comparison between the mean estimated stem volumes of forest area and the mean stem volumes of NFI plots within each administrative boundary (Table 2, Figure 3). Generally, the watershed area and the administrative boundary are considered the spatial units for planning national forest management in South Korea. Therefore, this multi-spatial scale approach to validation is expected to be useful for local governments in developing forest activity strategies.

3. Results and Discussion

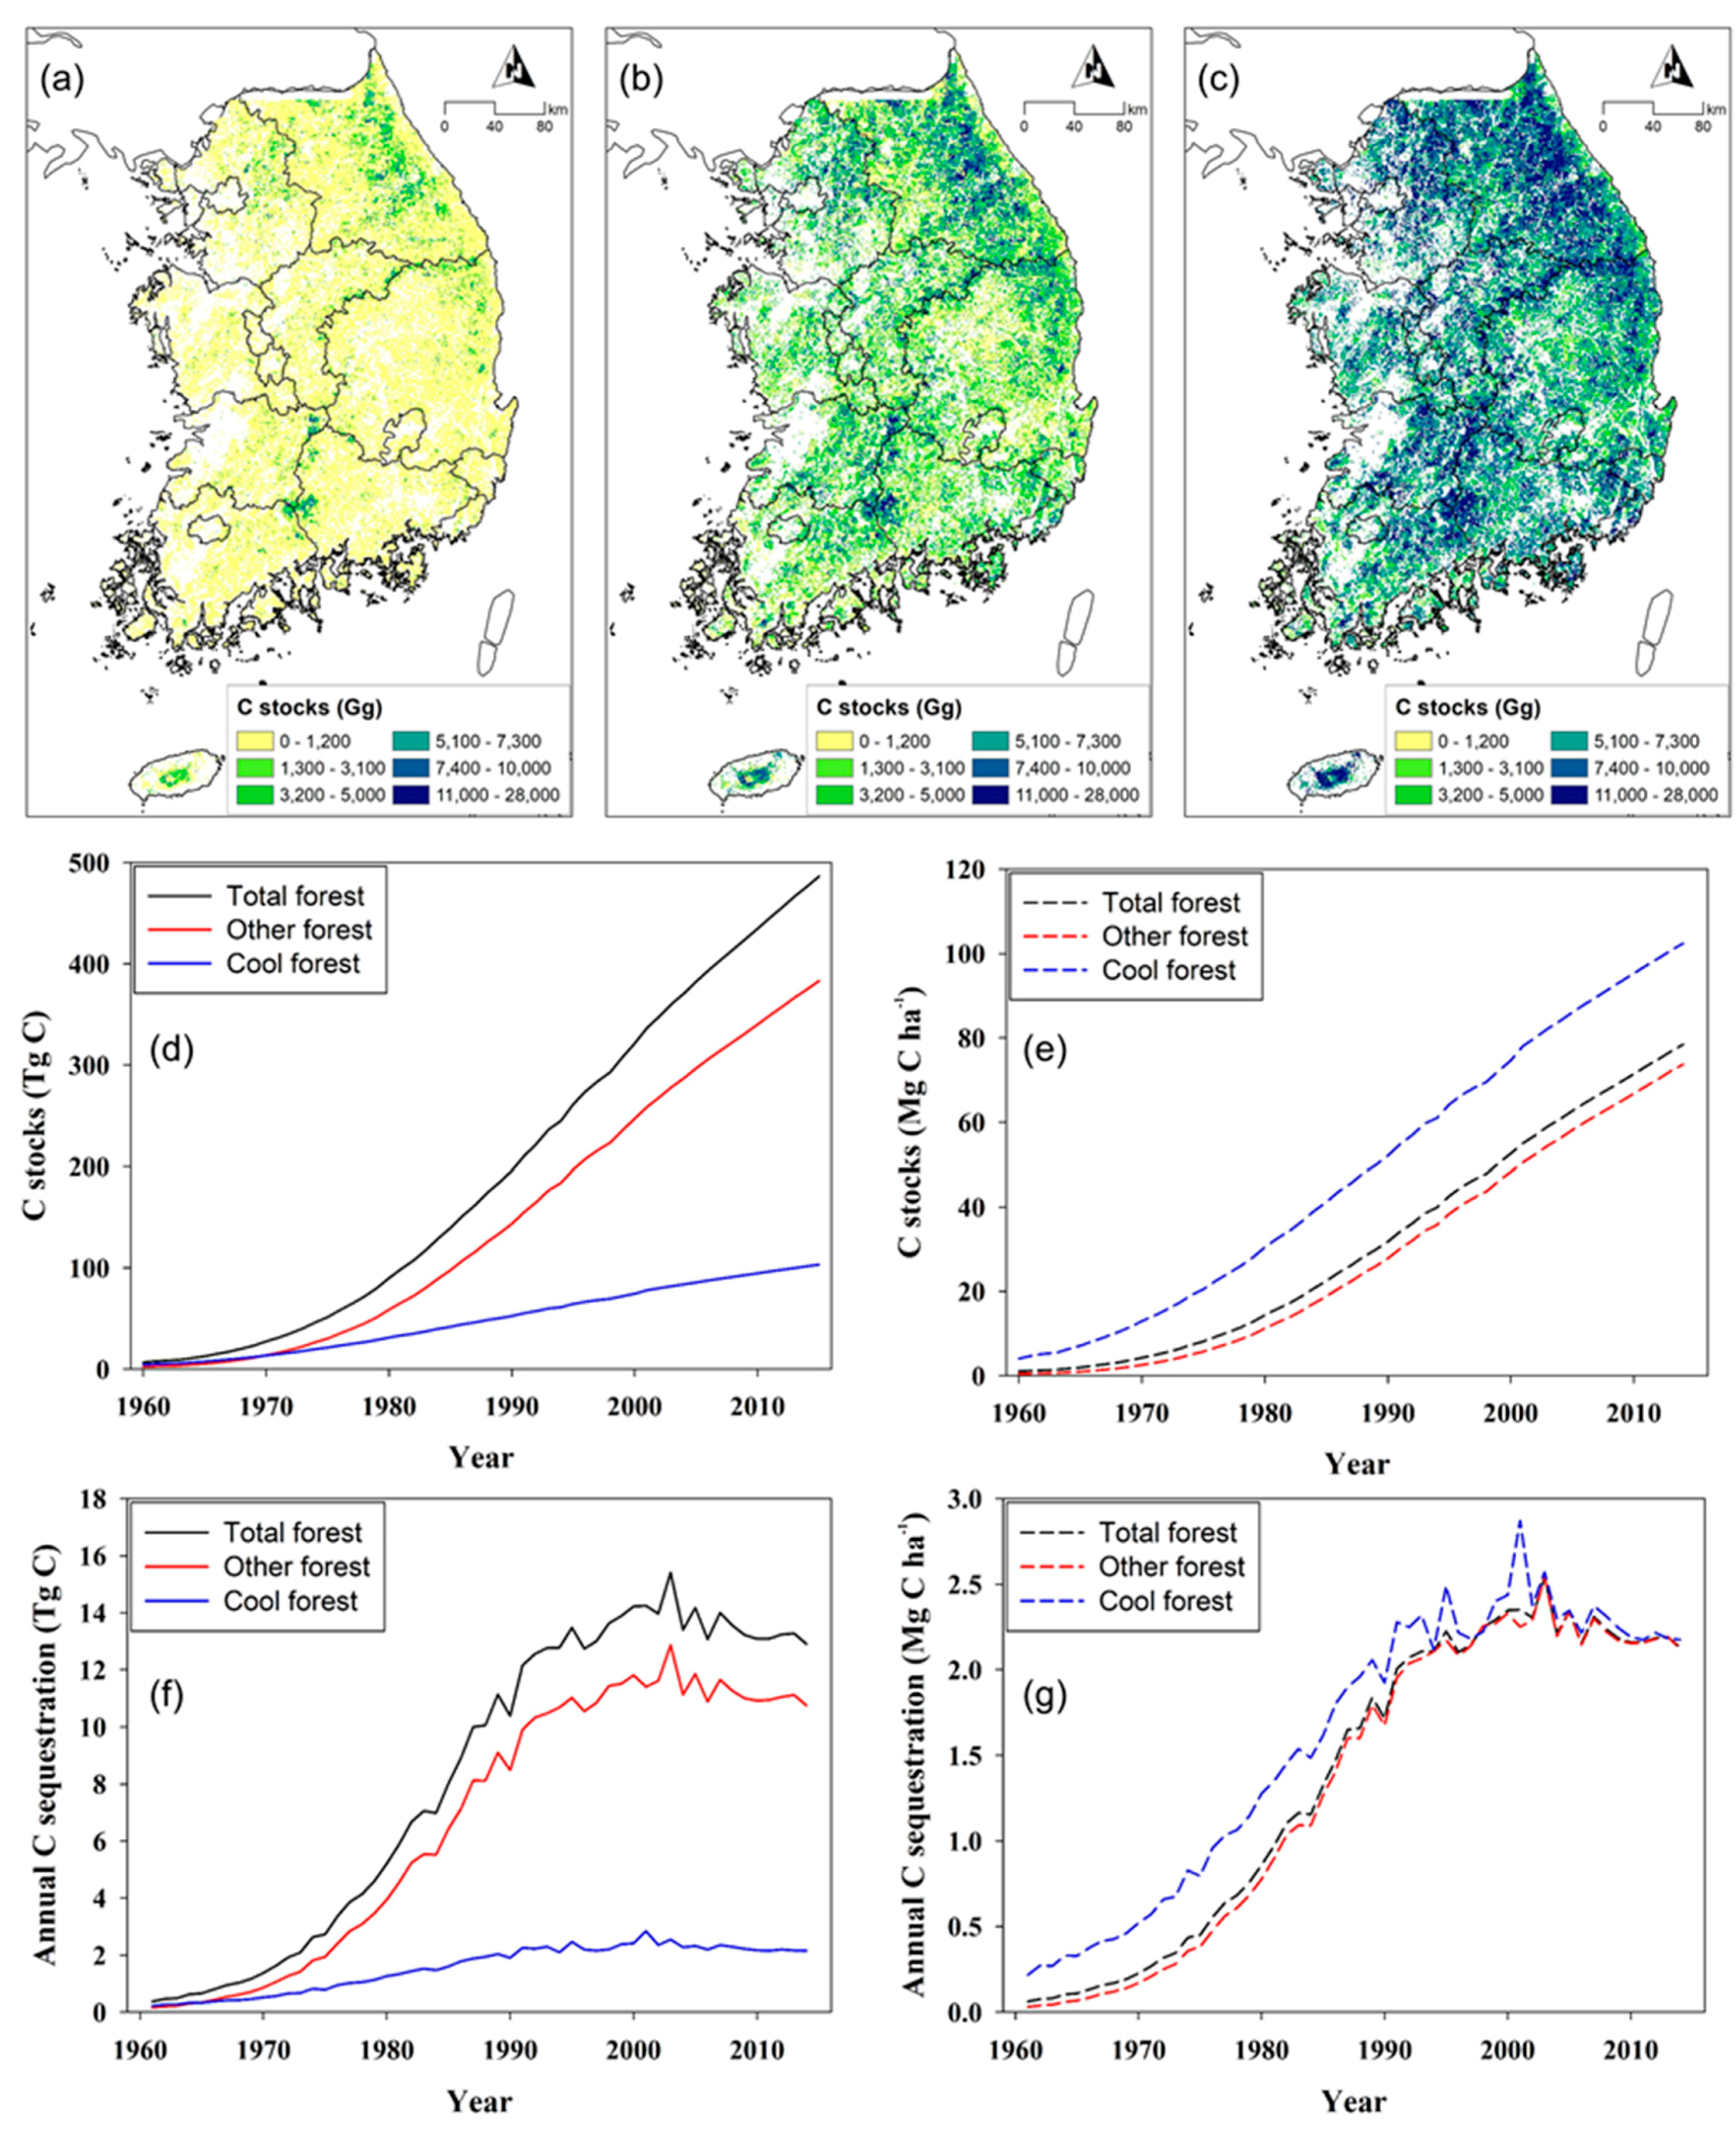
3.1. Stem Volume, C stocks, and Annual C Sequestration

Changes in the C stocks, including stem, branch, and root stocks, of South Korean forests in the years 1961–2014 are depicted in Figure 4. The results of the C stock simulation in this study reflected climatic effects on annual forest dynamic growth on a plot level. As shown in Figure 4a–c, the modeled spatial distribution of the C stocks in forests showed that C stocks tended to increase gradually from the 1960s to the 2000s. The highest C stocks were in the northeast and the center of South Korea (dark pixels). Most of these areas are the Taebaek Mountain Range and the Sobaek Mountain Range. The Sobaek Mountain Range runs from the Taebaek Mountain Range in the northeast to the southwest.
There was an increase in the total C stock of biomass in South Korean forests, from 6.65 Tg C in 1961 to 476.21 Tg C in 2014 (Figure 4d). The effects of national reforestation programs on forest C budget are shown more clearly when C stock is mapped by decade (Figure 4a–c). The C stock of South Korean forests increased from 13.15 Tg C in the 1960s to 135.38 Tg C in the 1980s due to the success of the national-scale forestation program [10]. Averaged over the period from the 1960s to the 1980s, the annual increase in C stock was 6.11 Tg C yr−1. Based on the national statistical data, around one million ha was restored in just six years (1973–1978) [39]. Our simulation estimated that by the 2000s, the C stock had increased drastically to 375.58 Tg at a rate of 12.01 Tg C yr−1. This reflects the high growth rates of the young forest stands and the national sustainable forest management plan. The national focus has shifted since the 1980s from planting to tending trees. This contributes to increased forest values and decreased deforestation activities such as household fuelwood use, illegal logging, and slash-and-burn fields [39]. Although the total C stock of Cool forests has been lower than that of the other forests since the 1970s, the mean C stock (Mg ha−1) and the annual C sequestration (Mg ha−1 yr−1) of Cool forests are still estimated to be higher than those of other forests. Changes in the mean C stock per ha (Mg ha−1) of Cool and other forests in 1960–2014 are depicted in Figure 4e. There were increases in the C stocks of biomass in both Cool and other forests from 4.03 and 0.43 Mg C ha−1, respectively, in 1960 to 102.43 and 73.76 Mg C ha−1 in 2014. The annual C balances from biomass in Cool and other forests were 0.97 and 0.26 Mg C ha−1 yr−1 before the onset of reforestation programs (1960–1973). The annual C balances of biomass in both forest types increased at rates of 2.07 and 1.67 Mg C ha−1 yr−1, respectively, after the onset of those programs (1974–2014). These results imply that the Cool forests have played important roles in C balances, biodiversity, terrestrial ecosystems, and supply ecosystem services of South Korea [14].
The simulation showed that the annual differences in mean C sequestration (Mg ha−1 yr−1) between the Cool forests and other forests started to gradually decrease after the 2000s. In addition, the estimated C sequestration of both Cool and other forests started to gradually decrease after the 2000s. According to both statistical data and model results, the stand age of more than half of South Korean forests reached 40 to 50 after afforestation. This result reflected the decreased growth rates of the aging forests of South Korea. Our model results also show the changes in annual C sequestration of each forest type (Figure 4g). The variations of annual C sequestration in both Cool forests and other forests were estimated to grow steadily after the 1980s. This is linked to recent trends in temperature and precipitation in South Korea. According to previous research, the warming trend of the mean annual maximum and minimum temperatures at most observational stations in South Korea have increased more rapidly after the 1980s than in earlier decades [40,41]. In addition, the phenomenon of a steep decline in C sequestration was observed more frequently during the 2000s than in other times in the model simulation. This result could be partially explained by the annual precipitation used as input data. South Korea has experienced much more frequent and extreme droughts since the late 1990s and early 2000s [42,43]. Accordingly, the annual growth rate and the tree mortality during that period were probably underestimated and overestimated, respectively, in our model. These drought events had a critical impact on South Korea, which led to regional water shortages and influenced the use of water, including for agricultural and household activities [44]. In addition, natural ecosystems were damaged by the drought, and vegetation indices on the national scale were low [33,35,45]. However, in model results, the growth peaks were observed after 2000. This result was because sharply rising temperatures and precipitation were reflected in the model. Both positive (e.g., increased water use efficiency, increases in forest vigor and growth from CO2 fertilization, and longer growing seasons) and negative effects (e.g., increases in stress and mortality due to the combined impacts of climate change and climate-driven changes) of climate change on forests have been observed globally [33,46,47].
The model generally estimated the annual variation in mean C sequestration (Mg C ha−1 yr−1) of the Cool forests as larger than that of other forests during the simulation period. There are two possible explanations for this result. First, based on observed data, the high-elevation areas have been warming faster than other regions in South Korea during the five decades of concern (Figure 1). The differences in warming between the Cool forests and other forests during the simulation period influenced the model results. The other possible reason was a difference in the tree species composition between the Cool forests and other forests. Based on the FCM data used as input, the red pine (Pinus densiflora), the Mongolian oak (Quercus mongolica), and the mixed forests occupied approximately 10.3%, 43.3%, and 26.9%, respectively, of the Cool forest areas. On the other hand, these tree species occupied approximately 36.4%, 9.9%, and 31.3%, respectively, of the other forest areas. According to previous studies for not only South Korea but also worldwide, the impacts of climate change on the patterns of tree growth, mortality, and distribution vary by tree species and region [19,33,35,46,48].

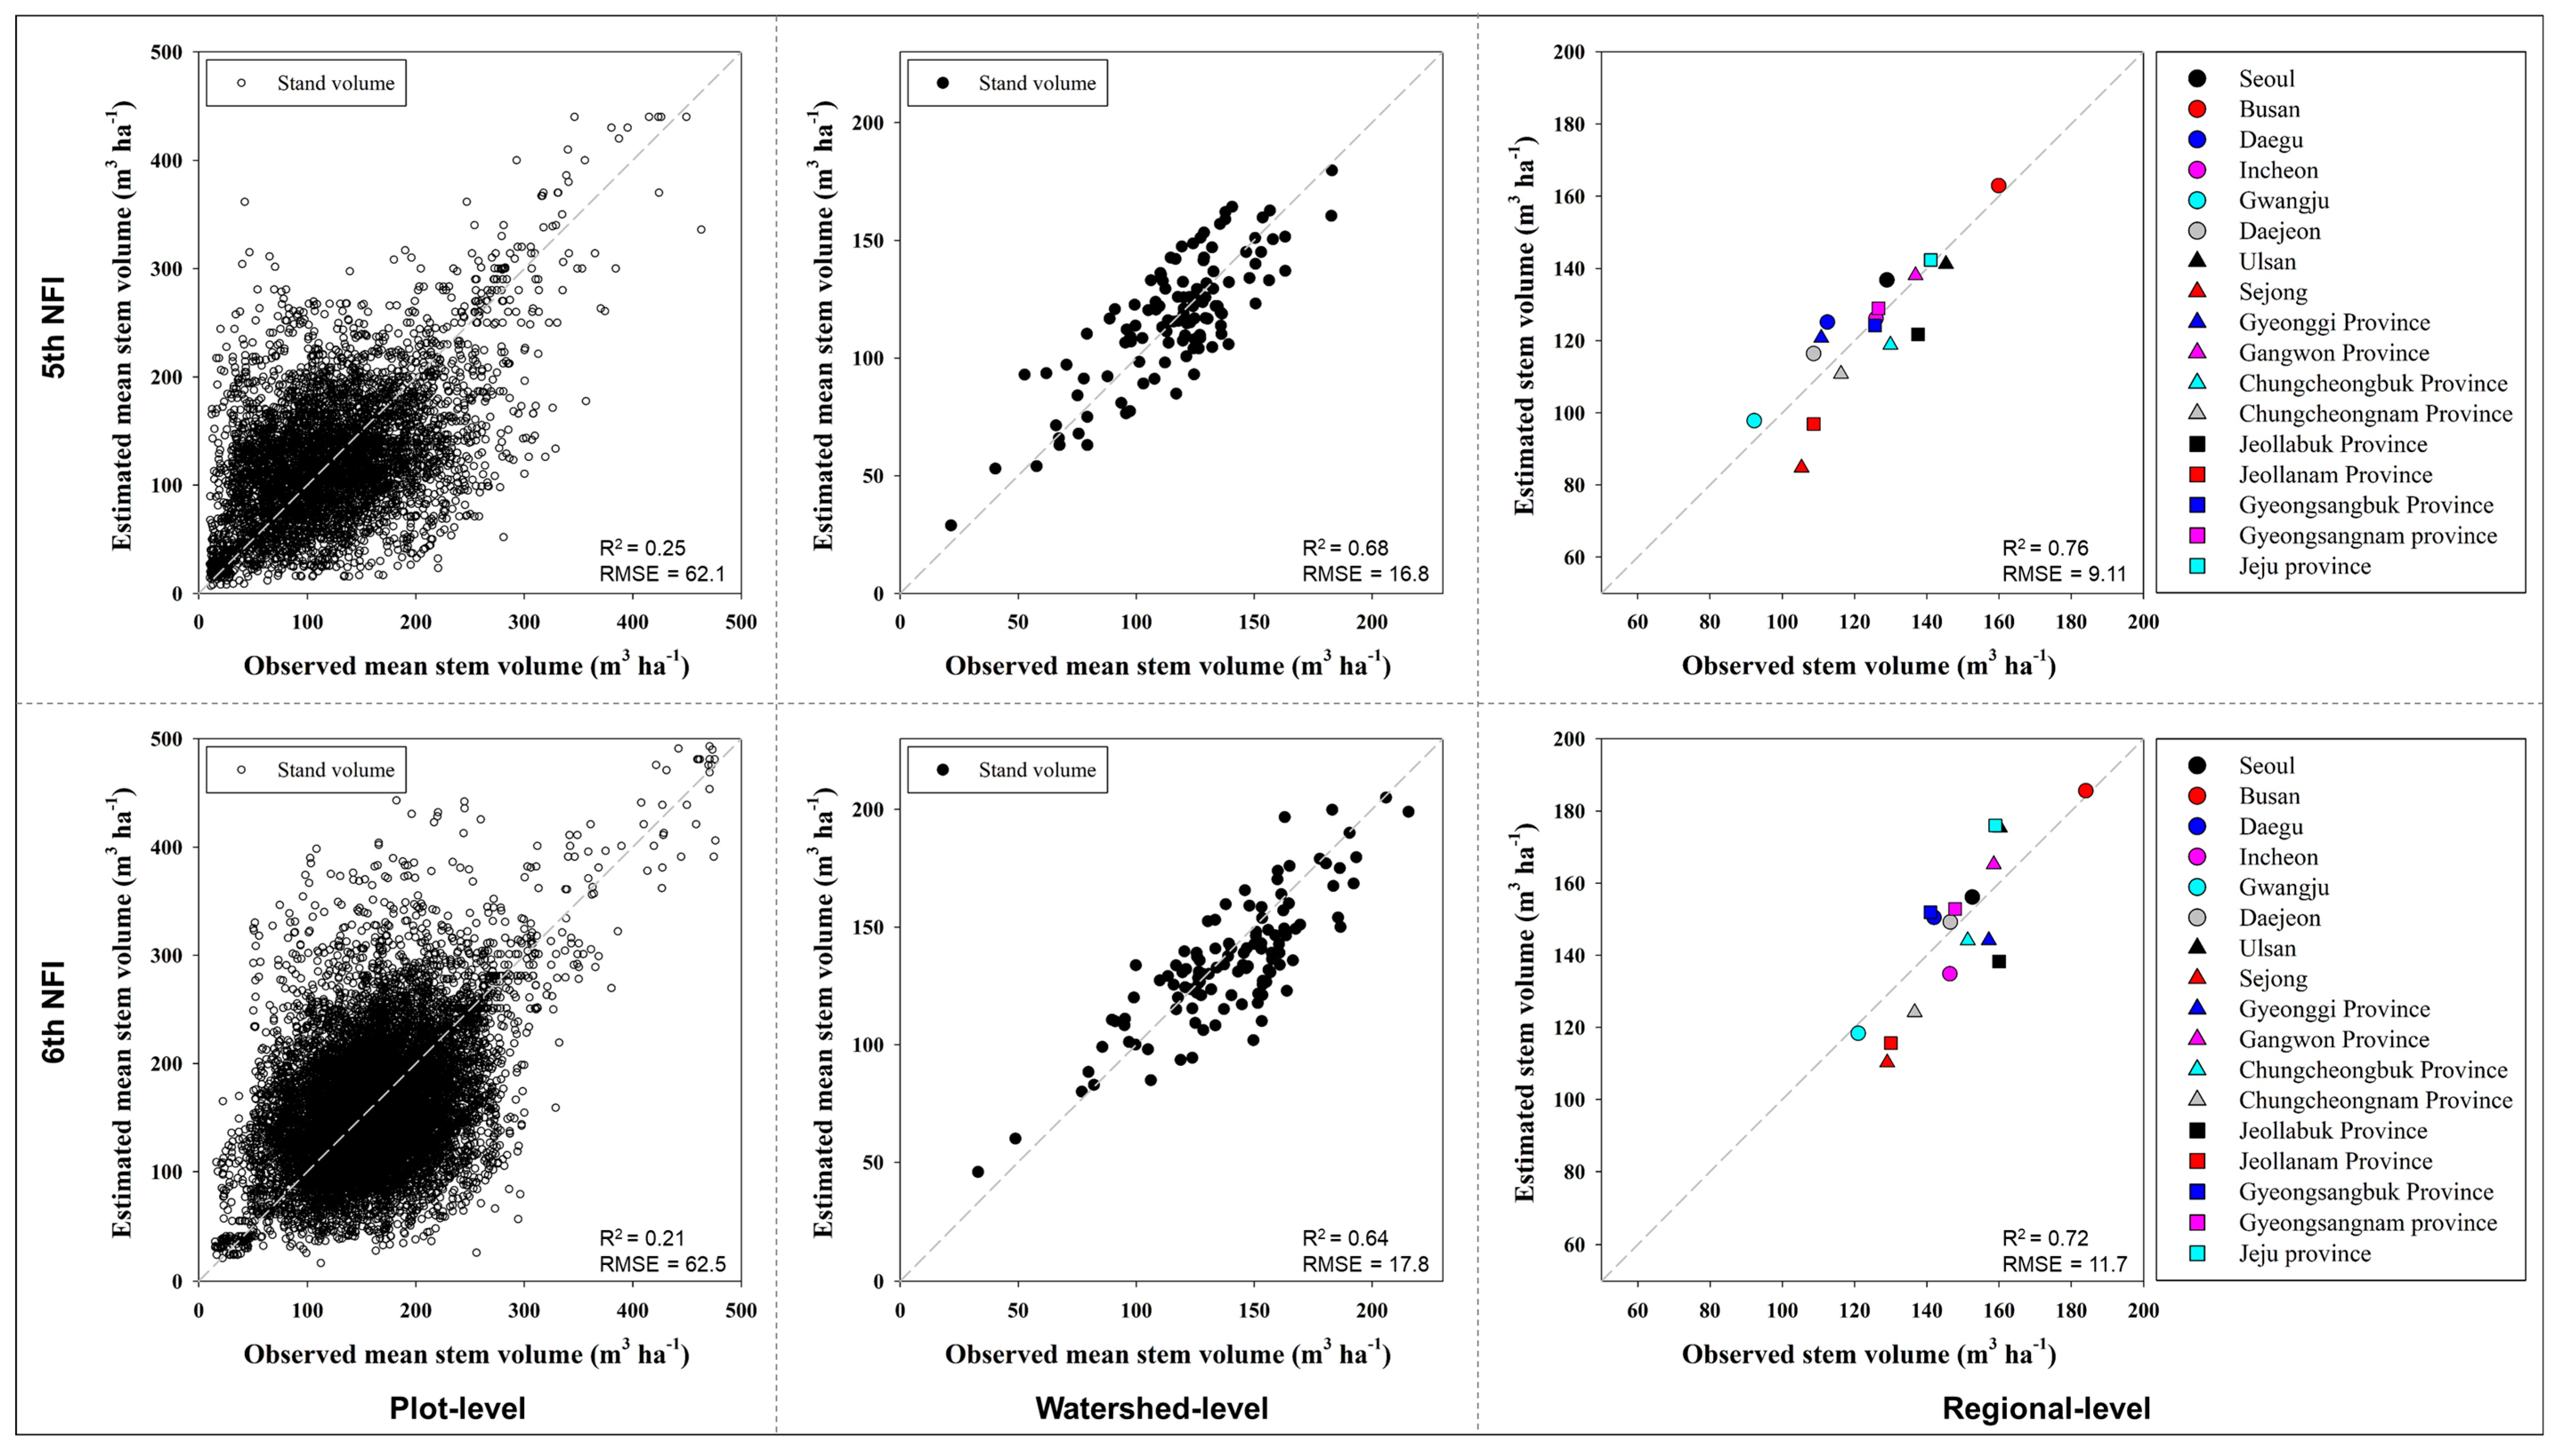
3.2. Model Validation

The estimated stem volumes simulated by the model were compared to the Statistical Yearbook of Forestry [11] and to previous research results from South Korean forests (Table 3). The time sequence of estimated stem volumes showed a trend similar to that of observed stem volumes on a national scale (R2 = 0.96, RMSE = 9.13; Figure 5a). According to the Statistical Yearbook of Forestry [11], the stem volume in South Korean forests increased from 9.6 to 142.2 m3 ha−1 between 1961 and 2014. The simulation showed that it increased from 3.3 to 145.4 m3 ha−1 during that period. As the results were similar, it could be inferred that the model successfully reflected the volume trends of Korean forests, which further suggests successful reconstruction of age distribution at the national scale, while uncertainties remain for individual stands.
The results of this research are consistent with other studies showing a large increase in biomass C stocks after the onset of reforestation programs. However, the mean biomass C density here was slightly higher than in other studies (Table 3). There are two possible reasons for these differences. First, as shown in Figure 5a, the model estimate of stem volume in recent years was higher than the observed stem volume. This caused higher estimates of recent mean biomass C density and stocks and annual C balance. The other possible reason was a difference in the methods of biomass C stock estimation. We estimated the biomass C stocks with species-specific growth functions and the latest BEFs developed by NIFoS [36]. In contrast, Choi and Chang [15] estimated biomass C stocks by multiplying stemwood volume with forest type-specific (coniferous, deciduous, and mixed) and constant BEFs developed from global data. Variable BEFs can overestimate biomass C of a young forest compared to constant BEFs [49]. As South Korean forests are relatively young, the estimates of biomass C stocks of South Korean forests with variable BEFs could be higher than the estimates with constant BEFs. Kim et al. [9] considered clear cut and thinning activities under the KFS law, but our research did not include a certain amount of timber harvest. Therefore, it stands to reason that our result is relatively higher than the previous study [9]. Lee et al. [22] used only plot-level data of the fifth NFI to estimate C budget for the entire forest area. In addition, the impacts of climate change on forest growth were not considered.
To assess model reliability, we compared the model results to observed values at various spatial scales (plot, watershed, and first-tier administrative levels). The estimated R2 for model results in each spatial scale varied greatly (Figure 5b,c). The R2 for plot, watershed, and administrative levels of fifth NFI were estimated at 0.25, 0.64, and 0.76, respectively (Figure 6). The model results of sixth NFI showed a similar pattern but were slightly lower than the R2 for each spatial scale of fifth NFI. Accuracy was poor at plot level but increased when aggregations of cells were evaluated. This is because South Korean forests have highly heterogeneous characteristics among stands, even within a small area. The SD (standard deviation) of four plots’ stem volumes (m3 ha−1) in one permanent plot of the NFI was used as a measure of forest structure heterogeneity in this study. One permanent plot from the Korean NFI consists of four subplots, such as one center plot and three other subplots, with the center subplot in the center of the plot and the three other subplots located 50 m away at azimuths 0°, 120°, and 240° from the center subplot. SD of the stem volume ranged from 0.0 to 165.0 and averaged 36.4 in 2860 plots (Figure 5b,c). The numbers of plots with SD < 40, 40 ≤ SD < 80, 80 ≤ SD < 120, and SD ≥ 120 were 1858 (65.0%), 832 (29.1%), 149 (5.2%), and 21 (0.7%), respectively. There was also a difference in the spatial scale between the estimations and the observed data. The model results represented the mean stem volume of forested areas in 1 km × 1 km grid cells. However, the observed stem volume of each NFI plot was calculated from all trees with at least 6 cm DBH in 0.08 ha with a 16 m radius. This implies that our model results were not useful at the plot level but could be useful at watershed and administrative levels.
Figure 7 shows the ranges of stem volumes in the Cool forests and other forests of South Korea for two time periods. According to the fifth NFI, the sixth NFI, and the model results, the total stem volume of Cool forests was higher than that of other forests. The mean stem volume of the Cool forests and other forests in the fifth NFI were 146.0 (SD: 70.5) and 123.1 m3 ha−1 (SD: 74.4), respectively. After five years, these increased to 170.7 (SD: 77.4, 4.95 Mg ha−1 yr−1) and 147.2 m3 ha−1 (SD: 84.0, 4.82 Mg ha−1 yr−1), respectively, according to sixth NFI data. Our model similarly showed that the estimated mean stem volume of the Cool forests and other forests changed from 149.7 (SD: 57.4) and 122.4 m3 ha−1 (SD: 54.2), respectively, in the period 2006–2010 to 172.5 (SD: 59.6) and 146.7 m3 ha−1 (SD: 57.3) in the period 2011–2015. However, the ranges of forest stem volume differed. As seen in Figure 7, the ranges of the observed stem volume values were wider than the estimated values. One major reason for this result is that the stem volume is a result of complex interactions between numerous factors such as environmental conditions, natural disturbances (disease and insect pests, wind damage, landslides), and observation errors. Another cause is that this study used nationwide forest inventory data that included forests in atypical locations such as urban areas and islands. Therefore, this range discrepancy does not represent an important issue for the reliability of our model. Because the observations and the estimations were similar, it can be inferred that our model appropriately reflected the forest volume and C stock change according to climatic variables on regional and national scales.

3.3. Uncertainty and Implications for Forest Management

In order to measure the function of the forests as a carbon sink, BEFs were used to estimate the carbon content of a whole tree using stem volume as input data. The biomass expansion factors developed by NIFoS [36] are dependent on tree species, which provide a relatively firm basis for quantifying forest carbon stock. The NIFoS report estimated the average uncertainties of basic wood density, biomass expansion factor, root/shoot ratio at 3.6%, 7.0% and 14.9%, respectively. Each coefficient was designed specifically for different tree species and is not influenced by tree size or age. However, according to many previous studies, these coefficients may also depend on site [50], tree size, and age [51]. However, we assumed that all C emission factors had constant values. Our model results reflected these uncertainties. In this study, we assessed only the C stock and the C sequestration in the tree layer; the total estimated forest C stock would be considerably higher if soil C and C in litter and ground vegetation were included. In addition, to enable a more precise and comprehensive assessment of South Korean forest C cycles, important influences on C balance, such as atmospheric CO2 fertilization [52], leaching [53], N deposition [54], and other disturbances [46,55,56], need to be considered. In particular, natural disturbances are integral drivers of forest dynamics and contribute to the diversity and the adaptive capacity of ecosystems. Globally, climatic changes have been identified as a key driver behind increased disturbances in forests, as knowledge about climate change impacts on forests is continuously expanding [57]. Increasing disturbances could strongly impact forest ecosystem services and are suggested to contribute to the recently observed ecosystem functions in forests. Therefore, further research and future forest policies will require a stronger focus on disturbance risk and resilience. These factors must be considered in further research involving predictions of forest C dynamics under climate change and socio-economic scenarios.
Moreover, if substitution effects (such as forest regeneration) from using forest biomass as raw material instead of fossil fuels and carbon stored in wood products had been taken into account, this would also have affected the estimated carbon balance [58]. Climate mitigation effects are dependent on the system boundaries, e.g., the temporal and the spatial scales considered as well as the extents of the life cycles of forest products included in the analysis. For instance, some recent studies indicate that substitution effects and storage of C in harvested wood products may result in higher overall C sequestration on a long-term basis than storing C in the forest would [59]. These issues should be considered in future studies to widen the scope of understanding the effects of forests and forestry on the C balance.
Changes in species distribution, tree range shifts, and amplified tree mortality phenomena observed throughout the world are associated with climate change. Such changes including mortality of indigenous trees, expansion of subtropical forests, and the interactions of drought and insects leading to an increase in tree mortality rates are also seen in Korean forests. Other challenges include forest cultivation and management practices. In the last five decades, forest management practices in South Korea have focused on restoration and conservation activities [39]. Despite the substantial progress made thus far, there is still room for improvement in terms of the disproportionate tree age structure, the decreased annual carbon sequestration, the low self-sufficiency rate for forest resources, and the regulation of the water table. Enhanced forest management strategies need to be set out in light of these challenges lying ahead.

4. Conclusions

The national-scale afforestation program in South Korea is a successful program that has greatly improved the functioning of forest ecosystems. The key findings of this study are summarized as follows. Changes in Cool forests and other forests of South Korea, as defined in the 2018 IBFRA, were estimated for 1961–2014 through a model developed using Korean NFIs, FCM, and climate data. Our results indicated that the developed model accurately described the growing stem volume and the forest biomass C stocks at the watershed and the administrative levels, which are basic units for building public forest management plan. Therefore, the developed model could be useful for building the adaptive and the risk-resilient sustainable forest management in South Korea to cope with climate change. Simulation results showed that the mean C stocks of the Cool forests and other forests changed from 4.03 and 0.43 Mg C ha−1 to 102.43 and 73.76 Mg C ha−1 during the period 1961–2014. These results imply that, although the Cool forests of South Korea were only about 12.3% (772,788 ha) of the total forest area, the Cool forests have played important roles in C balances and the forest ecosystem of South Korea. Another major finding of this study is that Cool forests in South Korea have been identified as more highly sensitive to climate change than other forests. In addition, annual carbon sequestrations are projected to decrease slowly after the 2000s because the overall growth rate of mature forests decreases as stands age. Therefore, the next level of forest management in South Korea should address the following issues: (1) adaptation to climate change through forest management strategies suitable to each region or forest type; (2) maintenance and promotion of annual C sequestration; and (3) focus on development of policies and systems for using forest biomass such as bioenergy production, using raw material instead of fossil fuels for their substitution effects, and storage of C in harvested wood products. The developed model and the results of this study can support the improvement of spatiotemporal forest management strategies to allow for sustainable development of society and to cope with climate change in South Korea.

Supplementary Materials

The following are available online at https://0-www-mdpi-com.brum.beds.ac.uk/1999-4907/10/7/579/s1, Table S1: Coefficients for the dominant tree height equation and stand-level mortality model by the Korea Forest Service [31] and Kim et al. [33].

Author Contributions

Conceptualization, M.K., F.K., Y.S., S.W.J. and W.K.L.; Data curation, B.Y.H., C.H.L., C.S. and M.H.; Formal analysis, M.K.; Funding acquisition, W.K.L; Methodology, M.K., A.S. and W.K.L.; Supervision, F.K., A.S, D.S. and W.K.L; Validation, B.Y.H., C.H.L. and C.S.; Visualization, B.Y.H., C.H.L. and C.S.; Writing – original draft, M.K.; Writing – review & editing, F.K., Y.S., S.W.J, A.S, D.S. and W.K.L.

Funding

This research was supported by Basic Science Research Program through the National Research Foundation of Korea (NRF) funded by the Ministry of Education (NRF-2018R1A6A3A11051238), and was carried out with the support of ´R&D Program for Forest Science Technology (Project No. 2017044B00-1919-BB01) provided by Korea Forest Service (Korea Forestry Promotion Institute). This study was also supported by Korea University Grants, and the Ministry of Environment (MOE) of the Republic of Korea (Project Number: 2014001310008).

Acknowledgments

The authors would like to thank the collaborative research between the Korea University and IIASA-ESM-CLR (International Institute for Applied Systems Analysis-Ecosystem Services and Management-Center for Landscape Resilience and Management). The authors are grateful to the International Boreal Forest Research Association (IBFRA) for encouraging innovation and knowledge-sharing of Cool forests.

Conflicts of Interest

The authors declare no conflict of interest.

References

  1. Costanza, R.; De Groot, R.; Sutton, P.; Van Der Ploeg, S.; Anderson, S.J.; Kubiszewski, I.; Farber, S.; Turner, R.K. Changes in the global value of ecosystem services. Glob. Environ. Chang. 2014, 26, 152–158. [Google Scholar] [CrossRef]
  2. Staudt, P.B.; Tessaro, I.C.; Marczak, L.D.F.; Soares, R.D.P.; Cardozo, N.S.M. A new method for predicting sorption isotherms at different temperatures: Extension to the GAB model. J. Food Eng. 2013, 118, 247–255. [Google Scholar] [CrossRef]
  3. Pimm, S.L.; Jenkins, C.N.; Abell, R.; Brooks, T.M.; Gittleman, J.L.; Joppa, L.N.; Raven, P.H.; Roberts, C.M.; Sexton, J.O. The biodiversity of species and their rates of extinction, distribution, and protection. Science 2014, 344, 1246752. [Google Scholar] [CrossRef] [PubMed]
  4. Ravindranath, N.H.; Chaturvedi, R.K.; Murthy, I.K. Forest conservation, afforestation and reforestation in India: Implications for forest carbon stocks. Curr. Sci. 2008, 95, 216–222. [Google Scholar]
  5. Zhang, K.; Li, X.; Zhou, W.; Zhang, D. Land resource degradation in China: Analysis of status, trends and strategy. Int. J. Sustain. Dev. World Ecol. 2006, 13, 397–408. [Google Scholar] [CrossRef]
  6. Trotter, C.; Tate, K.; Scott, N.; Townsend, J.; Wilde, H.; Lambie, S.; Marden, M.; Pinkney, T. Afforestation/reforestation of New Zealand marginal pasture lands by indigenous shrublands: The potential for Kyoto forest sinks. Ann. For. Sci. 2005, 62, 865–871. [Google Scholar] [CrossRef]
  7. Juhola, S. Mainstreaming climate change adaptation: The case of multi-level governance in Finland. In Developing Adaptation Policy and Practice in Europe: Multi-Level Governance of Climate Change; Springer: Dordrecht, The Netherlands, 2010; pp. 149–187. [Google Scholar]
  8. Food Statistics Pocketbook; Department for Environment, Food and Rural Affairs (DEFRA): London, UK, 2013.
  9. Kim, M.; Lee, W.K.; Kurz, W.A.; Kwak, D.A.; Morken, S.; Smyth, C.E.; Ryu, D. Estimating carbon dynamics in forest carbon pools under IPCC standards in South Korea using CBM-CFS3. IForest 2017, 10, 83–92. [Google Scholar] [CrossRef] [Green Version]
  10. Gregersen, H.M. Village Forestry Development in the Republic of Korea; A Case Study; FAO: Rome, Italy, 1982. [Google Scholar]
  11. Korean Forest Service. Statistical Yearbook of Forestry 2017; Korean Forest Service: Daejeon, Korea, 2017.
  12. Kim, J.H.; Youn, R.H.; Lee, H.J.; Woo, S.; Kim, H.T.; Park, J.J.; Kim, C.R.; Dong, K. Valuation of Nonmarket Forest Resources. J. Korean Inst. For. Recreat. 2012, 46, 9–18. [Google Scholar]
  13. Park, H.; Lee, J.Y.; Song, M. Scientific activities responsible for successful forest greening in Korea Scienti fi c activities responsible for successful forest greening in Korea. For. Sci. Technol. 2017, 13, 1–8. [Google Scholar]
  14. Kim, G.S.; Lim, C.H.; Kim, S.J.; Lee, J.; Son, Y.; Lee, W.K. Effect of national-scale afforestation on forest water supply and soil loss in South Korea, 1971–2010. Sustainability 2017, 9, 1017. [Google Scholar] [CrossRef]
  15. Choi, S.D.; Chang, Y.S. Factors Affecting the Distribution of the Rate of Carbon Uptake by Forests in South Korea. Environ. Sci. Technol. 2004, 38, 484–488. [Google Scholar] [CrossRef] [PubMed]
  16. Korean Forest Service. The 6th National Forest Master Plan 2018–2037; Korean Forest Service: Daejeon, Korea, 2018.
  17. Walther, G.R. Community and ecosystem responses to recent climate change. Philos. Trans. R. Soc. B Biol. Sci. 2010, 365, 2019–2024. [Google Scholar] [CrossRef] [PubMed]
  18. Engler, R.; Randin, C.F.; Thuiller, W.; Dullinger, S.; Zimmermann, N.E.; Araújo, M.B.; Pearman, P.B.; Le Lay, G.; Piedallu, C.; Albert, C.H.; et al. 21st century climate change threatens mountain flora unequally across Europe. Glob. Chang. Biol. 2011, 17, 2330–2341. [Google Scholar] [CrossRef]
  19. Dyderski, M.K.; Paź, S.; Frelich, L.E.; Jagodziński, A.M. How much does climate change threaten European forest tree species distributions? Glob. Chang. Biol. 2018, 24, 1150–1163. [Google Scholar] [CrossRef] [PubMed]
  20. Yoo, S.; Kwak, D.A.; Cui, G.; Lee, W.K.; Kwak, H.; Ito, A.; Son, Y.; Jeon, S. Estimation of the ecosystem carbon budget in South Korea between 1999 and 2008. Ecol. Res. 2013, 28, 1045–1059. [Google Scholar] [CrossRef]
  21. Li, X.; Yi, M.J.; Son, Y.; Jin, G.; Han, S.S. Forest biomass carbon accumulation in Korea from 1954 to 2007. Scand. J. For. Res. 2010, 25, 554–563. [Google Scholar] [CrossRef]
  22. Lee, J.; Yoon, T.K.; Han, S.; Kim, S.; Yi, M.J.; Park, G.S.; Kim, C.; Son, Y.M.; Kim, R.; Son, Y. Estimating the carbon dynamics of South Korean forests from 1954 to 2012. Biogeosciences 2014, 11, 4637–4650. [Google Scholar] [CrossRef] [Green Version]
  23. Fang, J.; Guo, Z.; Hu, H.; Kato, T.; Muraoka, H.; Son, Y. Forest biomass carbon sinks in East Asia, with special reference to the relative contributions of forest expansion and forest growth. Glob. Chang. Biol. 2014, 20, 2019–2030. [Google Scholar] [CrossRef]
  24. Dowon, L.; Hyung, Y.K.; Dongseon, L.; Sinkyu, K.; Hojeong, K.; Hwan, L.J.; Hak, L.K. Changes in annual CO2 fluxes estimated from inventory data in South Korea. Sci. China Ser. C-Life Sci. 2002, 45, 87–96. [Google Scholar]
  25. Lindroth, A.; Grelle, A.; More, A. Long-term measurements of boreal forest carbon balance. Glob. Biogeochem. Cycles 1998, 4, 443–450. [Google Scholar]
  26. Charney, N.D.; Babst, F.; Poulter, B.; Record, S.; Trouet, V.M.; Frank, D.; Enquist, B.J.; Evans, M.E.K. Observed forest sensitivity to climate implies large changes in 21st century North American forest growth. Ecol. Lett. 2016, 19, 1119–1128. [Google Scholar] [CrossRef] [PubMed]
  27. Koo, K.A.; Kong, W.S.; Park, S.U.; Lee, J.H.; Kim, J.; Jung, H. Sensitivity of Korean fir (Abies koreana Wils.), a threatened climate relict species, to increasing temperature at an island subalpine area. Ecol. Modell. 2017, 353, 5–16. [Google Scholar] [CrossRef]
  28. Park, B.; Song, K. Analysis of Climate Change Sensitivity of Forest Ecosystem using MODIS Imagery and Climate Information. J. Korean Assoc. Geogr. Inf. Stud. 2018, 21, 1–18. [Google Scholar]
  29. Yun, J.I.; Choi, J.Y.; Ahn, J.H. Seasonal trend of elevation effect on daily air temperature in Korea. Korean J. Agric. For. Meteorol. 2001, 3, 96–104. [Google Scholar]
  30. National Institute of Forest Science (NIFoS). The 5th National Forest Inventory Report; National Institute of Forest Science: Seoul, Korea, 2013.
  31. Korea Forest Service. Basic Guidelines for Forest Spatial Information System Development Project—1:5000 Production Expanded Forest Type Map; Korea Forest Service: Daejeon, Korea, 2009.
  32. Korea Forest Service. Table of Tree Volume/Mass and Yield Table; Korea Forest Service: Daejeon, Korea, 2009.
  33. Kim, M.; Lee, W.K.; Choi, G.M.; Song, C.; Lim, C.H.; Moon, J.; Piao, D.; Kraxner, F.; Shividenko, A.; Forsell, N. Modeling stand-level mortality based on maximum stem number and seasonal temperature. For. Ecol. Manag. 2017, 386, 37–50. [Google Scholar] [CrossRef] [Green Version]
  34. Piao, D.; Kim, M.; Choi, G.; Moon, J.; Yu, H.; Lee, W.; Wang, S.; Jeon, S.W.; Son, Y.; Son, Y.; et al. Development of an Integrated DBH Estimation Model Based on Stand and Climatic Conditions. Forests 2018, 9, 155. [Google Scholar] [CrossRef]
  35. Kim, M.; Lee, W.K.; Son, Y.; Yoo, S.; Choi, G.M.; Chung, D.J. Assessing the impacts of topographic and climatic factors on radial growth of major forest forming tree species of South Korea. For. Ecol. Manag. 2017, 404, 269–279. [Google Scholar] [CrossRef] [Green Version]
  36. NIFoS. Carbon Emission Factors and Biomass Allometric Equations by Species in Korea; National Institute of Forest Science: Seoul, Korea, 2014.
  37. Nam, K.; Lee, W.K.; Kim, M.; Kwak, D.A.; Byun, W.H.; Yu, H.; Kwak, H.; Kwon, T.; Sung, J.; Chung, D.J.; et al. Spatio-temporal change in forest cover and carbon storage considering actual and potential forest cover in South Korea. Sci. China Life Sci. 2015, 58, 713–723. [Google Scholar] [CrossRef] [Green Version]
  38. Jingyun, F.; Anping, C.; Changhui, P.; Shuqing, Z.; Longjun, C. Changes in forest biomass carbon storage in China between 1949 and 1998. Science 2001, 292, 2320–2322. [Google Scholar]
  39. Bae, J.S.; Lee, K.H.; Lee, Y.G.; Youn, H.J.; Park, C.R.; Choi, H.T.; Kim, T.G. Lessons Learned from the Republic of Korea’s National Reforestation Programme; Korea Forest Service: Daejeon, Korea, 2014.
  40. Jung, H.S.; Choi, Y.; Oh, J.H.; Lim, G.H. Recent trends in temperature and precipitation over South Korea. Int. J. Climatol. 2002, 22, 1327–1337. [Google Scholar] [CrossRef]
  41. Chung, Y.S.; Yoon, M.B.; Kim, H.S. On climate variations and changes observed in South Korea. Clim. Chang. 2004, 66, 151–161. [Google Scholar] [CrossRef]
  42. Lee, J.; Kwon, H.; Jang, H.; Kim, T. Future Changes in Drought Characteristics under Extreme Climate Change over South Korea. Adv. Meteorol. 2016, 2016, 9164265. [Google Scholar] [CrossRef]
  43. Kyoung, M.; Kwak, J.; Kim, D.; Kim, H.; Singh, V.P. Drought analysis based on SPI and SAD curve for the korean peninsula considering climate change. In Climate Change-Geophysical Foundations and Ecological Effects; IntechOpen: Rijeka, Croatia, 2011. [Google Scholar]
  44. Korea Meteorological Administration. Annual Climate Report 2001; Korea Meteorological Administration: Seoul, Korea, 2001.
  45. Park, J.S.; Kim, K.T.; Choi, Y.S. Application of vegetation condition index and standardized vegetation index for assessment of spring drought in South Korea. In Proceedings of the International Geoscience and Remote Sensing Symposium (IGARSS), Boston, MA, USA, 6–11 July 2008; Volume 3, pp. 774–777. [Google Scholar]
  46. Allen, C.D.; Macalady, A.K.; Chenchouni, H.; Bachelet, D.; Mcdowell, N.; Vennetier, M.; Kitzberger, T.; Rigling, A.; Breshears, D.D.; Hogg, E.H.T.; et al. Forest Ecology and Management A global overview of drought and heat-induced tree mortality reveals emerging climate change risks for forests. For. Ecol. Manag. 2010, 259, 660–684. [Google Scholar] [CrossRef]
  47. Lloyd, A.H.; Bunn, A.G. Responses of the circumpolar boreal forest to 20th century climate variability. Environ. Res. Lett. 2007, 2, 045013. [Google Scholar] [CrossRef]
  48. Schneider, R.R.; Hamann, A.; Farr, D.; Wang, X.; Boutin, S. Potential effects of climate change on ecosystem distribution in Alberta. Can. J. For. Res. 2009, 39, 1001–1010. [Google Scholar] [CrossRef] [Green Version]
  49. NIFoS. Study on the Basis of Forest Carbon Accounting in Korea; National Institute of Forest Science: Seoul, Korea, 2010.
  50. Wirth, C.; Schumacher, J.; Schulze, E.D. Generic biomass functions for Norway spruce in Central Europe--a meta-analysis approach toward prediction and uncertainty estimation. Tree Physiol. 2004, 24, 121–139. [Google Scholar] [CrossRef] [Green Version]
  51. Teobaldelli, M.; Somogyi, Z.; Migliavacca, M.; Usoltsev, V.A. Generalized functions of biomass expansion factors for conifers and broadleaved by stand age, growing stock and site index. For. Ecol. Manag. 2009, 257, 1004–1013. [Google Scholar] [CrossRef]
  52. Bellassen, V.; Viovy, N.; Luyssaert, S.; Le Maire, G.; Schelhaas, M.J.; Ciais, P. Reconstruction and attribution of the carbon sink of European forests between 1950 and 2000. Glob. Chang. Biol. 2011, 17, 3274–3292. [Google Scholar] [CrossRef]
  53. Luyssaert, S.; Ciais, P.; Piao, S.L.; Schulze, E.D.; Jung, M.; Zaehle, S.; Schelhaas, M.J.; Reichstein, M.; Churkina, G.; Papale, D.; et al. The European carbon balance. Part 3: Forests. Glob. Chang. Biol. 2010, 16, 1429–1450. [Google Scholar] [CrossRef]
  54. Fischer, R.; Aas, W.; de Vries, W.; Clarke, N.; Cudlin, P.; Leaver, D.; Lundin, L.; Matteucci, G.; Matyssek, R.; Mikkelsen, T.N.; et al. Towards a transnational system of supersites for forest monitoring and research in Europe—An overview on present state and future recommendations. IForest 2011, 4, 167–171. [Google Scholar] [CrossRef]
  55. Wiechmann, M.L.; Hurteau, M.D.; North, M.P.; Koch, G.W.; Jerabkova, L. The carbon balance of reducing wildfire risk and restoring process: An analysis of 10-year post-treatment carbon dynamics in a mixed-conifer forest. Clim. Chang. 2015, 132, 709–719. [Google Scholar] [CrossRef]
  56. Pearson, T.R.H.; Brown, S.; Murray, L.; Sidman, G. Greenhouse gas emissions from tropical forest degradation: An underestimated source. Carbon Balance Manag. 2017, 12, 3. [Google Scholar] [CrossRef] [PubMed]
  57. Seidl, R.; Thom, D.; Kautz, M.; Martin-Benito, D.; Peltoniemi, M.; Vacchiano, G.; Wild, J.; Ascoli, D.; Petr, M.; Honkaniemi, J.; et al. Forest disturbances under climate change. Nat. Clim. Chang. 2017, 7, 395–402. [Google Scholar] [CrossRef] [PubMed] [Green Version]
  58. Gustavsson, L.; Pingoud, K.; Sathre, R. Carbon dioxide balance of wood substitution: Comparing concrete- and wood-framed buildings. Mitig. Adapt. Strateg. Glob. Chang. 2006, 11, 667–691. [Google Scholar] [CrossRef]
  59. Gustavsson, L.; Haus, S.; Lundblad, M.; Lundström, A.; Ortiz, C.A.; Sathre, R.; Le Truong, N.; Wikberg, P.E. Climate change effects of forestry and substitution of carbon-intensive materials and fossil fuels. Renew. Sustain. Energy Rev. 2017, 67, 612–624. [Google Scholar] [CrossRef]
Figure 1. (a) Study area and its (b) elevation map and (c) forest area map. (d) Annual mean temperature (left) and annual precipitation (right) for South Korean forests. Cool forests were defined as forests at elevations above 700 m in the temperate zone based on the 2018 International Boreal Forest Research Association (IBFRA) Conference. T: annual mean temperature, P: annual precipitation.
Forests 10 00579 g001
Figure 2. (a) Locations of National Forest Inventory (NFI) plots from which data were obtained. (b,c) Estimated site index and stand age distribution in 2010 of South Korean forests using the fifth NFI data and 1:5000 forest cover map (FCM). The distribution of (d) age classes in the FCM and (e) estimated stand age using the FCM and fifth NFI.
Forests 10 00579 g002
Figure 3. (a) Administrative boundaries of South Korea and an example of administrative-level spatial data for model validation. (b) Watershed boundaries of South Korea and an example of watershed-level and plot-level spatial data for model validation.
Forests 10 00579 g003
Figure 4. (ac) Estimated forest carbon stock distribution in South Korea during the 1960s, the 1980s, and the 2000s. (d,e) Time series of total (Tg C) and mean C stocks (Mg C ha−1) for three categories in South Korean forests during the simulation period. (f,g) Time series of total (Tg C) and mean annual C sequestration (Mg C ha−1) for three categories in South Korean forests during the simulation period.
Forests 10 00579 g004
Figure 5. (a) Time series of the estimated and the observed (statistical data) mean stem volumes in South Korean forests during the simulation period. Distribution of standard deviations in observed stem volume of sub-plots within permanent plots from the (b) fifth and the (c) sixth Korean National Forest Inventory (NFI) data.
Forests 10 00579 g005
Figure 6. Observed and estimated stem volumes (m3 ha−1) at plot, watershed, and administrative levels.
Forests 10 00579 g006
Figure 7. Distribution plots of estimated and observed forest stem volume (m3 ha−1) for Cool forests and other forests. The fifth and the sixth National Forest Inventory data corresponded to the estimated mean values in 2005–2010 and 2011–2015. For each box plot, the top circle is the 95th percentile, the lower circle is the fifth percentile, the top bar is the 90th percentile, the lower bar is the 10th percentile, the top of the box is the upper or the third quartile, the bottom of the box is the lower or the first quartile, and the middle bar is the median value.
Forests 10 00579 g007
Table 1. Coefficients for stem volume equations and carbon emission factors by tree species, developed by the National Institute for Forest Science [36]. The coefficients for each tree species were applied to both Cool and other forests.
Tree SpeciesStem Biomass EquationCarbon Equation
abcBasic Wood DensityBiomass Expansion FactorRoot/Shoot Ratio
Pinus densiflora0.0341.7341.0250.4721.4130.254
Pinus koraiensis0.0461.7320.8960.4081.8120.283
Larix kaempferi0.0052.4580.9040.4531.3350.291
Quercus variabilis0.0531.8100.8810.7211.3380.324
Quercus mongolica0.0981.4061.1350.6631.6030.388
Table 2. Descriptive statistics of validation data by spatial level.
FactorsSpatial Level (Std. dev.)
PlotWatershed BoundaryAdministrative Boundary
No. of sample3892 (n/a)102 (n/a)17 (n/a)
Mean area (ha)0.24 (n/a )93,514 (61,244)590,374 (620,349)
Mean stem volume (m3 ha−1) of
fifth NFI and sixth NFI
125.8 (74.8),
149.9 (84.7)
118.3 (25.8),
142.3 (28.3)
124.9 (15.7),
149.1 (18.7)
Table 3. Comparison of living biomass carbon (C) densities of South Korean forests estimated in this study with those found in previous studies.
CategoryYear or PeriodModelEstimateReference
Mean C density
(Mg C ha−1)
2001Statistical
model
34.4Choi and Chang [15]
KFSC39.7Lee et al. [22]
CBM-CFS334.1Kim et al. [9]
This study42.1This study
2010CBM-CFS368.0Kim et al. [9]
This study67.5This study

