Article

Spatiotemporal Simulation of Net Ecosystem Productivity and Its Response to Climate Change in Subtropical Forests

1
State Key Laboratory of Subtropical Silviculture, Zhejiang A & F University, Hangzhou 311300, China
2
Key Laboratory of Carbon Cycling in Forest Ecosystems and Carbon Sequestration of Zhejiang Province, Zhejiang A & F University, Hangzhou 311300, China
3
School of Environmental and Resources Science, Zhejiang A & F University, Hangzhou 311300, China
*
Author to whom correspondence should be addressed.
Submission received: 8 July 2019 / Revised: 15 August 2019 / Accepted: 17 August 2019 / Published: 20 August 2019
(This article belongs to the Collection Forests Carbon Fluxes and Sequestration)

Abstract

:
Subtropical forests have great potential as carbon sinks; however, the relationship between net ecosystem productivity (NEP) and climate change is still unclear. This study took Zhejiang Province, a subtropical region, as an example. Based on remote sensing classification data of forest resources, the integrated terrestrial ecosystem carbon cycle (InTEC) model was used to simulate the spatiotemporal dynamics of the forest NEP in Zhejiang Province during 1985–2015 and analyze its response to meteorological factors such as temperature, precipitation, relative humidity, and radiation. Three patterns emerged: (1) The optimized InTEC model can better simulate the forest NEP in Zhejiang Province, and the correlation coefficient between the simulated NEP and observed NEP was up to 0.75. (2) From 1985 to 2015, the increase in the total NEP was rapid, with an average annual growth rate of 1.52 Tg·C·yr−1. During 1985–1988, the forests in Zhejiang Province were carbon sources. After 1988, the forests turned into carbon sinks and this continued to increase. During 2000–2015, more than 97% of the forests in Zhejiang Province were carbon sinks. The total NEP reached 32.02 Tg·C·yr−1, and the annual mean NEP increased to 441.91 gC·m−2·yr−1. The carbon sequestration capacity of forests in the east and southwest of Zhejiang Province is higher than that in the northeast of Zhejiang Province. (3) From 2000 to 2015, there was an extremely significant correlation between forest NEP and precipitation, with a correlation coefficient of 0.85. Simultaneously, the forest NEP showed a negative correlation with temperature and radiation, with a correlation coefficient of −0.56 for both, and the forest NEP was slightly negatively correlated with relative humidity. The relative contribution rates of temperature, precipitation, relative humidity, and radiation data to NEP showed that the contribution of precipitation to NEP is the largest, reaching 61%, followed by temperature and radiation at 18% and 17%, respectively. The relative contribution rate of relative humidity is the smallest at only 4%. During the period of 1985–1999, due to significant man-made disturbances, the NEP had a weak correlation with temperature, precipitation, relative humidity, and radiation. The results of this study are important for addressing climate change and illustrating the response mechanism between subtropical forest NEP and climate change.

1. Introduction

Net ecosystem productivity (NEP) represents the net primary productivity minus the photosynthetic carbon product consumed by heterotrophic respiration and is an important feature of the carbon cycle of forest ecosystems. Given that carbon can also be sent to the atmosphere via combustion, NEP can underestimate the total exchange between the forest and atmosphere when disturbances associated with combustion occur. Further, NEP does not account for the fate of carbon removed from forests via harvest, erosion, or leaching. Nonetheless, NEP is an important component of the net carbon exchange between terrestrial ecosystems and the atmosphere. In recent years, research on forest ecosystem NEP has attracted more and more attention [1,2,3,4]. However, the relationship between the spatiotemporal patterns of NEP and climate change remains uncertain [5,6,7,8]. The impact of climate change on the spatiotemporal patterns of NEP is different in different regions [3,7,9]. Therefore, it is important to precisely simulate forest ecosystem NEP and analyze its response to environmental factors.
There are many research methods for carbon budgets in forest ecosystems including sample plots [10], micrometeorology [11], remote sensing [12], and simulation models [13]. Model simulation is an important method to study forest ecosystem NEP. Commonly used models include the empirical model, parametric model, and process model [14]. Process models such as integrated terrestrial ecosystem carbon cycle (InTEC), boreal ecosystem productivity simulator (BEPS), biome biogeochemical cycles model (BIOME-BGC), and so forth are based on developing an understanding of ecosystems by simulating the effects of biological processes such as canopy photosynthesis, absorption, transpiration, and soil moisture on net primary productivity (NPP) to reveal the growth of biomass, the interaction of vegetation with environment, and the response mechanism of ecosystems to climate change [15]. Therefore, process model results are more reliable than those of other models. On the other hand, due to the advantages of stability and reliability of repeated measurements, as well as wide-scale and even global coverage, remote sensing technology is one of the most important macroscopic research methods of the carbon cycle [16]. Therefore, remote sensing technology combined with process models, with the advantage of reflecting both the ecological and physiological processes of vegetation, can achieve large-scale simulation of the carbon cycle process, reflect the spatial distribution and dynamic changes of the carbon cycle at regional and even global scales, and effectively solve the problems of spatiotemporal heterogeneity and scale complexity of forest ecosystems, which greatly improves the reliability of terrestrial vegetation carbon cycle estimation [8,17,18].
Based on the physiological and biochemical processes of the carbon cycle, InTEC model takes the effects of forest disturbances and changes in forest age into consideration. Forest age has a very important impact on the productivity of forest ecosystems [19,20], which makes InTEC one of the most advanced models to simulate the spatiotemporal changes of forest ecosystem NEP. Furthermore, the InTEC model can reconstruct the characteristics and driving mechanisms of carbon cycling in past forests and predict the spatiotemporal evolution of carbon cycles in the future [21]. The InTEC model is an integrated model of terrestrial ecosystem carbon cycles which combines the Farquhar photosynthetic model [22], the canopy radiation transfer model, the CENTURY soil model [23], the nitrogen cycle model, the net nitrogen mineralization model of Townsend et al. [24], and the NPPage model [25,26]. This model calculates the long-term trend of the forest carbon cycle by iterations based on the characteristics of NPPage, forest age, and NPP in the reference year, and comprehensively takes the impacts of climate change, CO2 concentration rise, forest disturbances, and nitrogen deposition on the carbon cycle into consideration.
The InTEC model has been used extensively in research. For example, Chen et al. [26] used the InTEC model to estimate the carbon balance of Canada. Shao et al. [27] used the InTEC model to estimate the soil organic carbon density of the Chinese forest ecosystem. Zhou et al. [28] used the InTEC model to simulate the carbon storage changes of the Poyang Lake area. Wu et al. [29] used the InTEC model to reconstruct the interannual variation of NEP at the site scale. Zhang et al. [30] used the InTEC model to estimate the carbon changes of US forests.
Subtropical forest ecosystem total net ecosystem productivity in the East Asian monsoon region is about 720 million tons of carbon per year or about 8% of the global NEP; it plays an important role in the global carbon cycle and has challenged the traditional understanding that temperate forests in Europe and America are the main carbon sink functional areas [31,32,33]. China is an important distribution region of subtropical forests, while Zhejiang Province is located on the northern edge of the subtropical zone and plays an important role in the carbon balance of the regional forest ecosystems. In addition, the arbor forests in Zhejiang Province are still dominated by young and middle-aged forests, and changes in their age will impact the carbon cycle and the future evolution of regional forest ecosystems. Therefore, this study takes the main forest type in Zhejiang Province as our study target, based on forest resources extracted from remote sensing information, and uses the InTEC model to simulate the forest ecosystem NEP in Zhejiang Province. We analyze its spatiotemporal evolution pattern of NEP, and its response to meteorological factors such as temperature, precipitation, relative humidity, and radiation. The findings have important scientific implications for addressing climate change in subtropical forest ecosystems.

2. Study Area and Method
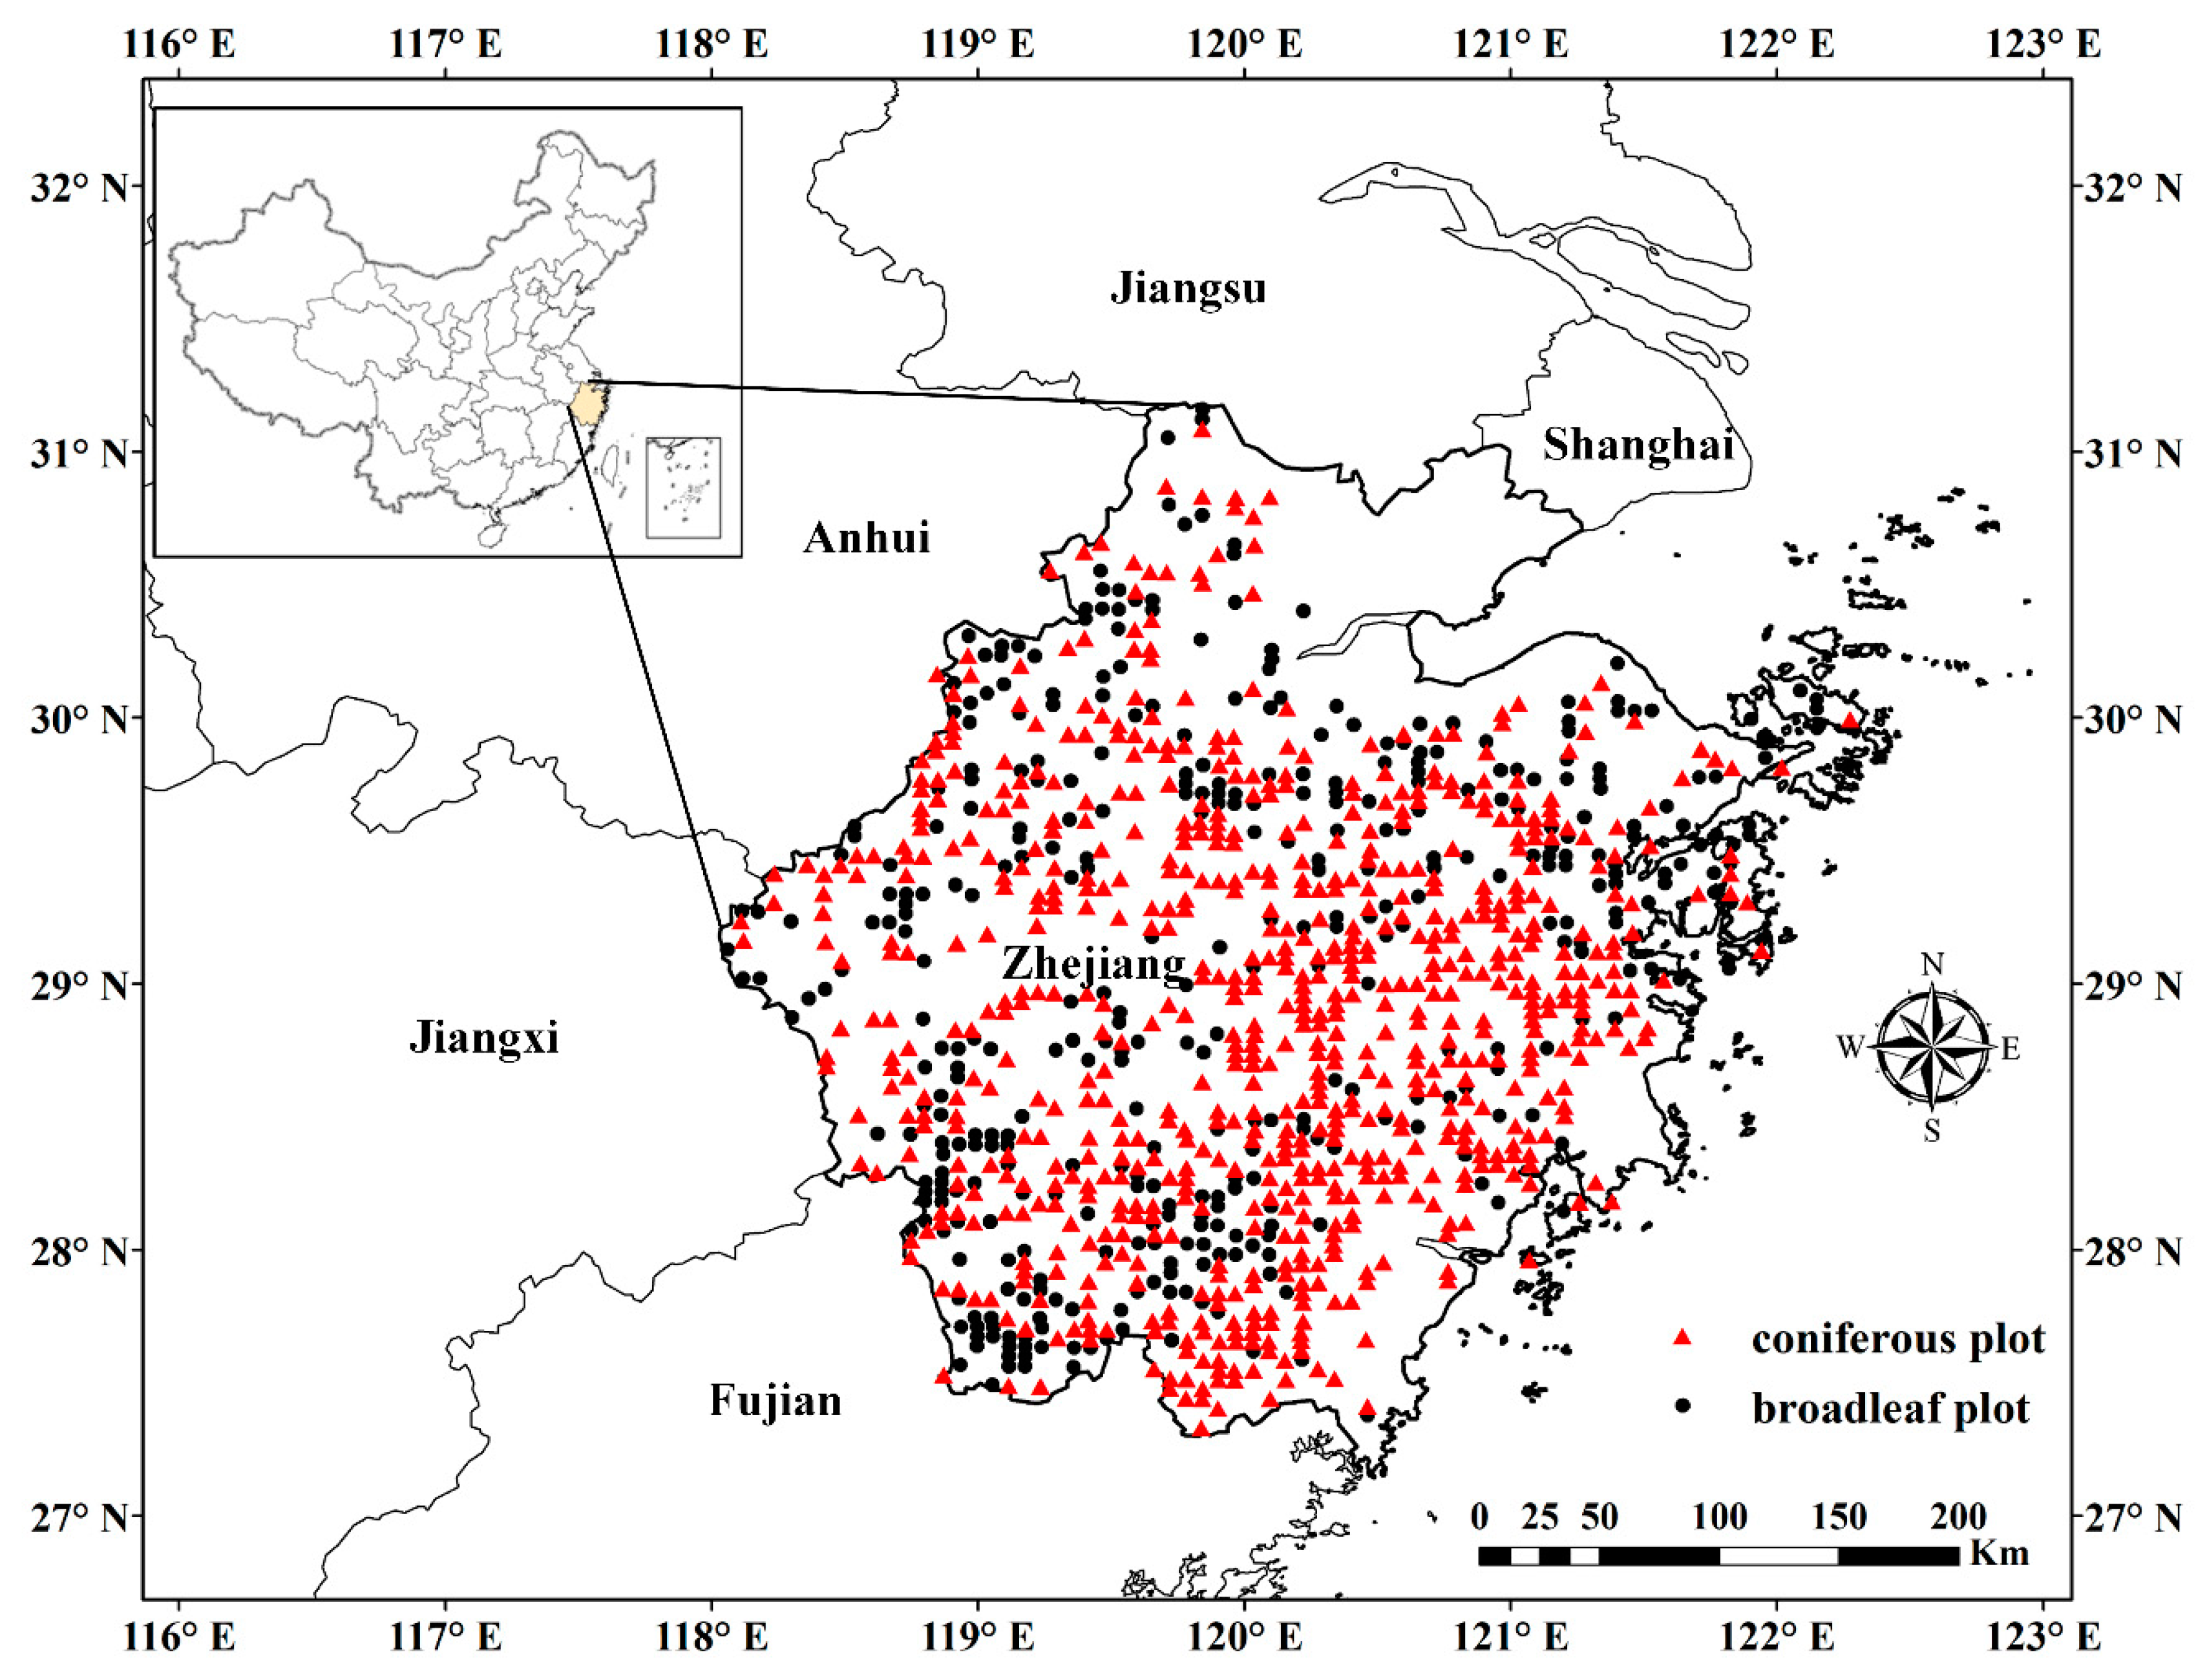
2.1. Study Area

Zhejiang province is located on the southeast coast of China, Southern Yangtze River Delta (118°01′–123°08′ E, 27°01′–31°10′ N) (Figure 1). The terrain presents a stepped slope from southwest to northeast. The southwest is dominated by mountains, the central part is dominated by hills, and the northeast is plains. Zhejiang Province has a subtropical monsoon climate, annual precipitation is 980~2000 mm, annual sunshine hours are 1710–2100 h, and the annual mean temperature is 15–18 °C. The soil types are mainly red soil and yellow soil, and the main forest types are coniferous, broadleaf, and bamboo forest, with a forest coverage rate of 60.5%.

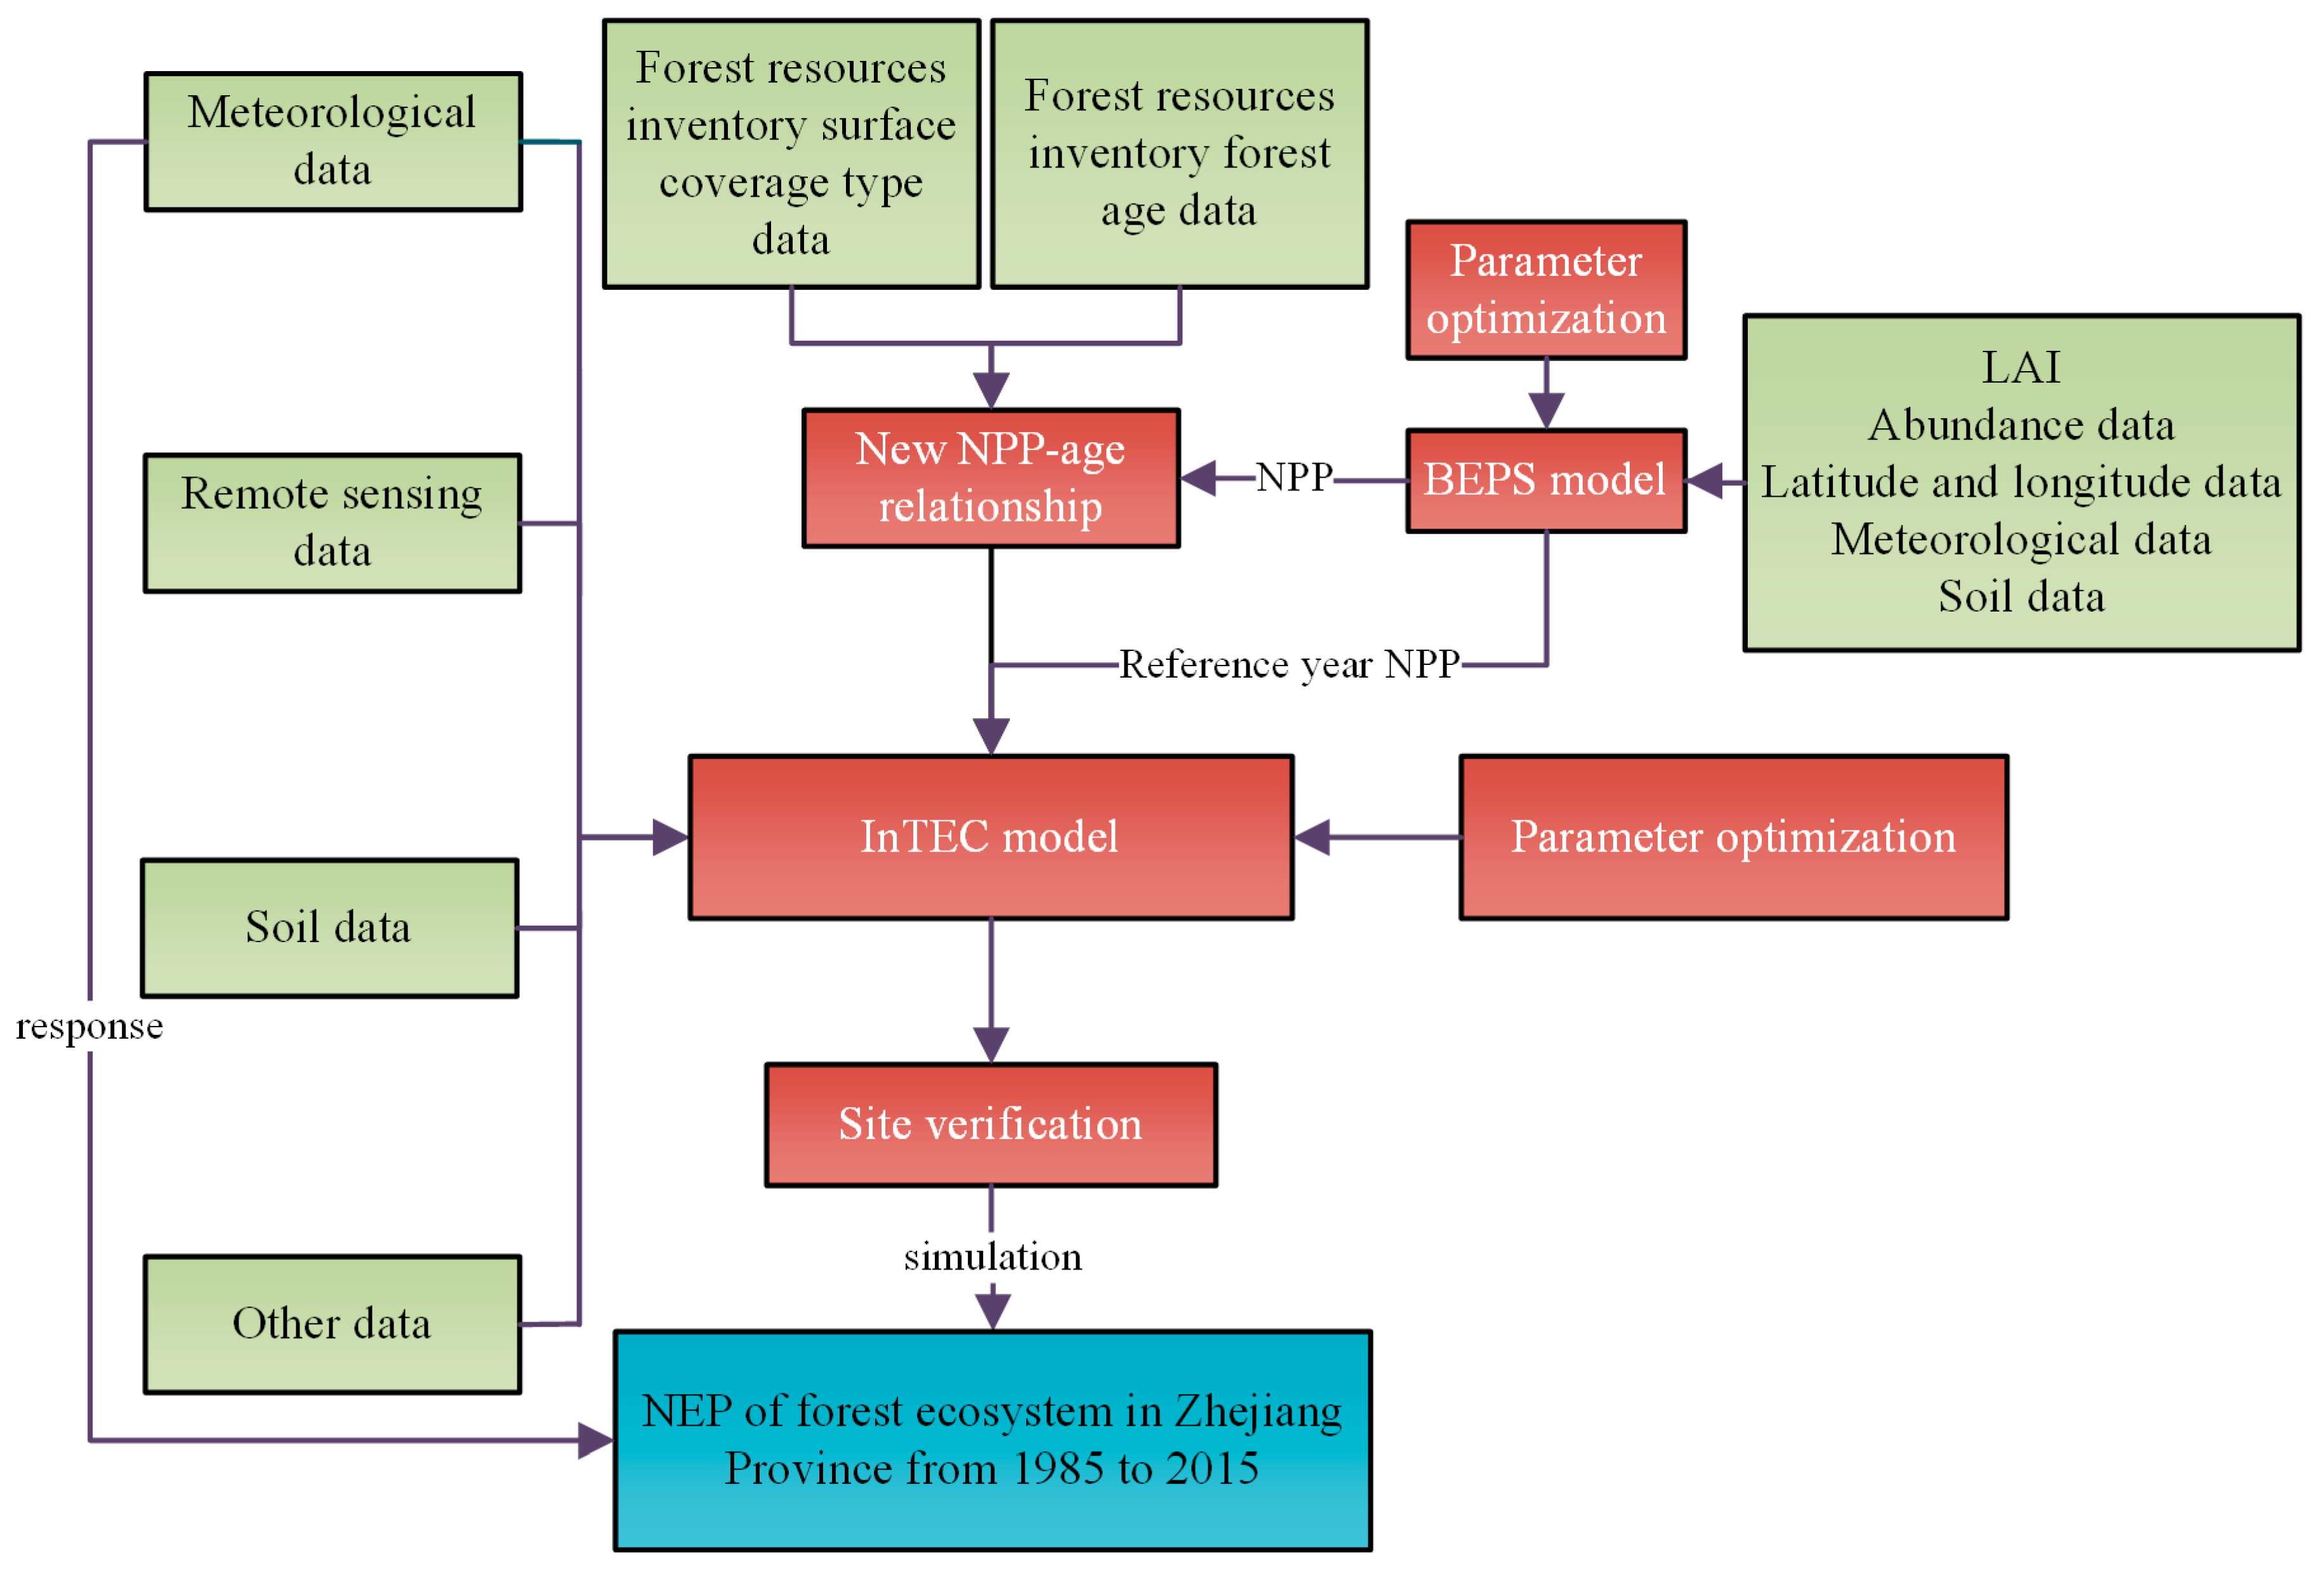
2.2. The InTEC Model

The InTEC model divides the whole ecosystem carbon pool into four vegetation carbon pools (coarse root, fine root, stem, and leaf), five litter carbon pools (surface structure litter, surface metabolism litter, soil structure litter, soil metabolism litter, and woody litter), and four soil carbon pools (surface microorganism, soil microorganism, slow pool, and inert carbon pool) to analyze the long-term ecosystem carbon balance. The vegetation carbon pool is calculated according to annual NPP and a certain carbon allocation ratio. The four vegetation carbon pools are calculated based on the initialized annual NPP combined with different carbon allocation ratios, and the four vegetation carbon pools are added to obtain the total biomass carbon pool. The carbon of litter increases soil carbon pools, while soil heterotrophic respiration leads to a reduction in soil carbon pools. The carbon of litter is calculated based on the turnover rate of different parts of the vegetation; the turnover rate is shown in Table 1. Soil heterotrophic respiration is the amount of soil carbon pool decomposition to the atmosphere, which is determined by the decomposition rate of each carbon pool. The forest ecosystem NEP is the difference between annual NPP and heterotrophic respiration, where NPP varies with climate, atmospheric composition, soil conditions, and disturbance factors [25,26,34,35].
The InTEC model includes four core processes: (1) The Farquhar photosynthetic model, based on leaf photosynthesis, is used to simulate gross primary productivity (GPP) [25,36]; (2) Reconstruct the historical NPP according to the normalized NPPage relationship and meteorological data, distributed to each vegetation carbon pool through different distribution ratios; (3) Simulate soil moisture and temperature according to the three-dimensional distributed hydrological model [37]; and (4) the CENTURY soil model and net nitrogen mineralization model of Townsend et al. [38] is used to simulate the C\N cycle.
The InTEC model takes the effects of man-made and natural disturbances on forest NEP into consideration. Therefore, this study assumes that forest growth is affected by felling, forest recovery processes, forest age change, climatic factors, and soil factors.

2.3. Model Parameters and Input Data

2.3.1. Parameters of the InTEC Model

By reviewing related literature, the carbon distribution coefficients of the organs (stem, branches, leaves, and roots) of coniferous and broadleaf forest [39,40], turnover rate, specific leaf area, and decomposition rate of each part of the soil, as shown in Table 1, were obtained.

2.3.2. Forest Distribution Data of Zhejiang Province

Classification of forest types for Zhejiang Province was based on the Landsat TM imagery from 1984 to 2014. After radiation correction and geometric correction, the maximum likelihood classification method was used to obtain the forest distribution information of coniferous forests, broadleaf forests, and bamboo forests in Zhejiang Province [41]. To keep the same spatial resolution with other data, the local average method [42] was used to push the scale of the Zhejiang forest distribution data from 30 m resolution to 1 km resolution abundance data.

2.3.3. Meteorological Data

Observational data of 410 weather stations in Zhejiang Province and its surrounding provinces from 1985 to 2015 was provided by the National Meteorological Center of China Meteorological Administration [43,44], including the monthly maximum temperature, monthly minimum temperature, average relative humidity, total precipitation, and monthly average radiation. The inverse distance weighting method was used to interpolate site meteorological data into 1 km resolution spatial data.

2.3.4. Soil Data

Soil data with 1 km resolution for Zhejiang province was derived from the Harmonized World Soil Database (HWSD1.2), including silt and clay fraction, depth of soil layer, and soil effective water holding capacity. Soil bulk density was calculated by the silt and clay fraction with the Brooks–Corey model of Saxton [44]. The wilt point was calculated by the silt and clay fraction [45].

2.3.5. Leaf Area Index (LAI) Data

The Moderate Resolution Imaging Spectroradiometer (MODIS) LAI data of Zhejiang province was derived from the US National Aeronautics and Space Administration (NASA) website. Due to the noise and other defects of LAIMODIS [46,47], the LAIMODIS data was smoothed using the locally adjusted cubic-spline capping algorithm [48], then the integrated ensemble Kalman filter algorithm was used to assimilate the LAI after smoothing to obtain high-precision Zhejiang Province LAI data [49,50].

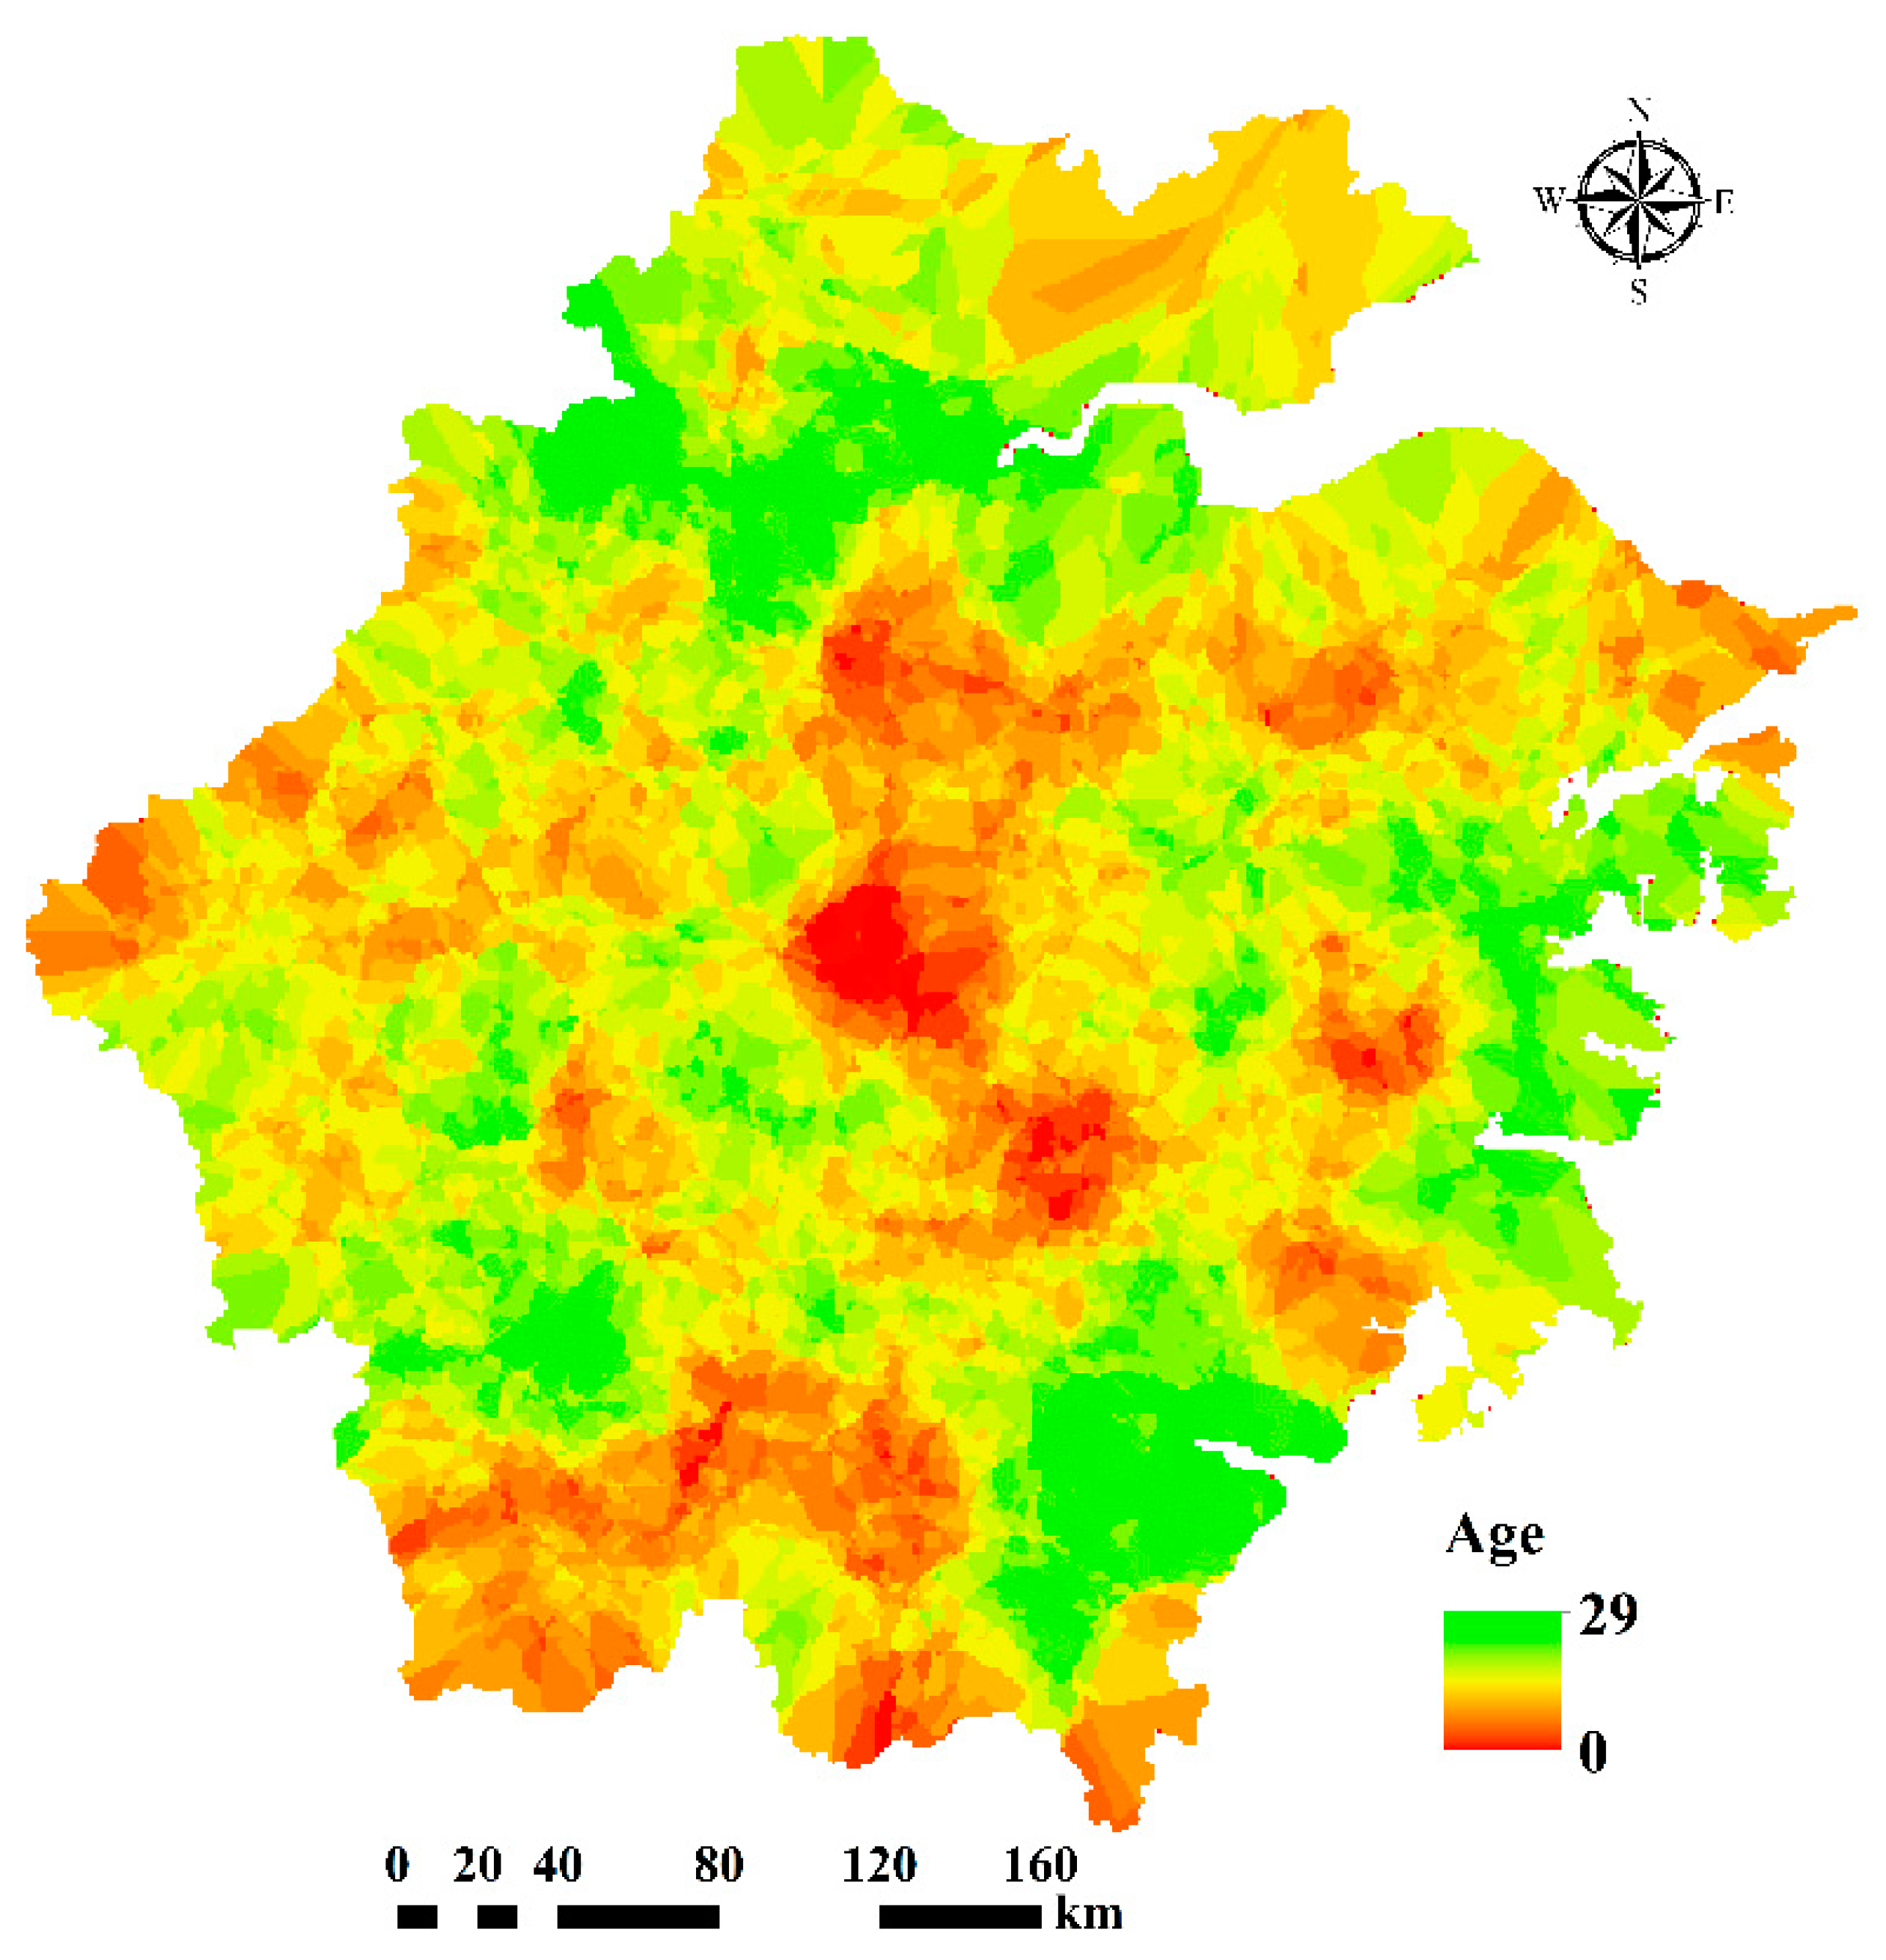
2.3.6. Forest Age Data

The InTEC model takes the effects of forest age change on forest productivity into consideration. Therefore, this study sorted out the forest resource inventory sample age information from 2004. Then, 1 km spatial resolution age data from Zhejiang Province was interpolated by a Kriging interpolation method, as shown in Figure 2.

2.3.7. Nitrogen Deposition Data

The nitrogen deposition data came from global gridded estimates of atmospheric deposition of total inorganic nitrogen (N), NHx (NH3 and NH4+), and NOy (all oxidized forms of nitrogen other than N2O), and the data set was generated using a global three-dimensional chemistry transport (TM3) model with a spatial resolution of 5 degrees longitude by 3.75 degrees latitude [51,52]. Based on this data, linear interpolation was used to interpolate the annual nitrogen deposition spatial distribution data of Zhejiang Province from 1985 to 2015.

2.3.8. Reference NPP

To achieve the spatiotemporal simulation of the forest carbon cycle, the InTEC model needs to correct the initial NPP by reference NPP. Therefore, this study used the boreal ecosystem productivity simulator (BEPS) model to simulate the NPP of Zhejiang Province in 2004 and took this as the reference NPP. The NPP simulation process based on the BEPS model refers to Mao et al. [53].

2.4. NPP–Age Parameter Optimization

A semi-empirical mathematical function (Equation (1)), which was developed by Chen et al. [54], and forest resource inventory data were used to reconstruct the NPPage relationship in Zhejiang Province.
N P P ( a g e ) = a ( 1 + b ( a g e c ) d 1 exp ( a g e c ) ) .
where a, b, c, and d are parameters in this study, whereby 398 age data points of broadleaf forest plots, 725 age data points of coniferous forest plots (Figure 1), and NPP data from the Zhejiang forest resources inventory in 2004 were used to optimize these parameters by nonlinear regression.

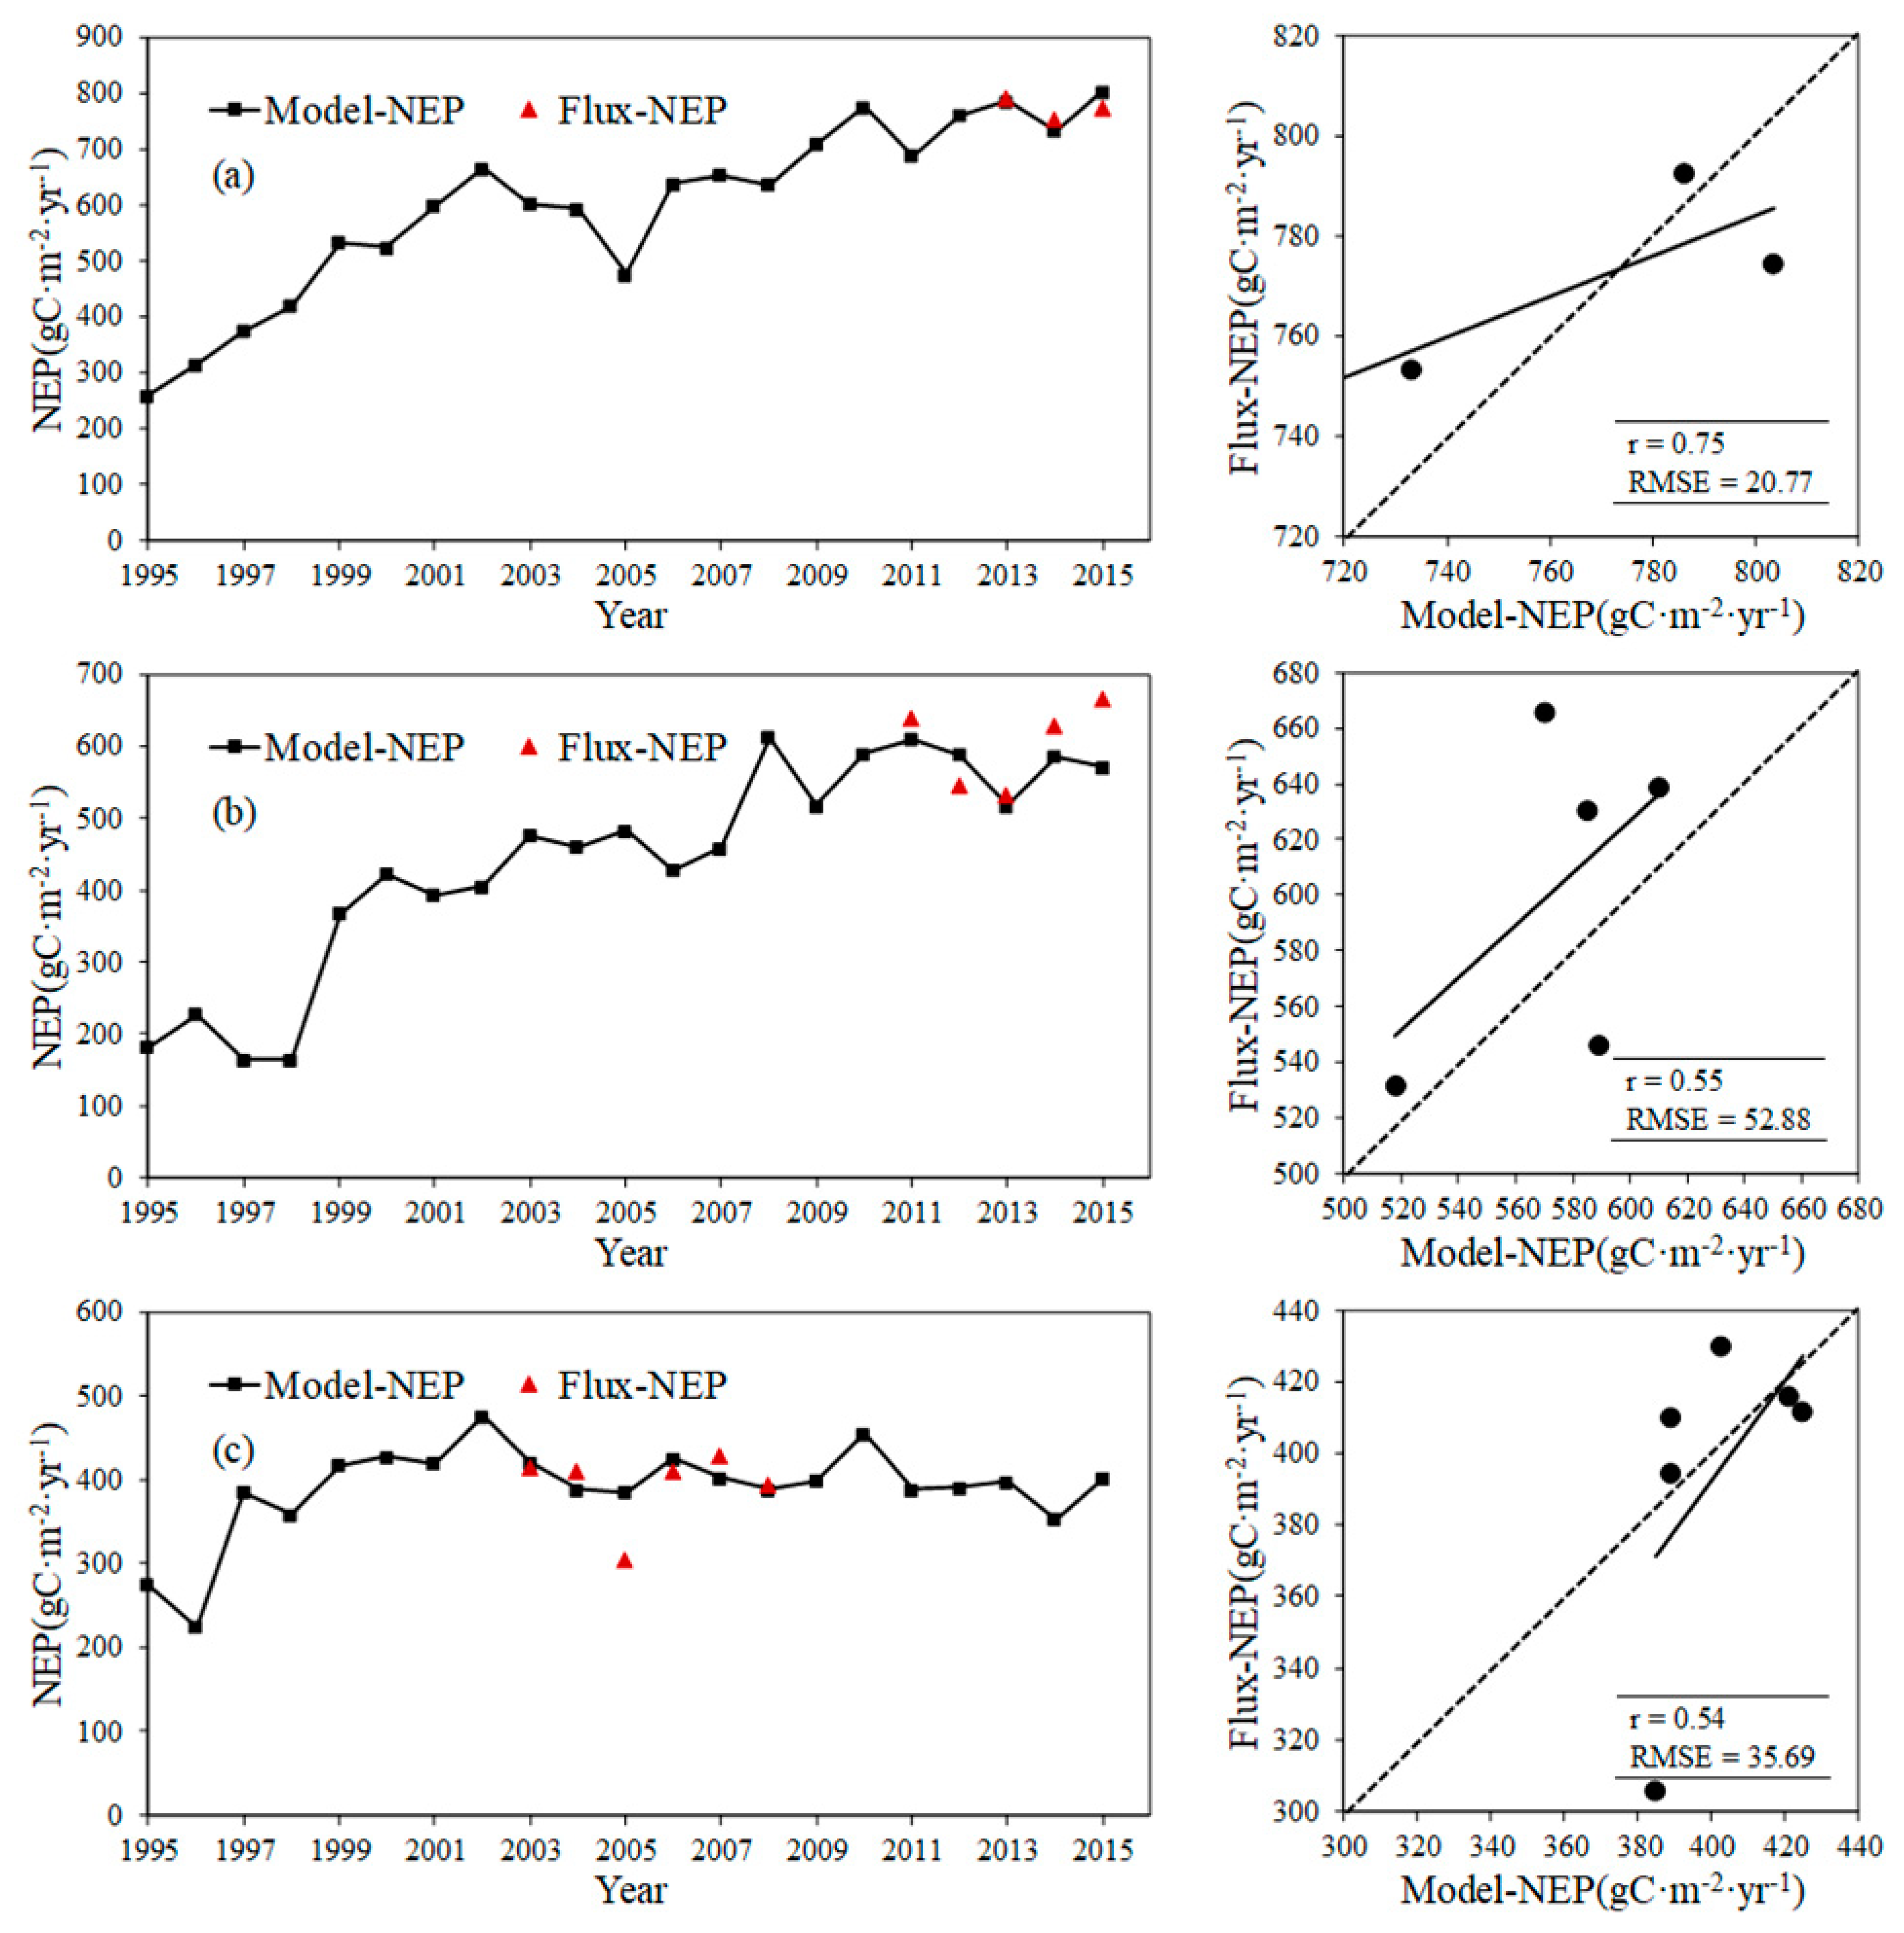
2.5. Site Verification and Carbon Cycle Simulation

This study simulated the carbon cycle of forest ecosystems in Zhejiang Province, based on the verification of the InTEC model using three different forest type flux sites. We used observed data of an evergreen broadleaf deciduous forest flux site [55,56,57] and bamboo forest flux site [58] in Zhejiang Province, Qianyanzhou, and a coniferous forest flux site in Jiangxi Province, near Zhejiang Province, to undertake the verification. The details of the three-flux site are shown in Table 2. Zhejiang and Jiangxi provinces are in subtropical regions. Evergreen broadleaf forests, bamboo forests, and coniferous forests are typical forest types in subtropical regions. Therefore, using the observation data of these three sites to verify the model is adequate.
Based on the site verification of the InTEC model, this study took meteorological data, soil data, LAI, forest age data, N decomposition data, reference NPP, and forest distribution data of Zhejiang Province as the input data, with 2004 as the reference year of the forest age data and NPP data (Table 3), and utilized the InTEC model after optimization. The simulation flow chart is shown in Figure 3.

3. Results

3.1. NPP–Age Relationship

The NPPage relationship and parameters of Zhejiang Province after optimization are shown in Figure 4. First, the NPP of coniferous and broadleaf forest increased rapidly with age and then began to decline after reaching the highest value. When the age was greater than 200 years, NPP hardly changed with age. The NPP of broadleaf reached the highest value faster than that of coniferous forest, but the NPP value after stabilization of coniferous forest is higher than that of broadleaf forest.

3.2. InTEC Model Optimization

The simulation and verification results of three forest NEP values are shown in Figure 5. As shown in Figure 5, the model simulation NEP is consistent with the trend of the three-flux observation NEP time series. The correlation coefficient is between 0.54 and 0.75. Broadleaf forest has the highest precision (r = 0.75, RMSE = 20.77 gC·m−2·yr−1). Verification of the results showed that the optimized InTEC model can be used to simulate and predict the spatial distribution of forest NEP in Zhejiang Province.

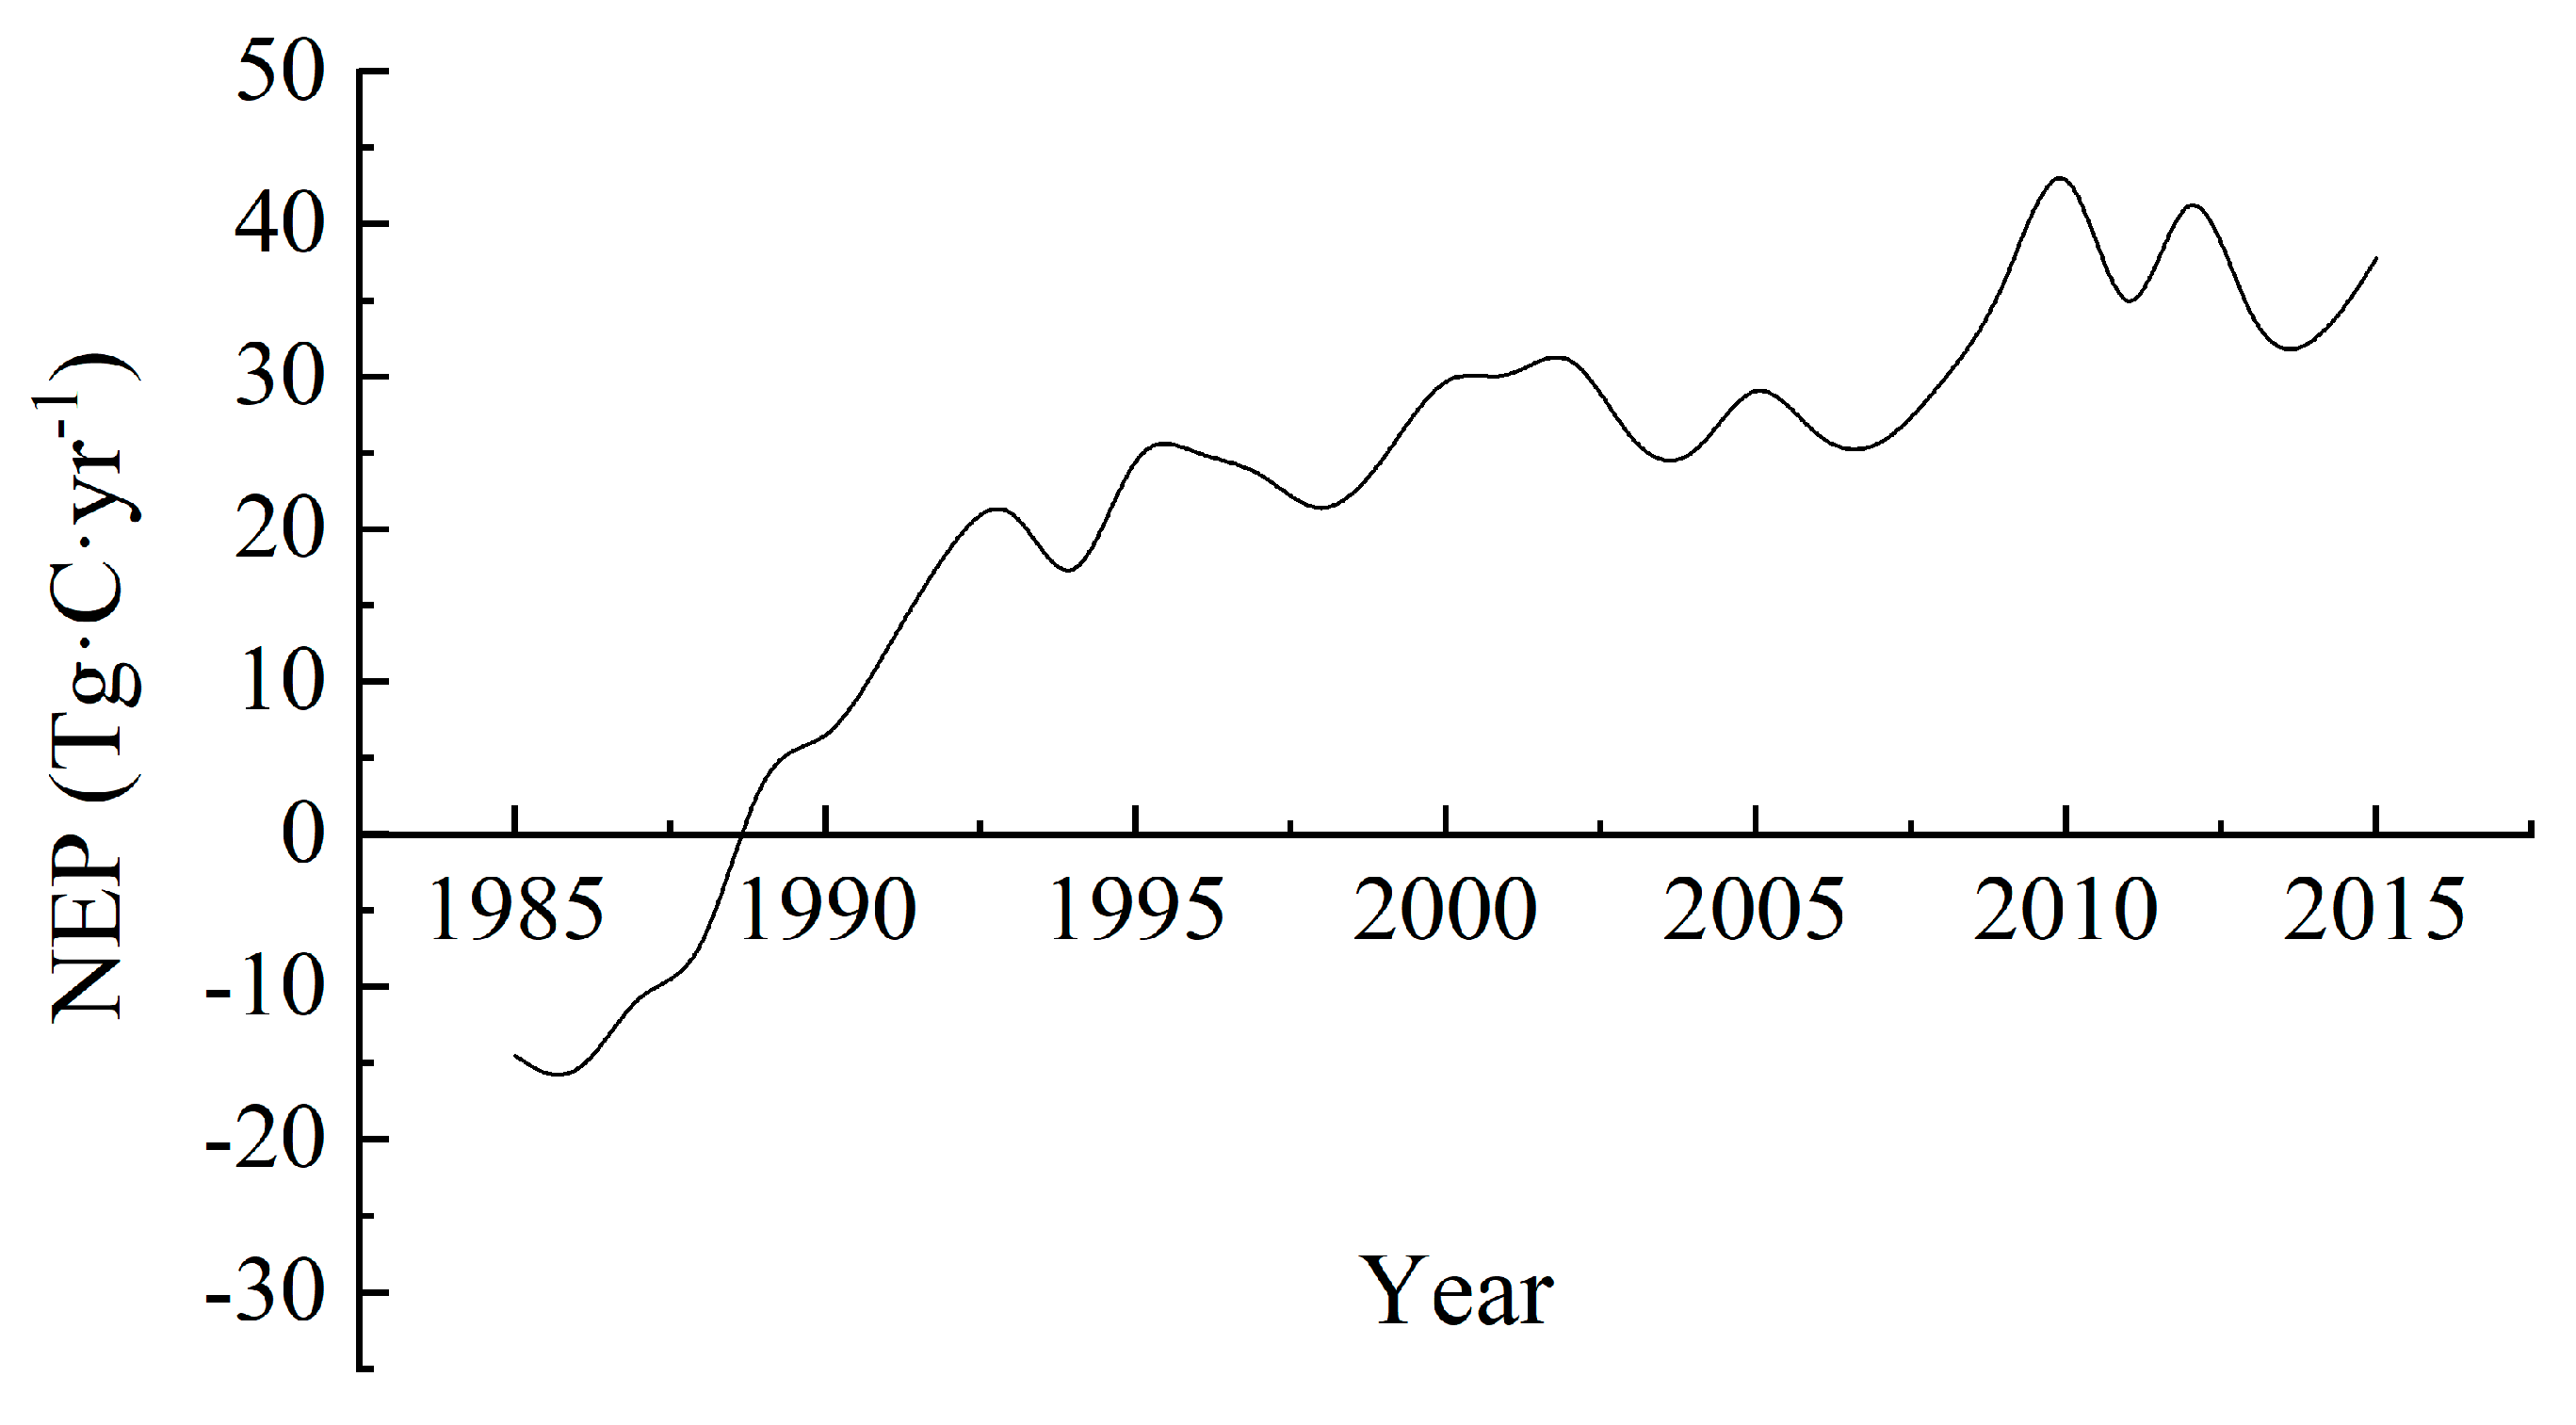
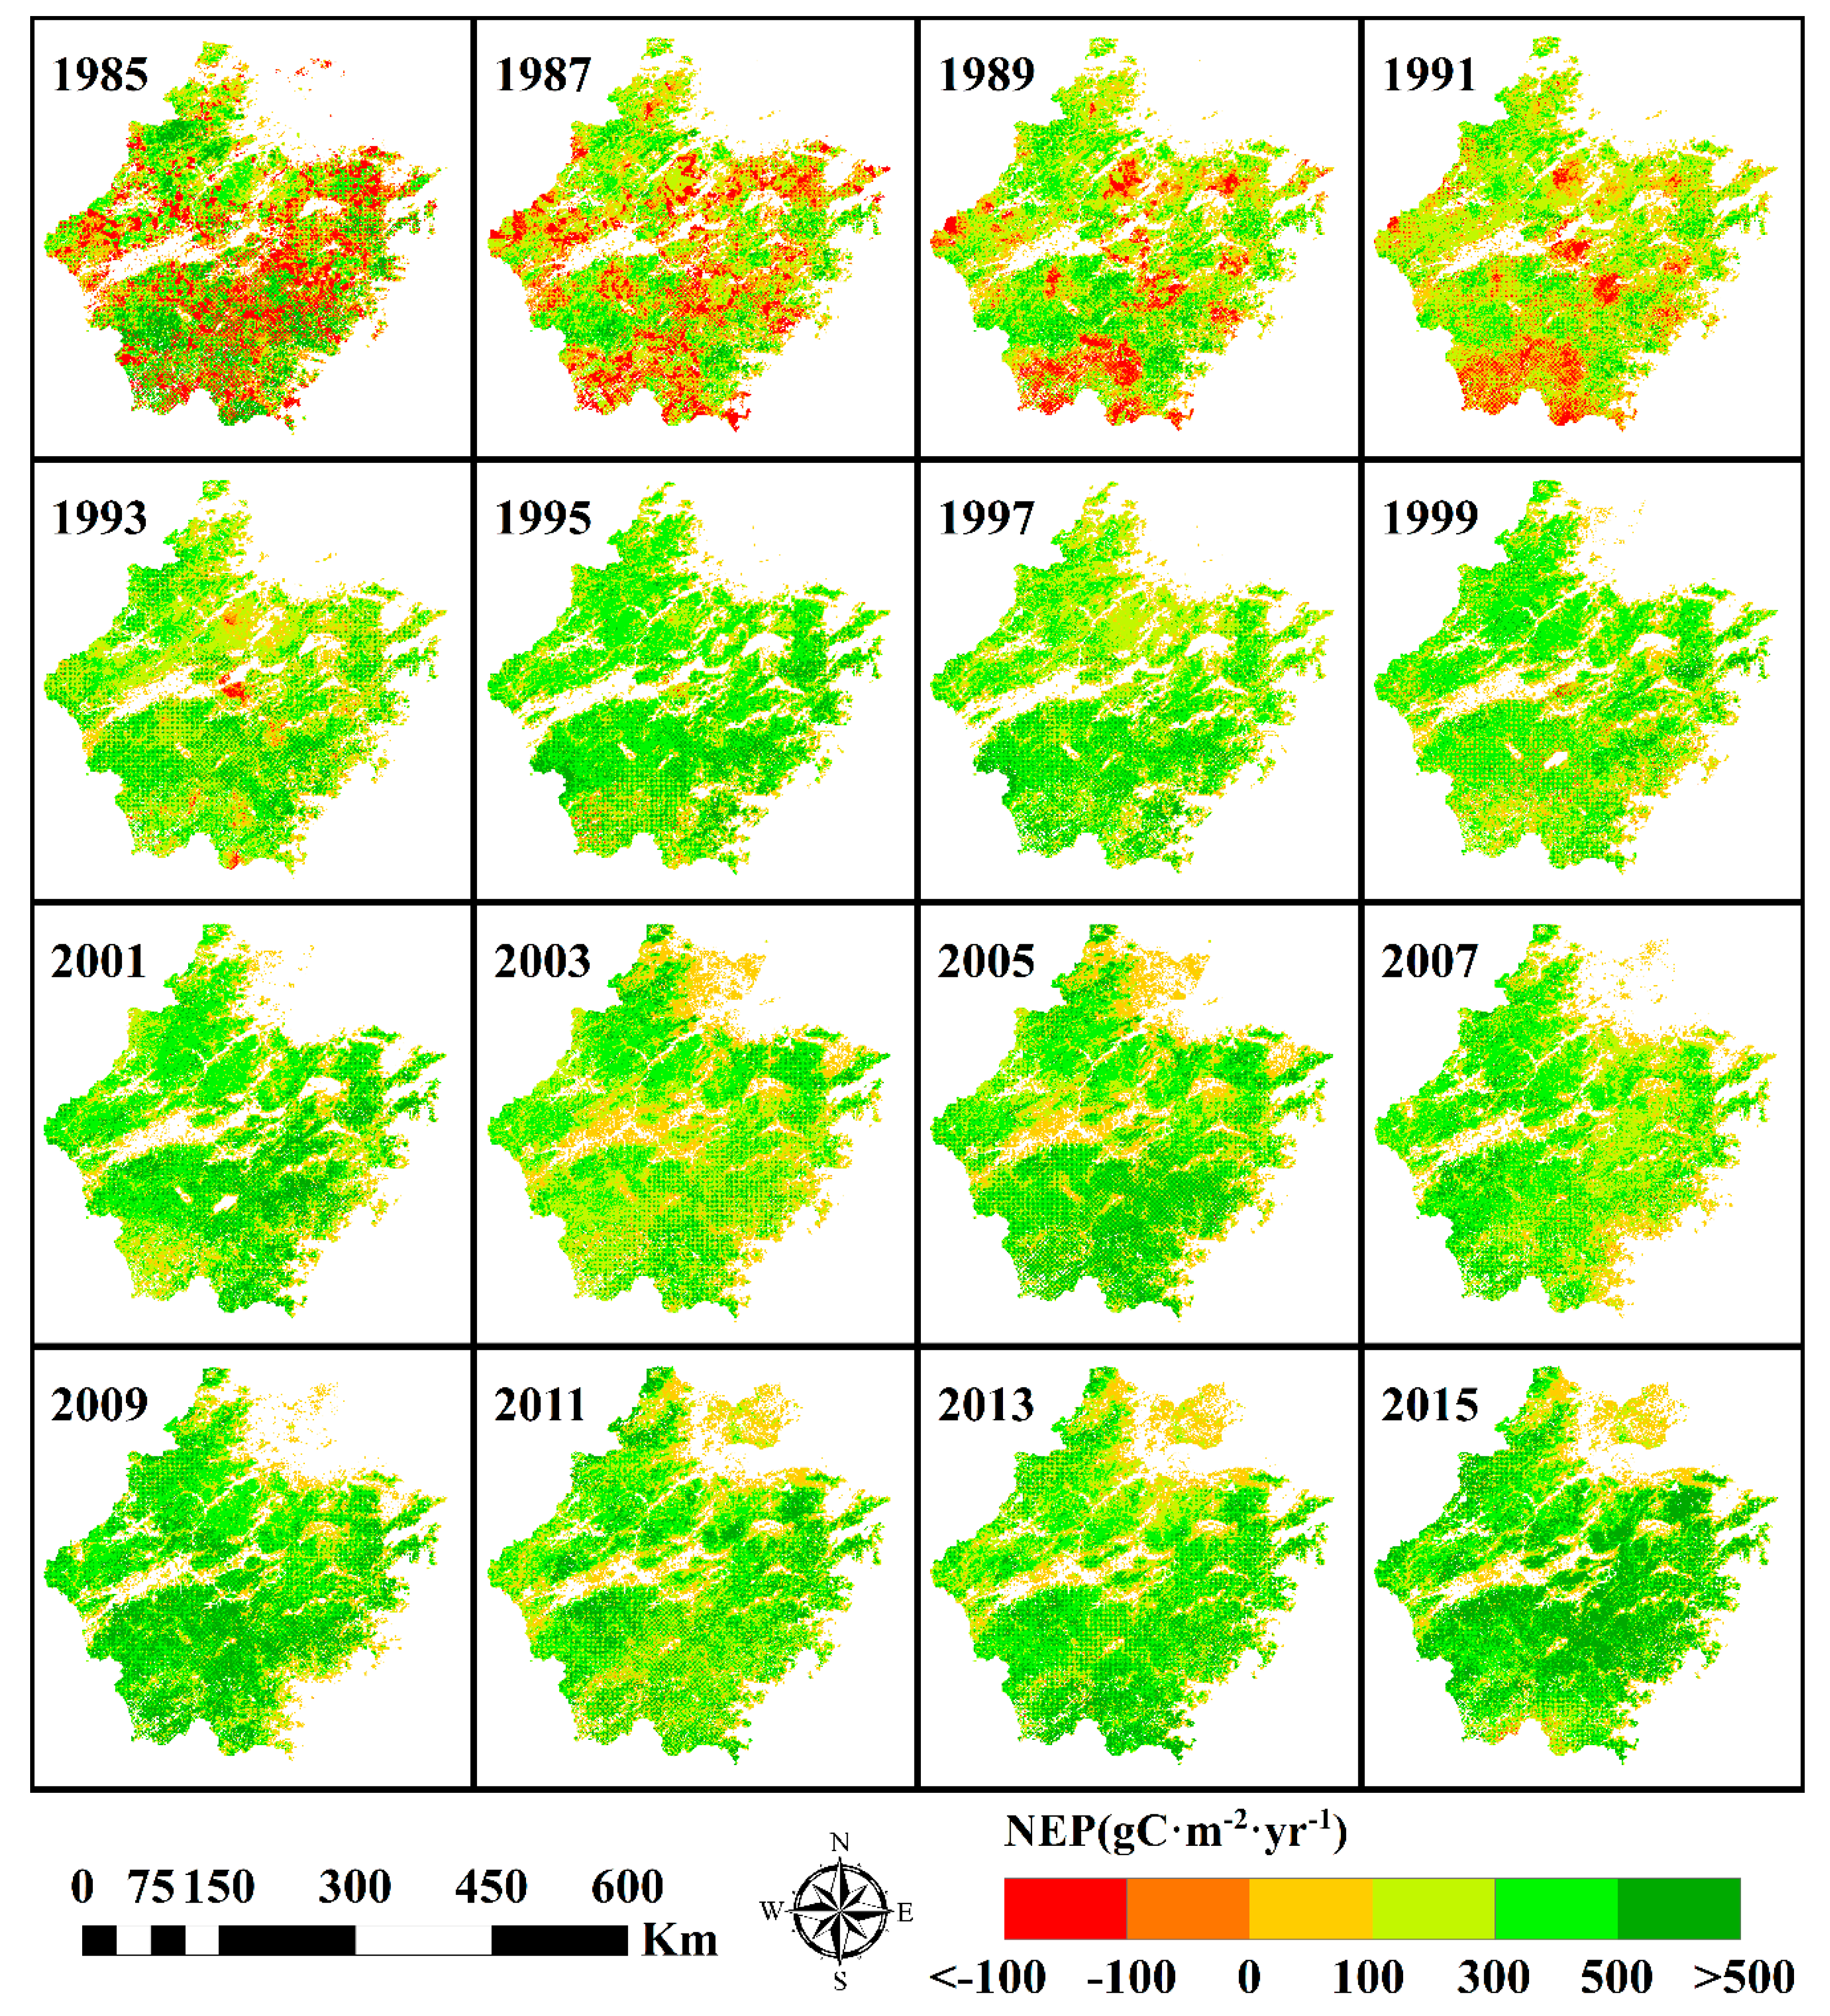
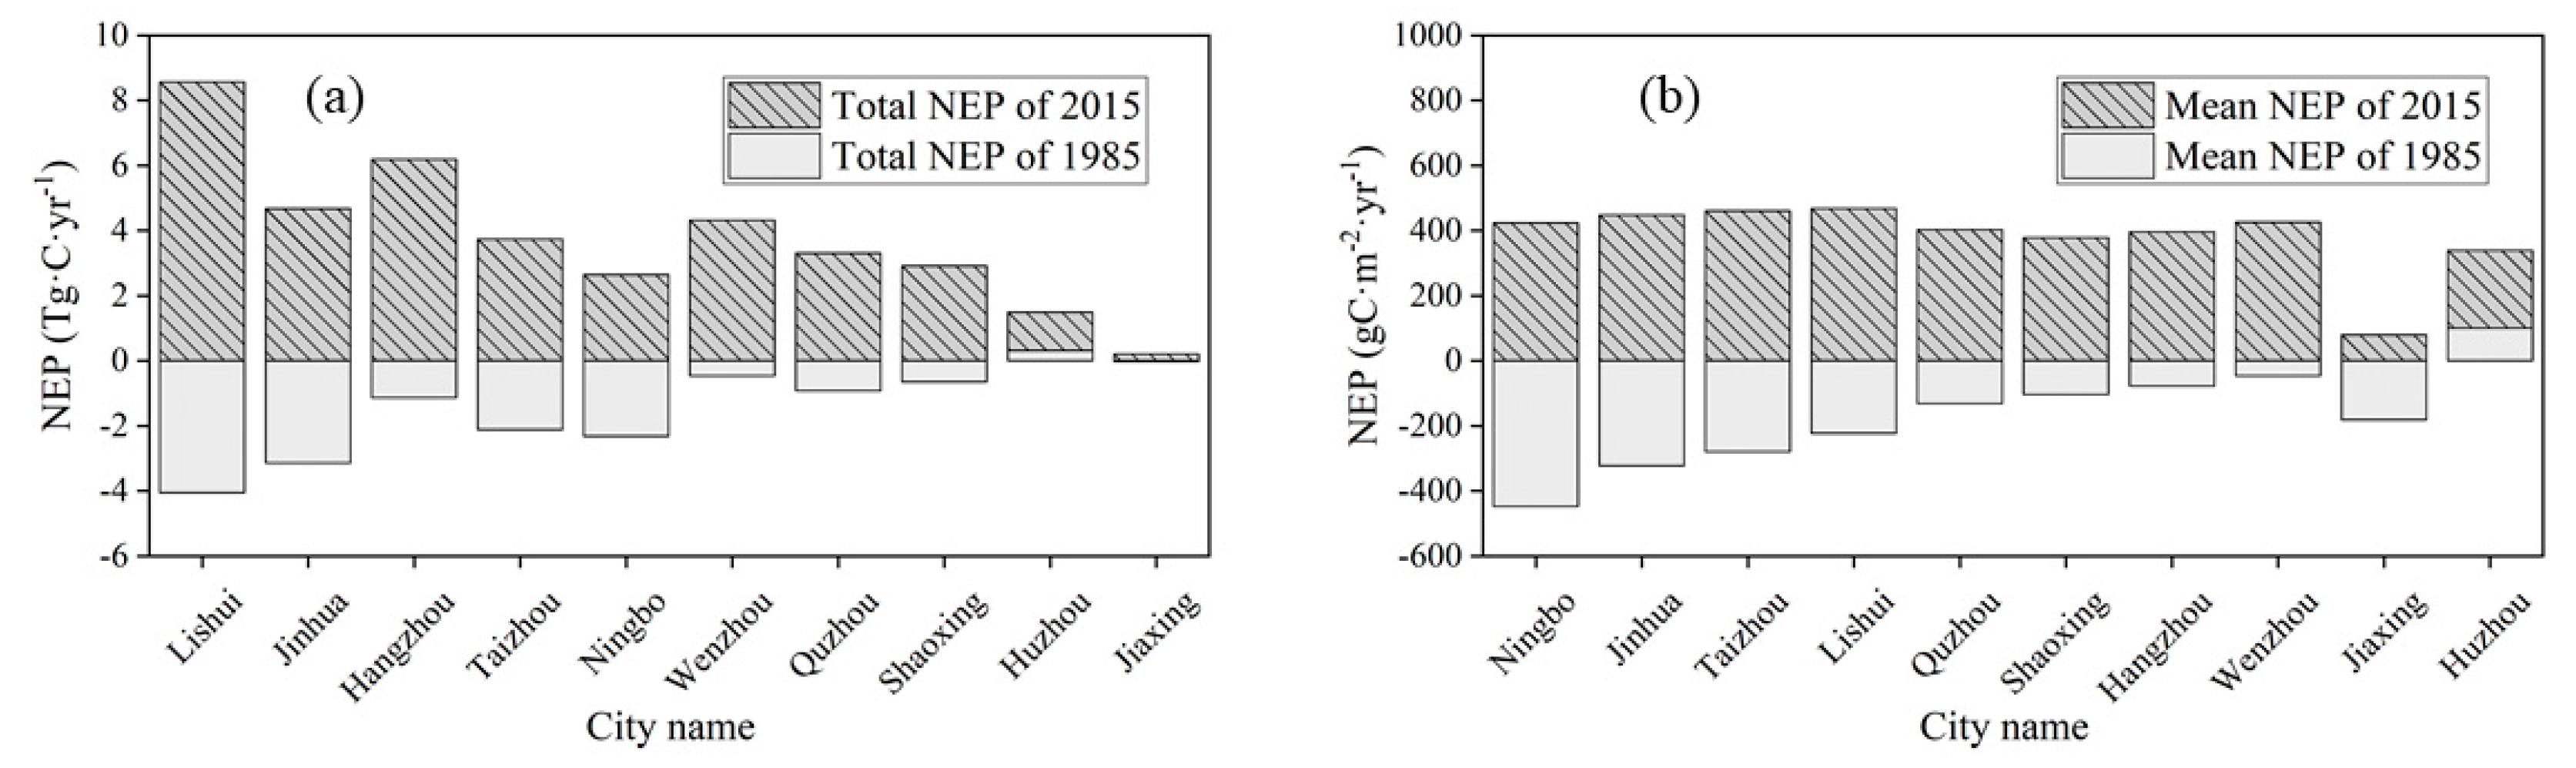
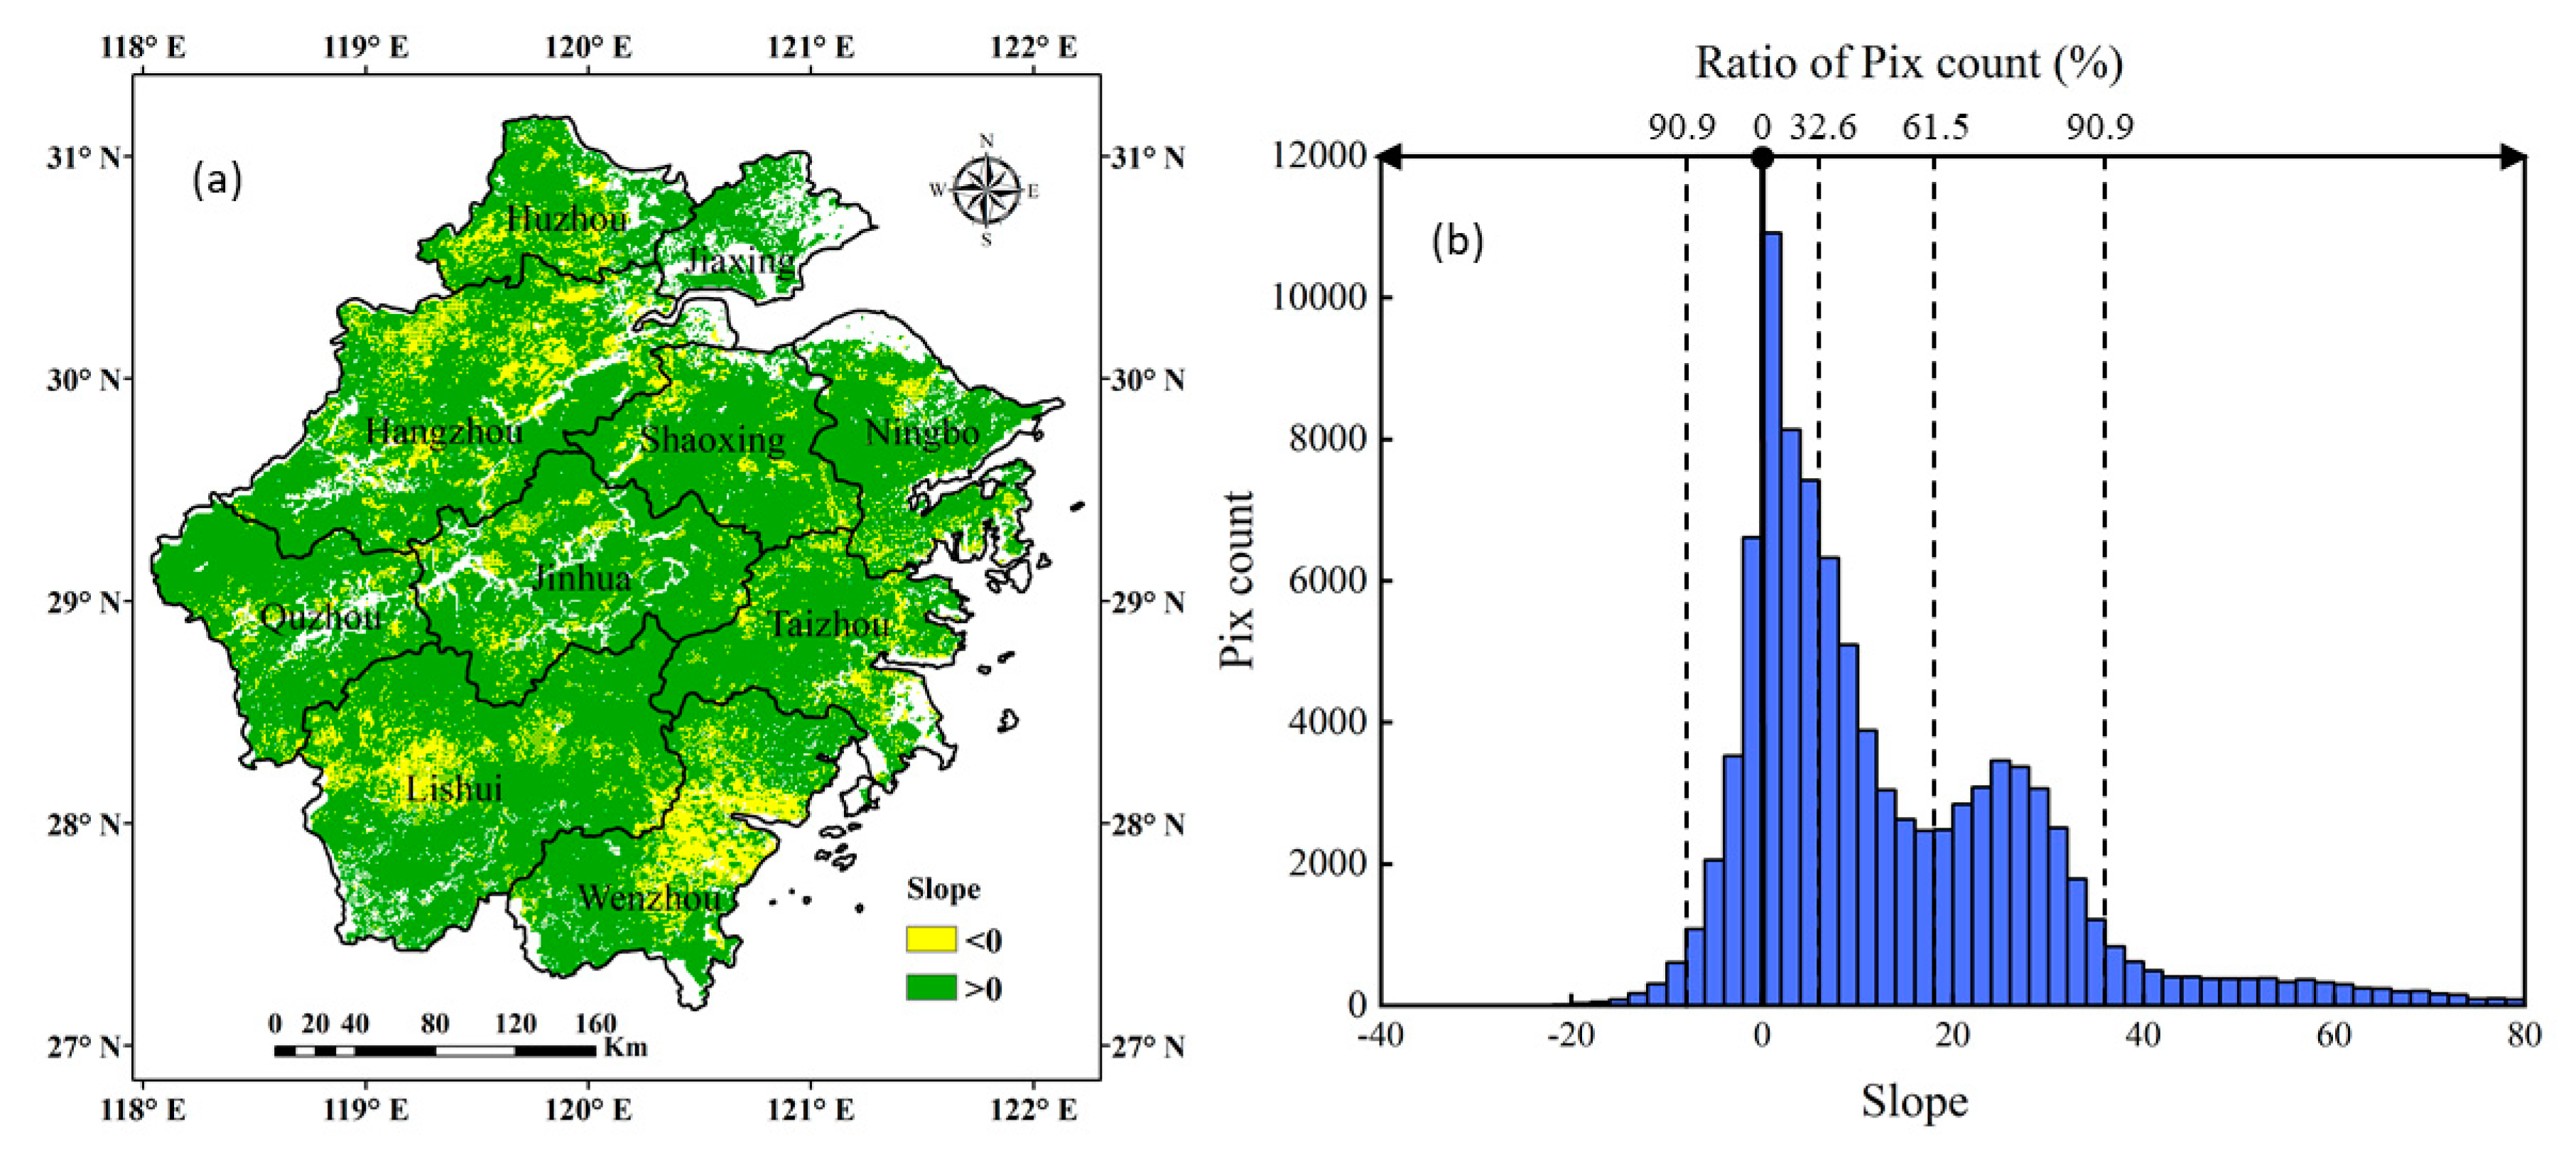
3.3. Simulation Results of the Forest Ecosystem NEP of Zhejiang Province

The forest ecosystem NEP total trend of Zhejiang Province from 1985 to 2015, based on the InTEC model after optimization, is shown in Figure 6. As shown in Figure 6, during 1985–2015, the forest NEP in Zhejiang Province showed an overall increasing trend, with an average annual increasing rate of 1.52 Tg·C·yr−1. The forests in Zhejiang Province were carbon sources between 1985 and 1988. After 1988, the forests in Zhejiang Province gradually turned into carbon sinks, and the carbon sink speed began increasing rapidly. The annual average total NEP reached 26.38 Tg·C·yr−1 between 1989 and 2015.
The spatial distribution of the forest ecosystem NEP is shown in Figure 7 (every 2 years). The forest carbon sink/source situation can be analyzed more intuitively in Figure 7. Before 1989, Zhejiang Province’s forests were a carbon source, and among them, carbon source forests accounted for 36% in 1985. In 1989, 19% of the forests were still in the carbon source stage. By 1999, most of the forests had been converted into carbon sink forests; only 5% of the forests were still in the weaker source stage, and annual average NEP reached 381.76 gC·m−2·yr−1. Then, the carbon sink ability continued to increase, and further statistics indicated that more than 97% of the forests in Zhejiang Province were carbon sinks from 2000 to 2015. The annual average NEP reached 441.91 gC·m−2·yr−1, and the annual average NEP of coniferous forest and broadleaf forest were 416.36 gC·m−2·yr−1 and 632.47 gC·m−2·yr1, respectively.
As shown in Figure 7, in the past 15 years, the areas with the largest forest carbon sink capacities in Zhejiang Province were mainly distributed in the mountainous areas in the east and southwest of Zhejiang Province, while the weaker areas were mainly distributed in the northeastern plains of Zhejiang Province. The changes in annual total NEP and NEP density of every city in Zhejiang Province during 1985–2015 are shown in Figure 8. The change of total annual NEP for each city ranged from 0.24 to 12.63 Tg·C·yr−1, and decreased in the following order: Lishui > Jinhua > Hangzhou > Hangzhou > Taizhou > Ningbo > Wenzhou > Quzhou > Shaoxing > Huzhou > Jiaxing (Figure 8a). The change of NEP density for each city ranged from 138.20 to 872.03 gC·m−2·yr−1, and decreased in the following order: Ningbo > Jinhua > Taizhou > Lishui > Quzhou > Shaoxing > Hangzhou > Wenzhou > Jiaxing > Huzhou (Figure 8b).

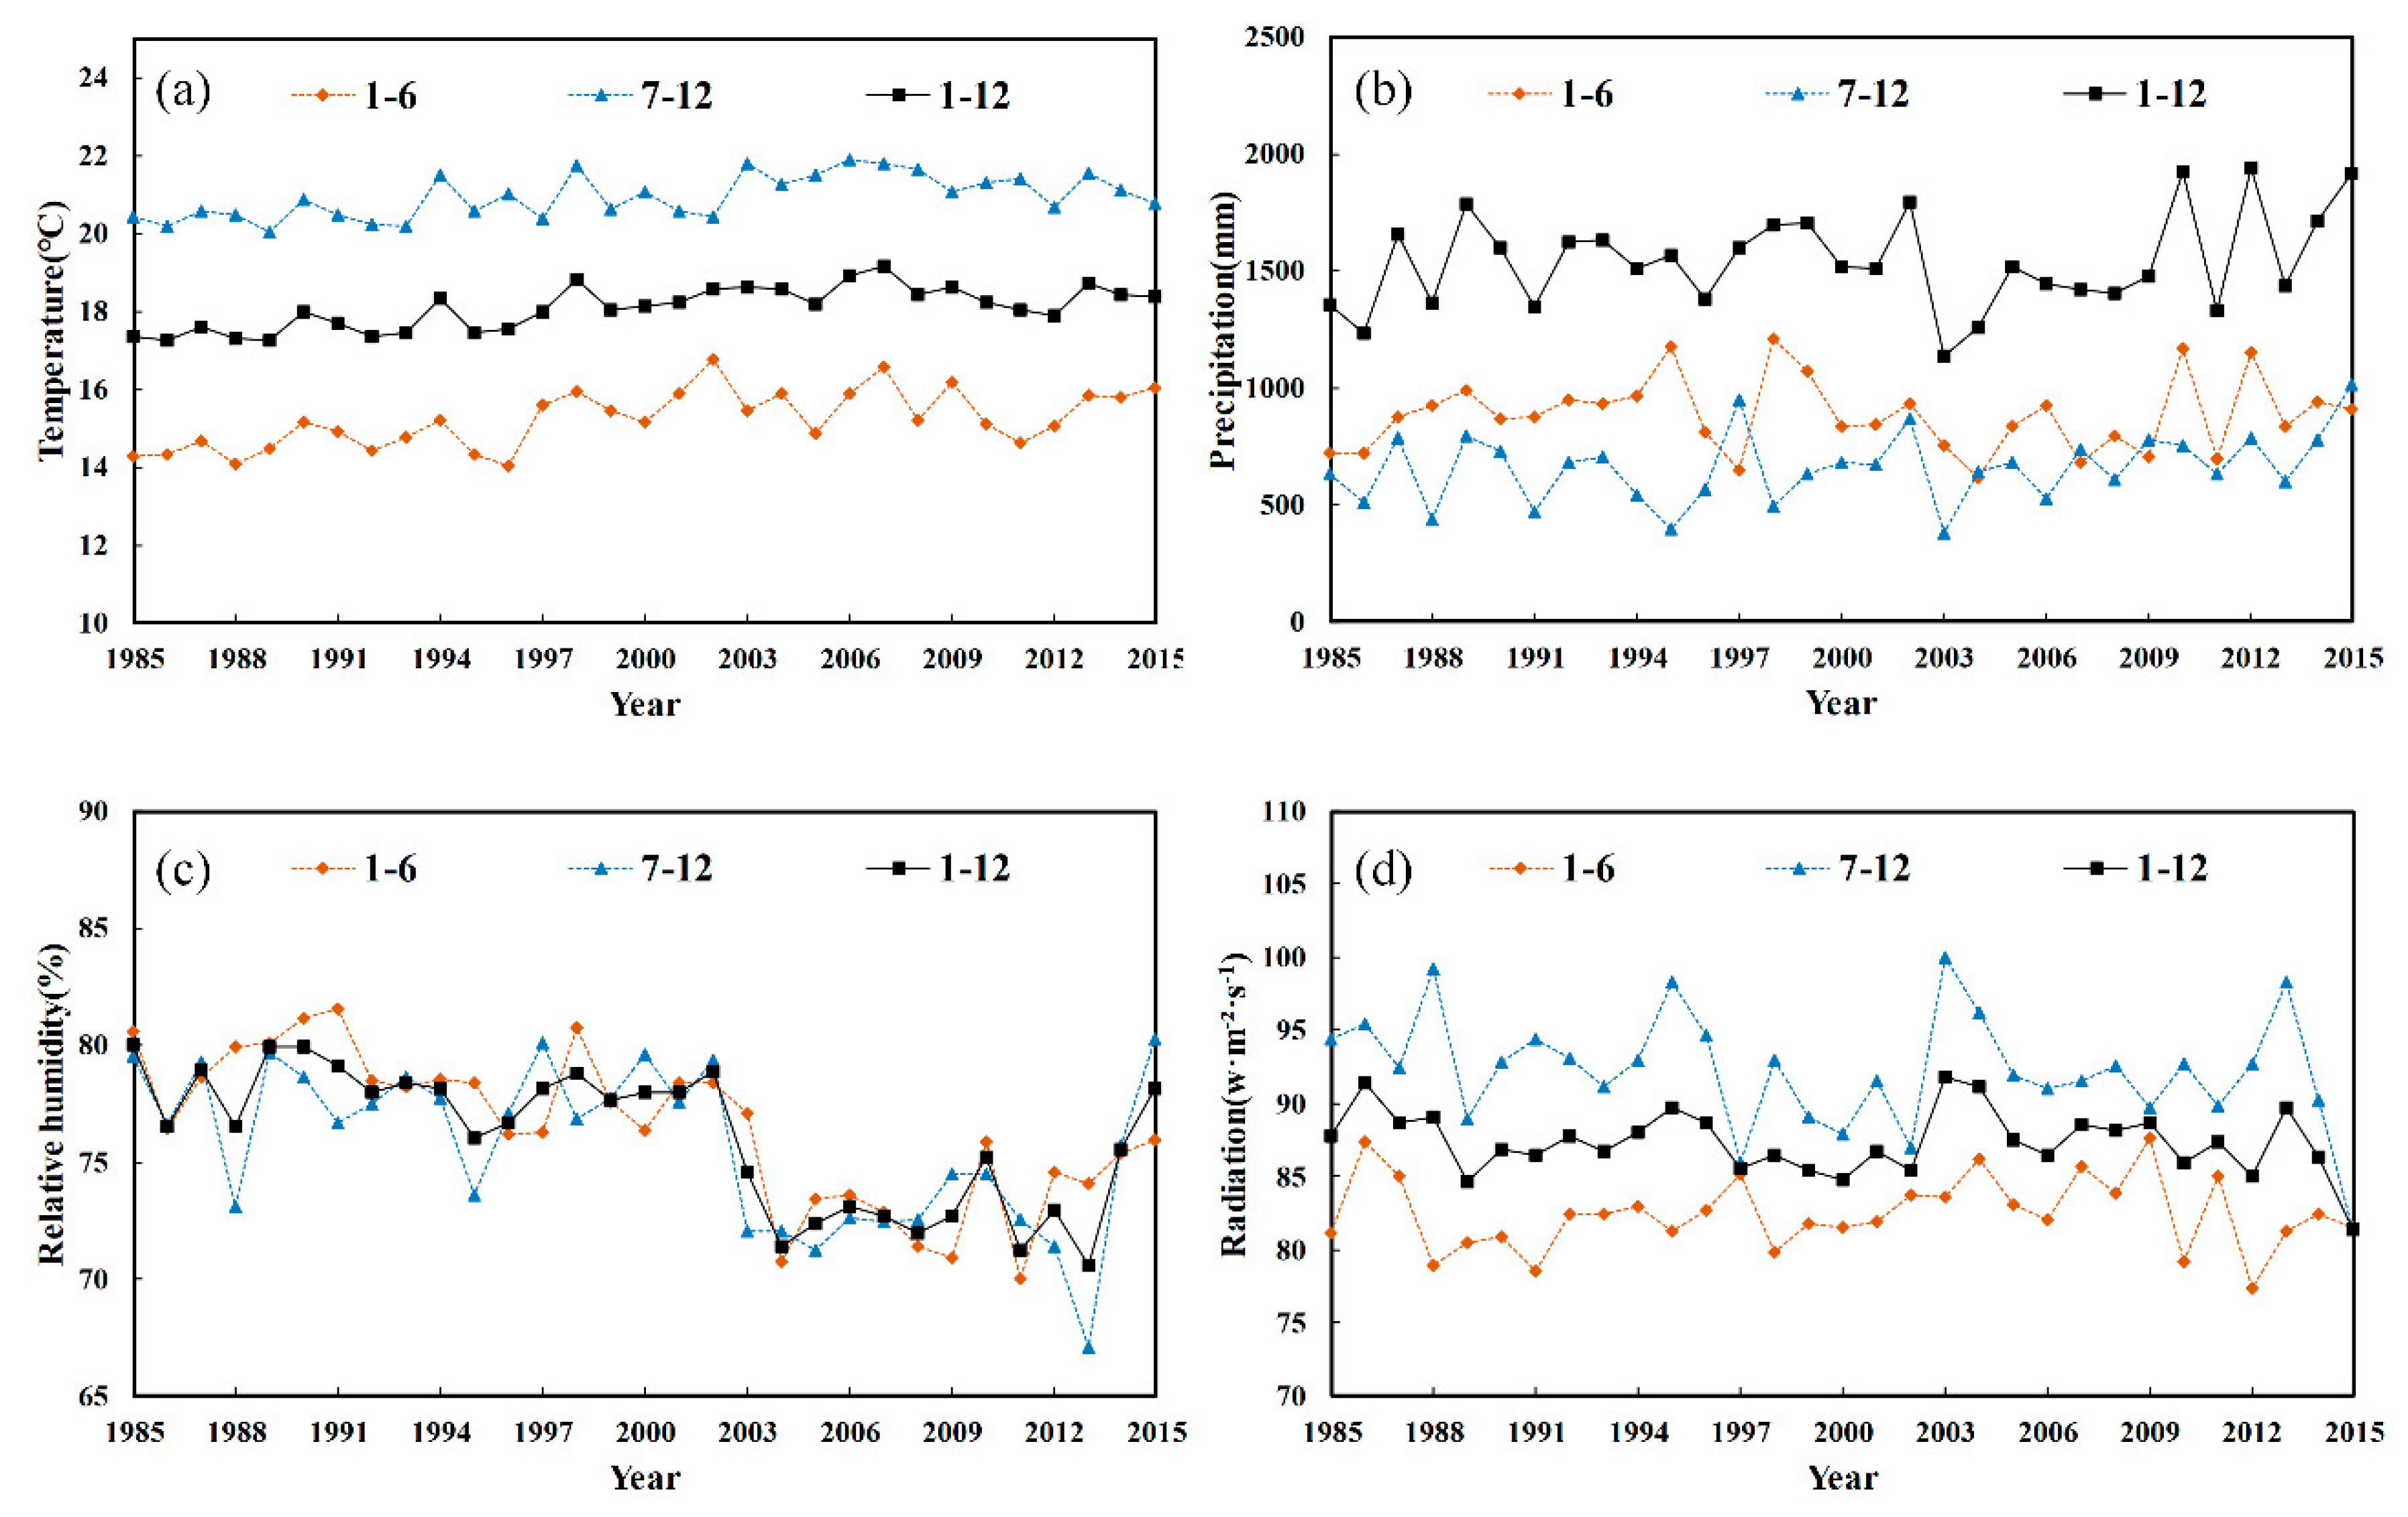
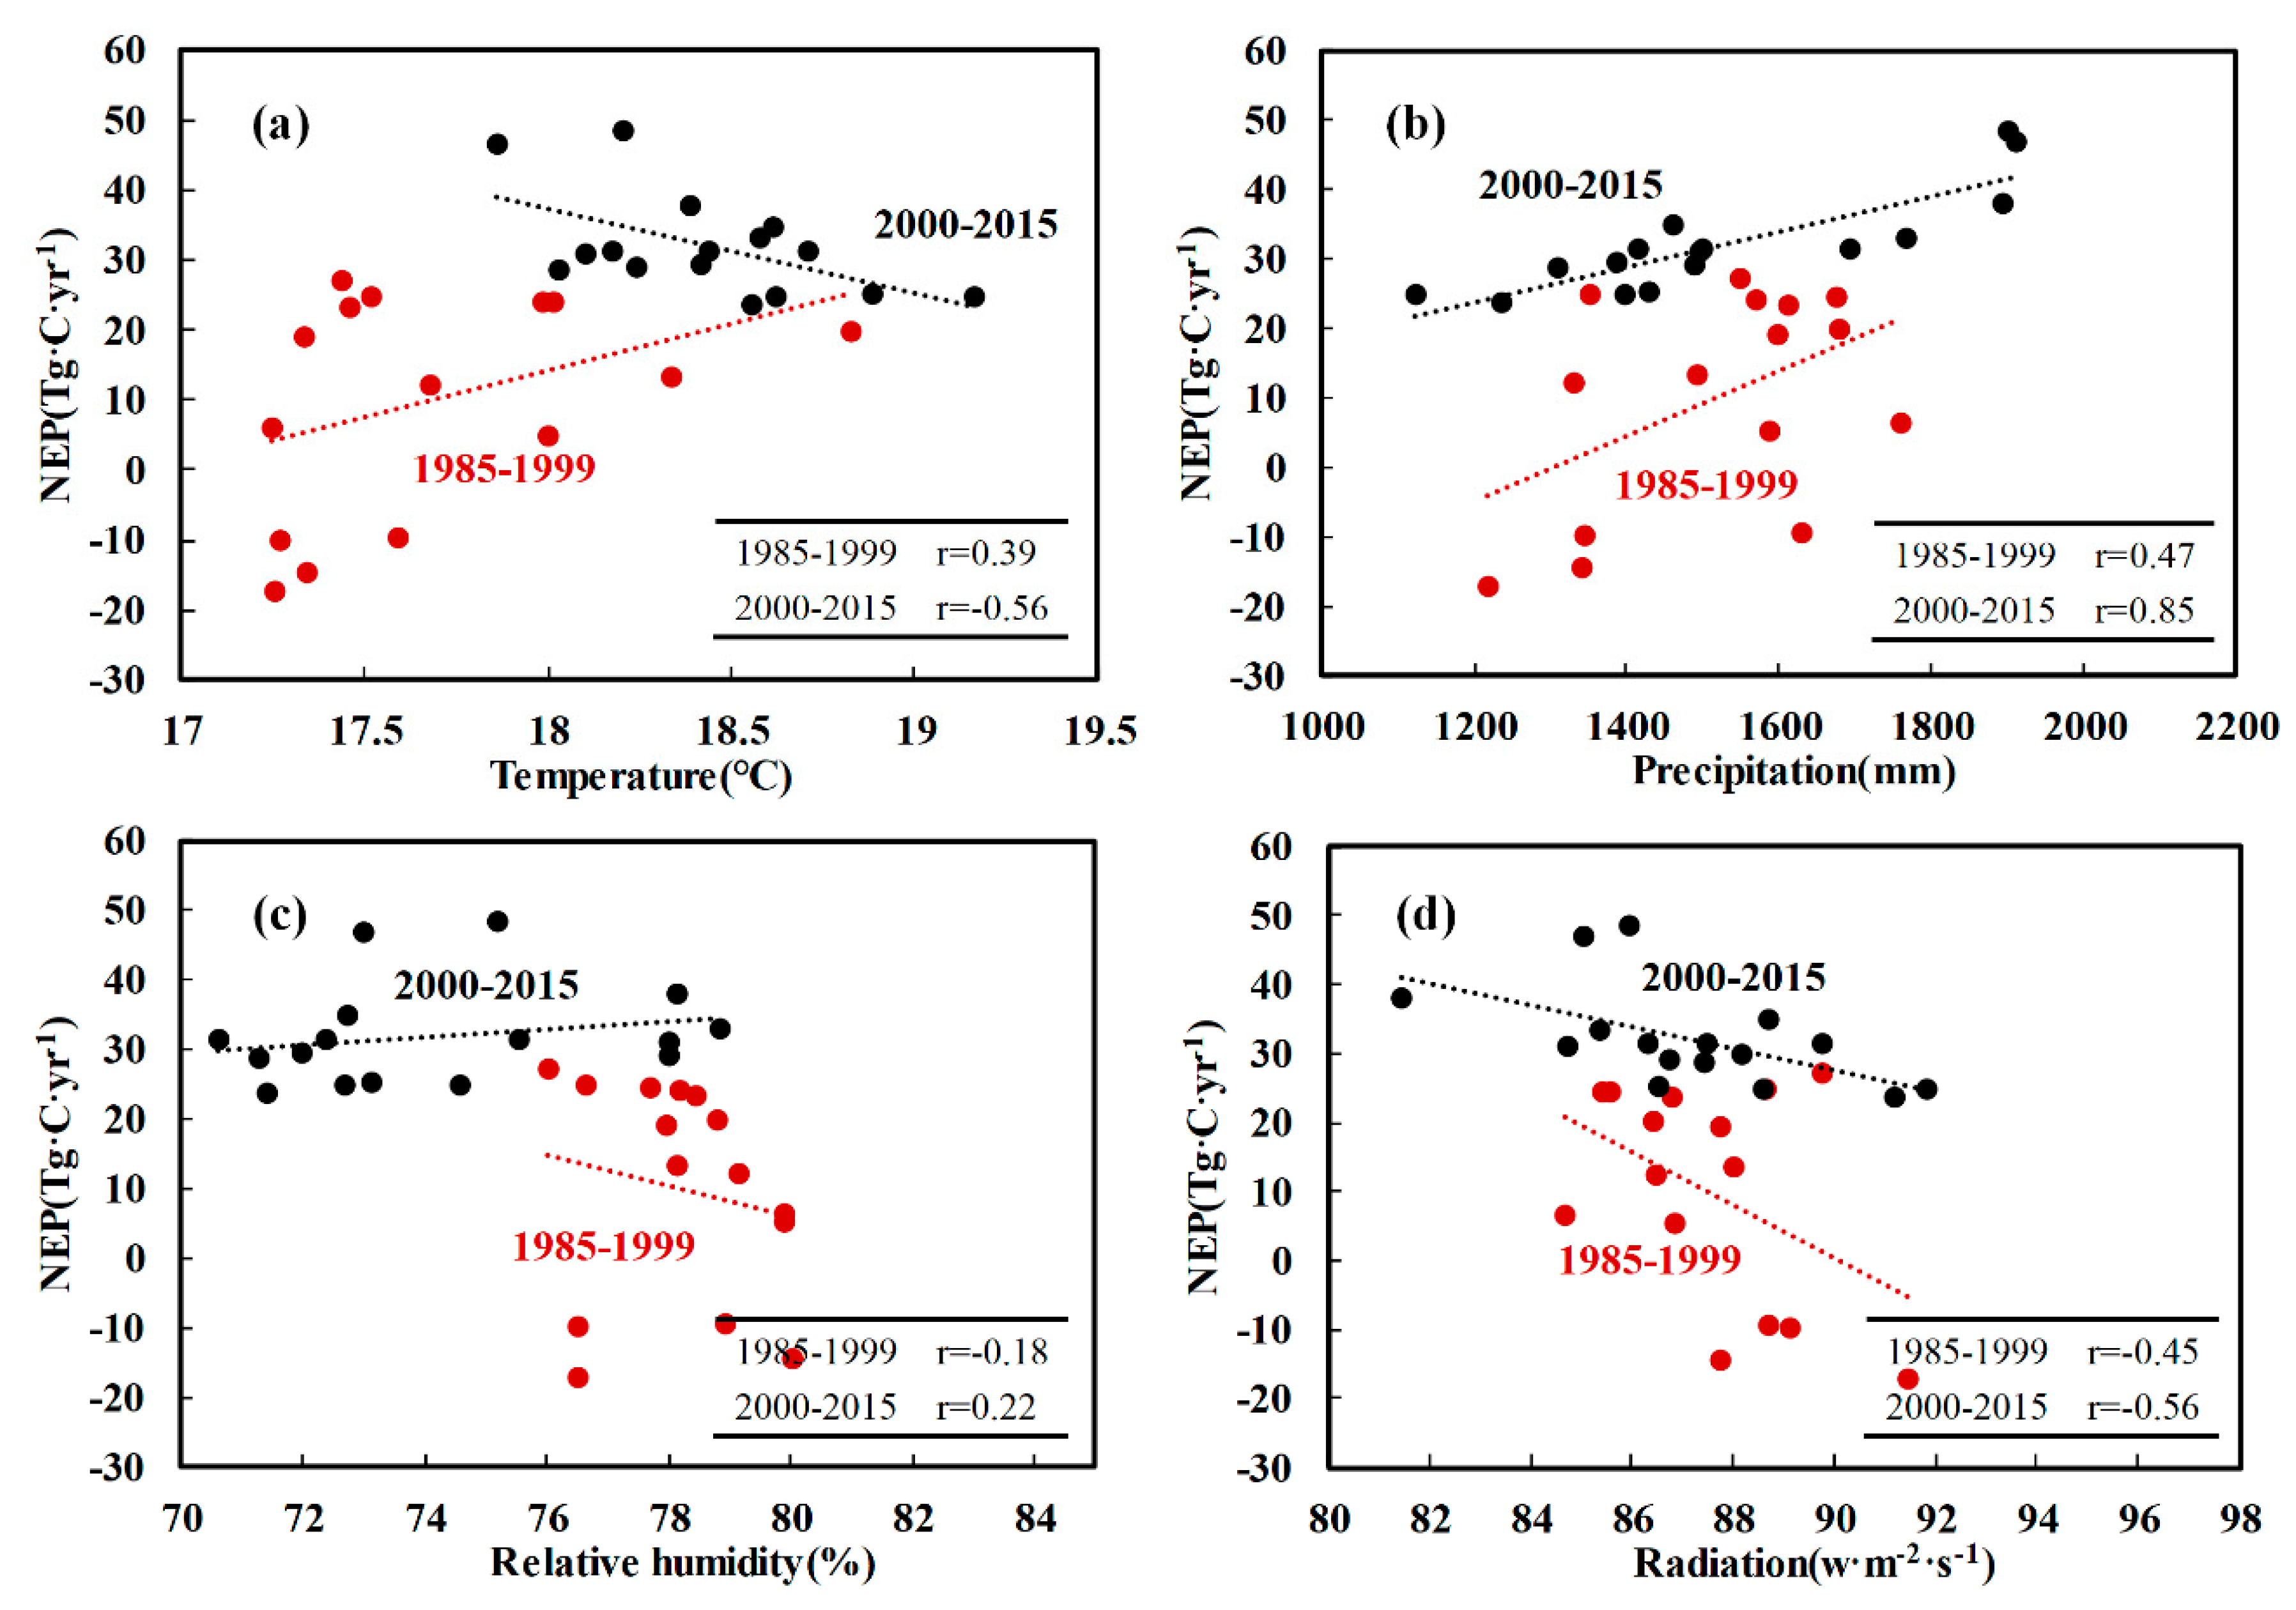
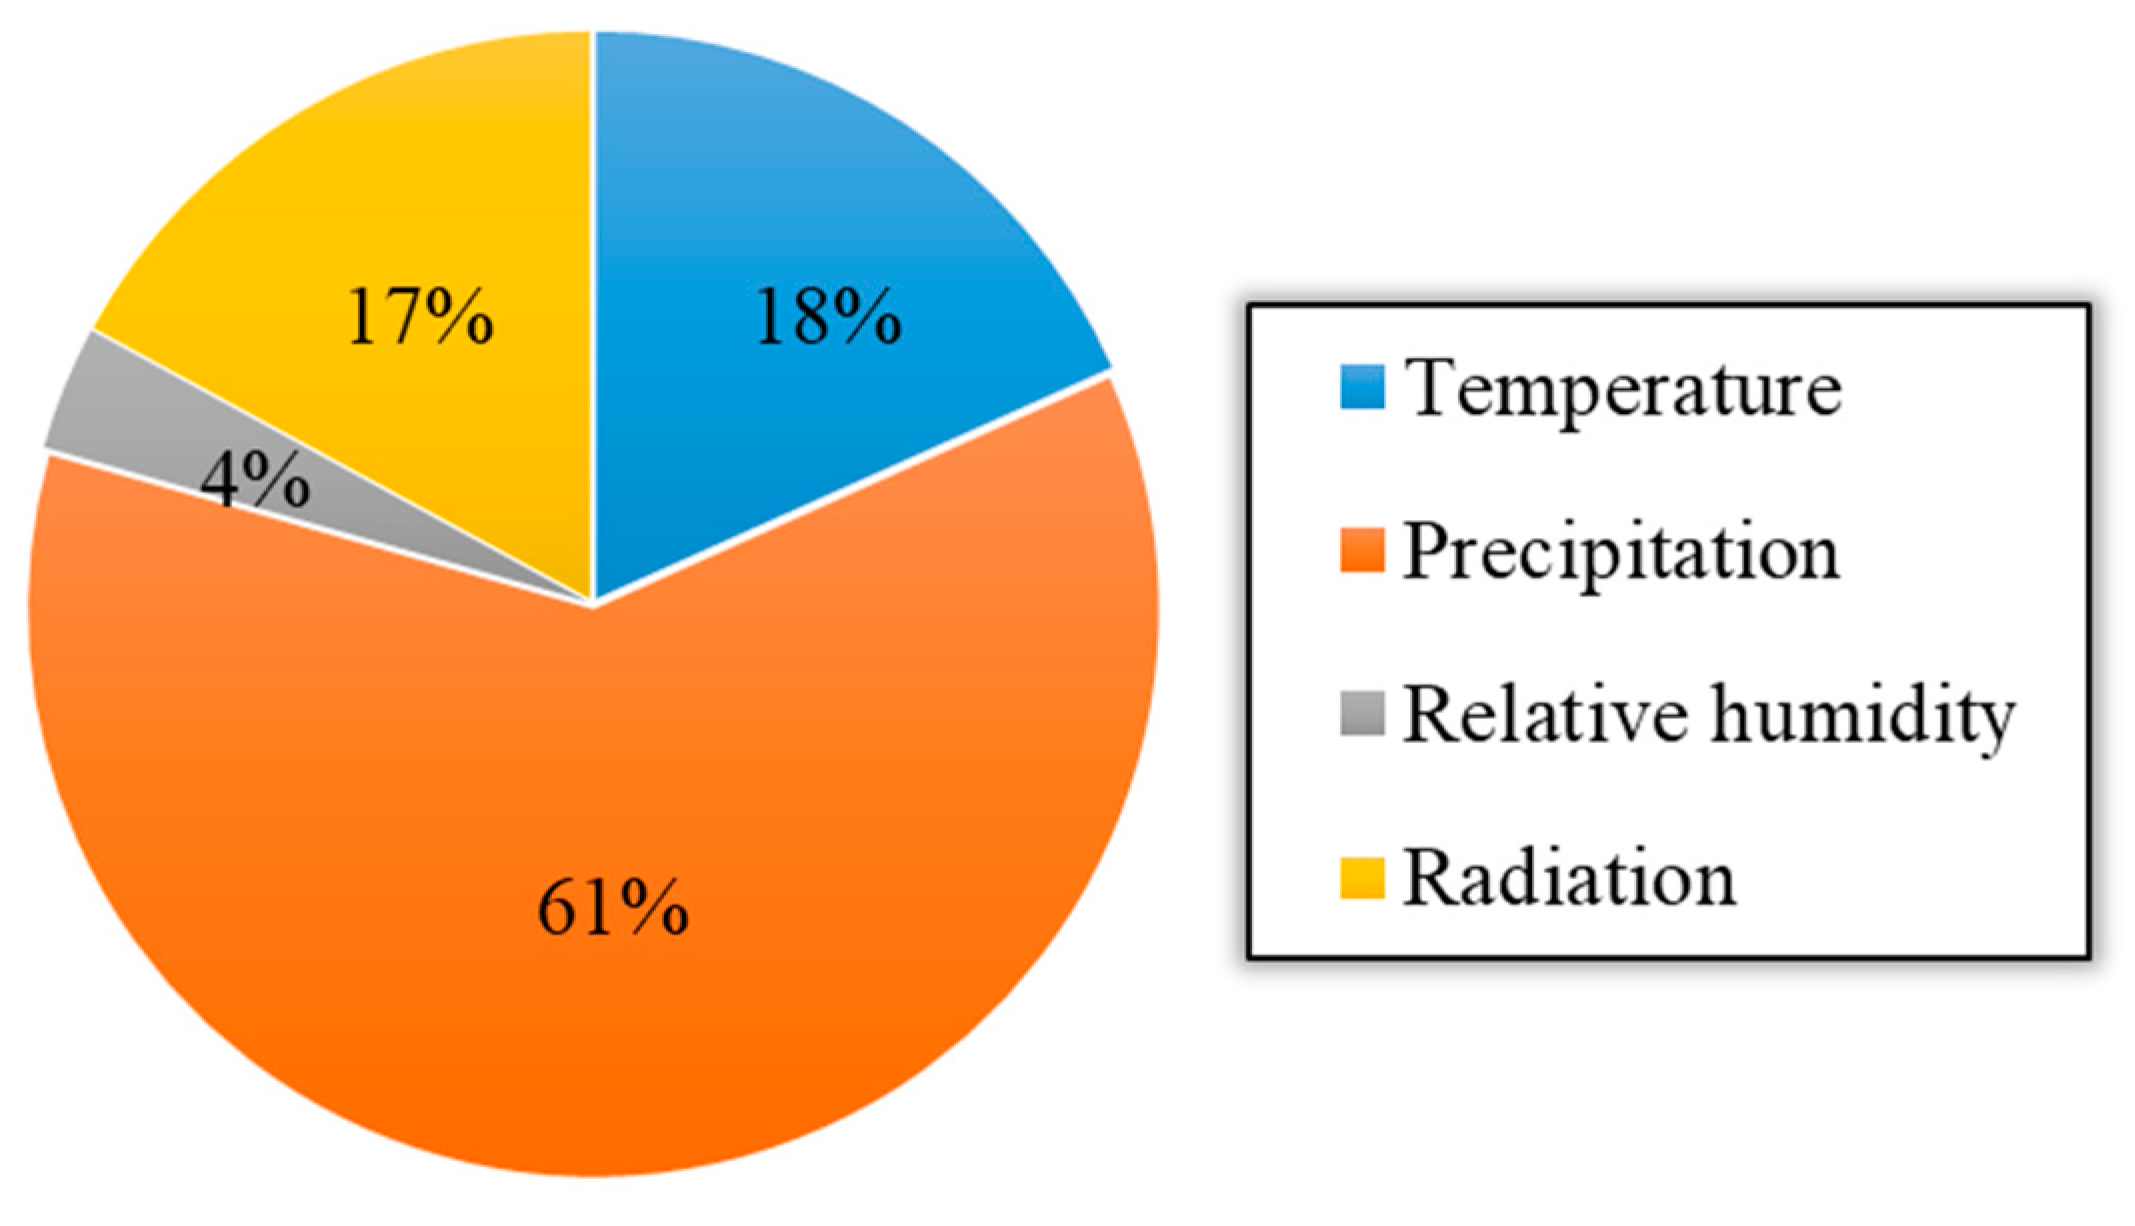
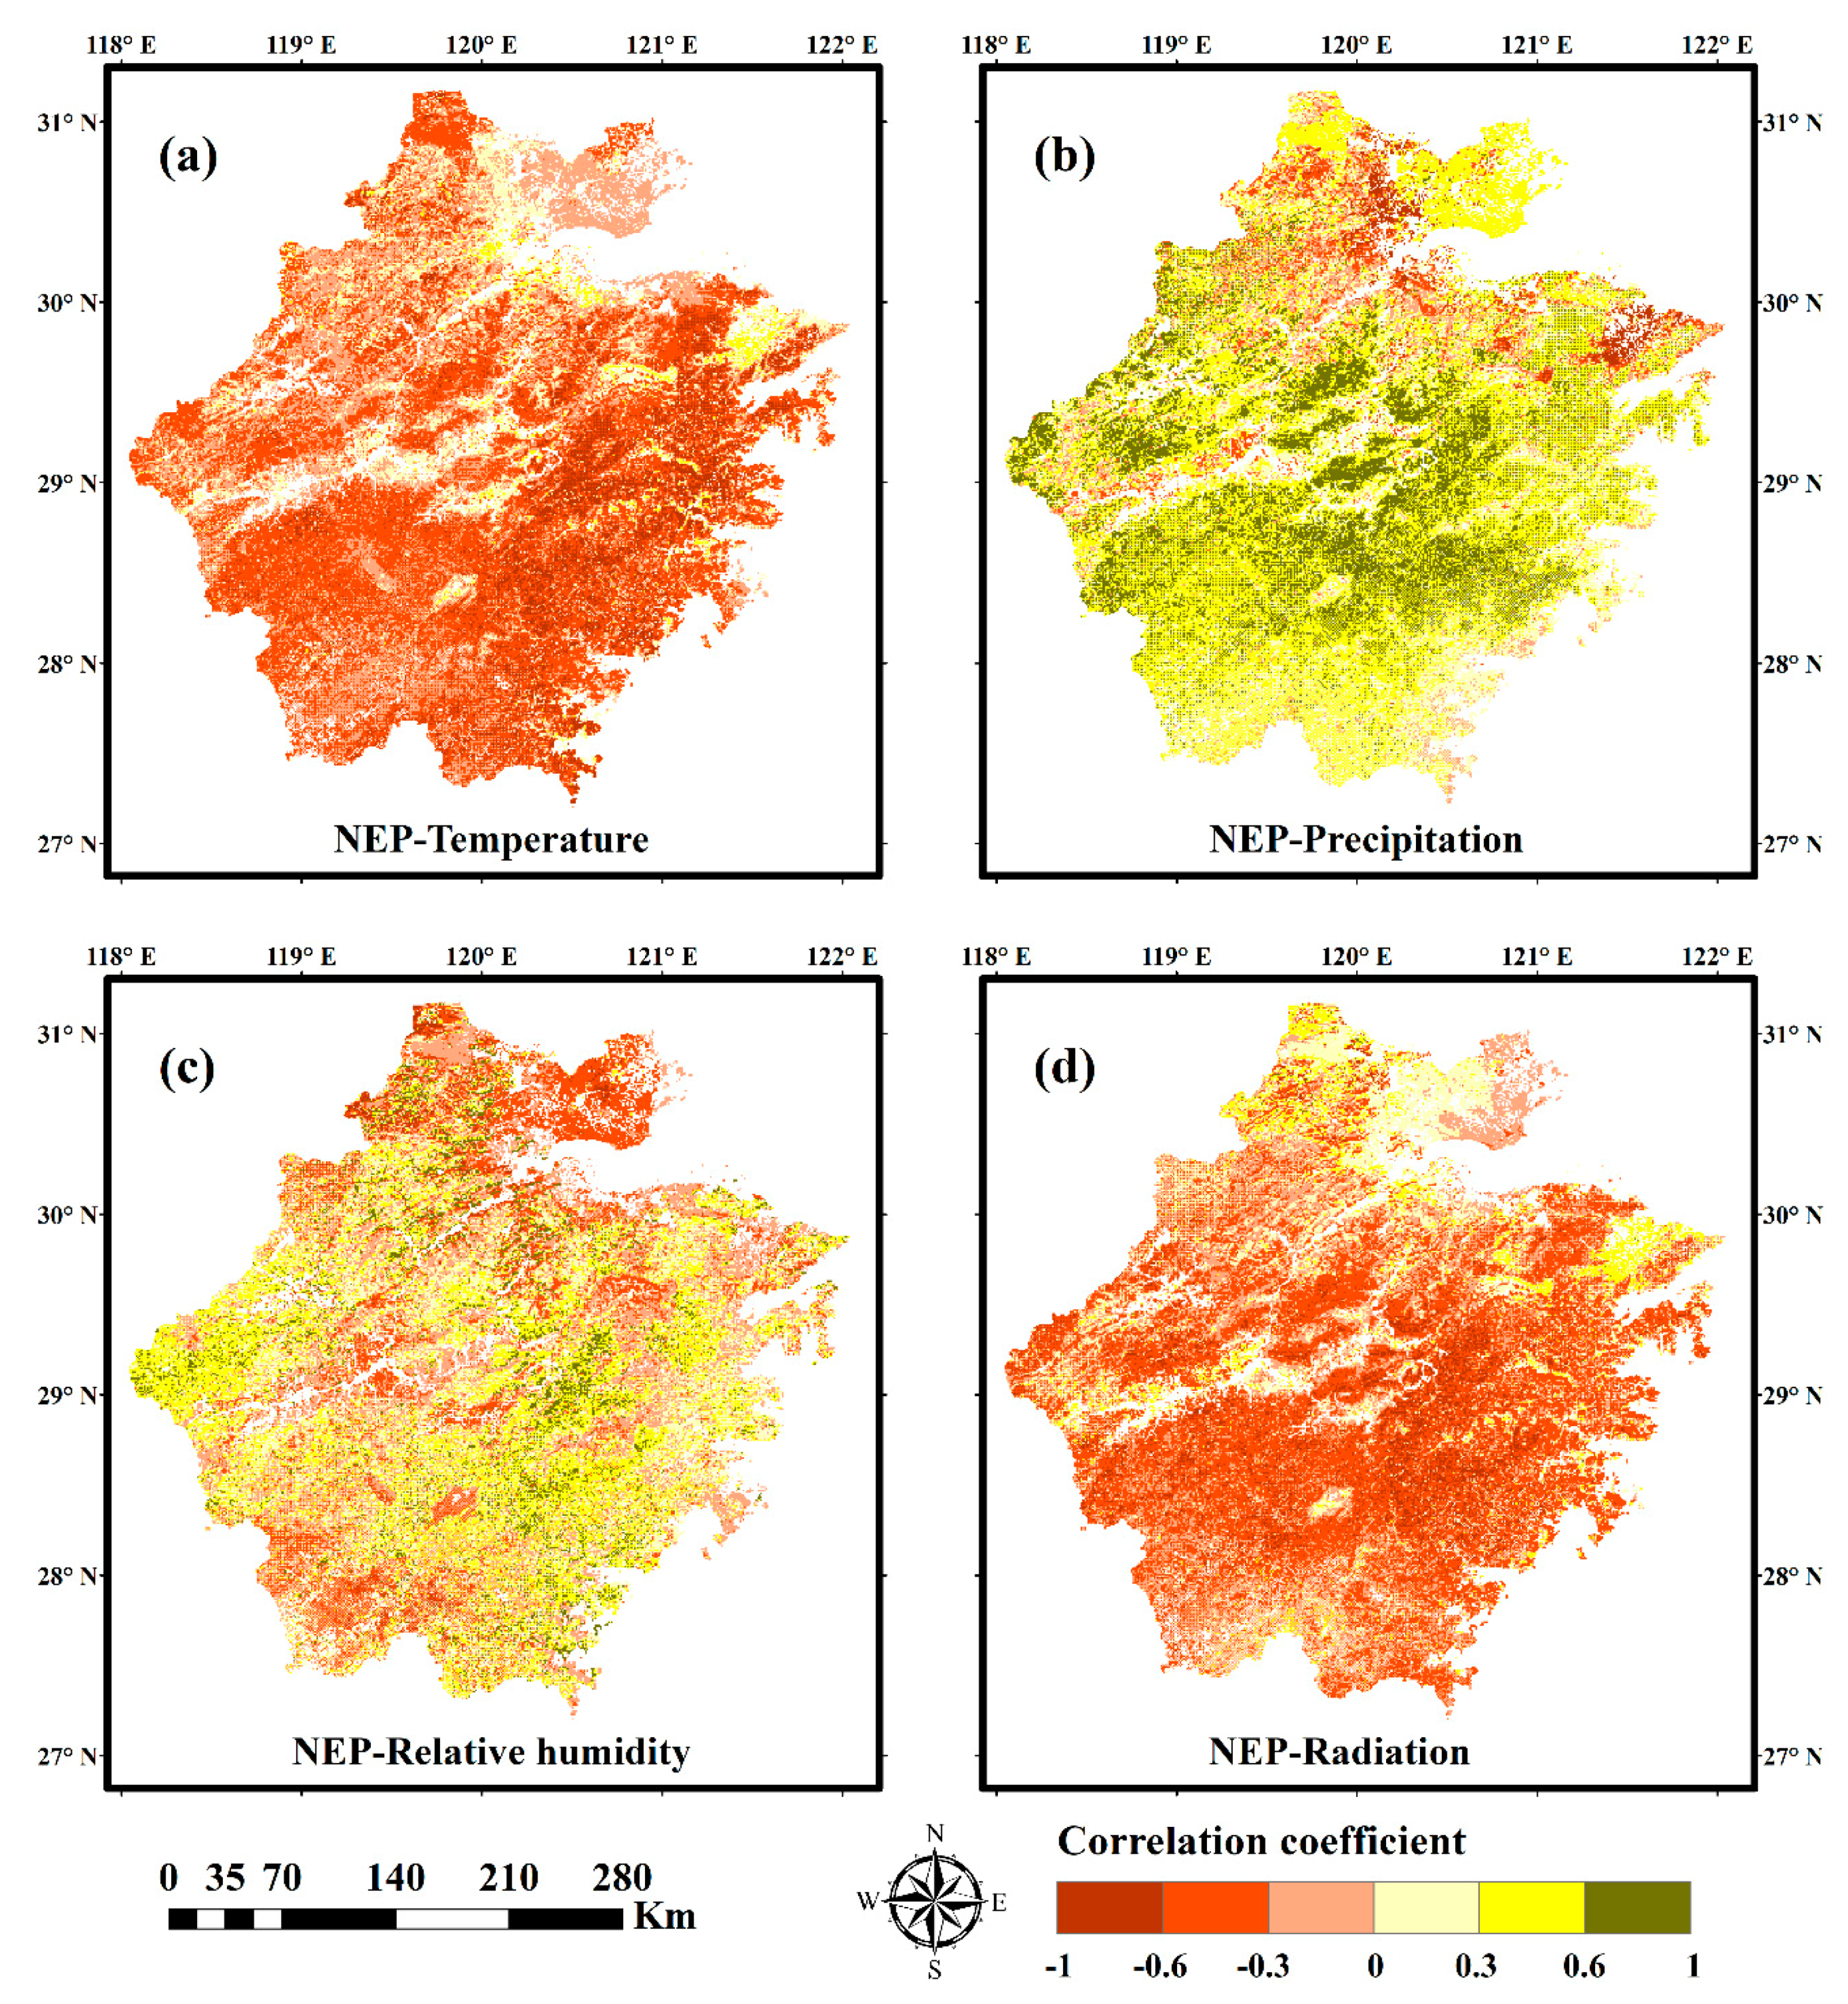
3.4. Relationship between Forest Ecosystem NEP Values and Meteorological Factors in Zhejiang Province

Figure 9 shows the temperature, precipitation, relative humidity, and radiation data of Zhejiang Province from 1985 to 2015. As shown in Figure 9, the temperature of Zhejiang Province shows a significant increasing trend, with an increasing rate of 0.43 °C every 10 years, ranging from 17.24 to 19.16 °C. The average temperature from July to December is 5.7 °C higher than the average temperature from January to June. On the other hand, the trend of increasing precipitation is not obvious. In recent years, precipitation has begun to fluctuate greatly, overall ranging from 1124.14 to 1910.14 mm. The total precipitation in January–June was 222 mm higher than the total precipitation in July–December. Relative humidity shows a decreasing trend, with a range of 70.58–80.01%. There was no significant difference in the relative humidity data between January–June and July–December. The radiation data generally showed a decreasing trend, with a range of 81.43–91.84 w·m−2 s−1. The daily radiation data from July to December was 9.78 w·m−2 s−1 higher than the daily radiation data from January to June.
After 1999, more than 97% of forests in Zhejiang Province were carbon sinks, and NEP increased to a relatively stable value. Therefore, this study used 1999 as the boundary to analyze the relationship between NEP and temperature, precipitation, relative humidity, and radiation in forest ecosystems in Zhejiang Province at two different stages: 1985–1999 and 2000–2015. It can be seen from Figure 10 that the correlation between NEP and relative humidity in forest ecosystems in Zhejiang Province is weak, and the correlation with precipitation is the strongest. From 1985 to 1999, the correlation coefficients of NEP with temperature, precipitation, relative humidity, and radiation were 0.39, 0.47, −0.18, and −0.45, respectively, and the correlations were weak. From 2000 to 2015, NEP and precipitation showed a significant positive correlation; the coefficient reached 0.85. NEP was negatively correlated with temperature and radiation; the correlation coefficient was −0.56. NEP was slightly negatively correlated with relative humidity, and the correlation coefficient was −0.18.

4. Discussion

Research shows that NEP simulated by the InTEC model is consistent with flux observation NEP at three flux sites (Figure 5), but there are still some errors and this can be analyzed from the following aspects. First, the NPPage relationship has an important impact on the simulation accuracy of NEP. However, there are a lot of forests of different ages in Zhejiang Province, and the age of forest resources survey gives the average age of the forests, which leads to NEP simulation error. Of course, NPP simulated by the BEPS model also includes a degree of error, and the transmission of its error may also affect the NPPage relationship, thus affecting the NEP simulation accuracy. Second, the kriging interpolation method was used to interpolate the forest age spatial distribution data, which has a larger kriging error for the spatial range away from the sampling plot [59]. There is a certain degree of error in the interpolation results of the spatial distribution of forest age, and it is inevitable to include error in important input data driving the InTEC model. Third, in this study, three sources of forest abundance data were used to drive the InTEC model, which solved the influence of mixed pixels on the NEP simulation to some extent. However, when the local average method is used to scale the forest distribution data, there will be errors [42], which affects the accuracy of NEP simulations. Fourth, due to the lack of deforestation data from Zhejiang Province, this study only considered the impact of felling in the initial years. This study did not consider the impact of fires because there are few fires in Zhejiang Province. These factors could also lead to errors in the results of the simulation. Although there are various uncertainties in the NEP spatiotemporal simulation of forest ecosystems in Zhejiang Province, the overall accuracy of our simulation is good, and the correlation coefficient of broadleaf forest is up to 0.75. Other than that, due to lack of spatial NEP distribution data, this study did not perform spatial verification; however, we have verified the accuracy of the model at the site scale to ensure the accuracy of the results. Therefore, the lack of spatial verification is acceptable.
During 1985–2015, the forest ecosystem NEP in Zhejiang Province showed an increasing trend, but it also experienced an evolution of spatiotemporal patterns from carbon source to carbon sink. After 1988, forests in Zhejiang Province gradually became dominated by carbon sink forests, and the forest carbon sink capacity gradually increased. From 1985 to 1988, forests in Zhejiang Province were carbon sources, with the NEP reaching −12.75 Tg·C·yr−1. The main reason for this is that Zhejiang Province experienced serious man-made disturbances during this period, which led to the decline of forest quality and productivity [60]. After that, with the country’s beginning to emphasize policies promoting forest resources such as the strengthening of forestry and returning farmland to forest policy [61], the forest quality of Zhejiang Province gradually improved. The forest structure has become more stable, the forest area has gradually increased, and the forest has gradually changed from young forest to a mixture of middle and young forest. Therefore, the forest carbon sink capacity of Zhejiang Province increased rapidly after 1988. It can be seen from Figure 6 that there was a significant increase in NEP in 2009. In addition to the above reasons, this can also be attributed to the precipitation surge and the suitable temperatures of 2009, during which better rain and heat conditions allowed NEP to increase rapidly. In addition, as shown in the spatial distribution of NEP (Figure 7), the carbon sink capacity in the eastern and southwestern parts of Zhejiang Province is strong, and that in the northeast is weak. This is mainly because the southwestern part of Zhejiang Province is dominated by mountains and hills, with less man-made disturbance and better forest quality, while the northeastern part of Zhejiang Province is dominated by plains. Rapid urbanization, which has caused changes in land use type, forest destruction, and area reduction to a certain extent, has affected the carbon sink capacity of forests. The slope map of the NEP changes and the histogram of the frequency distribution of the cities in Zhejiang Province from 1985 to 2015 are shown in Figure 11. It can be seen from Figure 11a that most of the areas with slope values less than 0 are located along the coast and around the city; urban expansion has led to forest destruction in these places. Areas where NEP has increased are widely distributed throughout Zhejiang Province. It can be seen from Figure 11b that the NEP in most forests in Zhejiang Province has shown an increasing trend in the past 30 years, and the NEP slope is mainly concentrated between 0 and 36. Only 21% of forest NEP values have shown a slight decrease. Among them, 90.9% of these areas have a NEP slope between −8 and 0.
Statistics show that during the period of 2000–2015, more than 97% of forests in Zhejiang Province were carbon sinks, and the total annual NEP of the forest ecosystems was 32.02 Tg·C·yr−1 and the annual average NEP was 441.91 gC·m−2·yr−1. The carbon sink capacity was higher than that of the Poyang Lake Basin forest ecosystem in the same subtropical region with an annual average NEP of 204 gC·m−2·yr−1 [28], as well as the forest ecosystem of Jiangxi Province with an annual average NEP of 135.48 gC·m−2·yr−1 [62]. Of course, the Zhejiang coniferous forests’ average NEP (416.36 gC·m−2·yr−1) was higher than found in any other study [63], and the broadleaf forests’ average NEP (632.47 gC·m−2·yr−1) simulated in this study, to some extent, was lower than other related studies [63,64]. This may be due to the fact that forests in Zhejiang Province are still dominated by young and middle-aged forests [65], but the productivity of coniferous forests is larger than that of broad-leaved forests. NEP with higher productivity also increases with age, showing rapid growth at a young age and a rapid decline in old age [21,66].
Many studies have found that meteorological factors such as temperature, precipitation, solar radiation, and water pressure have a great influence on NEP [67,68,69]. Therefore, this study analyzed the relationship between these meteorological factors and NEP in detail. This study analyzed the relationship between NEP and climatic factors across two stages: 1985–1999 and 2000–2015. Before 2000, the forests in Zhejiang Province were mainly dominated by young forests. However, the age of young forests has a great impact on NEP, and after 2000, 97% of forests in Zhejiang Province were carbon sinks; this is more convenient for our later research. Because of the uncertainty in the relationship between the NEP and meteorological factors over a short period of time, we need to analyze the relationship over a relatively long period of time. Studies have shown that NEP had a weak correlation coefficient with temperature, precipitation, relative humidity, and radiation before 2000. This also proves that the age of the forests and other factors in this period had a great impact on NEP. After 2000, the NEP began to show an extremely significant positive correlation with precipitation and significant negative correlation with temperature and radiation and was weakly correlated with relative humidity. The average annual sunshine hours in Zhejiang Province reached 1710–2100 h, and the average annual temperature between 15 and 18 °C. Especially in recent years, high temperatures and dry weather may have affected the carbon sink function of forest ecosystems. Research has also shown that high temperatures and drought can cause a reduction in the carbon sink capacity of subtropical forest ecosystems. For example, high temperatures and drought occurred in the summer of 2010, which reduced the gross primary productivity (GPP) and net primary productivity (NPP) of southwestern China by 0.65 billion and 0.45 billion tons [70], respectively. The extremely high temperatures and drought in July–August 2013 reduced the carbon fixation of forests in southern China by about 100 million tons, accounting for 46% of the net carbon sinks of the national terrestrial ecosystem [71]. From 1997 to 2007, the annual carbon absorption in the north subtropical evergreen coniferous forests in the United States decreased by 37.4% due to prolonged drought [35]. The above cases show that weakening of the carbon sink function of subtropical forest ecosystems, especially in hot weather, is a common phenomenon. However, Zhejiang Province has a subtropical monsoon climate, with an average annual precipitation of 980–2000 mm. It has abundant precipitation, which is an important condition for the growth of young forests; therefore, NEP is positively correlated with precipitation. The forest NEP in Zhejiang Province is weakly correlated with relative humidity. An increase in radiation will lead to an increase in the proportion of direct radiation, and the proportion of scattered radiation will decrease. Most canopy sun leaves are in a state of light saturation, and the canopy shade leaves are in a state of light loss. Therefore, an increase of radiation has no obvious effect on the sun leaves, but the photosynthesis of the shade leaf will decrease because the photosynthesis of the shade leaves accounts for more than 70% of the photosynthesis of the entire canopy. Therefore, the photosynthesis of the whole vegetation will be reduced, and the increase of radiation will lead to an increase in soil carbon emissions, so there is a negative correlation between radiation and forest NEP. The relative contribution rate of temperature, precipitation, relative humidity, and radiation data to the forest NEP in Zhejiang Province, on the time scale from 2000 to 2015, is shown in Figure 12. As with the correlation analysis, precipitation is the main influencing factor and its relative contribution rate is 61%, which is also in line with the actual situation of vegetation growth in some arid regions. The relative contribution rates of temperature and radiation are similar, 18% and 17%, respectively, and the relative contribution rate of relative humidity is the lowest, at only 4%. Combined with the results of the correlation analysis, that is, within the appropriate range, an increase of precipitation will lead to an increase in forest NEP, while an increase in temperature and solar radiation will lead to a decrease in forest NEP, and a change in relative humidity will have little effect on forest NEP.
However, Figure 13 shows the spatial distribution of the correlation between NEP and temperature, precipitation, relative humidity, and radiation in the forest ecosystem of Zhejiang Province from 2000 to 2015. From the analysis of Figure 13a, 84% of forests’ NEP values in Zhejiang Province are negatively correlated with temperature. Among them, 10% of forests’ NEP values had an extreme, significantly negative correlation with temperature, and 44% were significantly negatively correlated with temperature. However, abundant precipitation conditions made 85% of forests in Zhejiang Province show positive correlations between NEP and precipitation (Figure 13b), in which 19% of forests’ NEP values were extremely significantly positively correlated with precipitation, and 40% were significantly positively correlated with precipitation. From the analysis of Figure 13c, 44% of forests’ NEP values in Zhejiang Province were negatively correlated with relative humidity. From the analysis of Figure 13d, 78% of forests’ NEP values were negatively correlated with radiation. Among them, 7% of forests were extremely significantly negatively correlated with radiation, and 44% were significantly correlated with radiation.
Recent studies have shown that spatiotemporal variability of forest carbon sequestration in Zhejiang Province mainly exhibits spatial autocorrelation [53,59,65,72]. With the reduction of human disturbance in the forest, natural factors such as the climate, topography, and soil have a greater impact on the spatial pattern of carbon sequestration in forest ecosystems in Zhejiang Province. Of course, this also shows that during the period of 1985–1999, the frequent human disturbance of the forest affected its carbon sink function, so the correlation between NEP and meteorological factors such as precipitation and temperature was poor (e.g., Figure 10).

5. Conclusions

This study used the InTEC model to simulate the spatiotemporal pattern of forest ecosystems’ NEP in Zhejiang Province and analyzed their correlation with meteorological factors such as temperature, precipitation, relative humidity, and radiation. Studies have shown that the optimized InTEC model can better simulate the spatiotemporal distribution of forest ecosystems’ NEP values in Zhejiang Province, and the correlation coefficient between the simulated NEP and observed NEP is up to 0.75. From 1985 to 2015, the forest ecosystem NEP of Zhejiang Province showed a rapidly increasing trend, with an annual average increase rate of 1.52 Tg·C·yr−1, while forests in Zhejiang Province were carbon sources from 1985 to 1988. After that, the forest carbon sink ability gradually increased, and the annual average NEP increased to 393.91 gC·m−2·yr−1. The carbon sequestration capacity of forests in the east and southwest is higher than in the northeast plains. From 2000 to 2015, forests in Zhejiang Province were dominated by carbon sink forests. During this period, there was an extremely significant correlation between forest ecosystem NEP and precipitation, with correlation coefficients of 0.85, and there was a significant correlation between NEP and temperature and radiation, with the same correlation coefficient of −0.56. However, there was only slight correlation between NEP and relative humidity. At the same time, the relative contribution rate of NEP to temperature, precipitation, relative humidity, and radiation shows that precipitation to NEP was the largest, reaching 61%, followed by temperature and radiation, which were 18% and 17%, respectively. The relative contribution rate of relative humidity was the smallest, at only 4%. During the period of 1985–1999, frequent man-made disturbance led to a weak correlation between NEP and temperature, precipitation, relative humidity, and radiation. This indicated that precipitation has a great impact on the carbon sequestration function of forest ecosystems in Zhejiang Province and that temperature and radiation have particular scientific significance for studying the ability of subtropical forests to cope with climate change.

Author Contributions

Conceptualization, H.D.; data curation, X.L., L.D., M.Z., N.H., T.L., and L.X.; methodology, J.Z. and F.M.; supervision, G.Z.; validation, F.M.; writing—original draft, J.Z.; writing—review and editing, H.D.

Funding

The authors gratefully acknowledge the support of the National Natural Science Foundation (No. 31670644, U1809208), the State Key Laboratory of Subtropical Silviculture (No. ZY20180201), the Joint Research fund of Department of Forestry of Zhejiang Province, the Chinese Academy of Forestry (2017SY04), and the Zhejiang Provincial Collaborative Innovation Center for Bamboo Resources and High-efficiency Utilization (No. S2017011).

Acknowledgments

The authors gratefully acknowledge the supports of various foundations. The authors are grateful to the Editor and anonymous reviewers whose comments have contributed to improving the quality of this paper and we would like to acknowledge Ning Han for her English editing of the article.

Conflicts of Interest

The authors declare that they have no competing interests.

References

  1. Tian, H.; Melillo, J.M.; Kicklighter, D.W.; McGuire, A.D.; Helfrich, J.V.; Moore, B.; Vörösmarty, C.J. Effect of interannual climate variability on carbon storage in Amazonian ecosystems. Nature 1998, 396, 664–667. [Google Scholar] [CrossRef]
  2. Ito, A. The regional carbon budget of East Asia simulated with a terrestrial ecosystem model and validated using AsiaFlux data. Agric. For. Meteorol. 2008, 148, 738–747. [Google Scholar] [CrossRef]
  3. Piao, S.; Tan, K.; Nan, H.; Ciais, P.; Fang, J.; Wang, T.; Zhu, B. Impacts of climate and CO2 changes on the vegetation growth and carbon balance of Qinghai-Tibetan grasslands over the past five decades. Glob. Planet. Chang. 2012, 98–99, 73–80. [Google Scholar] [CrossRef]
  4. Gao, S.; Zhou, T.; Zhao, X.; Wu, D.; Li, Z.; Wu, H.; Luo, H. Age and climate contribution to observed forest carbon sinks in East Asia. Environ. Res. Lett. 2016, 11, 034021. [Google Scholar] [CrossRef]
  5. Liu, W.G. Study on Net Primary Productivity and Carbon Temporal and Spatial Variation of Terrestrial Ecosystems in Xinjiang; Xinjiang University: Wulumuqi, China, 2007. [Google Scholar]
  6. Tao, B.; Cao, M.; Li, K.; Gu, F.; Ji, J.; Huang, M.; Zhang, L. Spatial patterns of terrestrial net ecosystem productivity in China during 1981–2000. Sci. China 2007, 50, 745–753. [Google Scholar] [CrossRef]
  7. Li, J. Temporal and spatial dynamics of net ecosystem productivity in Northeast China in the past 50 years. Acta Ecol. Sin. 2014, 34, 1490–1502. [Google Scholar]
  8. Pan, J.H.; Huang, K.J.; Li, Z. Temporal and spatial variation of net primary productivity of vegetation in the Shule River Basin from 2001 to 2010 and its relationship with climatic factors. Acta Ecol. Sin. 2017, 37, 1888–1899. [Google Scholar]
  9. Lu, X.L.; Zhuang, Q.L. Evaluating climate impacts on carbon balance of the terrestrial ecosystems in the Midwest of the United States with a process-based ecosystem model. Mitig. Adapt. Strateg. Glob. Chang. 2010, 15, 467–487. [Google Scholar] [CrossRef]
  10. Xu, S. A Summary of Methods for Estimating Forest Carbon Storage. For. Inventory Plan. 2014, 39, 28–33. [Google Scholar]
  11. Wang, X.; Sun, Y. Estimation Methods and Research Progress of Carbon Storage in Forest Ecosystem. World For. Res. 2008, 21, 24–29. [Google Scholar]
  12. Zhang, Z.; Tian, X.; Chen, E.; He, Q. A Summary of Researches on Forest Ground Biomass Estimation Methods. J. Beijing For. Univ. 2011, 33, 144–150. [Google Scholar]
  13. Cao, J.; Tian, Y.; Wang, X.; Sun, X. Estimation methods and development trends of forest carbon sinks. Ecol. Environ. 2009, 18, 401–405. [Google Scholar]
  14. Ruimy, A.; Saugier, B.; Dedieu, G. Methodology for the estimation of terrestrial net primary production from remotely sensed data. J. Geophys. Res. Atmos. 1994, 99, 5263–5284. [Google Scholar] [CrossRef]
  15. Losch, M.; Schröter, J.; Wenzel, M. Testing a marine ecosystem model: Sensitivity analysis and parameter optimization. J. Mar. Syst. 2001, 28, 45–63. [Google Scholar]
  16. Fang, J.Y. Global Ecology Climate Change and Ecological Response; Higher education Press: Beijing, China, 2000. [Google Scholar]
  17. Cao, M.K.; Yu, G.R. Multi-scale observation and cross-scale mechanistic modeling on terrestrial ecosystem carbon cycle. Sci. China Ser. D Earth Sci. 2005, 48, 17–32. [Google Scholar]
  18. Zhao, G.S.; Wang, J.B.; Fan, W.Y. Simulation and seasonal variation of net primary productivity of vegetation in Northeast China from 2000 to 2008. Chin. J. Appl. Ecol. 2011, 22, 621–630. [Google Scholar]
  19. Wang, X.K.; Feng, Z.W. The potential of plants to fix atmospheric carbon in Chinese forest ecosystems. Chin. J. Ecol. 2000, 19, 72–74. [Google Scholar]
  20. Li, Y. Carbon storage and distribution characteristics of forest ecosystems in Zhejiang Province. Chin. J. Plant Ecol. 2016, 40, 354–363. [Google Scholar]
  21. Yu, Y. Temporal and Spatial Distribution of Carbon Source/Sink in Northeast China Forest Based on InTEC Model; Northeast Forestry University: Haerbin, China, 2013. [Google Scholar]
  22. Farquhar, G.D.; Von, C.S.; Berry, J.A. A biochemical model of photosynthetic CO2 assimilation in leaves of C 3 species. Planta 1980, 149, 78–90. [Google Scholar] [CrossRef]
  23. Parton, W.J.; Scurlock, J.M.O.; Ojima, D.S.; Gilmanov, T.G.; Scholes, R.J.; Schimel, D.S.; Kamnalrut, A. Observations and modeling of biomass and soil organic matter dynamics for the grassland biome worldwide. Glob. Biogeochem. Cycles 1993, 7, 785–809. [Google Scholar] [CrossRef] [Green Version]
  24. Townsend, A.R.; Braswell, B.H.; Holland, E.A.; Penner, J.E. Spatial and Temporal Patterns in Terrestrial Carbon Storage Due to Deposition of Fossil Fuel Nitrogen. Ecol. Appl. 1996, 6, 806–814. [Google Scholar] [CrossRef]
  25. Chen, W.J.; Chen, J.M.; Cihlar, J. An integrated terrestrial ecosystem carbon-budget model based on changes in disturbance, climate, and atmospheric chemistry. Ecol. Model. 2000, 135, 55–79. [Google Scholar] [CrossRef]
  26. Chen, J.; Chen, W.; Liu, J.; Cihlar, J. Annual carbon balance of Canada’s forests during 1895–1996. Glob. Biogeochem. Cycles 2000, 14, 839–849. [Google Scholar] [CrossRef]
  27. Shao, Y.; Pan, J.; Yang, L.; Chen, J.M.; Ju, W.M.; Shi, X. Tests of soil organic carbon density modeled by InTEC in China’s forest ecosystems. J. Environ. Manag. 2007, 85, 696–701. [Google Scholar] [CrossRef] [PubMed]
  28. Lei, Z.; Shaoqiang, W.; Weimin, J.; Zhe, X.; Kindermann, G.; Jingming, C.; Hao, S. Assessment of Carbon Dynamics of Forest Ecosystems in the Poyang Lake Basin Responding to Afforestation and Future Climate Change. J. Resour. Ecol. 2013, 4, 11–19. [Google Scholar] [CrossRef]
  29. Wu, C.; Chen, J.M. Reconstruction of interannual variability of NEP using a process-based model (InTEC) with climate and atmospheric records at Fluxnet-Canada forest sites. Int. J. Climatol. 2014, 34, 1715–1722. [Google Scholar] [CrossRef]
  30. Zhang, F.; Chen, J.M.; Pan, Y.; Birdsey, R.A.; Shen, S.; Ju, W.; He, L. Attributing carbon changes in conterminous U.S. forests to disturbance and non-disturbance factors from 1901 to 2010. J. Geophys. Res. Bio Geosci. 2015, 117, 109–119. [Google Scholar]
  31. Piao, S.; Fang, J.; Ciais, P.; Peylin, P.; Huang, Y.; Sitch, S.; Wang, T. The carbon balance of terrestrial ecosystems in China. China Basic Sci. 2010, 458, 1009–1013. [Google Scholar] [CrossRef]
  32. Yan, J.; Wang, Y.; Zhou, G.; Zhang, D. Estimates of soil respiration and net primary production of three forests at different succession stages in South China. Glob. Chang. Biol. 2010, 12, 810–821. [Google Scholar] [CrossRef]
  33. Fang, J.Y.; Yu, G.R.; Ren, X.B.; Liu, G.H.; Zhao, X.Q. Carbon Sequestration Effect of China’s Terrestrial Ecosystem: Advances in the Ecosystem Carbon Sequestration Task Force of the Strategic Pilot Science and Technology Special Project of the Chinese Academy of Sciences on Carbon Accident Certification and Related Issues in Addressing Climate Change. Bull. Chin. Acad. Sci. 2015, 848–857. [Google Scholar]
  34. Chen, W.J.; Jing, C.; Liu, J.; Cihlar, J. Approaches for reducing uncertainties in regional forest carbon balance. Glob. Biogeochem. Cycles 2000, 14, 827–838. [Google Scholar] [CrossRef]
  35. Schwalm, C.R.; Williams, C.A.; Schaefer, K.; Baldocchi, D.; Black, T.A.; Goldstein, A.H.; Scott, R.L. Reduction in carbon uptake during turn of the century drought in western North America. Nat. Geosci. 2012, 5, 551–556. [Google Scholar] [CrossRef] [Green Version]
  36. Chen, J.M.; Liu, J.; Cihlar, J.; Goulden, M.L. Daily canopy photosynthesis model through temporal and spatial scaling for remote sensing applications. Ecol. Model. 1999, 124, 99–119. [Google Scholar] [CrossRef] [Green Version]
  37. Ju, W.; Chen, J.M. Distribution of soil carbon stocks in Canada’s forests and wetland simulated based on drainage class, topography and remote sensing. Hydrol. Process. 2010, 199, 77–94. [Google Scholar]
  38. Parton, W.J.; Stewart, J.W.B.; Cole, C.V. Dynamics of C, N, P and S in grassland soils: A model. Biogeochemistry 1988, 5, 109–131. [Google Scholar] [CrossRef]
  39. Chen, J.M.; Ju, W.; Cihlar, J.; Price, D.; Liu, J.; Chen, W.; Barr, A. Spatial distribution of carbon sources and sinks in Canada’s forests. Tellus Ser. B Chem. Phys. Meteorol. 2003, 55, 622–641. [Google Scholar]
  40. Huang, L.; Shao, Q.Q.; Liu, J.Y. Forest carbon accumulation process and spatial and temporal patterns of carbon sources/sinks in Jiangxi Province. Acta Ecol. Sin. 2012, 32, 3010–3020. [Google Scholar] [CrossRef]
  41. Li, Y.; Han, N.; Li, X.; Du, H.; Xing, L. Spatiotemporal Estimation of Bamboo Forest Aboveground Carbon Storage Based on Landsat Data in Zhejiang, China. Remote Sens. 2018, 10, 898. [Google Scholar] [CrossRef]
  42. Shang, Z.; Zhou, G.; Du, H.; Xu, X.; Shi, Y.; Lü, Y.; Gu, C. Moso bamboo forest extraction and aboveground carbon storage estimation based on multi-source remotely sensed images. Int. J. Remote Sens. 2013, 34, 5351–5368. [Google Scholar] [CrossRef]
  43. National Meteorological Center of China Meteorological Administration of Site. Available online: http://data.cma.gov.cn (accessed on 1 May 2018).
  44. Guber, A.K.; Pachepsky, Y.A.; Van Genuchten, M.T.; Rawls, W.J.; Simunek, J.; Jacques, D.; Cady, R.E. Field-Scale Water Flow Simulations Using Ensembles of Pedotransfer Functions for Soil Water Retention. Vadose Zone J. 2006, 2006, 234–247. [Google Scholar] [CrossRef]
  45. Koren, V.; Smith, M.; Duan, Q. Use of a priori parameter estimates in the derivation of spatially consistent parameter sets of rainfall-runoff models. Calibration Watershed Models 2003, 239, 103–106. [Google Scholar]
  46. Fang, H.; Wei, S.; Liang, S. Validation of MODIS and CYCLOPES LAI products using global field measurement data. Remote Sens. Environ. 2012, 119, 43–54. [Google Scholar] [CrossRef]
  47. Xijia, L.I.; Xiao, Z.; Wang, J.; Ying, Q.U.; Jin, H. Dual Ensemble Kalman Filter assimilation method for estimating time series LAI. J. Remote Sens. 2014, 18, 27–44. [Google Scholar]
  48. Chen, J.M.; Deng, F.; Chen, M. Locally adjusted cubic-spline capping for reconstructing seasonal trajectories of a satellite-derived surface parameter. IEEE Trans. Geosci. Remote Sens. 2006, 44, 2230–2238. [Google Scholar] [CrossRef]
  49. Li, X.J. Carbon Flux Simulation of Bamboo Forest Ecosystem Based on Double Set Kalman Filter LAI Assimilation Combined with BEPS Model. Chin. J. Appl. Ecol. 2016, 27, 3797–3806. [Google Scholar]
  50. Li, X.; Mao, F.; Du, H.; Zhou, G.; Xu, X.; Han, N.; Chen, L. Assimilating leaf area index of three typical types of subtropical forest in China from MODIS time series data based on the integrated ensemble Kalman filter and PROSAIL model. J. Photogramm. Remote Sens. 2017, 126, 68–78. [Google Scholar] [CrossRef]
  51. Lelieveld, J.; Dentener, F.J. What controls tropospheric ozone? J. Geophys. Res. Atmos. 2000, 105, 3531–3551. [Google Scholar] [CrossRef]
  52. Ad, J.; Veefkind, P.; Dentener, F.; Swen, M.; Cristina, G. Simulation of the Aerosol Optical Depth over Europe for August 1997 and a Comparison with Measurements. J. Geophys. Res. Atmos. 2002, 106, 28295–28311. [Google Scholar]
  53. Mao, F.; Du, H.; Zhou, G.; Li, X.; Xu, X.; Li, P.; Sun, S. Coupled LAI assimilation and BEPS model for analyzing the spatiotemporal pattern and heterogeneity of carbon fluxes of the bamboo forest in Zhejiang Province, China. Agric. For. Meteorol. 2017, 242, 96–108. [Google Scholar] [CrossRef]
  54. Chen, W.J.; Chen, J.M.; Price, D.T.; Cihlar, J. Effects of stand age on net primary productivity of boreal black spruc. Rev. Can. Rech. For. 2002, 32, 833–842. [Google Scholar] [CrossRef]
  55. Niu, X.D. Carbon and Water Flux and Water Vapor Stable Isotope Observations in the Old Forest Ecosystem of Tianmu Mountain; Zhejiang A&F University: Hangzhou, China, 2015. [Google Scholar]
  56. Fang, C.Y. Study on Energy and CO2 Flux of Evergreen and Deciduous Broad-Leaved Mixed Forest in Tianmu Mountain; Zhejiang A&F University: Hangzhou, China, 2016. [Google Scholar]
  57. Niu, X.D. Characteristics of CO2 Flux in Old Forest Ecosystem of Tianmu Mountain in Zhejiang Province. Chin. J. Appl. Ecol. 2016, 27, 1–8. [Google Scholar]
  58. Liu, Y.L. Analysis of Dynamics and Driving Forces of Carbon Budget in Two Typical Bamboo Forest Ecosystems; Zhejiang A&F University: Hangzhou, China, 2018. [Google Scholar]
  59. Du, H.; Zhou, G.; Fan, W.; Ge, H.; Xu, X.; Shi, Y.; Fan, W. Spatial heterogeneity and carbon contribution of aboveground biomass of moso bamboo by using geostatistical theory. Plant Ecol. 2010, 207, 131–139. [Google Scholar] [CrossRef]
  60. Province, D.F.Z. Zhejiang Forestry Natural Resources—Forest Volume; China Agricultural Science and Technology Press: Beijing, China, 2002. [Google Scholar]
  61. Yang, J.B.; Wang, L. Evaluation method of ecological benefit of returning farmland to forest. China Land Sci. 2003, 17, 54–58. [Google Scholar]
  62. Li, D.Q. Simulation Characteristics of Carbon Budget of Subtropical Forests and Its Genesis Simulation: A Case Study of Jiangxi Province; Nanjing University: Nanjing, China, 2014. [Google Scholar]
  63. Wen, X.F.; Wang, H.M.; Wang, J.L.; Yu, G.R. Ecosystem carbon exchanges of a subtropical evergreen coniferous plantation subjected to seasonal drought, 2003–2007. Biogeosciences 2010, 7, 357–369. [Google Scholar] [CrossRef]
  64. Zhou, Y.R.; Yu, Z.L. Carbon storage and carbon balance of major forest ecosystems in China. Chin. J. Plant Ecol. 2000, 24, 518–522. [Google Scholar]
  65. Zhang, F.; Du, Q.; Ge, H.L.; Liu, A.X.; Fu, W.J.; Ji, B.Y. Spatial distribution of forest carbon in Zhejiang Province based on geostatistics and CFI plots. Acta Ecol. Sin. 2012, 32, 5275–5286. [Google Scholar] [CrossRef]
  66. He, L.; Chen, J.M.; Pan, Y.; Birdsey, R.; Kattge, J. Relationships between net primary productivity and forest stand age in U.S. forests. Glob. Biogeochem. Cycles 2012, 26, 3. [Google Scholar] [CrossRef]
  67. Kljun, N.; Black, T.A.; Griffis, T.J.; Barr, A.G.; Gaumont-Guay, D.; Morgenstern, K.; Nesic, Z. Response of Net Ecosystem Productivity of Three Boreal Forest Stands to Drought. Ecosystems 2007, 10, 1039–1055. [Google Scholar] [CrossRef] [Green Version]
  68. Grant, R.F.; Barr, A.G.; Black, T.A.; Gaumont-Guay, D.; Iwashita, H.; Kidson, J.; Saigusa, N. Net ecosystem productivity of boreal jack pine stands regenerating from clearcutting under current and future climates. Glob. Chang. Biol. 2010, 13, 1423–1440. [Google Scholar] [CrossRef]
  69. Li, D.Q.; Zhou, Y.; Wang, H. Simulation Analysis of the Influence of Solar Radiation Variation on the Total Primary Productivity of Subtropical Artificial Evergreen Coniferous Forest. Chin. J. Plant Ecol. 2014, 38, 219–230. [Google Scholar]
  70. Zhang, L.; Xiao, J.; Li, J.; Wang, K.; Lei, L.; Guo, H. The 2010 spring drought reduced primary productivity in southwestern China. Environ. Res. Lett. 2012, 7, 045706. [Google Scholar] [CrossRef] [Green Version]
  71. Yuan, W.; Cai, W.; Chen, Y.; Liu, S.; Dong, W.; Zhang, H.; Liu, D. Severe summer heatwave and drought strongly reduced carbon uptake in Southern China. Sci. Rep. 2016, 6, 18813. [Google Scholar] [CrossRef] [PubMed] [Green Version]
  72. Han, N.; Du, H.; Zhou, G.; Xu, X.; Cui, R.; Gu, C. Spatiotemporal heterogeneity of Moso bamboo aboveground carbon storage with Landsat Thematic Mapper images: A case study from Anji County, China. Int. J. Remote Sens. 2013, 34, 4917–4932. [Google Scholar] [CrossRef]
Figure 1. Study area of Zhejiang Province and the location of the forest resource inventory.
Forests 10 00708 g001
Figure 2. The age of forests in Zhejiang Province in 2004.
Forests 10 00708 g002
Figure 3. Flow chart for the simulation.
Forests 10 00708 g003
Figure 4. NPPage relationship diagram and new parameters of coniferous forest and broadleaf forest in Zhejiang Province (a/b/c/d refer to Equation (1)).
Forests 10 00708 g004
Figure 5. Comparison between the model simulation net ecosystem productivity (NEP) and flux NEP at (a) the Tianmushan flux site, (b) the Anji flux site and (c) the Qianyanzhou flux site.
Forests 10 00708 g005
Figure 6. The time series of NEP of forests in the Zhejiang Province simulated by the InTEC model during 1985–2015.
Forests 10 00708 g006
Figure 7. The spatial distribution of forest NEP values in Zhejiang Province during 1985–2015.
Forests 10 00708 g007
Figure 8. (a) Total NEP changes and (b) average NEP changes in different cities of Zhejiang Province from 1985 to 2015.
Forests 10 00708 g008
Figure 9. Changes in (a) temperature, (b) precipitation, (c) relative humidity, and (d) radiation data in Zhejiang Province from 1985 to 2015.
Forests 10 00708 g009
Figure 10. Relationship between NEP and (a) temperature (b) precipitation (c) relative humidity (d) radiation.
Forests 10 00708 g010
Figure 11. (a) NEP changes in various cities in Zhejiang Province and (b) histogram of the frequency distribution from 1985 to 2015.
Forests 10 00708 g011
Figure 12. The relative contribution rate of meteorological factors to NEP.
Forests 10 00708 g012
Figure 13. The spatial distribution of the correlation relationships between forest NEP and (a) temperature, (b) precipitation, (c) relative humidity, and (d) radiation in Zhejiang Province from 2000 to 2015.
Forests 10 00708 g013
Table 1. Partition coefficients, turnover rates, and decomposition rates of vegetation and soil carbon.
PoolIDDescriptionBroadleafConiferousUnit
Biomass Carbon poolfwNPP allocation coefficient to wood0.46260.3010None
fcrNPP allocation coefficient to coarse root0.11900.1483None
flNPP allocation coefficient to leaf0.22260.2128None
ffrNPP allocation coefficient to fine root0.19600.3479None
KwWood turnover rate0.02880.0279yr−1
KcrCoarse root turnover rate0.04480.0269yr−1
KlLeaf turnover rate1.00000.1925yr−1
KfrFine root turnover rate0.59480.5948yr−1
SLASpecific leaf area31.570.0m2kg2
Soil Carbon poolKsslSurface structural leaf litter decomposition rate3.9·Lc *·A *yr−1
KsmlSurface metabolic leaf litter decomposition rate14.8·A *yr−1
KrslSoil structural litter decomposition rate4.8·Lc *·A *yr−1
KfmlSoil metabolic litter decomposition rate18.5·A *yr−1
KwWoody litter decomposition rate2.88·Lc *·A *yr−1
KsmSurface microbe decomposition rate6.0·A *yr−1
KmSoil microbe decomposition rate7.3·A *·Tm *yr−1
KsSlow C decomposition rate0.2·A *·Cr *yr−1
KpPassive C decomposition rate0.0045·A *·Cr *yr−1
*: A is the effect of soil temperature and moisture on the decomposition rate of soil organics, Lc is the effect of structural lignin content on the decomposition rate, and Tm is the effect of soil structure on the transfer of active Soil Organic Matter (SOM).
Table 2. The location of flux towers for the three kinds of forest.
SiteCountryLatitudeLongitudeForest Type
AnjiChina30.46119.66Bamboo
TianmushanChina30.35119.43Evergreen broadleaf
QianyanzhouChina26.74115.06Artificial coniferous
Table 3. Summary of model input data in Zhejiang Province.
Data TypeIndexTimeTemporal ResolutionSpatial Resolution
Forest distribution dataThree forest distribution data1984–2014Every four years1 km
Meteorological dataTmax1985–2015Monthly1 km
Tmin1985–2015Monthly1 km
Precipitation1985–2015Monthly1 km
Relative humidity1985–2015Monthly1 km
Radiation1985–2015Monthly1 km
Soil dataSilt and clay fraction 1 km
Soil depth 1 km
Soil water holding capacity 1 km
Wilt point 1 km
Soil bulk 1 km
LAILeaf area index2004Yearly1 km
AgeForest age2004Yearly1 km
NdepN decomposition1985–2015Yearly1 km
NPPReference NPP2004Yearly1 km

