Aboveground Biomass Response to Release Treatments in a Young Ponderosa Pine Plantation


USDA Forest Service, Pacific Southwest Research Station, 3644 Avtech Parkway, Redding, CA 96002, USA
*
Author to whom correspondence should be addressed.
Forests 2019, 10(9), 795; https://0-doi-org.brum.beds.ac.uk/10.3390/f10090795
Submission received: 8 August 2019
/
Revised: 5 September 2019
/
Accepted: 10 September 2019
/
Published: 12 September 2019
(This article belongs to the Special Issue Growth and Allocation of Woody Biomass in Forest Trees Based on Environmental Conditions)
Abstract
:Controlling competing vegetation is vital for early plantation establishment and growth. Aboveground biomass (AGB) response to manual grubbing release from shrub competition was compared with no release control in a twelve-year-old ponderosa pine (Pinus ponderosa Lawson & C. Lawson) plantation established after a wildfire in northeastern California. In addition, response to chemical release followed by precommercial thinning in an adjacent plantation was also examined as a growth potential from a more intensively managed regime, where shrub competition was virtually eliminated. We measured AGB in both planted trees and competing woody shrubs to partition the biomass pools in the plantation. The results showed a significant grubbing treatment effect on basal diameter (BD) at 10 cm aboveground (p = 0.02), but not on tree height (p = 0.055). Height and BD were 2.0 m and 7.4 cm in the manual release, respectively, compared to 1.7 m and 5.6 cm in the control. However, chemical release produced much greater rates of tree growth with a height of 3.6 m and BD of 14.7 cm, respectively. Tree AGB was 60% higher with the manual release of shrubs (1.2 Mg ha−1) than with control (0.7 Mg ha−1) (p < 0.05). The planted area without shrub competition yielded a much higher green tree biomass (16.0 Mg ha−1). When woody shrub biomass was included, the total AGB (trees and woody shrubs) appeared slightly higher, but non-significant in the no release control (13.3 Mg ha−1) than in the manual release (11.9 Mg ha−1) (p = 0.66); the chemical release had 17.1 Mg ha−1. Clearly, shrub biomass dominated this young plantation when understory shrubs were not completely controlled. Although the manual release did increase targeted tree growth to some degree, the cost may limit this practice to a smaller scale and the remaining shrub dominance may create long-term reductions in growth and a persistent fuels problem in these fire-prone ecosystems.
1. Introduction
Release treatments are a common management practice for ponderosa pine (Pinus ponderosa Lawson & C. Lawson) plantations. Woody shrubs often compete with planted pines reducing growth and increasing mortality rates [1,2], and moisture is a primary limiting factor within the range of ponderosa pine [3]. Controlling competing vegetation reallocates more available soil water to planted trees [1], thus fostering successful establishment and more rapid canopy closure. Release treatments lead to increased rates of tree growth [4,5,6]. Wagner et al. [7] observed a growth release threshold of ~3 Mg ha−1 of shrub biomass in interior ponderosa pine. Through a study on a pine plantation at an advanced age (39 years) on a low-quality site, McDonald and Powers [8] found total aboveground biomass was greater without shrubs than with, although it was not clear if there was any statistical significance.
Although chemical release is a common and effective practice on industry lands, manual release is more often employed on federally-owned forests in the western United States. Although expensive, manual release can be effective at improving the growth of planted ponderosa pine [2,4].
Reducing competition from woody shrubs has consequences for estimating long-term productivity in ponderosa pine stands [9,10]. This is true both for volume estimation as well as biomass or carbon sequestration. In summarizing the results for 12 California long-term soil productivity installations, Zhang et al. [11] found that total aboveground biomass was significantly higher for non-vegetation-controlled plots than for plots with vegetation control at ages 5 and 10, but there was little difference by age 20. It appears that biomass or carbon in vegetation control plots will surpass that of non-vegetation control plots very early in stand development. This carbon-dynamics information is important when managing plantations for carbon storage and other ecosystem services. However, information is lacking on the biomass dynamics, especially with less intensive manual competing vegetation control efforts.
There are many factors that can vary among operational treatments. Timing of application(s), repetition of treatment, intensity of treatment or, in the case of herbicides, the chemical(s) chosen for a given application may all contribute to varying results. Thus, any study that took all these into consideration would be excessively complex, easily involving dozens of potential operational treatment combinations. A simpler approach, employed here, is to evaluate varying levels of treatment intensity that are representative of a range of management styles.
In this paper, we considered three different levels of management intensity in a young ponderosa pine plantation. The first was a control (no release) which represented a laissez-faire management approach to plantation establishment wherein planted trees fend for themselves with no assistance provided to establish any competitive advantage with non-crop vegetation. It is generally the least expensive in terms of operational costs, although there are indirect costs accrued from growth loss and higher mortality. The second approach, often favored on federal forest lands, was the use of manual grubbing around selected planted trees. It is the most expensive approach on a cost per unit area basis [2]. Recent figures from Region 5 of the Forest Service (personal communication, Joe Sherlock, a Pacific Southwest Region Silviculturist) show that an average of $5.6 million was spent annually on manual release treatments between 2002 and 2012. The advantage of this particular approach is primarily that it averts controversy associated with herbicide applications. Forest industries in California frequently use herbicides as a cost-effective release treatment which improves tree growth. While the cost of herbicide application is lower, this does not consider indirect costs related to other ecological values. Herbicide application is considered to be more effective at producing desired growth and survival for planted trees [2]. The third treatment employed herbicides to achieve a more complete control of competing vegetation. This was used as a reference point for growth potential at this site.
The objective of this study was to evaluate the tree growth and total aboveground productivity (including shrubs) of a twelve-year-old ponderosa pine plantation under three separate treatments representing a range of management intensities. We focused on aboveground biomass response in both trees alone and total aboveground woody vegetation. We did not include soil carbon due to the fact of a lack of observed differences between with and without vegetation controls in similar systems [12].
2. Materials and Methods
2.1. Study Site
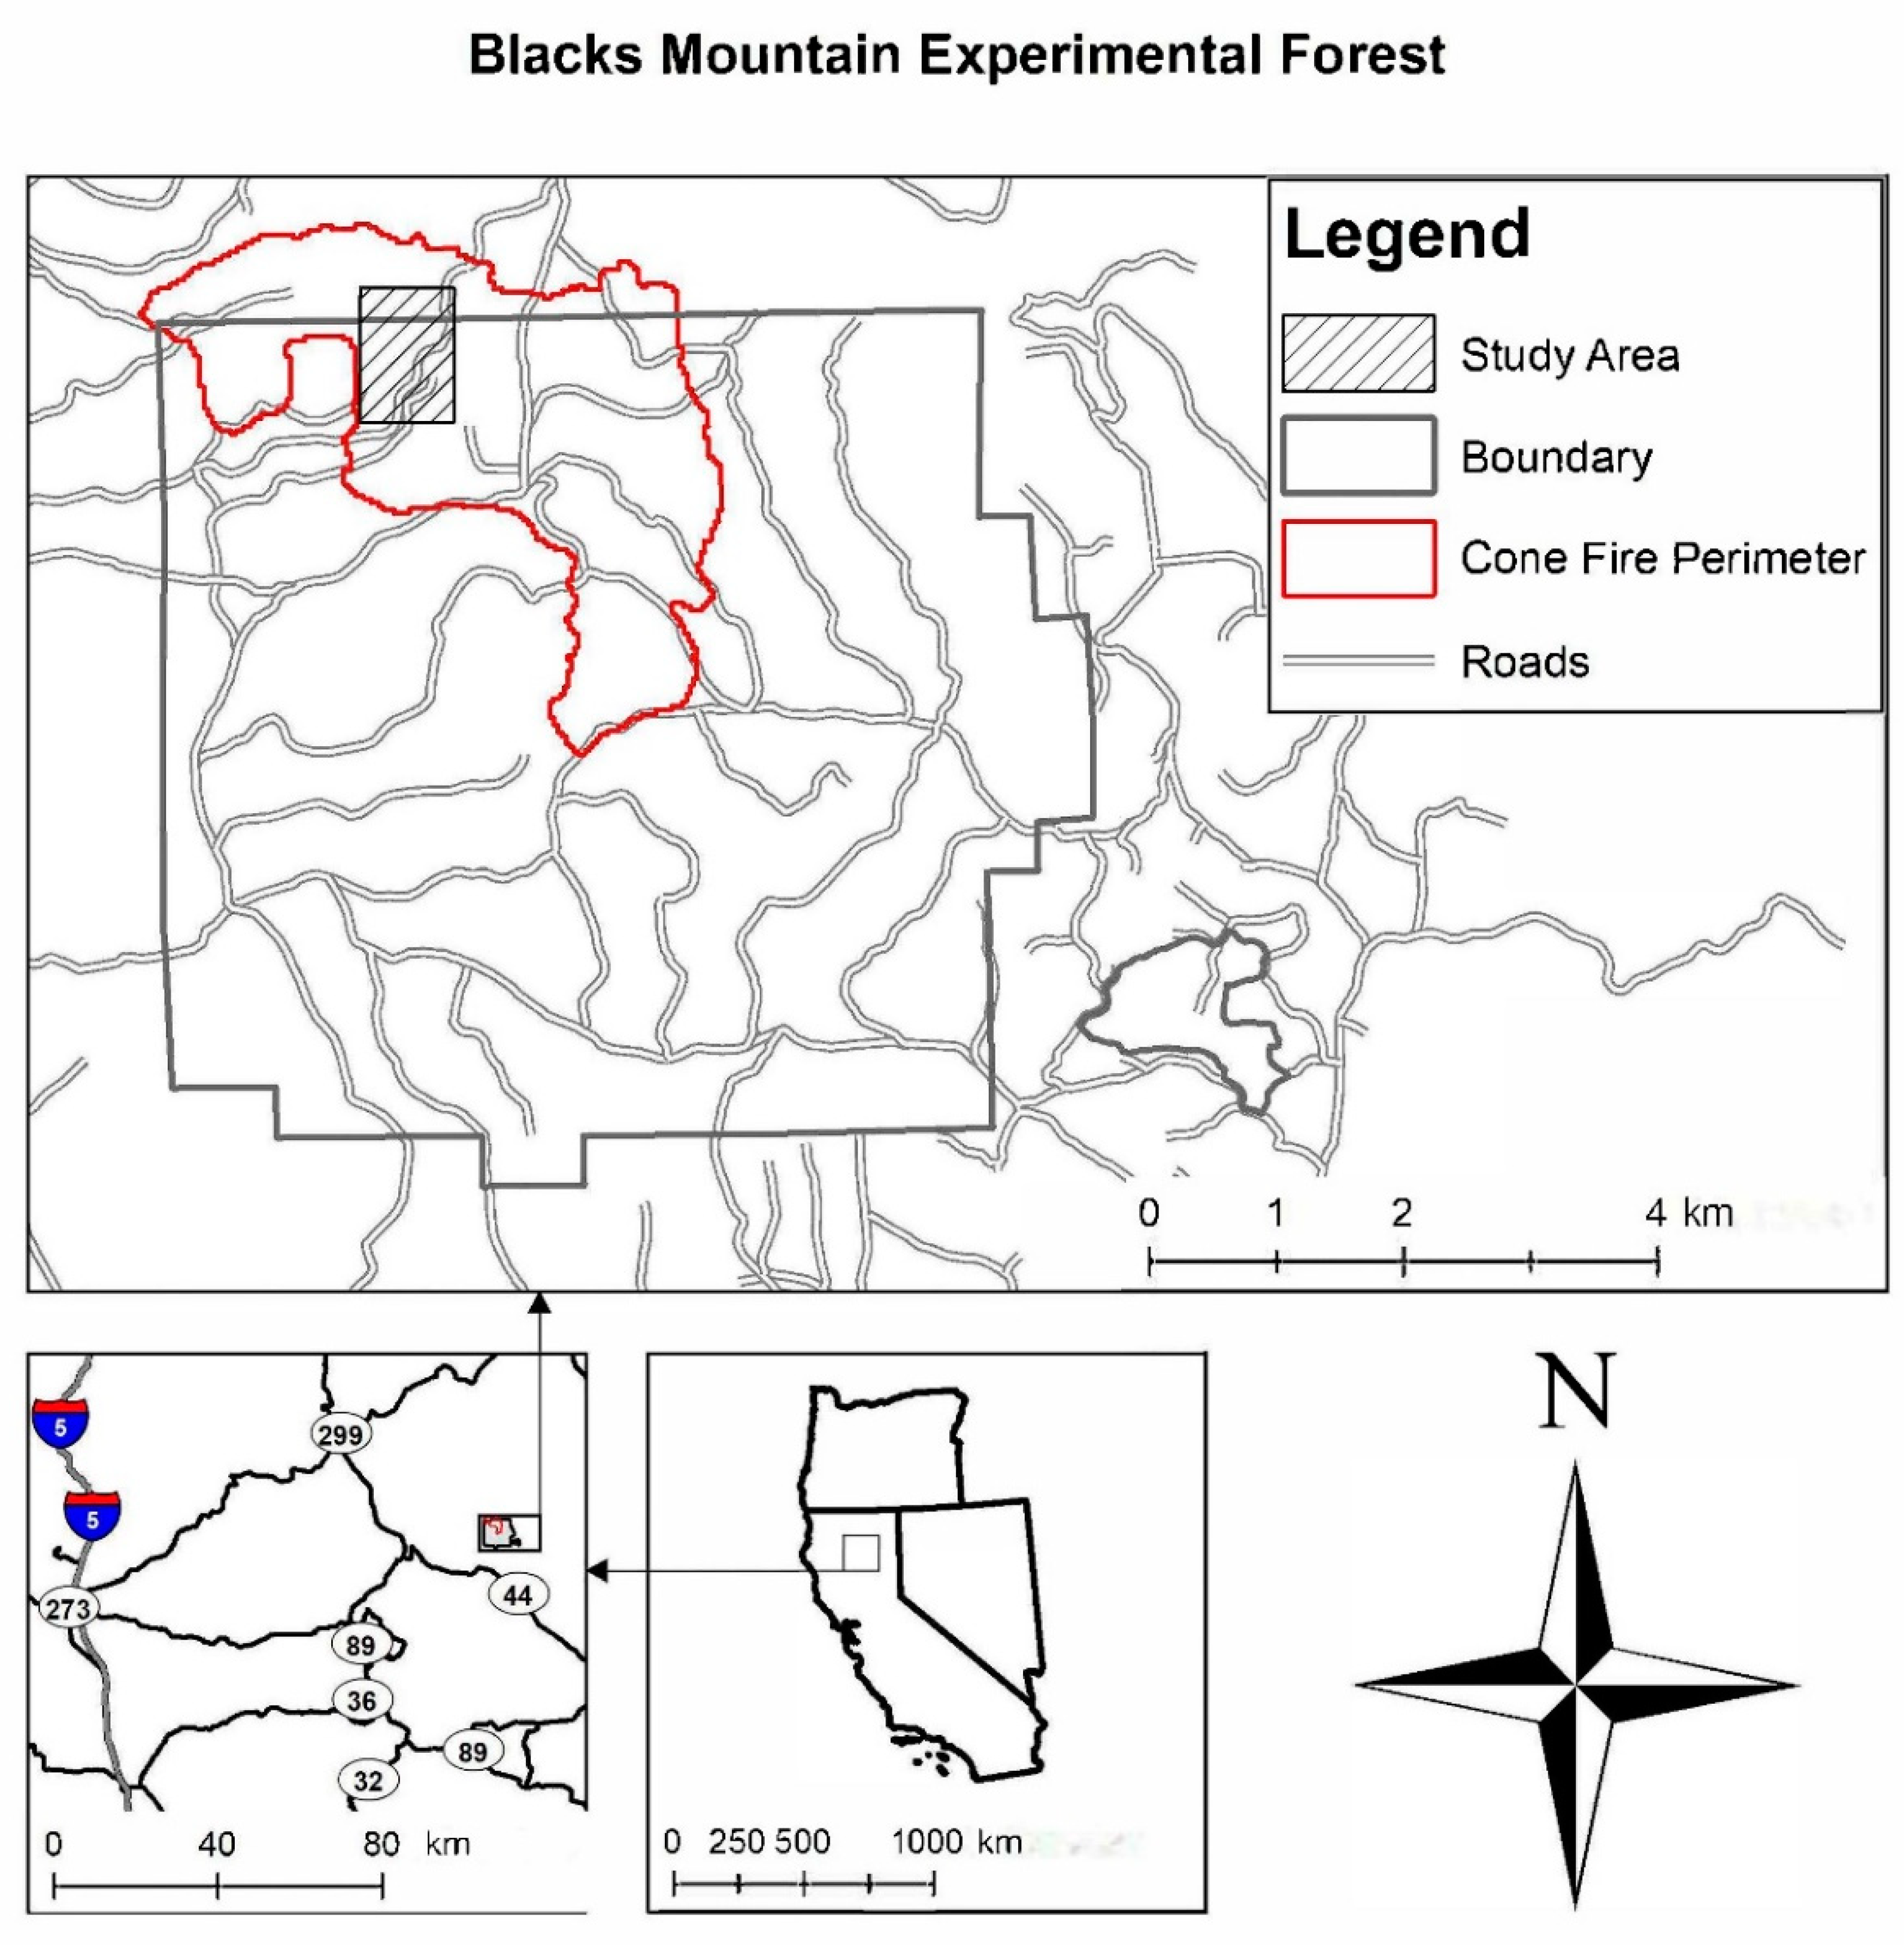
The study was established at the Blacks Mountain Experimental Forest (BMEF) in the southern Cascade Range of northeastern California (40.72N latitude, 121.17W longitude). Elevations range from 1700 to 2100 m. The climate is montane Mediterranean characterized by warm, dry summers and cold, wet winters. Annual precipitation ranges from 231–743 mm and falls primarily as snow from November to May.
The BMEF is located in the Lassen National Forest in northeastern California (Figure 1); it is located in an endorheic basin with no year-round streams. The surrounding area is unpopulated; the nearest communities are Susanville 56 km to the southeast and Old Station 22 km to the west. The National Forest is managed for multiple uses and after severe wildfire, areas are typically replanted using native species well adapted to the area. Some adjoining parcels are privately owned and managed primarily for timber production. The forests in this area are dominated by ponderosa pine with a mix of white fir (Abies concolor (Gord. & Glendl.) Lindl. Ex Hildebr.) and incense-cedar (Calocedrus decurrens (Torr.) Florin) at higher elevations.
Approximately 650 ha of the BMEF and 200 ha of adjacent privately owned forest was burned by high-severity human-caused wildfire in 2002. Both ownerships were subsequently salvage-logged and planted with container-stock ponderosa pine at 3.7 m square spacing in the spring of 2004 (Figure 2). The experimental forest was planted with Styroblock 77/170 (164 ml volume per cavity; Beaver Plastics, Stuewe & Sons, Inc., Tangent, Oregon) while the adjacent privately owned land was planted with Styroblock 160/90 (90 ml) stock.
2.2. Blacks Mountain Release Treatments
Within the experimental forest plantation, a paired study of release treatments was established to compare the effects of manual grubbing on competing shrubs (primarily Ceanothus velutinus Douglas ex Hook and Arctostaphylos patula Greene) that germinated from seed after the wildfire. Manual grubbing is a common release treatment on national forest land in this region and herbicide release is used infrequently. Nine paired treatment units were established. At each of the nine locations, two 2.5 ha treatments were applied with random assignment: no release treatment and a release with all vegetation manually grubbed to a 1.5 m radius on half of the planted seedlings. Thus, 18 treatment units were regarded as our experimental units. Grubbing treatment was applied to 370 trees per ha (roughly half of the surviving planted trees in a unit) by assuming as future crop trees. Treatments were applied in the fall of 2007 and then again in the fall of 2009 after 4 and 6 growing seasons, respectively.
Circular measurement plots with a 3.6 m radius were established in a 16 × 13 m grid within each treatment unit. There was a total of 27 plots per treatment unit. The plots were established in 2008 and measured in 2015. All trees within the designated plot radius were measured for basal diameter (BD at 10 cm), total height (H), and crown width (CW). Crown width was measured on the long axis and perpendicular at the base of the live crown and then a geometric mean of the two was calculated. Basal diameter was recorded to the nearest mm with a caliper, height and crown widths to the nearest cm.
2.3. Industry Release Treatments
The adjacent plantation had a site preparation release treatment in 2003 of 22 kg ha−1 of Velpar (backpack application). This was followed with a directed release with two 4D targeting Ceanothus prostratus Benth. plants in 2005 (backpack application). A final release directed for Ceanothus velutinus plants with glyphosate was applied in 2007 (backpack application). Finally, a precommercial thin to 400 trees ha−1 was conducted in 2012 (at age nine).
A systematic array of 50 plots with the same measurements as the experimental forest (3.6 m radius circular plot) was established on the industry property in 2015. The same measurement standards were used with an augmented stump tally with measured basal diameters for all trees removed in the 2012 precommercial thin. Because we could not measure height directly on trees removed during the thinning, height was estimated using a regression relating H (m) and BD (cm) with other measured trees on both properties: H = 0.1 + a0 BDa1 (Figure 3). The 0.1 m was added because BD was measured at 10 cm above ground.
A total of 81 standing trees were sampled, plus another 141 stumps of trees felled by precommercial thinning. These observations provide a reference for the site productivity potential of ponderosa pine on an identical site with trees in a free-to-grow condition.
2.4. Biomass Data
In both the experimental forest and on the adjacent property, nested rectangular shrub plots were established. Within each of the circular tree plots, a 1.5 m2 shrub-biomass plot was established with the southwest corner at the center of the larger tree plot. This sub-plot was an efficient size to destructively sample in this vegetation structure. On the smaller plot, percent cover and height were obtained for each quadrant by species and averaged for the plot. Percent cover was an ocular estimate and vertical average height was measured to the nearest cm and averaged. There was a total of 486 plots on the BMEF experimental units and 50 on the neighboring privately owned parcel.
Because plots within the chemical release area had so little shrub cover, it was possible to do a complete inventory of shrub biomass by destructive sampling. Therefore, we recorded shrub cover and height and then removed and weighed shrub biomass on all plots where shrub biomass was found.
It was not feasible to destructively sample shrub biomass on all 486 plots in the experimental forest because of the high shrub cover, therefore subsampling of biomass was required for these plots. Within the experimental forest, observed cover values for each plot ranged from near zero to complete coverage of shrubs. This resulted in a total of 30 plots for biomass destructive sampling with a total of 51 separate species-biomass observations (Table 1).
Tree biomass for all plots was estimated using equations presented by Powers et al. [13], Biomass = 278.1443 × (BD)2 × Height + 0.4004, where biomass is in kg and basal diameter (BD) and height are in m.
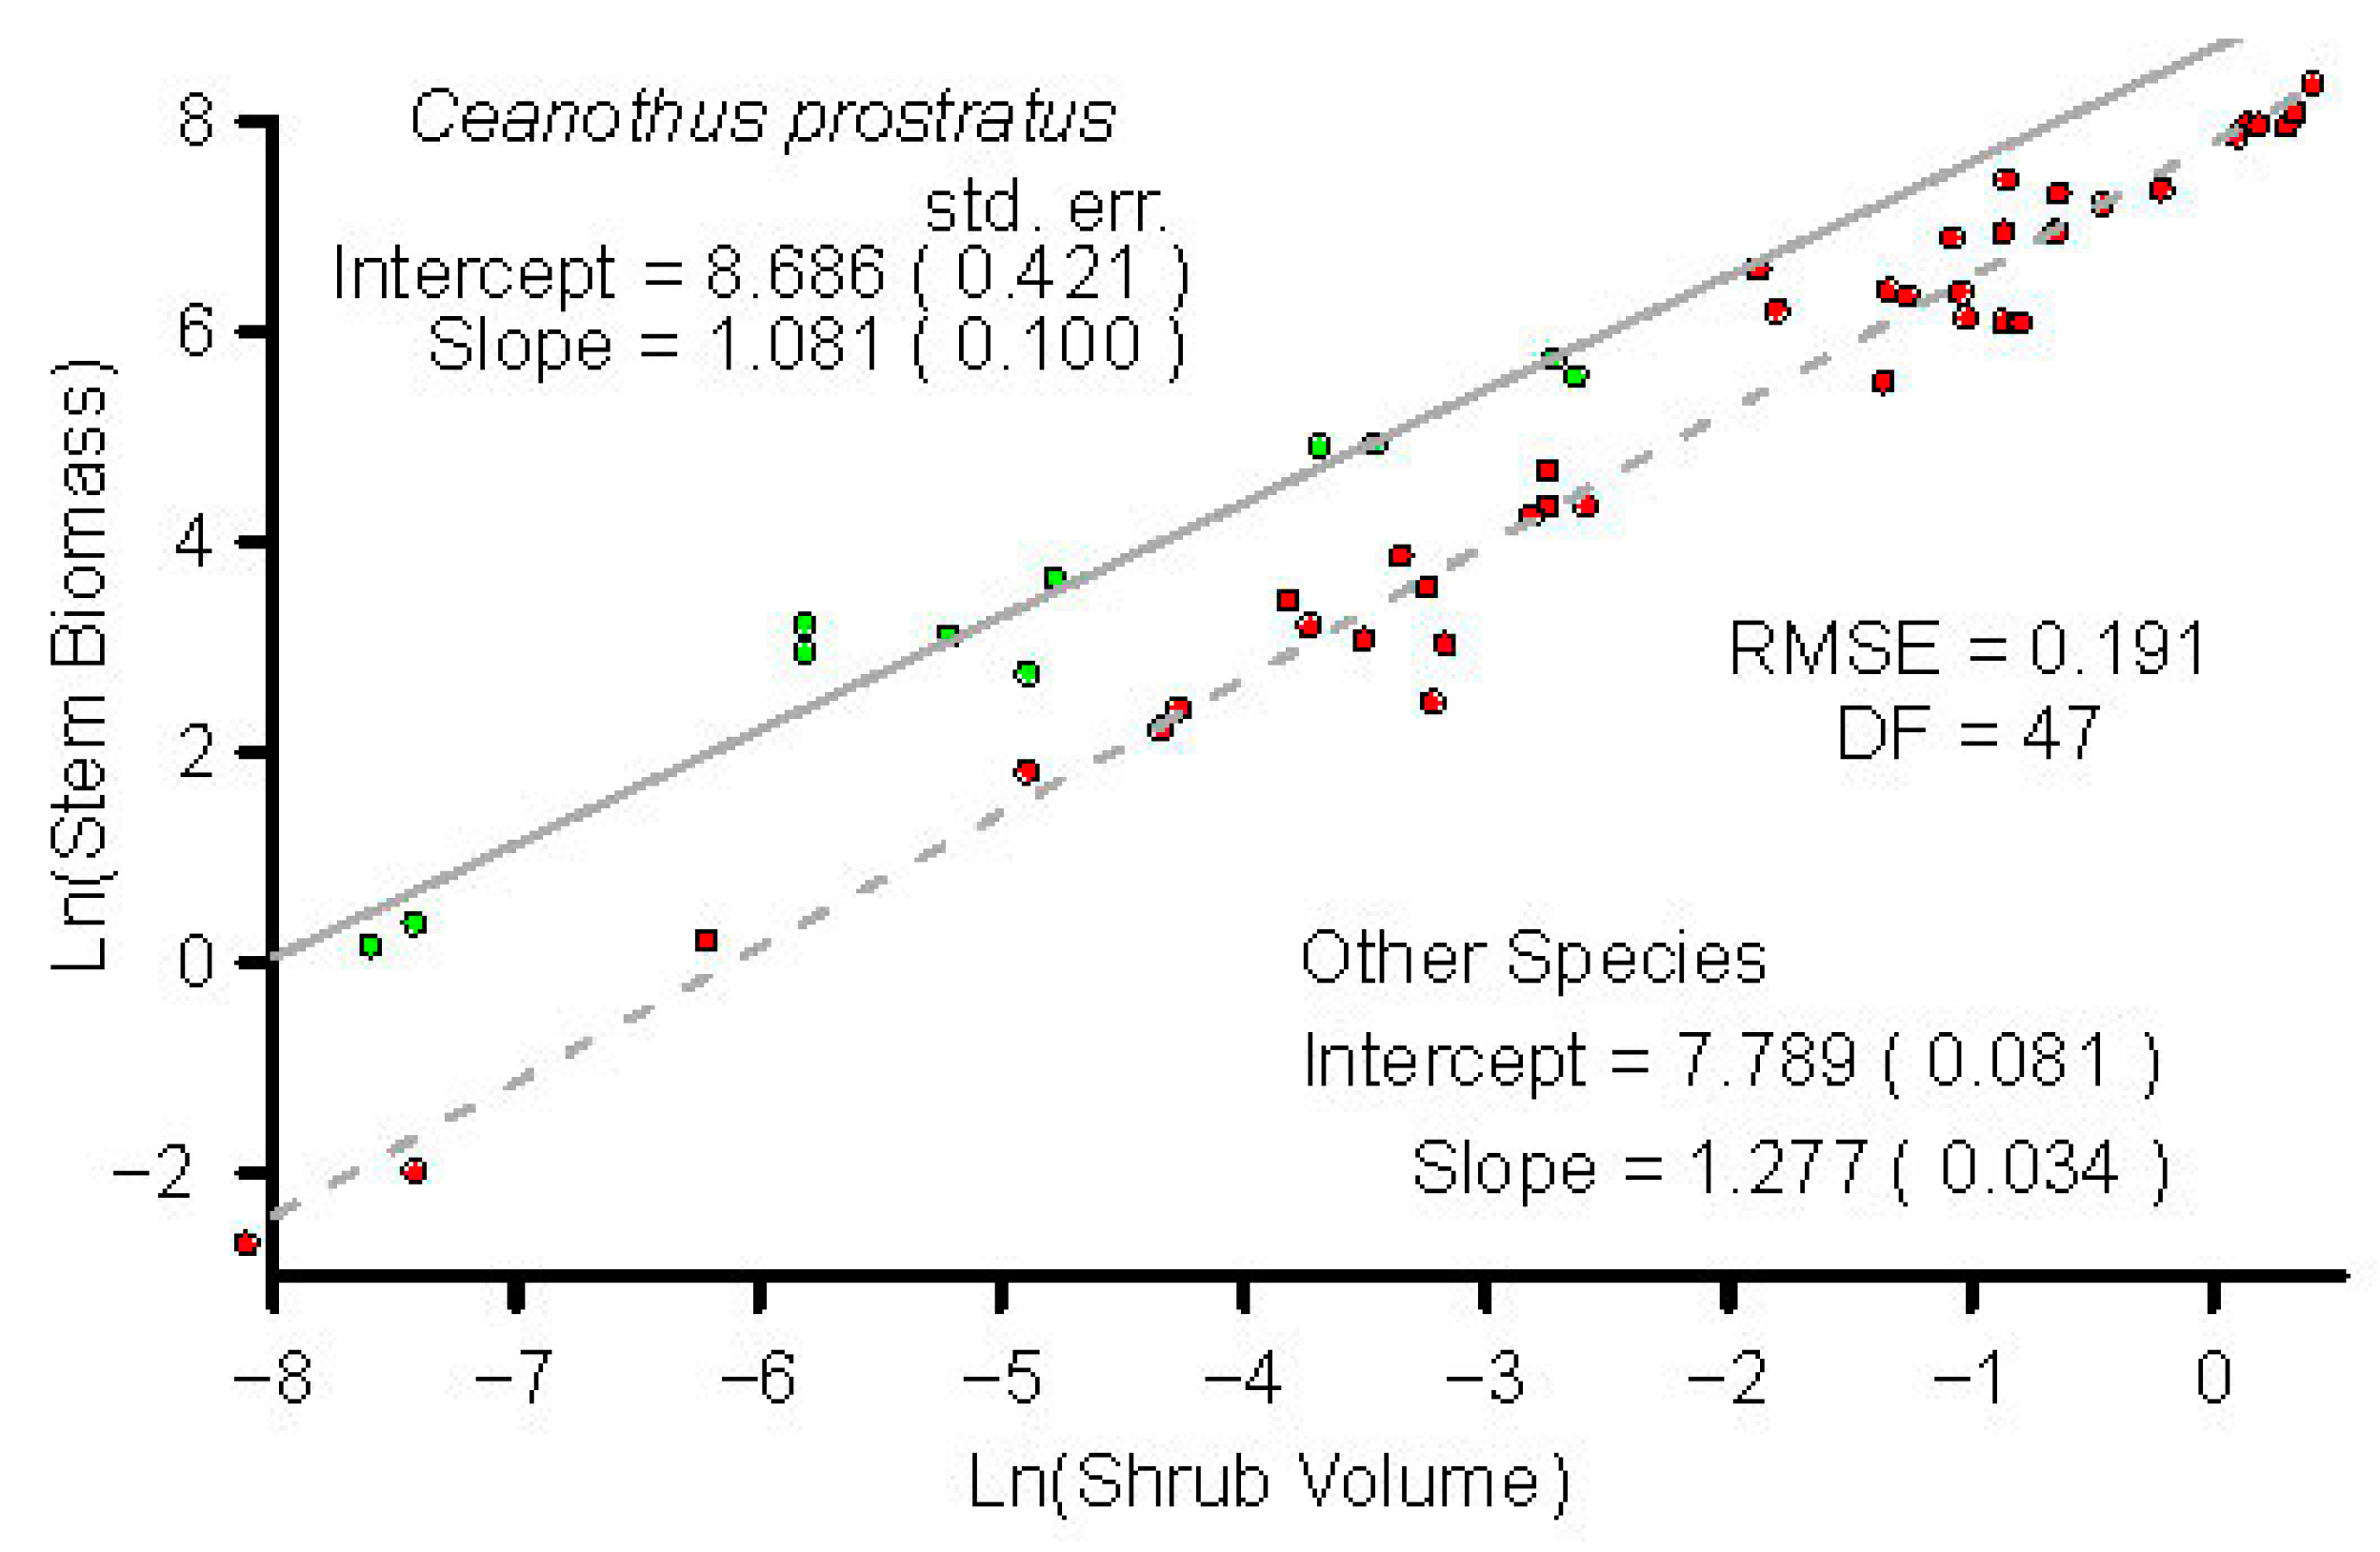
Shrub biomass was calculated by oven-drying each sample until its weight stabilized at 80 ℃. Leaves were separated to obtain the weight of woody biomass. From this sample, we fit woody (stem) biomass (g m−2) as a function of observed crown volume (m3 m−2) using ordinary least squares regression and the natural log transformation of both variables (Figure 4). Using log-bias corrected parameter estimates [14], we then derived a woody shrub biomass estimate for each plot.
2.5. Analysis
Using plot mean height and BD, tree, woody shrub, and total biomass were estimated first. Then, we compared treatment effects using analysis of variance based on the experimental units in the experimental forest. Observations on industry land are presented as a reference for potential growth.
3. Results
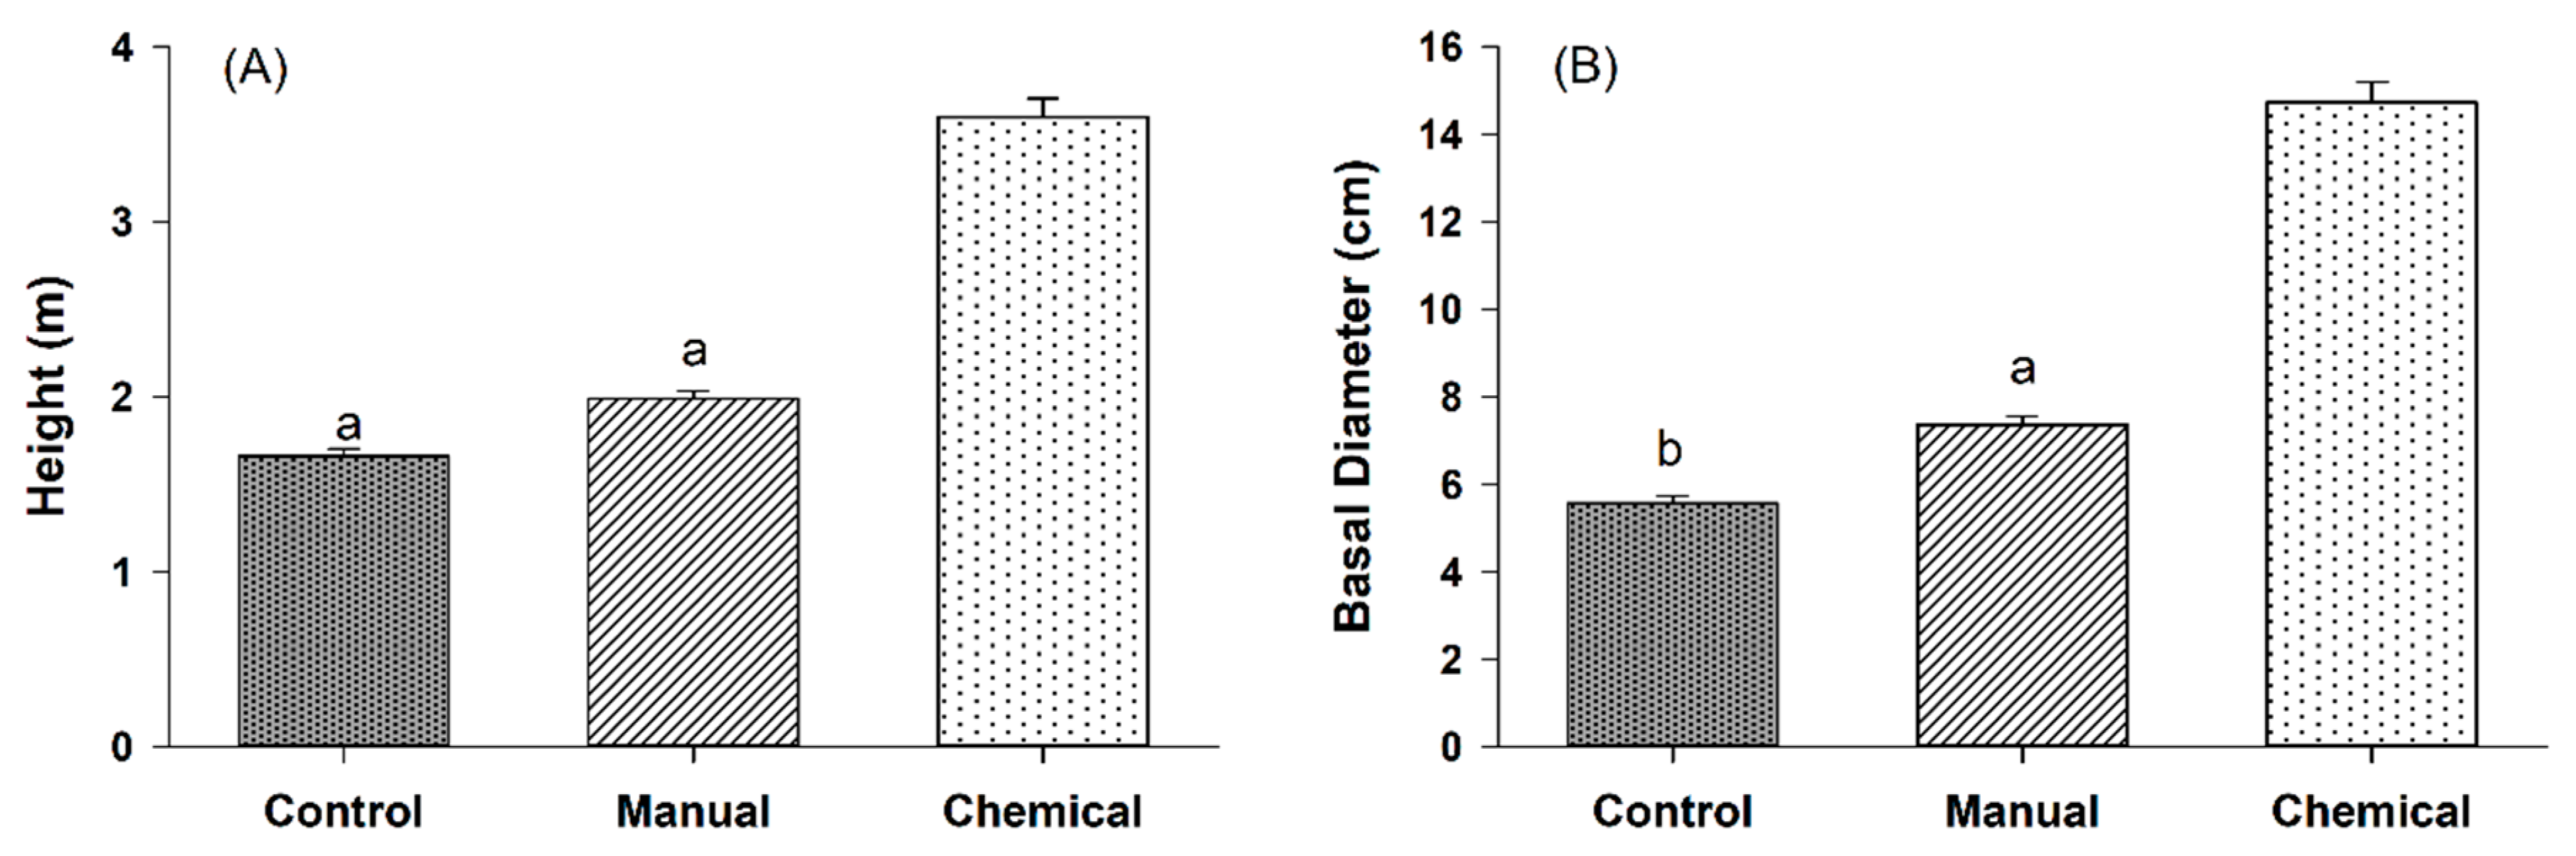
Differences in height between the manual release treatment and the control on public land was 0.33 m, about 20% higher in the manual release treatment (Figure 5A), which is non-significant (p = 0.055) if the critical value for the comparison is based on p = 0.05. The average basal diameter was significantly higher in the manual release treatment (7.4 cm) than in the control (5.6 cm) (Figure 5B). As a reference point for the growth potential of the site, chemical release yielded much larger sized trees, 3.6 m in height and 14.7 cm in BD.
Similar trends were found in the area based on total tree biomass with 1.2 Mg ha−1 in the manual released treatment and 0.7 Mg ha−1 in the control; the difference was significant (p = 0.045). Chemical release treatment resulted 16.0 Mg ha−1 in green tree biomass (Figure 6A). However, when total vegetation AGB (trees + shrubs) was considered, the control treatment’s production was slightly higher (but non-significant) in biomass than in the manual release treatment (p = 0.656) (Figure 6B). There were 17.1 Mg ha−1 on the adjacent private industry land with the chemical release.
4. Discussion
To the best of our knowledge, this is the first study to examine the long-term effects of partial grubbing release on shrub competition. Manual grubbing release has previously been studied mainly for seedling survival and individual tree growth with small plot size and few seedlings monitored during early plantation establishment [2,4]. Here, we took advantage of operational planting scale and designed the paired experimental units with a rather large plot size on both no release control and manual grubbing release. Fortunately, an adjacent private land was reforested using the same species and density in the same year as our experimental forest. Although we could not include it in our experimental design ten years ago, a sharp difference in plantation characteristics between management regimes brings into question whether statistical tests can tell us more than what we observed (Figure 2, Figure 5 and Figure 6).
While manual grubbing did increase tree growth, height and BD were not nearly as high as that in the chemical release treatment. Several reasons may explain this result. First, approximately only 50% of planted trees were released. In this dataset, there were 288 released trees and 257 non-released trees. The means the height, BD, and biomass presented in the results included all trees. Had we compared the released with non-released trees within the released treatment, we would find a larger mean size in the released trees (height 2.2 m and BD 8.5 cm) than in the non-released trees (1.8 m and 6.2 cm). Both were still greater than the no released control, but much smaller than trees in the adjacent land with chemical release. Second, 1.5 m radial grubbing around selected seedlings would have represented approximately 50% of the area, if all planted trees had survived and were subsequently released. Because we only released 288 trees, approximately only 25% of the area was grubbed. In contrast, chemical release in the industry land covered 100% of the area. Third, grubbing will not kill resprouting shrubs growing at this site. Ceanothus velutinus, Ceanothus prostratus, and Arctostaphylos patula are all resprouting species [15] and are difficult to kill with grubbing, as was evident in areas with and without manual grubbing where shrubs dominated the plantation (Figure 6). Because there were very few shrubs on the private industry land after treatments, tree biomass was the primary biomass pool, which was even bigger than the total AGB (trees and shrubs) in the other treatments, and it is worth noting that this does not include the additional 7.4 Mg ha−1 that was removed by precommercial thinning.
Planting trees and restoring forests following disturbances are still regarded as effective strategies for balancing CO2 emission, as forests can store a large amount of carbon. However, within a forest, storing carbon in the tree bole is preferred to understory shrubs. Therefore, the objective for plantation management is to grow trees as quickly as possible, as larger trees are generally more resistant to future fire damage due to the fat of their thicker bark and taller stature [16,17]. Complete control of shrubs will provide the best results, as demonstrated in numerous studies [1,6]. Partial control of shrubs was difficult to implement, and the crown of remaining shrubs often quickly took over the space [5,18]; therefore, it was not as effective as the complete control at reducing competition.
Soil carbon, a larger carbon pool than aboveground vegetation, had a slow and complex sequestration process, which was not measured here. Based on studies at multiple sites with multiple years of understory control, Powers et al. [12] did not find any difference in soil carbon with and without understory control, including one installation inside the experimental forest. Because our plantations are of a similar age, we expect that the soil carbon does not differ among the two plantations.
Throughout the western United States, current reforestation efforts in the US Forest Service are conducted primarily in a post-burn environment as clearcutting practice has fallen off. Planning for regeneration is influenced by many considerations including fire severity, natural regeneration potential, soil erosion risk, water contamination, and wildlife habitat [19]. As a result, a relatively small proportion of burned areas are targeted for artificial regeneration. Furthermore, funding constraints limit the manual treatments for these plantations, where both trees and shrubs compete for the dominant position (Figure 2).
Cost was a critical limiting factor for manual grubbing; our cost per application was about US $700 ha−1. The grubbing treatment was also ineffective, with two applications producing a large shrub biomass pool (Figure 6). It is difficult to know how many applications would be necessary to achieve complete control with grubbing, but given the propensity for these shrubs to re-sprout and abundant viable seeds in the soil seed bank, it would likely take at least six applications of manual grubbing to achieve a free-to-grow condition (Gary Fiddler, personal communication). If this is the case, then the cost for an effective manual grubbing regime would be on the order of US $4000 ha−1.
Herbicide application is a highly regulated process by the State of California. Not only are applicators licensed by the California Environmental Protection Agency, but they also meet all laws and regulations related to the California Division of Occupational Safety and Health. More importantly, few herbicides have been registered for use in California forests, where applications are typically associated with plantation establishment on private industry lands.
The evaluation of total standing aboveground biomass, including both trees and shrubs, suggested a possible increase with chemical release (Figure 6). The difference between effective removal of shrubs and a free-to-grow environment through chemical release and manual release for green biomass was about 5.0 Mg ha−1. But, if the tree AGB from precommercial thinning was considered, we would find a substantial increase in total aboveground biomass or carbon in the chemical release. This is likely due to the more efficient carbon sequestration by conifers versus shrubs after the overstory canopy closes [11]. In addition, ponderosa pine is a marketable product, so this carbon can be converted to wood products and maintained longer [20].
The observed productivity with respect to tree growth, using the OP-Yield projections [21], suggests that the intensively managed plantation is growing at a rate commensurate with a site index of 25 m at a base age 50 years, while the manually released stand is growing at a rate commensurate with a site index of 10 m at a base age 50 years; suggesting a significant reduction in tree productivity consistent with the findings of Newton and Hansen [10].
In this moisture-limited environment for tree growth, effective early control of competing vegetation is a key component of an effective management strategy for regenerating conifers [22,23,24]. One rule of thumb is that cover should be maintained at levels below 20 percent [2,18] and that early treatment is the key because growth losses can persist [6,25]. These results demonstrate the importance of liming the competition as it relates to aboveground biomass and carbon of trees in young plantations. Two applications of a manual release treatment were not able to produce a growth response approaching productive capacity. More frequent applications could conceivably be applied but these treatments are already cost-prohibitive on a unit area basis.
5. Conclusions
A significant effect of the manual grubbing release from shrub competition on tree growth was found when compared with the no release control. Yet, total aboveground biomass or carbon was only marginally influenced because shrub biomass dominated both sets of plots in this young plantation. On adjacent private industry land, the chemical release showed an order of magnitude more tree biomass or carbon than the public land treatments and even more total biomass including all shrubs. While manual grubbing commonly continues to be used to reduce the impacts of competing vegetation on tree growth and mortality on public land, this treatment does not allow trees to approach productive capacity of the site because these competitors are often not killed by the grubbing and grow back into the cleared space.
Here, in the western United States, especially in California, forest managers often face a reforestation challenge in forests burned by wildfire; last year, California wildfires consumed 0.75 million hectares. Only a small percentage of public lands are planted because of land-use restrictions. The success of artificial regeneration depends on how well competing shrubs are controlled. Although industry foresters often use herbicides to effectively control shrubs and achieve the potential productivity of plantations, as shown here, use of herbicides remains a contentious issue and tightly constrained by regulation. Clearly, the effects of herbicide use on the environment must be considered [26], which is also included in current environmental assessments required by the US National Environmental Policy Act. A broader tradeoff for controlling competing shrubs between using herbicides and grubbing or other means should be evaluated if biomass production or carbon sequestration is one of goals in the post-fire reforestation program.
Author Contributions
Conceptualization, M.R.; methodology, M.R., J.Z. and E.H.; formal analysis, M.R. and J.Z.; data curation, E.H.; writing—review and editing, M.R. and J.Z.
Funding
This research received no external funding.
Acknowledgments
The authors wish to acknowledge the cooperation of Sierra Pacific Industries in completing field work and providing information on treatment history. Use of trade names in this paper does not constitute endorsement by the USDA Forest Service.
Conflicts of Interest
The authors declare no conflict of interest.
References
- Wagner, R.G. The role of vegetation management for enhancing productivity of the world’s forests. Forestry 2006, 79, 57–79. [Google Scholar] [CrossRef]
- McDonald, P.M.; Fiddler, G.O. Twenty-Five years of managing vegetation in conifer plantations in northern and central California: results, application, principles, and challenges. In General Technical Report; Department of Agriculture, Forest Service, Pacific Southwest Research Station: Albany, CA, USA, 2010; Volume PSW-GTR-231. [Google Scholar]
- Powers, R.F.; Ferrell, G.T. Moisture, nutrient, and insect constraints on plantation growth: the “Garden of Eden” study. N. Z. J. For. Sci. 1996, 26, 126–144. [Google Scholar]
- McDonald, P.M.; Fiddler, G.O. Feasibility of alternatives to herbicides in young conifer plantations in California. Can. J. For. Res. 1993, 23, 2015–2022. [Google Scholar] [CrossRef]
- Zhang, J.W.; Oliver, W.W.; Busse, M.D. Growth and development of ponderosa pine on sites of contrasting productivities: relative importance of stand density and shrub competition effects. Can. J. For. Res. 2006, 36, 2426–2438. [Google Scholar] [CrossRef]
- Zhang, J.W.; Powers, R.F.; Oliver, W.W.; Young, D.H. Response of ponderosa pine plantations to competing vegetation control in Northern California, USA: A meta- analysis. Forestry 2013, 86, 3–11. [Google Scholar] [CrossRef]
- Wagner, R.G.; Petersen, T.D.; Ross, D.W.; Radosevich, S.R. Competition thresholds for the survival and growth of ponderosa pine seedlings associated with woody and herbaceous vegetation. New For. 1989, 3, 151–170. [Google Scholar] [CrossRef]
- McDonald, P.M.; Powers, R.F. Vegetation trends and carbon balance in a ponderosa pine plantation: long-term effects of different shrub densities. In Proceedings of the 24th Annual Forest Vegetation Management Conference, Redding, CA, USA, 14–16 January 2003; University of California Cooperative Extension: Ventura, CA, USA, 2003. [Google Scholar]
- Powers, R.F.; Reynolds, P.E. Ten-year responses of ponderosa pine plantations to repeated vegetation and nutrient control along an environmental gradient. Can. J. For. Res. 1999, 29, 1027–1038. [Google Scholar] [CrossRef]
- Newton, M.; Hanson, T.J. Bias in site estimation from early competition. In Proceedings of the 19th Annual Forest Vegetation Management Conference, Redding, CA, USA, 20–22 January 1998; University of California Cooperative Extension: Ventura, CA, USA, 1999. [Google Scholar]
- Zhang, J.W.; Busse, M.D.; Young, D.H.; Fiddler, G.O.; Sherlock, J.W.; Tenpas, J.D. Aboveground biomass responses to organic matter removal, soil compaction, and competing vegetation control on 20-year mixed conifer plantations in California. For. Ecol. Manag. 2017, 401, 341–353. [Google Scholar] [CrossRef]
- Powers, R.F.; Busse, M.D.; McFarlane, K.J.; Zhang, J.; Young, D.H. Long-term effects of silviculture on soil carbon storage: does vegetation control make a difference? Forestry 2013, 86, 47–58. [Google Scholar] [CrossRef]
- Powers, E.M.; Marshall, J.D.; Zhang, J.; Wei, L. Post-fire management regimes affect carbon sequestration and storage in a Sierra Nevada mixed conifer forest. Forest Ecol. Manag. 2013, 291, 268–277. [Google Scholar] [CrossRef]
- Baskerville, G.L. Use of logarithmic regression in the estimation of plant biomass. Can. J. For. Res. 1972, 2, 49–53. [Google Scholar] [CrossRef]
- McDonald, P.M. Adaptations of woody shrubs. In Proceedings of the Reforestation of Skeletal Soils in Southwest Oregon, Medford, OR, USA, 18–19 November 1981. [Google Scholar]
- Ryan, K.C.; Reinhardt, E.D. Predicting postfire mortality of seven western conifers. Can. J. For. Res. 1988, 18, 1291–1297. [Google Scholar] [CrossRef]
- Hood, S.M.; Varner, J.M.; van Mantgem, P.; Cansler, C.A. Fire and tree death: understanding and improving modeling of fire-induced tree mortality. Environ. Res. Lett. 2018, 13. [Google Scholar] [CrossRef]
- Zhang, J.; Busse, M.D.; Fiddler, G.O.; Fredrickson, E. Thirteen-year growth response of ponderosa pine plantations to dominant shrubs (Arctostaphylos and Ceanothus). J. For. Res. 2019. [Google Scholar] [CrossRef]
- United States Forest Service. The principal laws relating to Forest Service activities. In Agriculture Handbook; U.S. Department of Agriculture, Forest Service: Washington, DC, USA, 1983; Volume 453, p. 591. [Google Scholar]
- Bergman, R.; Puettmann, M.; Taylor, A.; Skog, K.E. The carbon impacts of wood products. Forest Prod. J. 2014, 64, 220–231. [Google Scholar] [CrossRef]
- Ritchie, M.W.; Zhang, J. OP-Yield Version 1.0 User’s Guide. In General Technical Report; USDA Forest Service, Pacific Southwest Research Station: Albany, CA, USA, 2018; Volume PSW-GTR-259, p. 26. [Google Scholar]
- Oliver, W.W. Early Response of Ponderosa Pine to Spacing and Brush: Observations on a 12-year-old Plantation; USDA Forest Service, Pacific Southwest Forest and Range Experiment Station: Berkeley, CA, USA, 1979; Volume PSW-341, pp. 1–7. [Google Scholar]
- Conard, S.G.; Radosevich, S.R. Growth response of white fir to decreased shading and root competition by montane chaparral shrubs. For. Sci. 1982, 29, 309–320. [Google Scholar]
- Busse, M.D.; Cochran, P.H.; Barrett, J.W. Changes in ponderosa pine site productivity following removal of understory vegetation. Soil Sci. Soc. Am. J. 1996, 60, 1614–1621. [Google Scholar] [CrossRef]
- McHenry, W.B.; Radoservich, S.R. Forest Vegetation Management. In Principles of Weed Control in California; California Weed Conference, Sponsors; Thompson Publications: Fresno, CA, USA, 1985; pp. 400–413. [Google Scholar]
- Hively, W.D.; Hapeman, C.J.; McConnell, L.L.; Fisher, T.R.; Rice, C.P.; McCarty, G.W.; Sadeghi, A.M.; Whitall, D.R.; Downey, P.M.; Nino de Guzman, G.T.; et al. Relating nutrient and herbicide fate with landscape features and characteristics of 15 subwatersheds in the Choptank River watershed. Sci. Total Environ. 2011, 409, 3866–3878. [Google Scholar] [CrossRef] [PubMed]
Figure 1.
Geographic locations of the Blacks Mountain Experimental Forest, the Cone Fire perimeter, and study area in northeastern California, USA.
Figure 1.
Geographic locations of the Blacks Mountain Experimental Forest, the Cone Fire perimeter, and study area in northeastern California, USA.

Figure 2.
Post-fire regenerated plantations on public land at Blacks Mountain Experiment (left) and on private industry land (right), the latter formerly owned by Roseburg Forest Resources, now Sierra Pacific Industries. Both sides were planted with one-year-old ponderosa pine seedlings in 2005. The upper picture was taken at the photo point (*) prior to the precommercial thinning in 2009. The bottom 2014 image from Google Earth shows the post thinning plantation on industry land.

Figure 3.
Height and basal diameter regression for combined non-linear fit of untreated (red), manual release (blue), and chemical release (green) trees.
Figure 3.
Height and basal diameter regression for combined non-linear fit of untreated (red), manual release (blue), and chemical release (green) trees.

Figure 4.
Model fit statistics and uncorrected parameter estimates for aboveground woody biomass (g m−2) in shrubs as a function of shrub volume (m3 m−2), expressed for Ceanothus prostratus. (green, solid line) and other species (red, dashed line).
Figure 4.
Model fit statistics and uncorrected parameter estimates for aboveground woody biomass (g m−2) in shrubs as a function of shrub volume (m3 m−2), expressed for Ceanothus prostratus. (green, solid line) and other species (red, dashed line).

Figure 5.
Means and standard errors of (A) height and (B) basal diameter for twelve-year-old ponderosa pine trees grown in no release control, manual release, and chemical release treatments. Different letters (a, b) refer to a significant difference between the two treatments (p < 0.05). Chemical release was not included in the analysis because it was not in the original design.

Figure 6.
Means and standard errors of (A) tree aboveground biomass and (B) total aboveground biomass (i.e., trees and shrubs) on a twelve-year-old ponderosa pine plantation grown in no release control, manual release, and chemical release treatments. Different letters (a, b) refer to a significant difference between the two treatments (p < 0.05). Chemical release was not in the analysis because it was not in the original design.


Table 1.
Summary statistics for cover (percent), height (cm), volume (m3 m−2), and shrub biomass (g m−2) sampled by species (ARPA = Arctosaphylos patula, CEPR = Ceanothus prostratus, CEVE = Ceanothus velutinus, and OTSP = other species).
Table 1.
Summary statistics for cover (percent), height (cm), volume (m3 m−2), and shrub biomass (g m−2) sampled by species (ARPA = Arctosaphylos patula, CEPR = Ceanothus prostratus, CEVE = Ceanothus velutinus, and OTSP = other species).
| Species | n | Cover (%) | SD | Height (cm) | SD | Volume (m3 m−2) | SD | Biomass (g m−2) | SD |
|---|---|---|---|---|---|---|---|---|---|
| ARPA | 12 | 18.1 | 17.3 | 64.2 | 19.8 | 0.129 | 0.125 | 262 | 314 |
| CEPR | 11 | 29.0 | 35.4 | 6.8 | 3.0 | 0.020 | 0.026 | 87 | 109 |
| CEVE | 22 | 61.3 | 35.8 | 90.0 | 27.9 | 0.609 | 0.474 | 1366 | 1200 |
| OTSP | 6 | 9.1 | 10.9 | 41.0 | 28.8 | 0.028 | 0.021 | 25 | 24 |
| ALL | 51 | 38.0 | 36.3 | 60.2 | 39.5 | 0.301 | 0.416 | 673 | 1003 |
© 2019 by the authors. Licensee MDPI, Basel, Switzerland. This article is an open access article distributed under the terms and conditions of the Creative Commons Attribution (CC BY) license (http://creativecommons.org/licenses/by/4.0/).
Share and Cite
MDPI and ACS Style
Ritchie, M.; Zhang, J.; Hammett, E. Aboveground Biomass Response to Release Treatments in a Young Ponderosa Pine Plantation. Forests 2019, 10, 795. https://0-doi-org.brum.beds.ac.uk/10.3390/f10090795
AMA Style
Ritchie M, Zhang J, Hammett E. Aboveground Biomass Response to Release Treatments in a Young Ponderosa Pine Plantation. Forests. 2019; 10(9):795. https://0-doi-org.brum.beds.ac.uk/10.3390/f10090795
Chicago/Turabian StyleRitchie, Martin, Jianwei Zhang, and Ethan Hammett. 2019. "Aboveground Biomass Response to Release Treatments in a Young Ponderosa Pine Plantation" Forests 10, no. 9: 795. https://0-doi-org.brum.beds.ac.uk/10.3390/f10090795
Note that from the first issue of 2016, this journal uses article numbers instead of page numbers. See further details here.