Assessment and Mapping Green Areas Ecosystem Services and Socio-Demographic Characteristics in Turin Neighborhoods (Italy)


Department of Agricultural, Forest and Food Sciences, University of Turin, Largo Paolo Braccini 2, 10095 Grugliasco, Italy
*
Author to whom correspondence should be addressed.
Forests 2020, 11(1), 25; https://0-doi-org.brum.beds.ac.uk/10.3390/f11010025
Submission received: 15 October 2019
/
Revised: 26 November 2019
/
Accepted: 16 December 2019
/
Published: 23 December 2019
(This article belongs to the Special Issue Assessing, Valuing and Mapping Ecosystem Services)
Abstract
:The ecosystem services (ES) and human well-being are keywords that guide the Italian strategy on urban greening. The development of ES priorities linked to specific land uses help to guide the drafting of management plans. The aim of the research was to assess and map green areas ecosystem services and socio-demographic characteristics in Turin neighborhoods in order to identify where to improve the provision of ecosystem services and the socio-demographic conditions. The Preliminary Assessment Method (PAM) was used for the assessment of provision and regulating services based on land use. The Species-specific Air Quality index (S-AQI) was used to assess the regulating services provided by trees. Three socio-demographic characteristics were analyzed at the neighborhood level—age index, housing density, and % of economically assisted citizens. PAM results show that Turin provides more ecosystem services in peripheral areas of the city. Trees with high S-AQI values represent 21% of the censed trees. Not recommended trees are 18%. The neighborhoods with higher S-AQI values are not always characterized by a higher number of trees/km2 or species richness. Results show that the northern part of the city is characterized by higher values of ES and socio-demographic conditions than the central-southern part. This aspect is related to the conspicuous presence of agricultural land uses and water bodies, together with the presence of tree species with a high S-AQI values and high or medium socio-demographic conditions. 57% of the neighborhoods present low results for both aspects. Actions to improve the quality of green spaces in those neighborhoods could have great effects on liveability. Future management and planning strategies for increasing citizens’ well-being through urban greening should consider the proposed approach.
Keywords:
ornamentals; well-being; management; urban horticulture; green infrastructure; air quality1. Introduction
Urbanization is increasing globally, creating opportunities and challenges to promote people’s quality of life in a sustainable way [1]. Worldwide, the number of people living in urban areas is higher than in rural areas, with 55% of the world’s population living in urban areas in 2018 and 68% of the world’s population expected to be urban by 2050 [2]. Ecosystem services are used for the development of sustainable goals and to support environmental policy objectives at all levels of urban governance [3]. Specifically, cultural and regulating ecosystem services, such as air pollution removal, urban cooling, and recreation, seem to be particularly important in urban contexts [4]. The EU Biodiversity Strategy 2020 called on the Member States to map and assess the state of ecosystems and their services within their national territory in order to create a basis for developing Europe’s green infrastructure. In addition, information and data on actual demand for ecosystem services (ES), beneficiaries and potential mismatches with their location of supply, as well as on the quality and quantity of ES, are essential to make informed decisions for the proper management of natural resources [5]. Moreover, human well-being is positively influenced by the level of biodiversity present in urban and peri-urban green spaces [6], which must be maintained or increased through effective management of plant and animal species, improving the quality of existing habitats through management [7]. In addition, socioeconomic inequalities in health are less pronounced in people with greater exposure to green space than in those with less exposure [8].
As many ecosystem services are provided by urban green spaces, these will need to be better managed and planned to ensure a high standard of living in urban areas [9]. For the assessment of ecosystem services in urban areas, several methods can be applied [10,11,12]. Some of them are based on spatially explicit biophysical indicators to analyze the spatial distribution of ES delivery [13], others on suite of models or web-based modeling platforms for the spatially-explicit assessment of ecosystem services [14,15], and finally some of them are supported by qualitative tools based on a set of expert judgments [16]. However, the governance of socio-ecological systems to maximize the provision of ecosystem services suffers from the uncertainty of responses and the complexity of managing urban contexts [17].
Certainly, the development of ecosystem service priorities linked to specific land uses would also help to guide the drafting of management plans [18].
Among the land uses that contribute most to providing ecosystem services in urban areas, there are the green areas [19,20,21]. Specifically, although herbaceous vegetation plays an important role in providing ecosystem services in urban areas [22], the tree component is certainly the most studied and is considered the most important in such contexts, especially for air pollution removal [23,24,25,26] and for the interaction between air pollution and pollen emission [27,28]. To this end, there are several possibilities for assessing ecosystem services and specifically the air pollution removal potential, by using specific models and tools [29], or selected indicators [30,31].
As urban forestry has become a valuable tool in recent years to address a number of urban challenges in the development of a more sustainable and resilient city model, the paper focuses on this issue, specifically also analyzing the ecosystem services provided by trees in the urban environment. The importance of these concepts is extensively described in the ‘Guidelines on urban and peri-urban forestry’ published by the Food and Agriculture Organization of the United States in 2016 [32], by the World Health Organization [33], which highlights the relationship between trees and human well-being and is promoted by the Tree Cities of the World program [34]. In this paper, the combination of services offered by land uses, and the urban tree component is particularly and likewise important.
The lack of wealth of information on the current state of specific resources, such as an accurate tree inventory and an assessment of the current state of the urban forest, is probably the basis for specifically planning urban development [35].
In addition, the analyses carried out on the tree bark to monitor air quality, which reflect a long-term and multi-year average air contaminant load [36], were interesting, indicating that plants are also excellent indicators. However, plants tolerate air pollution levels differently [37], showing different growth rates in high-polluted areas [38] retaining pollutants according to the size of trees with particular reference to the canopy cover [39,40] and becoming a relevant aspect in future city planning activities [41].
In Italy, a national urban green strategy was proposed in 2018 [42], based on three essential elements: moving from square meters to hectares, reducing asphalted areas, and adopting urban forests as a structural and functional reference for urban greening. The aim is to achieve the goals of sustainable growth and the environment, set out in the Conference of the Parties [43] in 2015, in particular concerning the containment of emissions and the adaptation to climate change. The ecosystem services and human well-being are keywords that guide the national strategy. In Italy, there are several levels of governance, from the regional to the metropolitan and urban scale. However, at the management level, in urban areas, the reference unit is the neighborhood. Neighborhood-level analyses are particularly useful because population and land use classes are not evenly distributed across the city and are often influenced by distance from the city center [44].
For this reason, it is useful to understand if urban green planning can focus on priority areas of intervention. In order to address this question, the aim of the research was to assess and map green areas ecosystem services (provisioning and regulating) and socio-demographic characteristics (aging index, housing density, and economically assisted citizens) in Turin neighborhoods.
Future management and planning strategies for increasing liveability should take the results into consideration.
2. Materials and Methods
2.1. Study Area
The city of Turin (Piedmont, Italy) is located in the Po Valley, is bordered by four rivers, and extends over a flat urban area (239 m a.s.l.), and in a hilly area that reaches an altitude of 715 m a.s.l. The city’s surface extends for 130.2 km2, where 878,074 inhabitants live [45].
Turin has very high levels of air pollution [46]: the average PM10 of 2018 measured in the center of Turin is 33.0 μg m−3, and the maximum daily value, set at 50 μg m−3, was exceeded 55 times [47]. The level of pollution in Turin was found to be very harmful to the citizens’ health, both for adults and children, causing various respiratory problems [48,49,50].
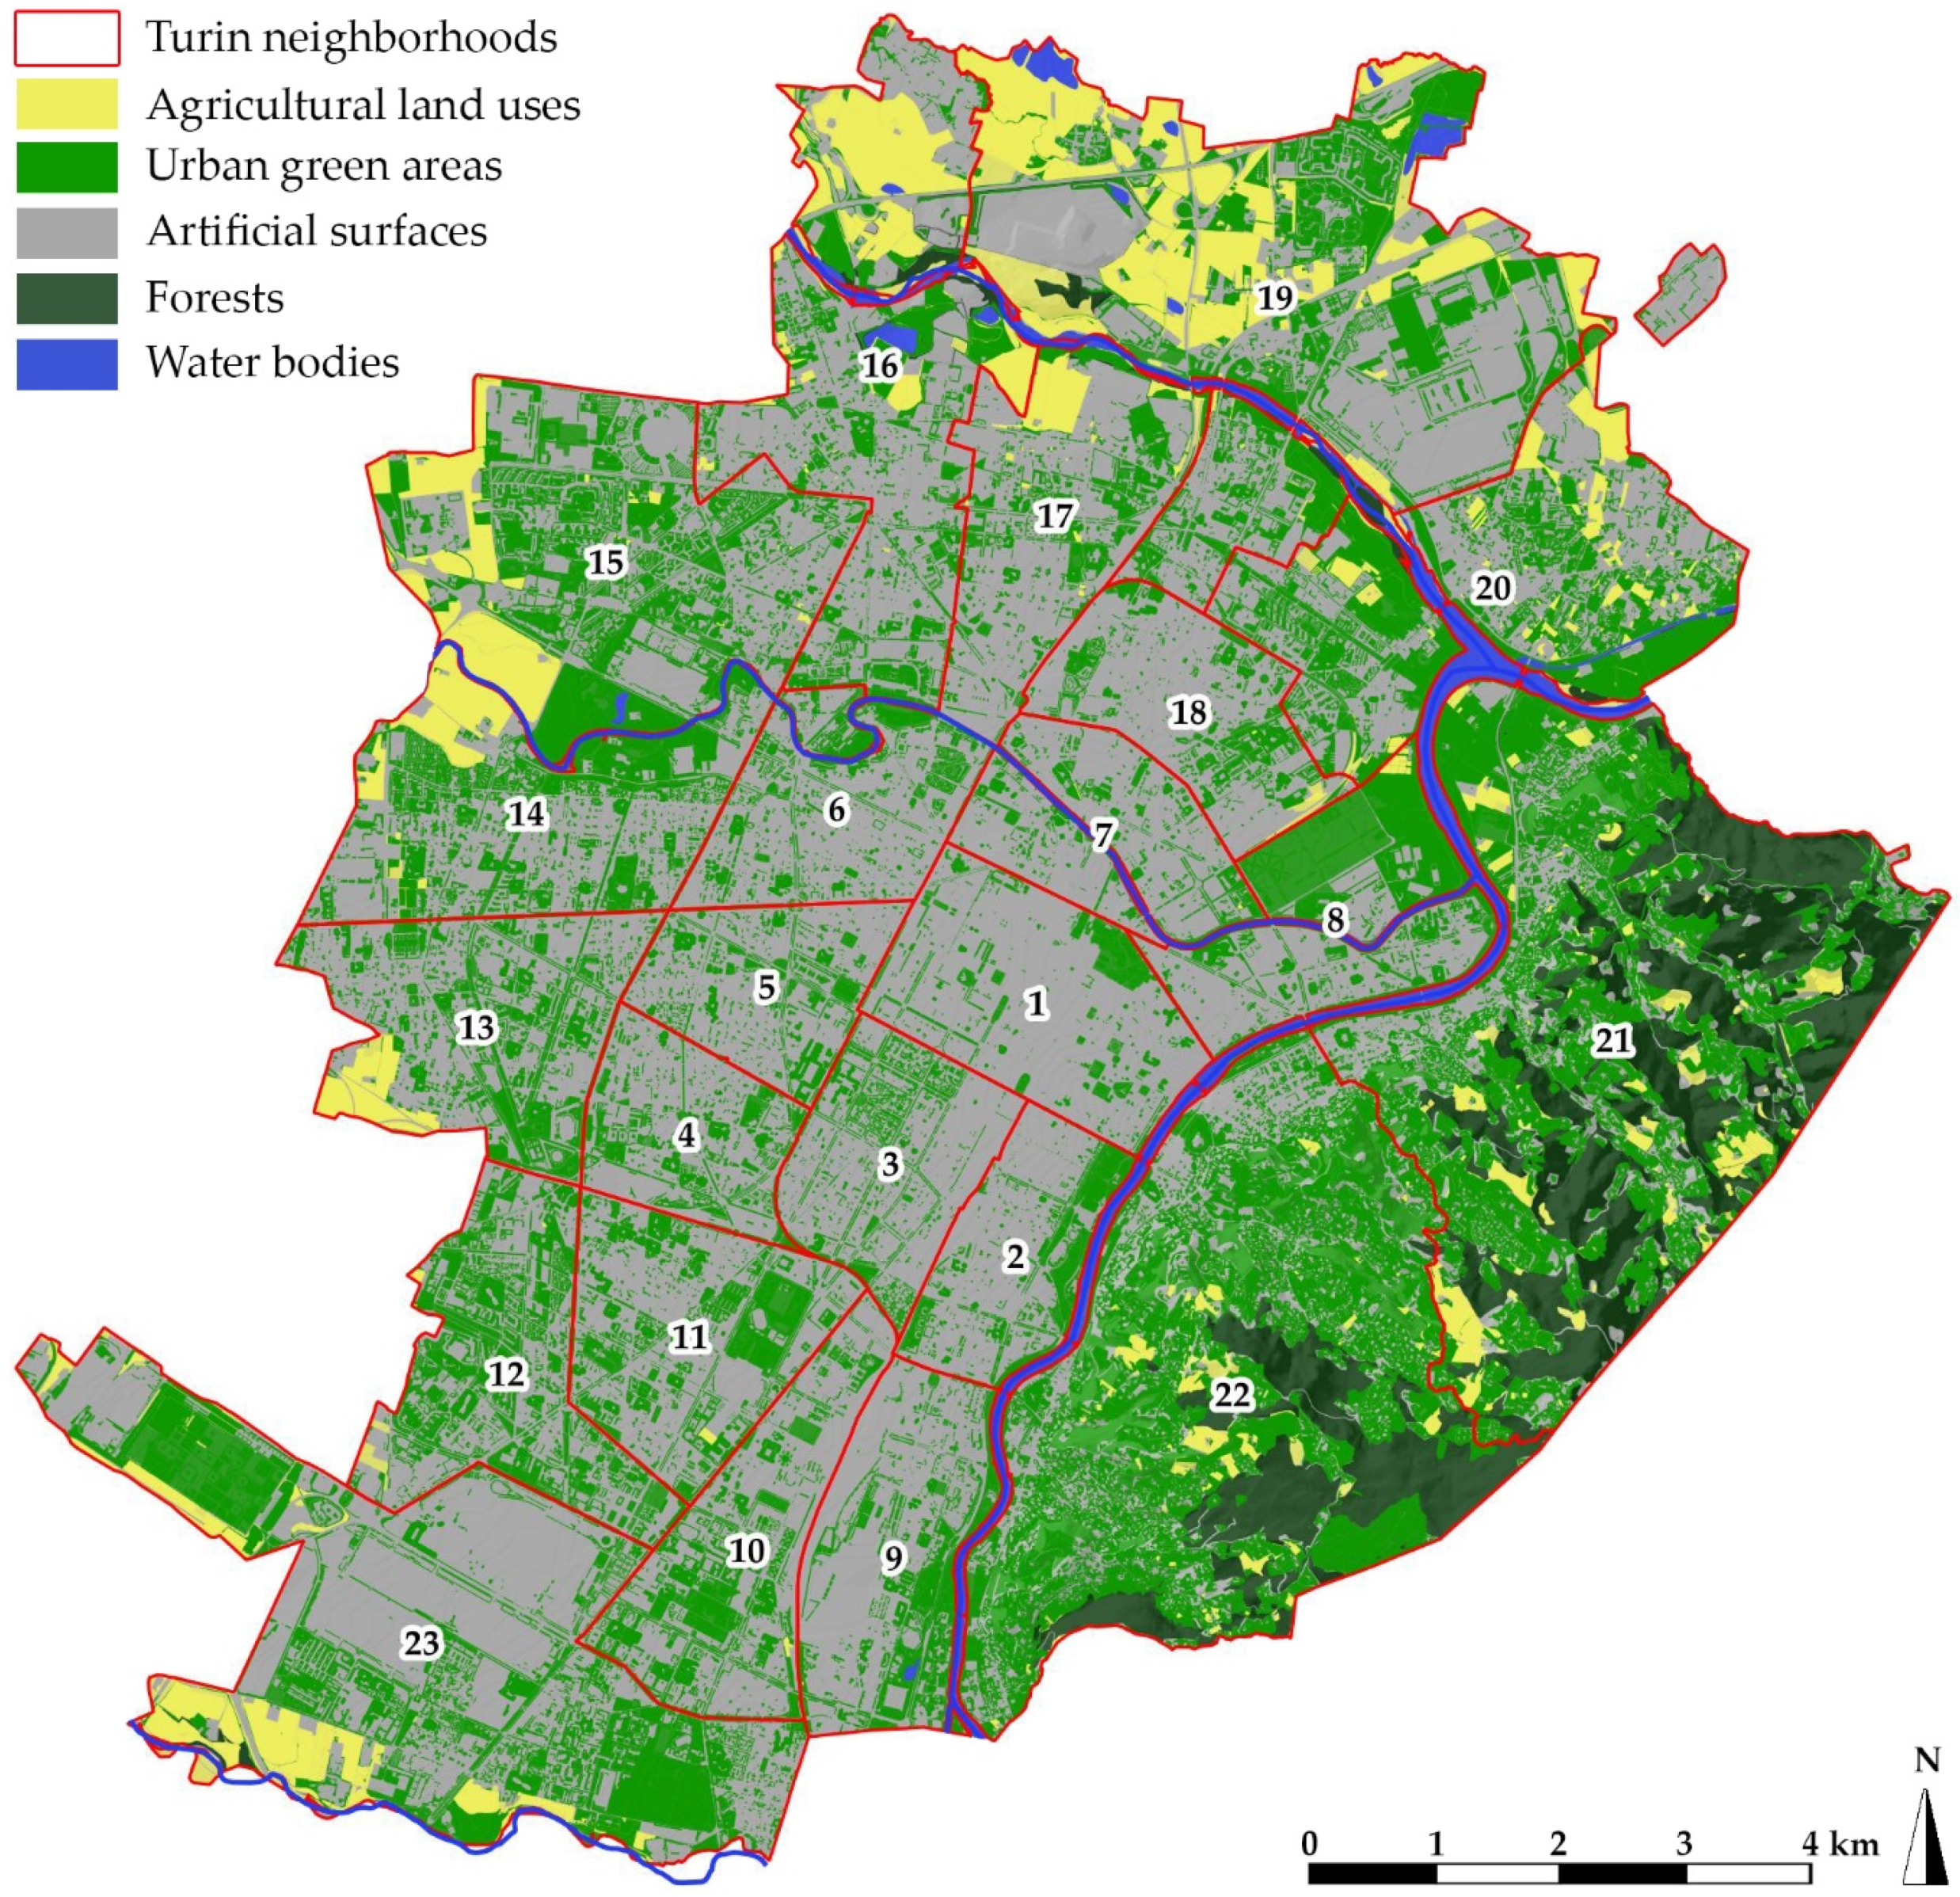
Figure 1 reports Turin’s land use classes elaborated starting from Urban Atlas—Copernicus Land Monitoring Service and Municipality’s data. Artificial surfaces that comprise construction sites, continuous and discontinuous urban fabrics, roads and associated lands, industrial, commercial, public, military and private units, isolated structures, land without current use, dumpsites, railways, and associated lands, sports and leisure facilities, is the main land-use class in the city center. Quite the opposite, urban green areas are present all around the city but to a greater extent in the peripheral neighborhoods, and especially, in the hilly neighborhoods. The latter (hilly neighborhoods, specifically Madonna del Pilone and Borgo Po e Cavoretto) are particularly characterized by forest. Agricultural land uses (arable lands, urban horticulture, pastures and permanent crops) are mainly located in the northern part of the city. Water bodies mainly consist of small artificial lakes and rivers that cross the entire city.
The city of Turin has a public geodatabase that contains information about the city. A web application called Albera.TO is used for trees management, and it is dedicated to technicians and specialists [51]. Most of the trees located in the city center and along the main roads are more than 50 years old [52]. It follows that the management of urban greening is essential to maintain such an important heritage and that some green areas and trees will have to be redesigned and replaced over time.
2.2. Methodological Framework
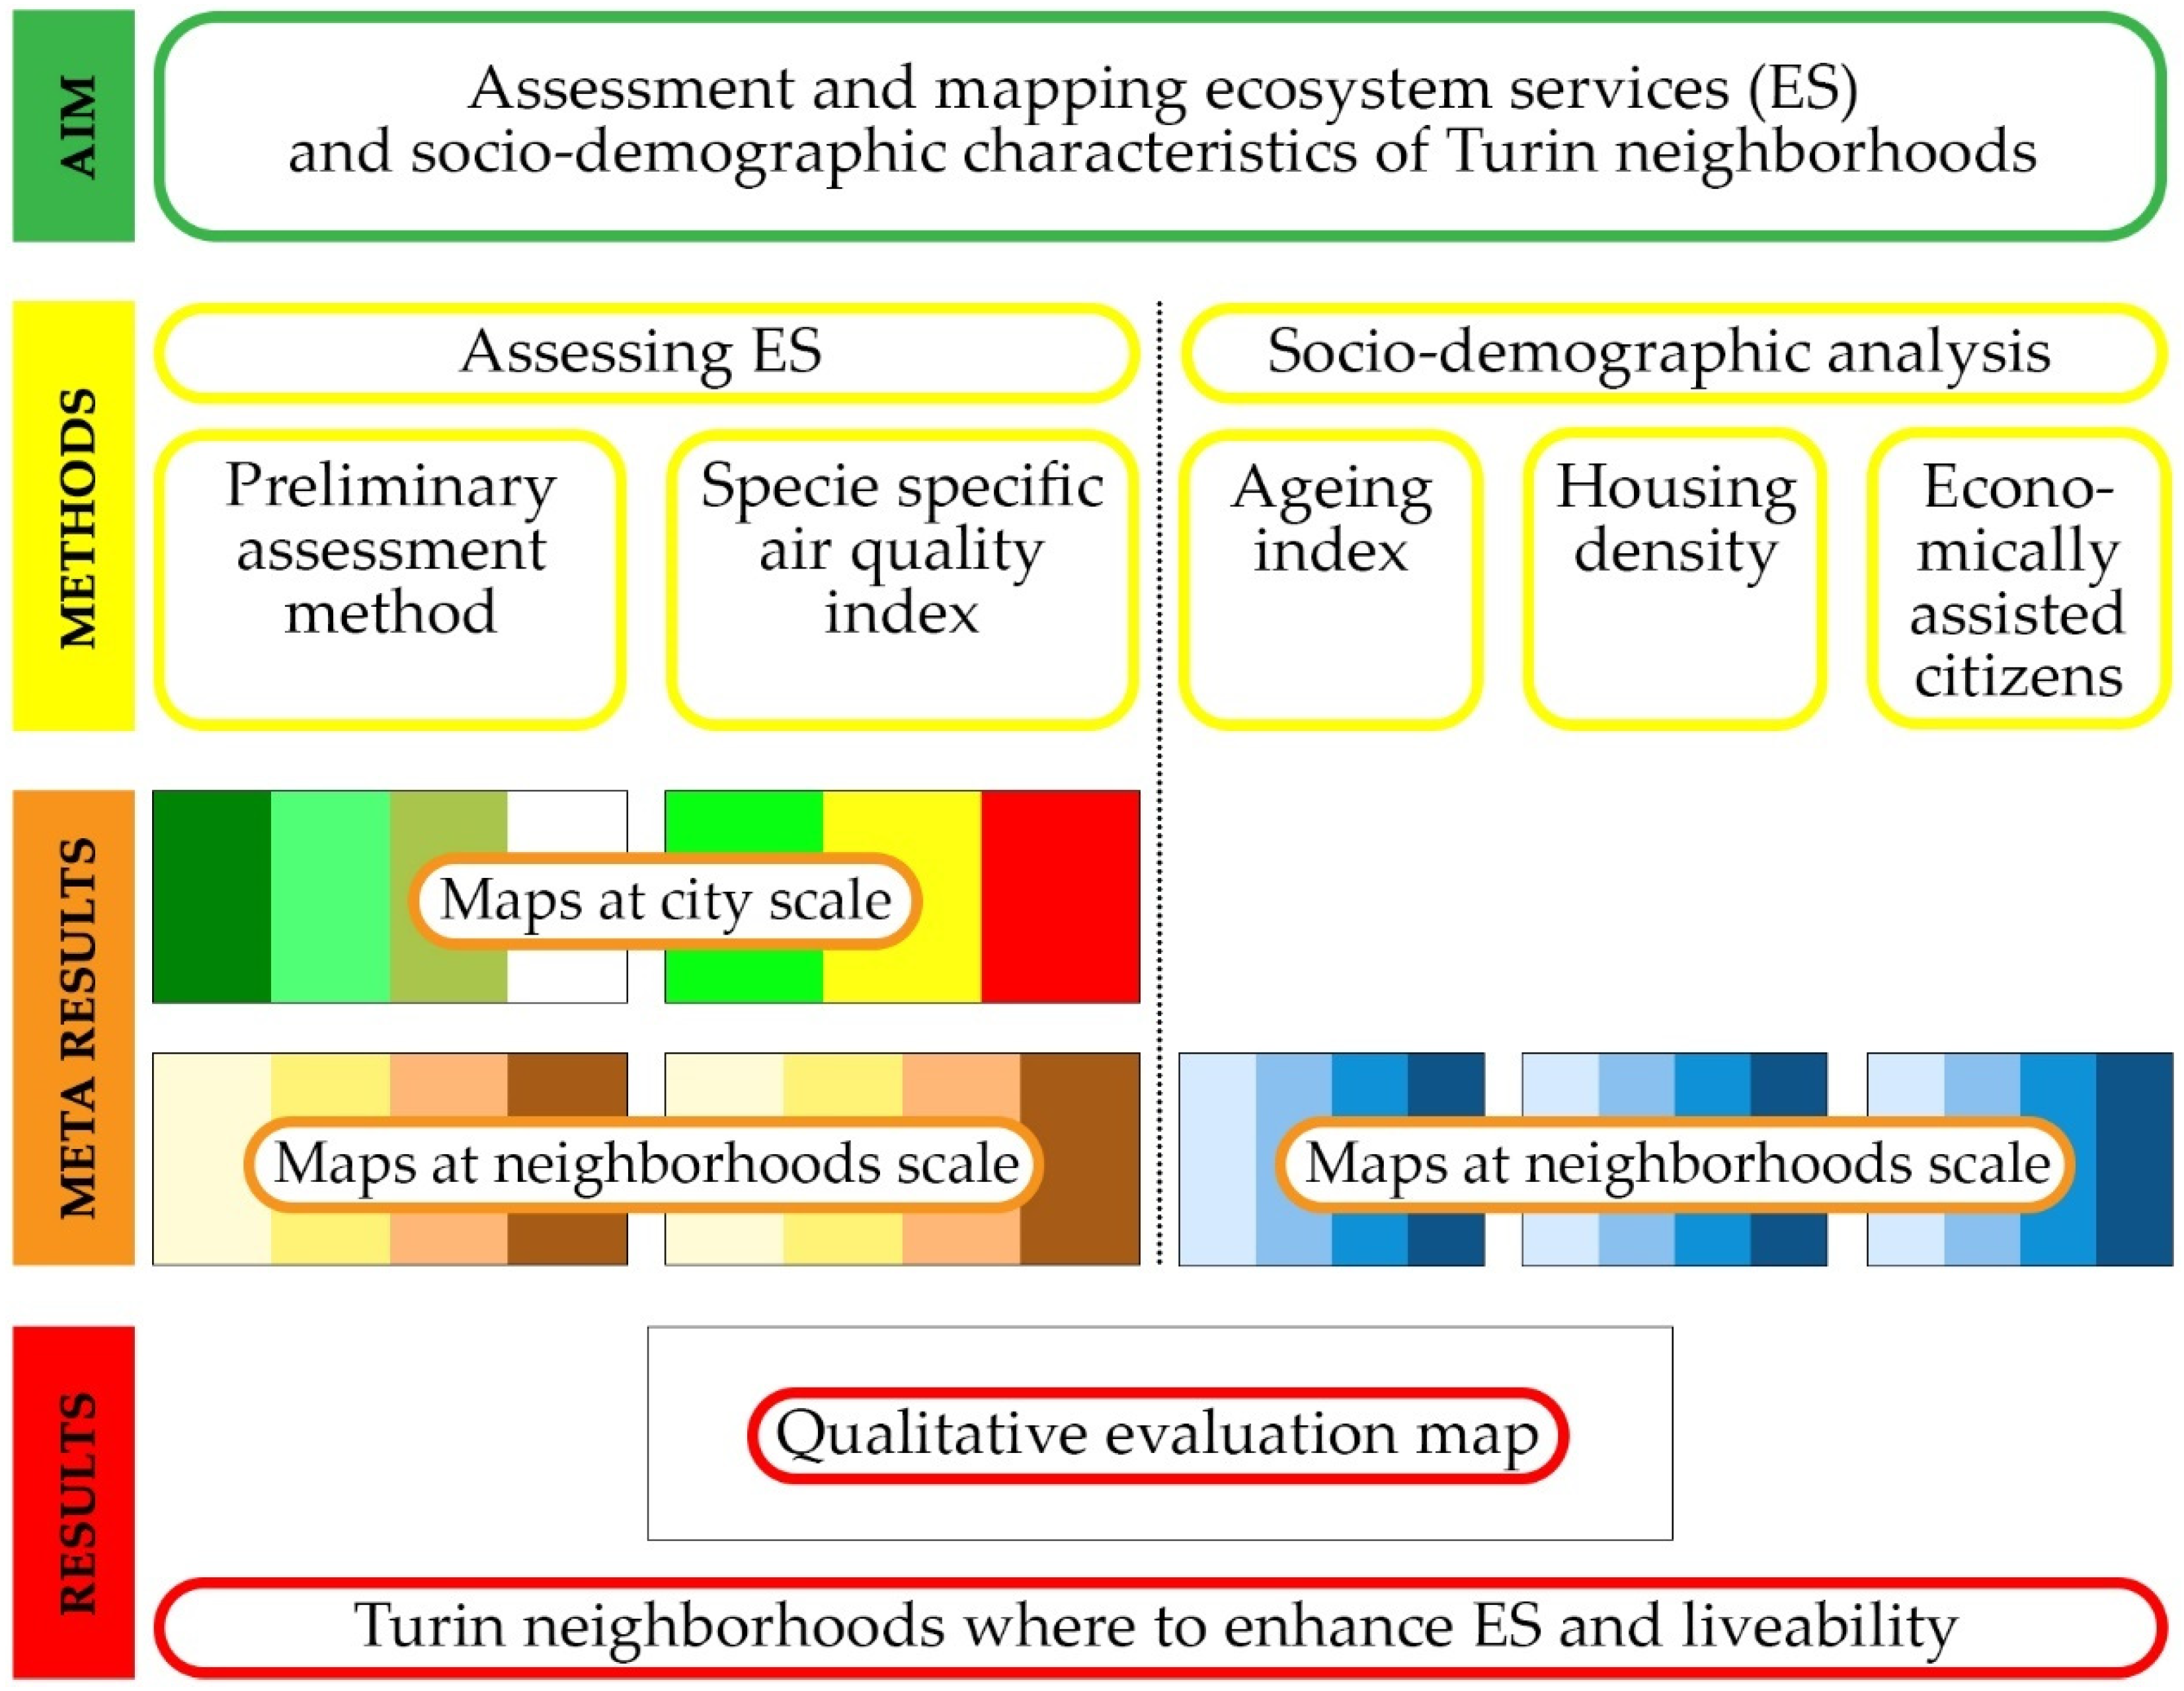
To achieve the objective, the research was divided into several phases (Figure 2). The evaluation and mapping of ecosystem services and socio-demographic characteristics led to the elaboration of different maps on an urban and neighborhood scale. Meta results were finally elaborated in a final qualitative evaluation map.
2.3. Ecosystem Services Assessment Methods
In order to analyze the provisioning and regulating services of the city of Turin, related to the categories of land use and to the benefits provided by trees to citizens, two different methods were applied. All the analyses were carried out using QGIS 2.18.1 software (Open Source Geospatial Foundation, Beaverton, OR, USA) and refer to the neighborhood level. The reason was to understand which neighborhood in the city provided more or less the ecosystem services analyzed. Since ecosystem services are benefits that are provided to humans, it was necessary to understand the socio-demographic characteristics of the neighborhoods in order to identify which neighborhood would need to benefit most. The data provided by the Turin City’s statistical office and the Giorgio Rota Report [53] were used and analyzed for this purpose.
2.3.1. Preliminary Assessment Method (PAM)
The matrix for the qualitative assessment of ecosystem services was selected as the first method. The matrix linked land cover types to the ecosystem service supply capacity and was initially proposed by Burkhard et al. in 2009 [54]. It is a general methodology for assessing the supply of ecosystem services of different landscapes, including the concept of ecological integrity as a prerequisite for providing ecosystem goods and services to humans [55]. From the matrix, it is possible to create maps that show the spatial potential of ecosystem services, and can be used in the landscape planning process.
Specifically, the approach proposed by Zepp et al. in 2016 was applied [56]. It is also based on a matrix for the qualitative assessment of ecosystem services and is defined as the Preliminary Assessment Method (PAM) and classified as a Phenomenological model by ESMERALDA (Enhancing ecoSysteM sERvices mApping for poLicy and Decision mAking) project, that provide methodologies to assess ecosystem services in EU states [12]. The assessed ecosystem services were provisioning and regulating.
PAM is focused on Urban Ecosystem Services (UES), mapped indirectly through land cover and land use. In this context, land cover information is based on the Urban Atlas (EEA 2018) [57] that provides European land use data for urban areas. To improve the quality of the information analyzed, the Urban Atlas map has been integrated with information from more accurate maps provided by Turin Municipality. The data sets analyzed consist of 18 land use classes. The minimum mapping unit varies from 0.25 ha for settlement areas and 1.0 ha for agricultural land, forests, and water bodies. Therefore, this method can be applied for homogeneous spatial units exceeding 50 m × 50 m, equivalent to 0.25 ha.
The ecosystem services considered are those present in the Common International Classification of Ecosystem Services (CICES) from the European Environment Agency [58], reported in Supplementary Materials Table S1. For each class of land use, in the matrix, was attributed a value of ecosystem service supply (expert-based evaluation) classified into four categories: P—Priority; S—Significant; I—Insignificant, N—Non-relevant.
Once the values have been assigned to each land-use class, the number of priority and significant potential UES values are counted, and the potential overall ES supply of each land cover unit is calculated. Then it is calculated the UES Significance according to the following formula and classified according to Supplementary Materials Table S2. The four classes identified in Supplementary Materials Table S3 indicate high levels of supply of ecosystem services (1st class); medium levels of supply of ecosystem services (2nd class); low levels of supply of ecosystem services (3rd class); and no significance in supply ecosystem services.
where the weight of significant services (wS) = 0.5 and the weight of priority services (wP) = 1. Insignificant and non-relevant categories were not considered in the formula.
For more information about the ecosystem services analyzed, based on the CICES v.5.1 and the method used to calculate UES Significance for each land use, please refer to Tables S1 and S2.
In addition, an average value of UES Significance has been calculated for each neighborhood of Turin, and the values have been grouped into four categories: ≤4 low supply; 4.1–6 medium-low supply; 6.1–8 medium-high supply; >8 high supply.
2.3.2. Air Quality Index
The second method applied is based on the ability of trees to provide benefits to humans, with specific reference to the reduction of air pollution. The reduction of air pollution, especially in urban areas, is due to the presence of trees that remove large amounts of pollutants improving urban air quality [40,59].
For the purposes of the study, it was necessary to find an index that:
- was a tool for ranking common urban plant species on the basis of their ability to improve the air quality, so as to be able to map and attribute a value to the trees of the City of Turin present on the Albera.To system;
- that considered the Ozone (O3), which especially in Turin, but also in other Italian cities, is present in high concentrations [60];
- that considered the climate of the Mediterranean areas, with specific reference to the Italian reality.
The Air Quality Indexes evaluate the overall air pollution level based on multiple air pollutants, to measure the air quality with respect to its effects on human health [61,62,63,64,65,66,67].
Species-specific Air Quality index (S-AQI), proposed by Sicard et al. in 2018 [68], which considers the main disservices (pollen and biogenic volatile compounds emission) and the main benefits, such as the capacity of filtering air pollutants, tolerance to pollution and drought of tree and shrub species, was used. This method has, therefore, deepened a benefit that is part of regulating services.
The S-AQI considers the main disservices (pollen and biogenic volatile compounds emission) and the main benefits, such as the capacity of filtering air pollutants, tolerance to pollution, and drought of tree and shrub species. The index was applied to the trees of Turin based on Albera.TO system (updated to March 2019).
The values of the S-AQI, are based on a scale of 1 to 10, subsequently grouped into three categories of values: 1–4 not recommended; 8–10 recommended plant species for city planting program, 4.1–7.9 neither recommended nor discouraged. S-AQI does not consider some parameters among which the different dimensions of the trees, the canopy density, and water-use strategy. This index can be used at the neighborhood scale. To each tree in the Albera.TO system has been assigned an S-AQI value and have subsequently been grouped into three categories: S-AQI values <4 low values; ≥4–<8 medium; ≥8 high. The weighted average value of the S-AQI of the city of Turin (6.4) was calculated and considered as medium-low value. The same procedure was applied to each neighborhood, and the values were grouped into four categories: <6 low values; 6–6.5 medium-low values; 6.51–7 medium-high values; >7 high values.
2.4. Socio-Demographic Analysis
To assess the socio-demographic characteristics of Turin neighborhoods, data collected by the Municipality’s statistical office, and Giorgio Rota Report 2015 [53] were analyzed, using formulas reported in Table 1. The characteristics analyzed were aging index, housing density, and economically assisted citizens. In order to compare the neighborhoods, all the results were grouped into four categories: low, medium-low, medium-high, and high values. The attribution to one of these four classes is not to be understood in absolute value, but in relative value compared to the other neighborhoods.
2.5. Qualitative Evaluation of Socio-Demographic Characteristics and Ecosystems Services
In order to respond to the proposed objective, the results of PAM, S-AQI, and socio-demographic analysis (aging index, housing density, and economically assisted citizens) have been used to dress a qualitative evaluation map at the neighborhood level.
As shown in Table 2, it was attributed gradually negative values to the increase of aging index, housing density, and economically assisted citizens at the neighborhood scale (−1 for medium-high values, −2 for high values). At the same time, it was ascribed gradually positive values to their decrease (+1 for medium-low values, +2 for low values). Indeed, the increase of the three parameters is an aspect that affects the life quality negatively at the neighborhood scale. Particularly, where aging index is high, there is a greater probability of finding more people who need care and are more susceptible to chronic diseases than neighborhoods where the index is low [71]. A high population density leads, instead, to high anthropic pressure and causes an increase in the air pollution [70]. For these reasons, low values of the three parameters were considered as a condition of good liveability.
On the opposite, human well-being is positively influenced by the increase of provisioning and regulating services. Therefore, were attributed: −2 to low values, −1 to medium-low values, +1 to medium-high values, and +2 to high values.
As shown in Supplementary Materials Table S5, values attributed to each neighborhood for socio-demographic characteristics have been combined. Similarly, values concerning ecosystem services were combined. Final values highlighted the level of ecosystem services and socio-demographic conditions at the neighborhood scale. Results, divided into three classes, were shown on a qualitative map, where:
- -
- high represents the sum of assigned values > 0;
- -
- medium represents the sum of assigned values = 0;
- -
- low represents the sum of assigned values < 0.
However, it is worth noting that the aspects analyzed include a selection of ecosystem services provided by different land uses. Green spaces are among the most important land uses in urban areas, because their quantity and quality contribute to reducing environmental injustice on public health [72,73] and how certain levels of canopy cover [74,75] contribute to increasing the level of human well-being, reducing air temperatures and air pollution. Nevertheless, there are other aspects that influence human well-beings, such as psychological or hydrotherapeutic effects [76] and the sense of safety given by urban green areas [77].
3. Results
3.1. Provisioning and Regulating Services at the City Scale
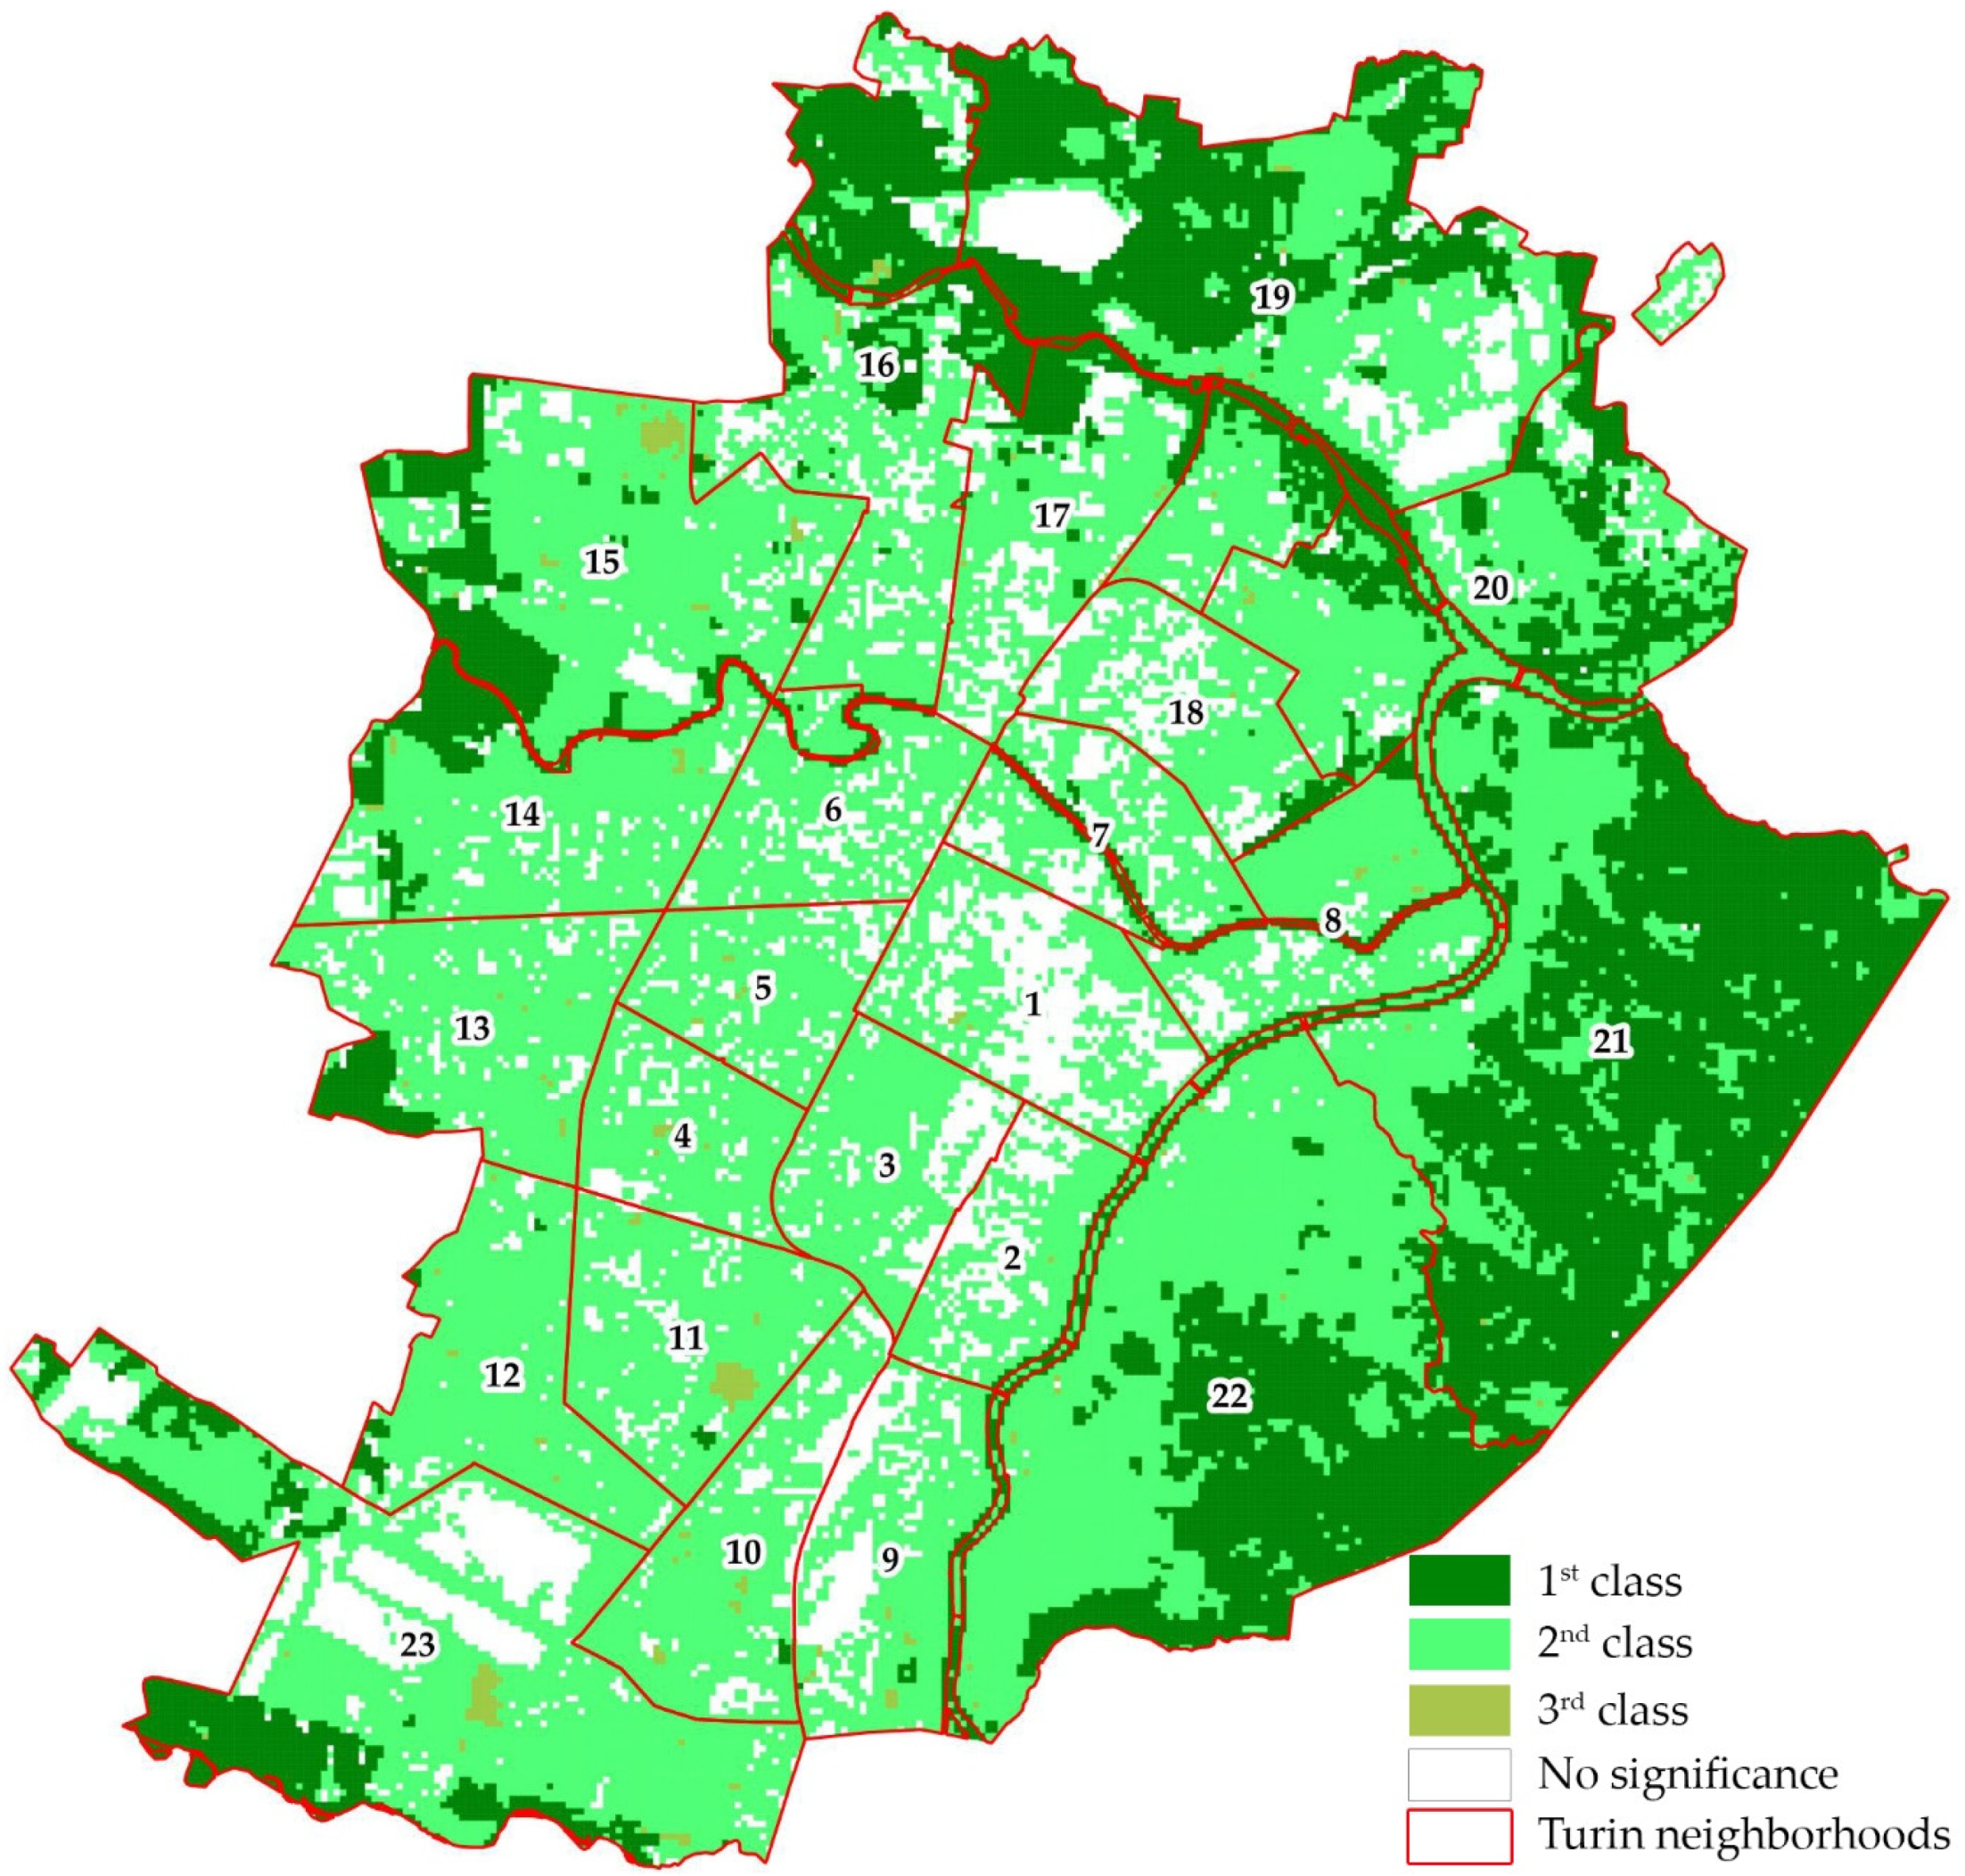
Provisioning and regulating services of the City of Turin were analyzed using PAM. Figure 3 reports the UES Significance (Table S3) of overall values of provisioning and regulating services at the urban level.
The city exhibits a fine-grained pattern in which a core-periphery-gradient is quite distinct. The urbanized area extends from north to south of the territory, with two large areas at the municipal limits used for industrial purposes. These are areas with no UES (urban fabric > 50%). Instead, the area to the north-west of the city has a high potential for UES because of agricultural land uses, as well as the area to the east of the city, which is a hilly forested area. The Po and Dora Rivers cross the whole city, constituting very important ecological corridors, increasing the UES potential in the surrounding areas.
3.2. Species Specific Air Quality Index at City Scale
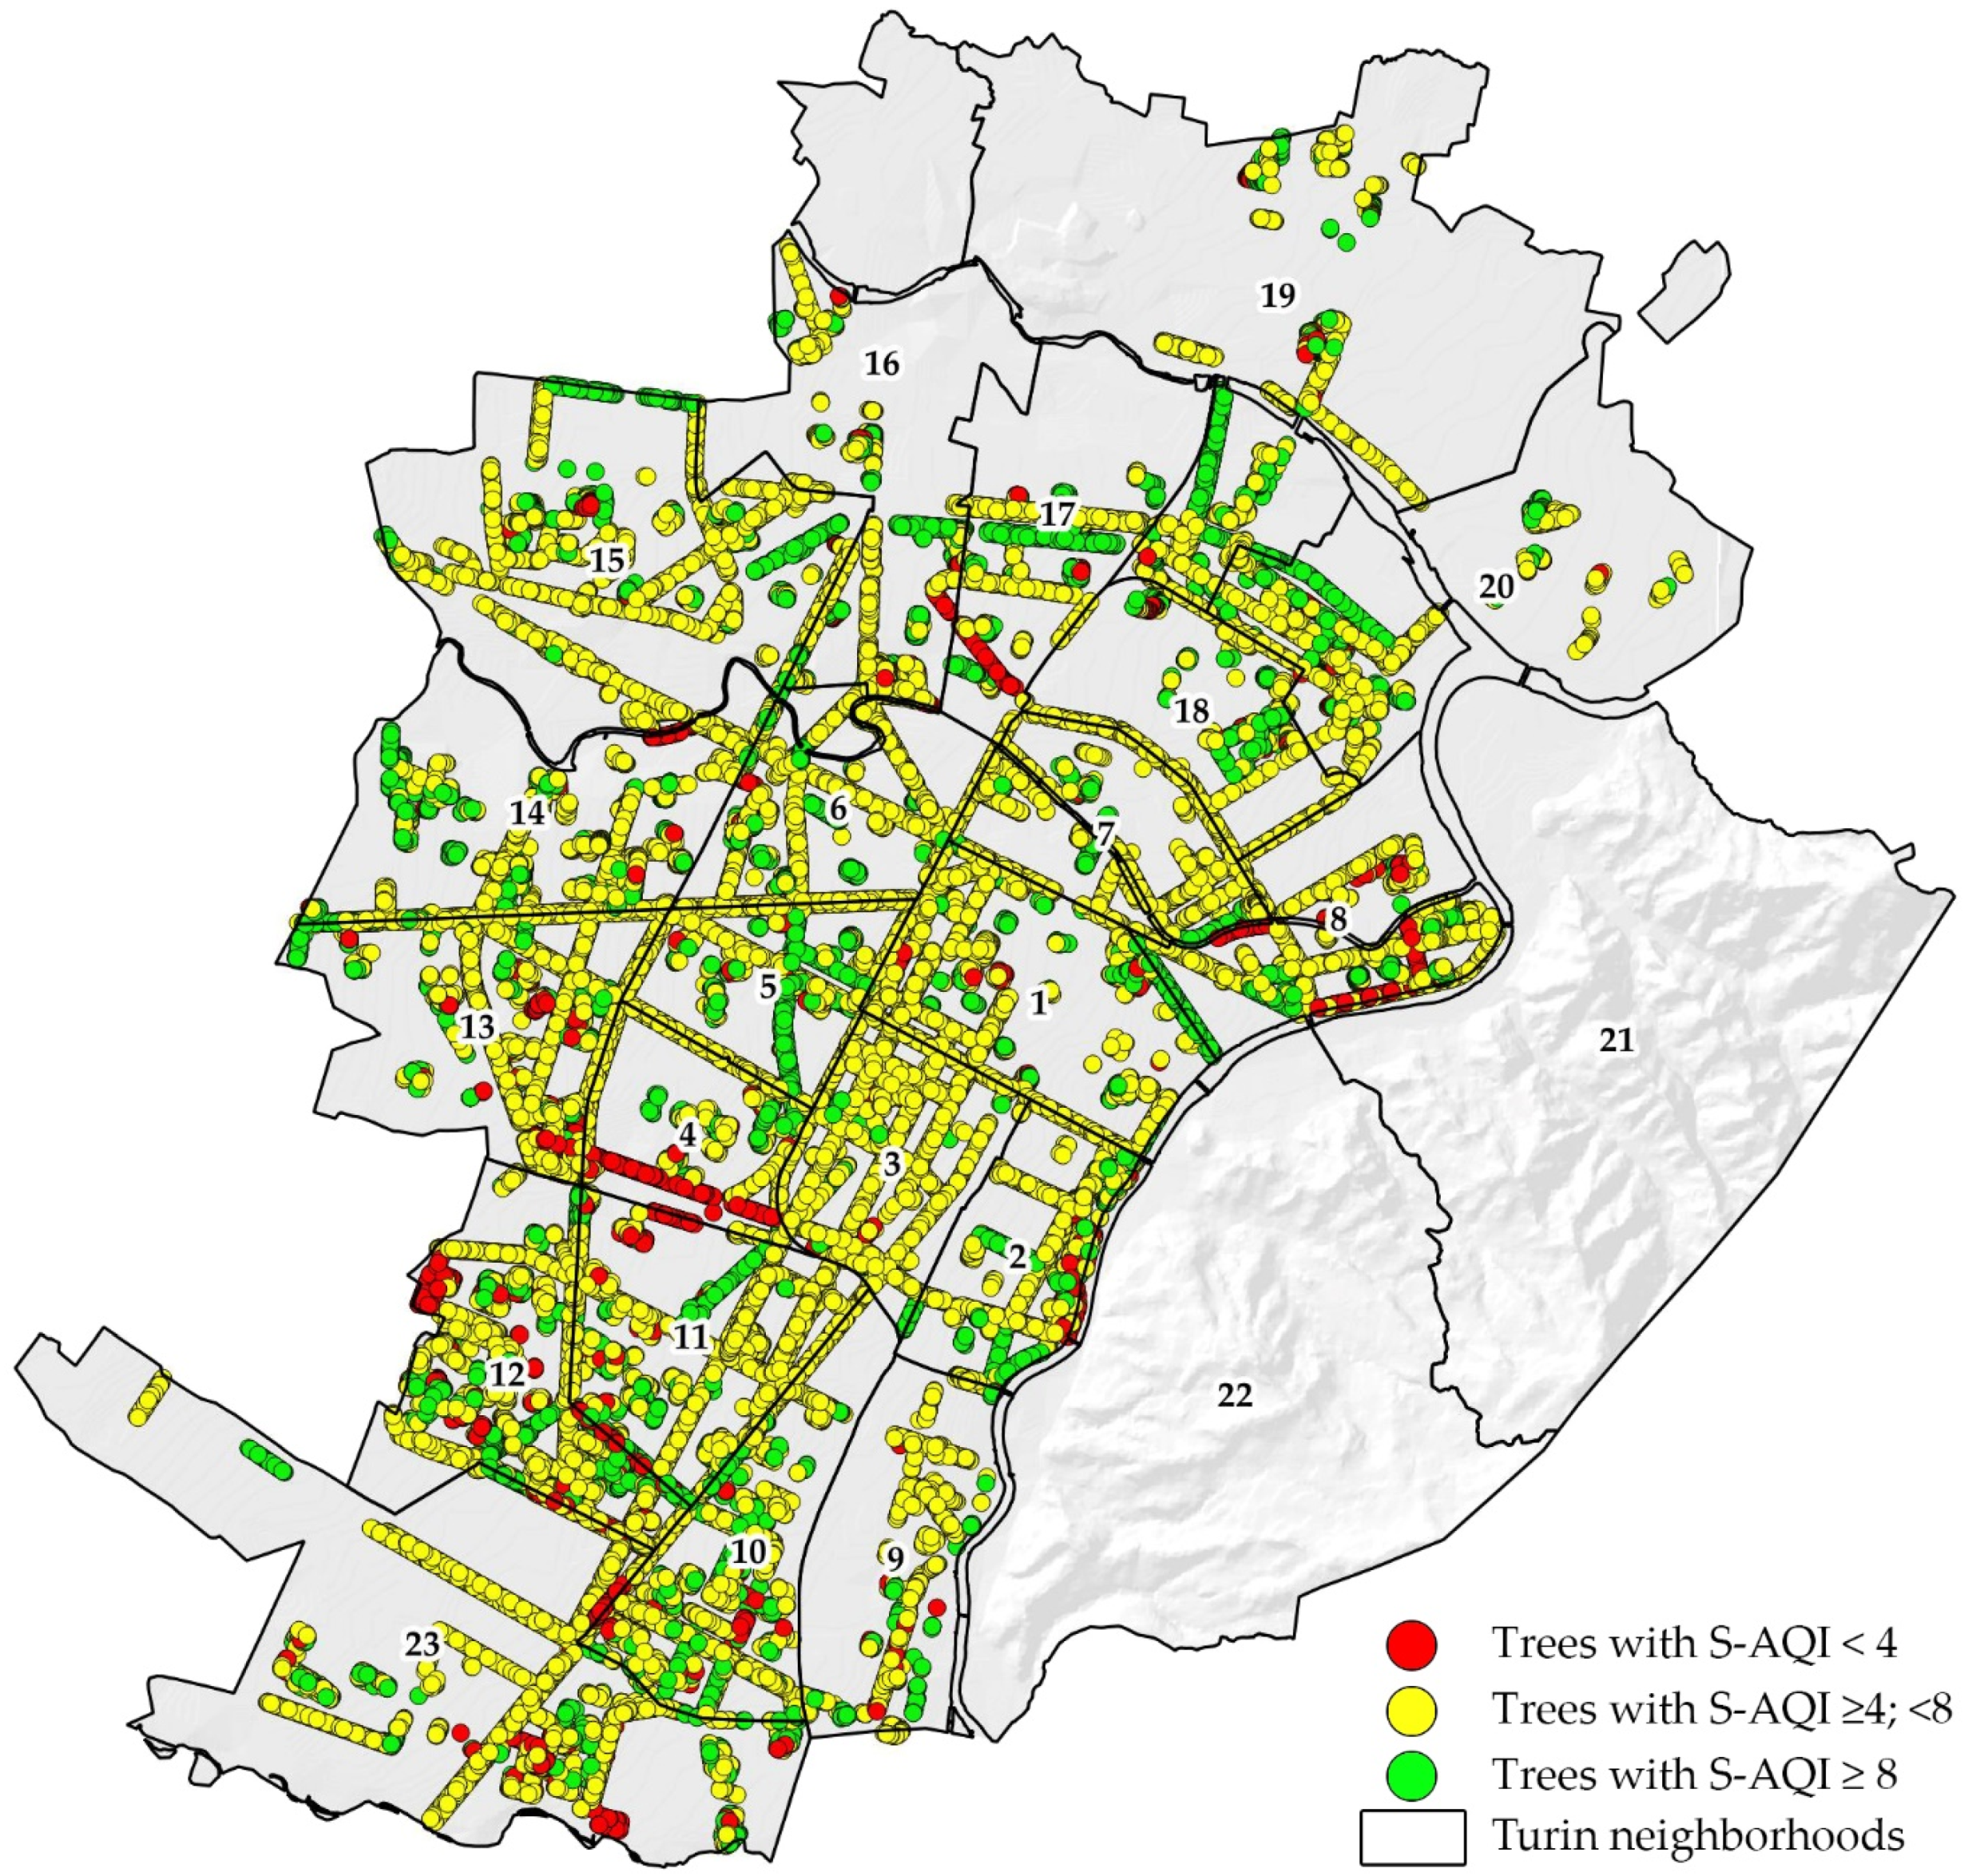
The results of the Specie Specific Air Quality Index (S-AQI) application on the trees of the city of Turin, refer to 51,148 trees. The trees analyzed were divided by neighborhood, and the species richness was calculated (Table 3).
Table 3 shows that the number of trees per km2 is higher in districts 1, 2, 3, 5, 11–13 that are located in the south-central part of the city. However, the highest values of species richness where found in districts 2, 14, and 16 that are located in the north-west of the city with the exception of neighborhood 2 that is close to the city center, and has a historical park with a high level of biodiversity.
Each tree species analyzed was assigned an S-AQI value. Tree species with S-AQI values <4 are not recommended, while values >8 are recommended for city planting programs. For more information about the detail of each species, see Supplementary Materials Table S4.
Trees data and S-AQI values were reported on a map (Figure 4). The hilly neighborhoods 21 and 22 (Madonna del Pilone and Borgo Po e Cavoretto) were excluded because the management, the monitoring, and tree’ census systems are different as the forest is the main land-use.
Figure 4 shows that most of the trees are included in the ranking value 4–8 and are present in almost all avenues that link the periphery with the historical city center. Trees with S-AQI >8 are widespread throughout the city but were less planted to realize lines of trees. Trees with high S-AQI values represent 21% of the censed trees that belong mainly to the following species: Acer platanoides L., Acer pseudoplatanus L., Carpinus betulus L., and Prunus spp. Finally, trees not recommended in urban planning are the 18% and are present in few avenues in different part of the city. The main species located in the lowest class and present in Turin are Quercus robur L., Aesculus hippocastanum L. and Populus spp.
The species most used in the 1800s for the realization of the avenues in Turin were Platanus spp., and Tilia spp. (S-AQI ≥4; <8), probably more for the ornamental rather than environmental characteristics, which were appreciated at the time.
3.3. Provisioning and Regulating Services at Neighborhood Scale
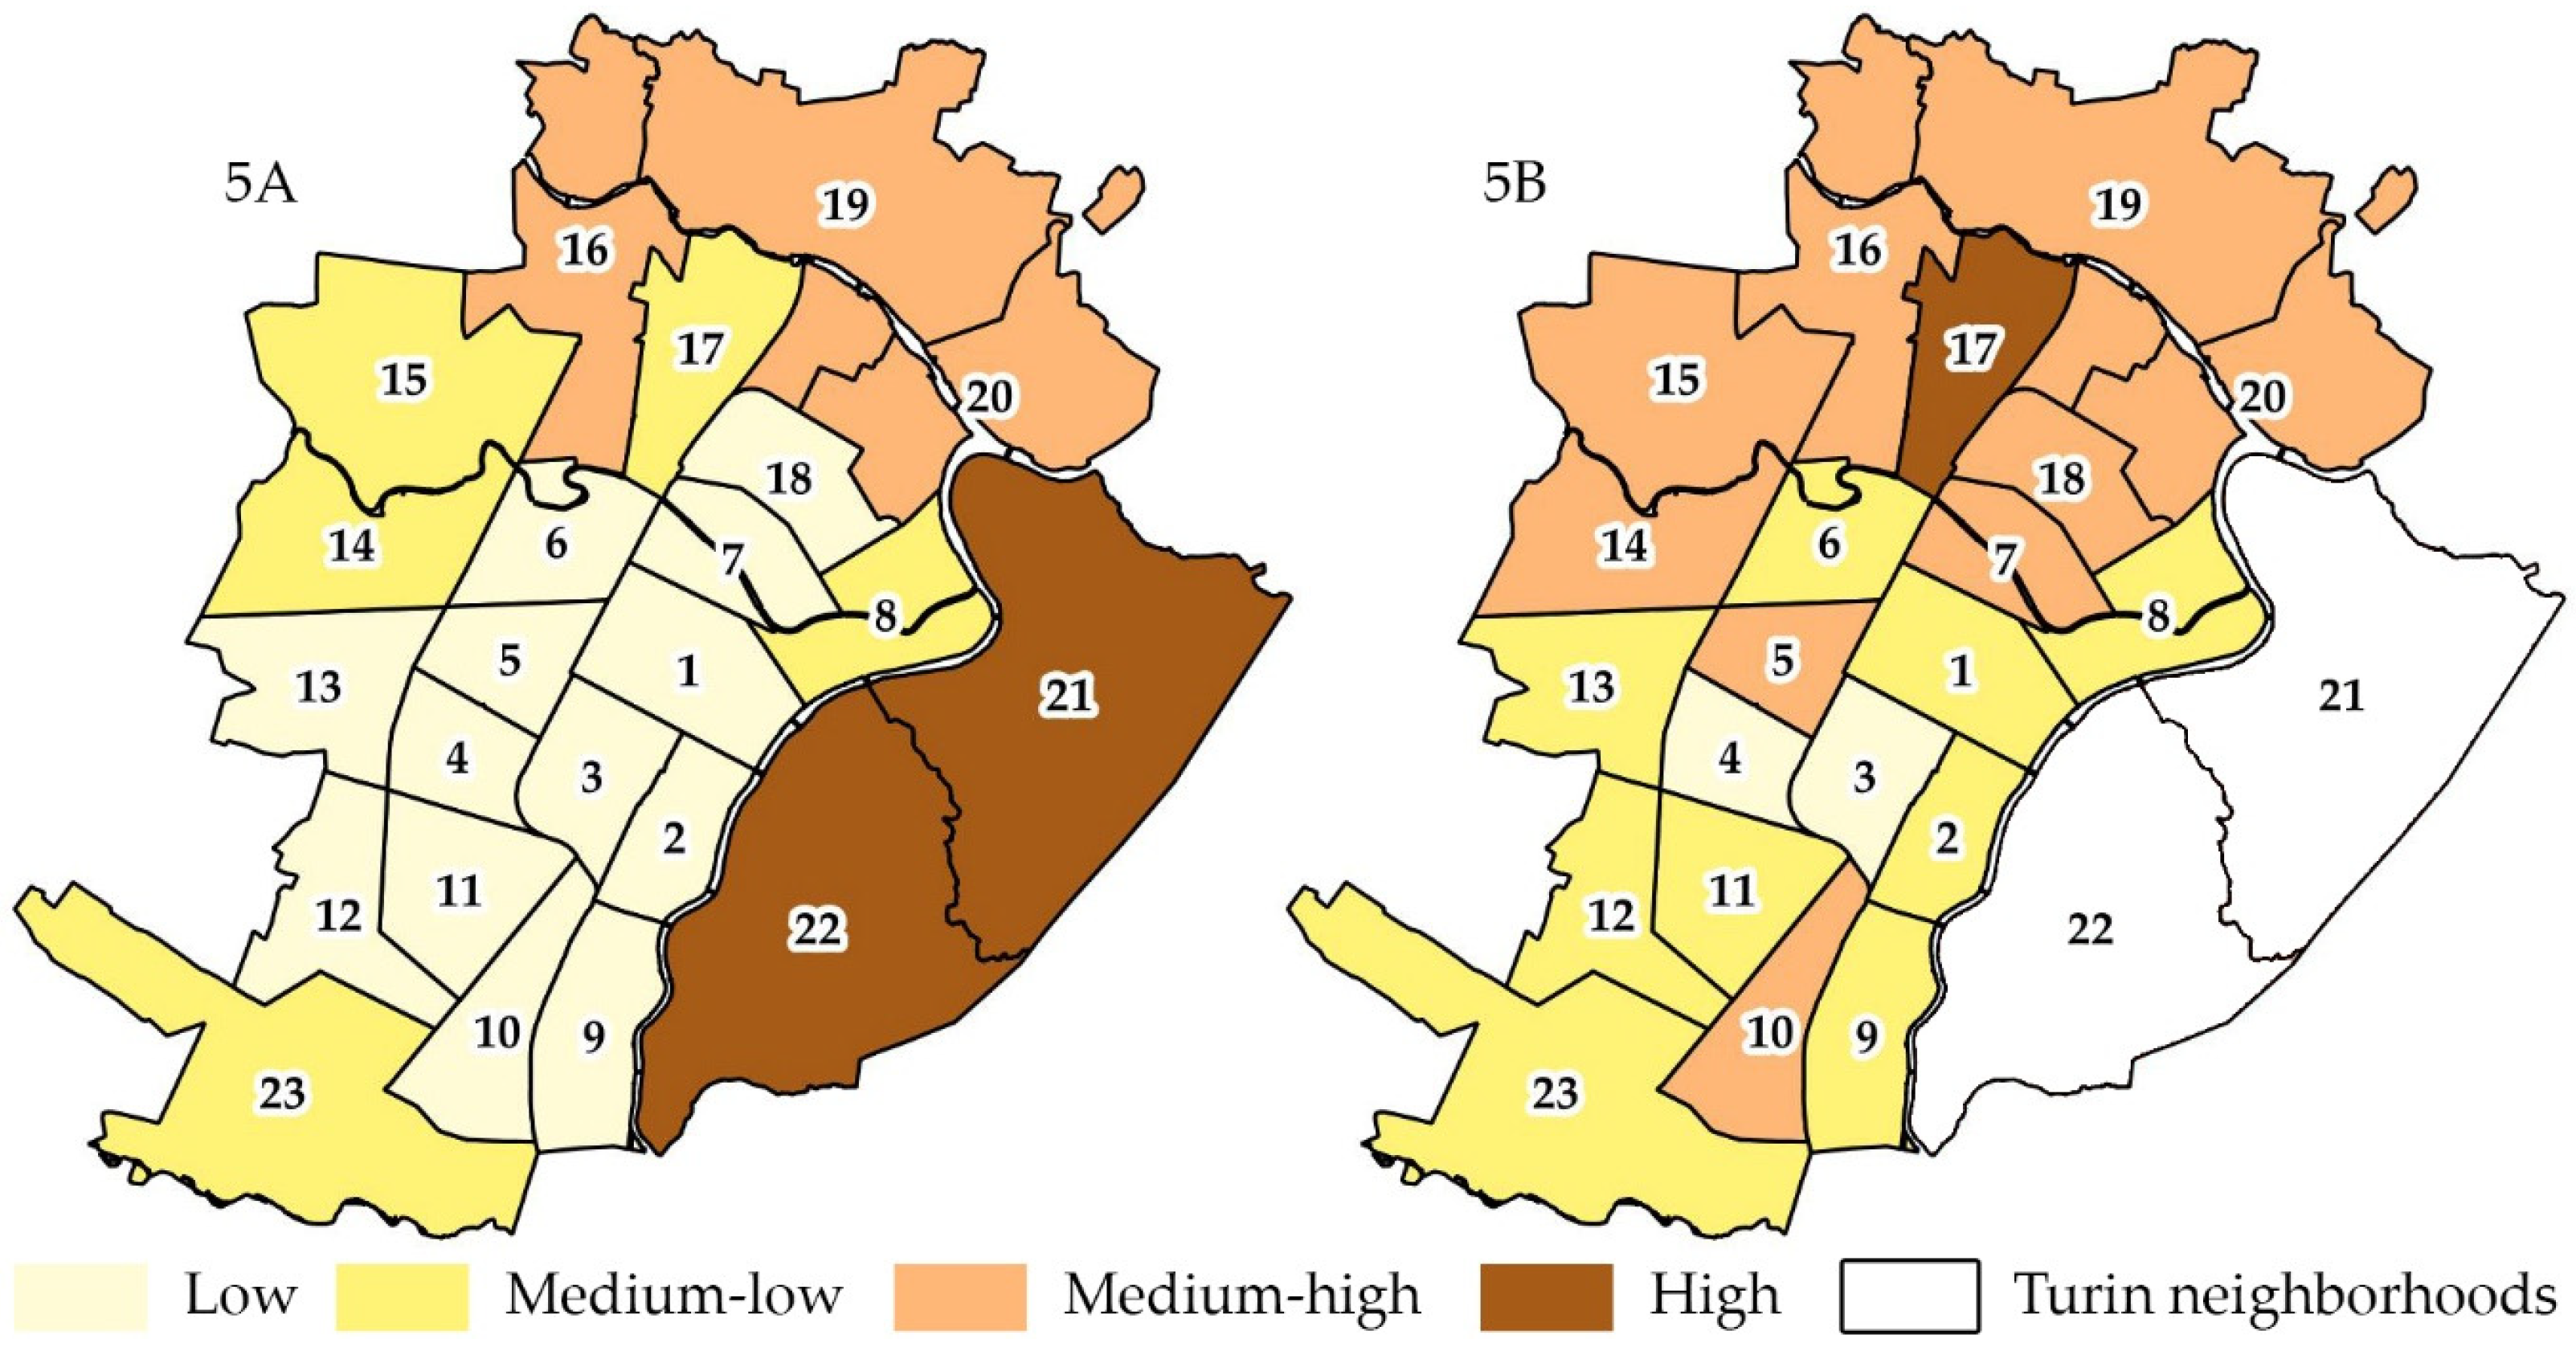
In order to highlight the differences between Turin’s neighborhoods in the provision of ecosystem services, the results obtained from the application of PAM and S-AQI have been divided into four categories (Figure 5).
Figure 5A shows the UES Significance of overall average values of provisioning and regulating services (PAM) of the Turin neighborhoods, while Figure 5B shows weighted average values of S-AQI at the neighborhood scale. The subdivision into four categories (from low to high) is intended in relative terms, in order to compare the districts among them. Regarding S-AQI, for example, no one neighborhood presents average values not recommended (<4), but some neighborhoods are characterized by a lower value than others.
The PAM results (Figure 5A) show that Turin provides more provisioning and regulating ecosystem services in peripheral areas of the city than in the city center. Indeed, the highest supply of selected ecosystem services (Table 2) occurs in the hilly neighborhoods (21 and 22), where the forest is the main lan- use. In these areas, the number of trees is very high, and the urbanized surface is very reduced. The northern neighborhoods (16, 19, 20) are characterized by a medium-high provisioning and regulating services, because arable lands, pastures, and permanent crops are more represented on average in the neighborhoods. Due to the application of PAM, the results highlight how the neighborhoods of the city where the urban fabric is denser, the supply of ecosystem services is lower. In these neighborhoods, the ES supply is assigned to urban green areas that, as seen in Figure 1, are not too extended.
Regarding S-AQI (Figure 5B), 48% of neighborhoods, representing 10 neighborhoods out of 21 (Madonna del Pilone and Borgo Po e Cavoretto are excluded) are comprised in the range of medium-low values while 42% are characterized by medium-high values. Borgata Vittoria has the best result with a high value. Only two neighborhoods (Crocetta and San Paolo) are comprised in the low category, due to the high number of trees with very low S-AQI values, such as Quercus robur ‘Fastigiata’. Therefore, the city has a great possibility to enhance the delivery of ecosystem services by planning a future replacement of trees or increasing the number of them, choosing species that can increase the provision of multiple ecosystem services. Neighborhoods should have S-AQI value >8, which is the range identified by Sicard et al. [68] like optimal for urban areas. In addition, the neighborhoods with higher S-AQI values are not always characterized by a higher number of trees/km2 or species richness (Table 3).
3.4. Socio-Demographic Characteristics of Neighborhoods
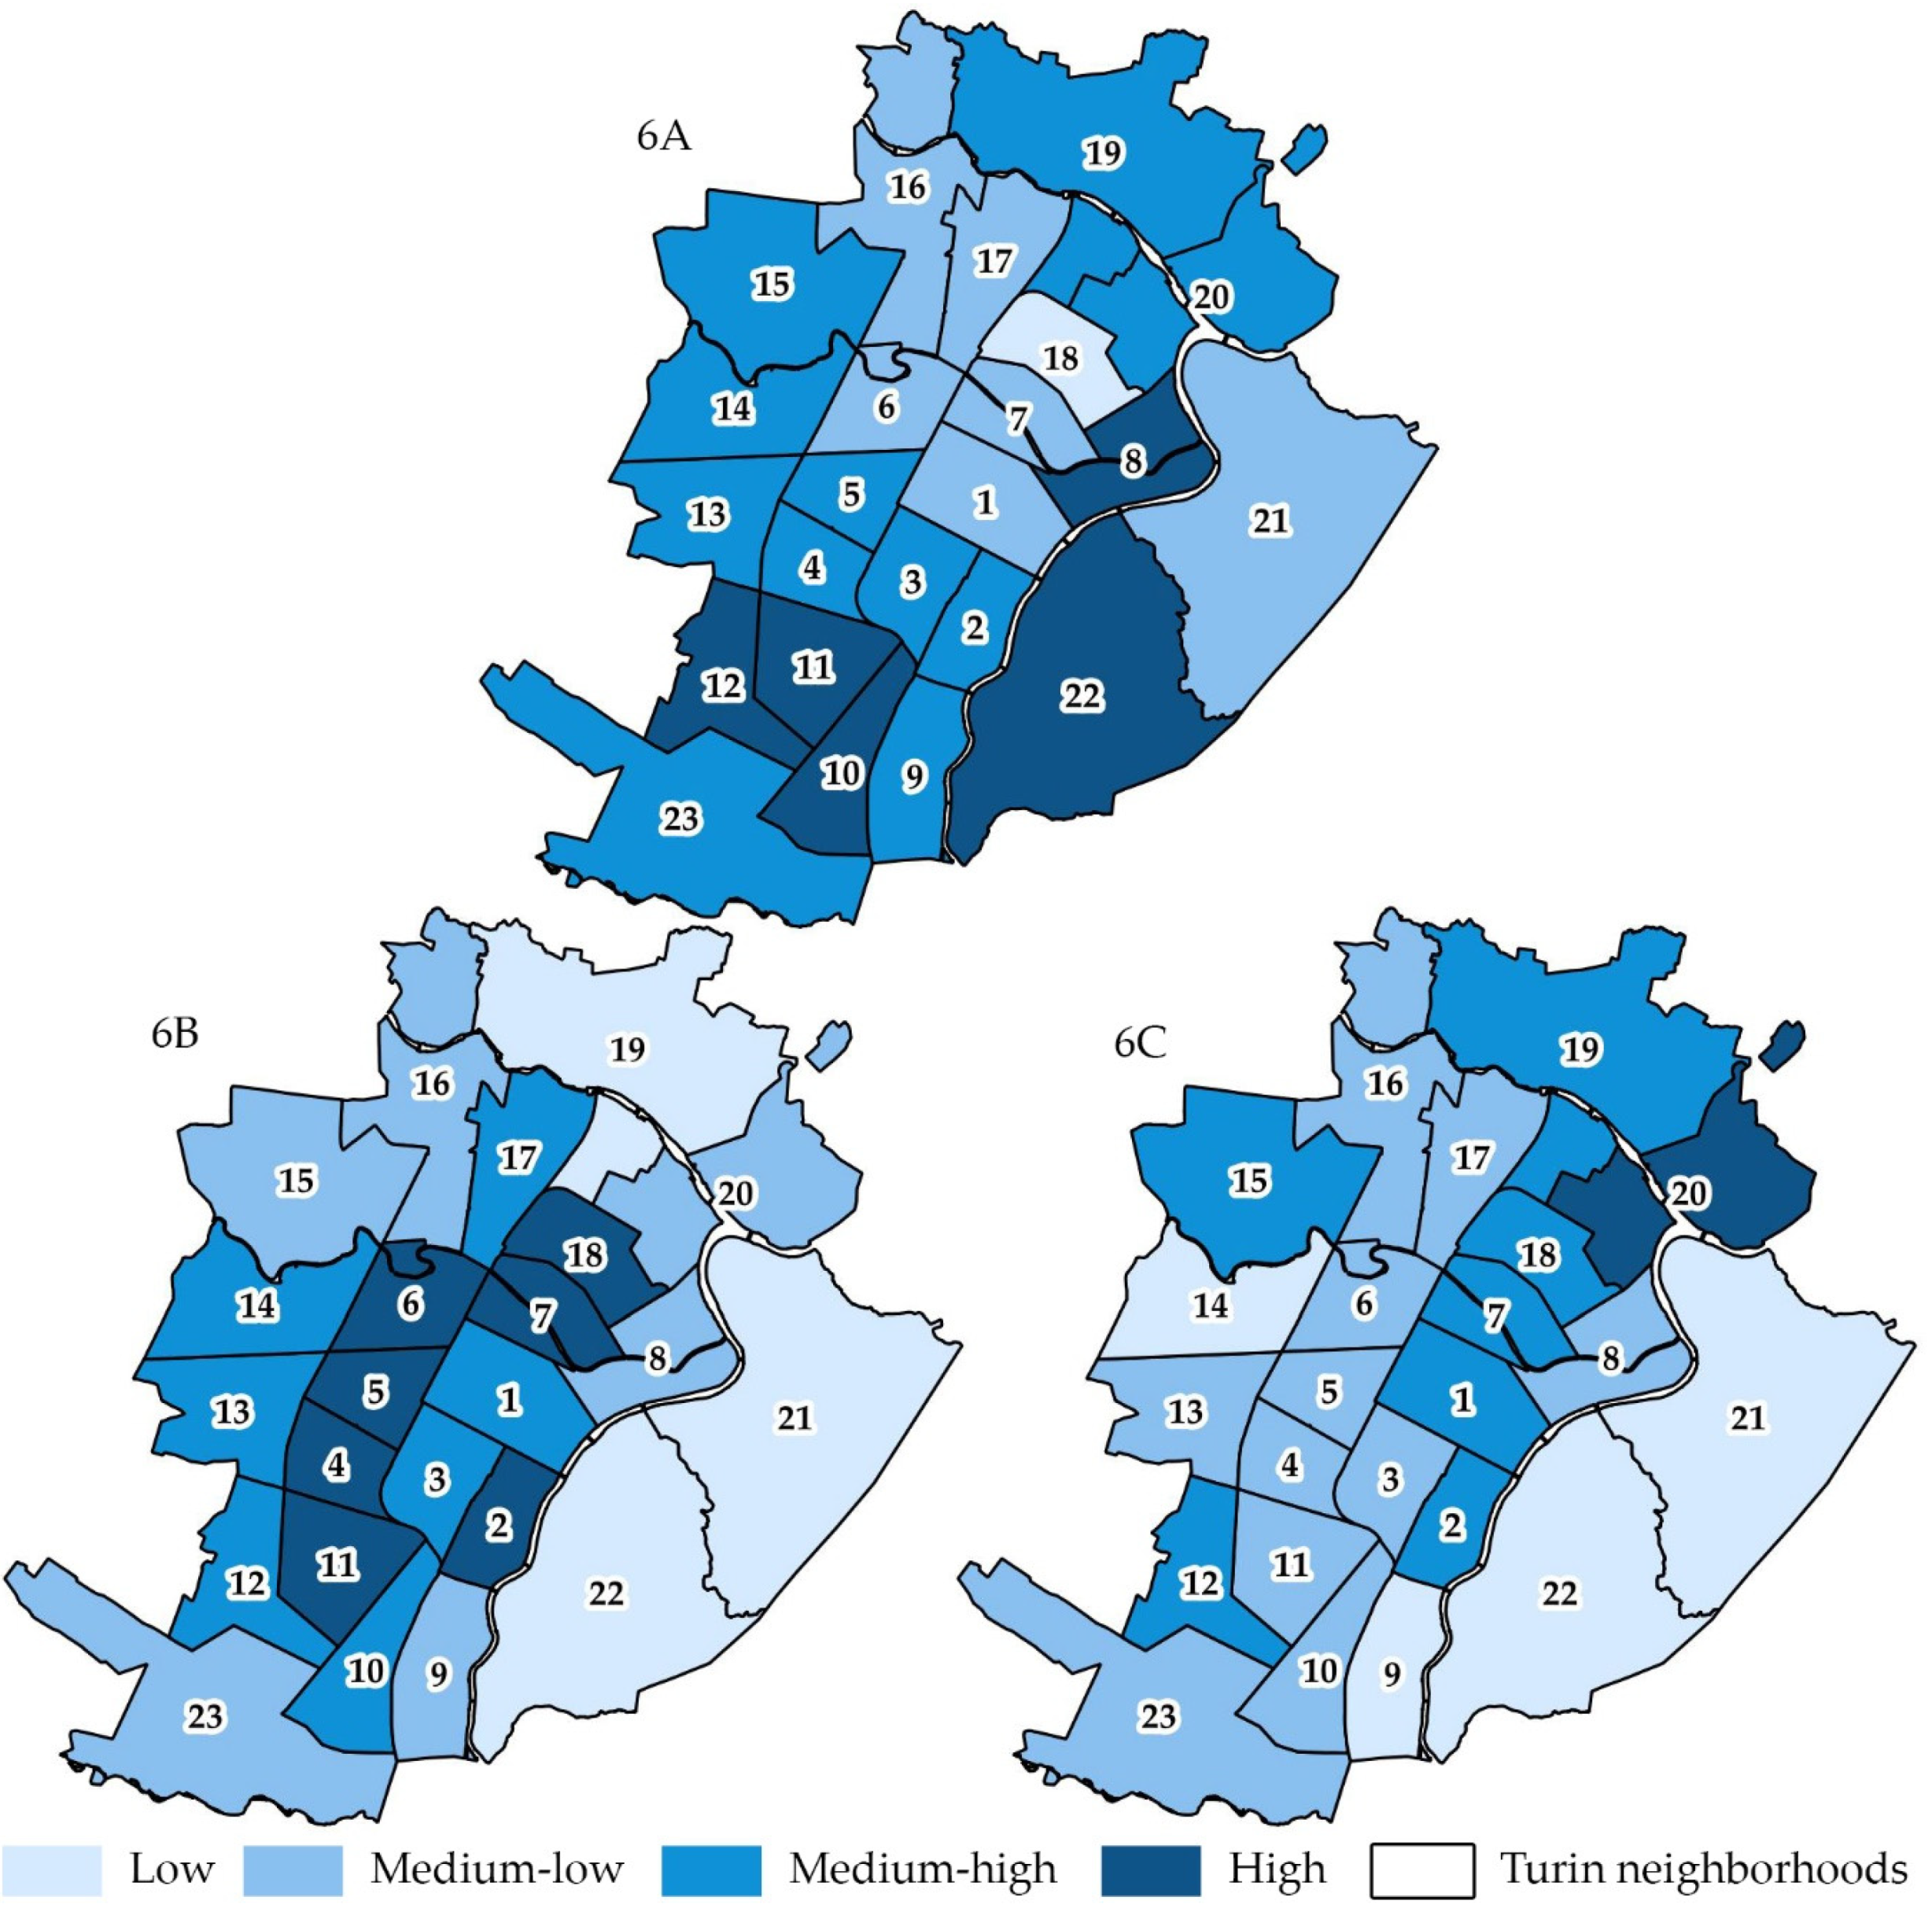
Figure 6 shows the results of descriptive analyses at the neighborhood scale, where it is possible to highlight that citizens’ socio-demographic characteristics and green urban area’s distribution are not evenly distributed around the city.
The aging index is low in Barriera di Milano (18), where the housing density is high, and the percentage of economically assisted citizens is medium-high. Quite the opposite, in neighborhood 22 lives part of the oldest range of population, in the condition of low housing density and in an optimal class of economic resources. Generally, do not seem that exists a close relationship between the aging index and the housing density because in some cases (8, 9, 15, 19, 20, 22, and 23) where the housing density is lower, the aging index is higher, but in other cases (2–5,10–14,) neighborhoods have quite similar classes of two parameters, and only in four cases (1, 6, 7, 17) high or medium-high housing density corresponds to a low aging index. Instead, the relationships between housing density and the percentage of economically assisted citizens are more evident. In neighborhoods around the city center (11, 4–6), for example, housing density is high, while the percentage of economically assisted citizens is medium-low. Hilly neighborhoods (21 and 22) are, instead, characterized both by a low housing density and a low percentage of economically assisted citizens. In the same way, it is possible to see that there is a relationship between the aging index and the citizen’s economic resources; where the citizens are older (the aging index is high or medium-high), the percentage of citizens with low economic resources is low or medium-low (3, 4, 8–14, 22, 23). Regarding urban green areas, it is possible to see that the neighborhoods in the city center have the lowest percentages and that the quantity of green areas increases with increasing distance from the center.
3.5. Qualitative Evaluation Map of Turin Neighborhoods
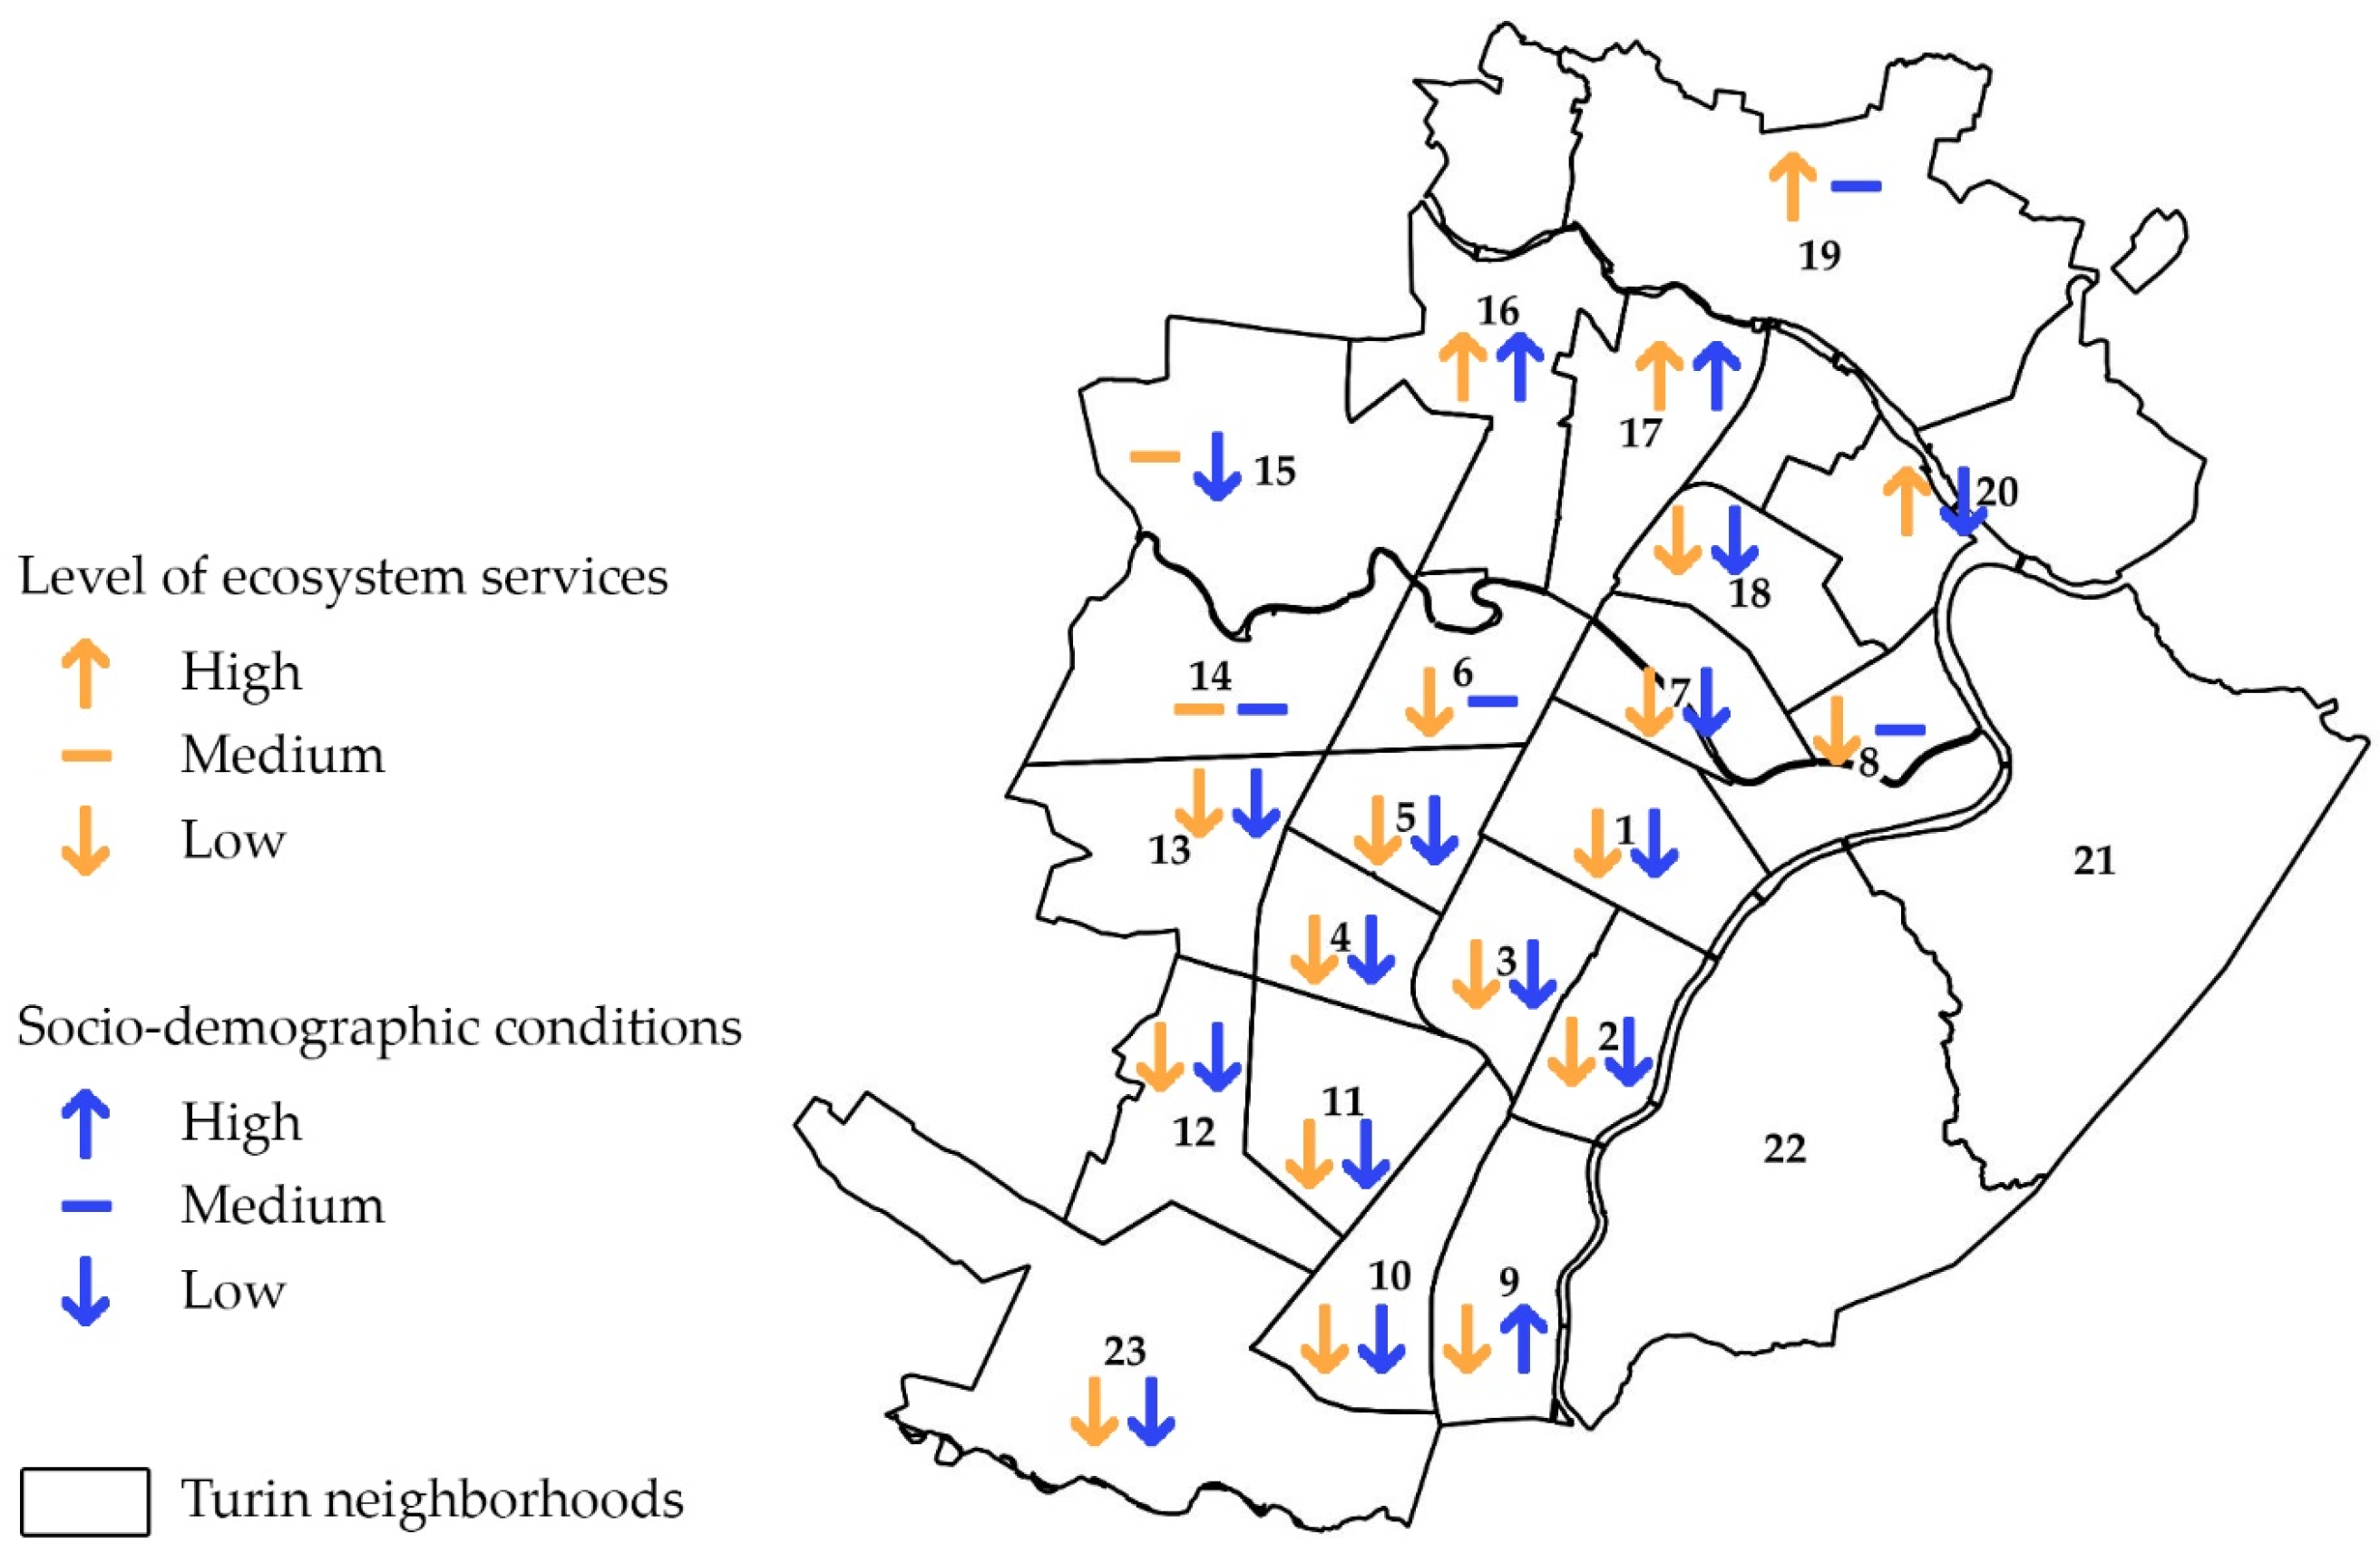
Figure 7 is the final qualitative evaluation map, that shows the level of ecosystem services and socio-demographic conditions (high, medium, and low) in each neighborhood. The results contribute to identifying neighborhoods where to improve the provision of ecosystem services and the socio-demographic conditions. Specifically, it can be observed that the northern part (16, 17, 19) of the city is characterized by better results than the central-southern part. This aspect is related to the conspicuous presence of agricultural land uses and water bodies, together with the presence of tree species with a high S-AQI values and high or medium socio-demographic conditions. 57% of neighborhoods present low results for the both aspects. The actions to improve the quality of green spaces in those neighborhoods could have great effects on liveability. Otherwise, the same actions in neighborhoods where socio-demographic conditions are medium or high (6, 8, and 9) would be less effective.
It should also be pointed out that the historical city center is characterized by low values, but it would provide high cultural services, not considered in the research.
4. Discussions and Conclusions
Since ecosystem services is an anthropocentric concept [78], the socio-demographic component must be considered in the drafting of a management plan or in the city’s future planning activities. This is why the proposed methodology considered socio-demographic characteristics, albeit partially, together with the ES provided by the land uses and the urban greening, specifically the trees, of the city of Turin.
Braveman et al. in 2005 [79] indicated that more research is needed on the relationship between health and the characteristics of both individuals and their neighborhood. In particular, urban green areas are beneficial for human health [80], especially for the elderly [81] and for pregnant women of lower socioeconomic status [82]. Furthermore, at the urban level, the theme of the perception and attitude that citizens have towards green areas and trees is fundamental, especially for the design and management of new green areas. Although some specific studies have investigated the theme of the perception of safety in urban green areas [77] and the attitudes of professionals and nonprofessionals towards urban trees [83], more studies should focus on the management and aesthetic perception of urban green areas emphasizing the difference in perception between different genders [84].
The aim of the research was to assess and map ecosystem services and socio-demographic characteristics in Turin neighborhoods in order to identify where (greening) actions are needed to improve the provision of ecosystem services and/or the socio-demographic conditions.
The proposed qualitative methodology is a combination of different methods, applied at the neighborhood scale. The neighborhood scale is useful from both an environmental and a social point of view [81,82].
The research results show that intervention priorities should be addressed in several neighborhoods, mainly located in the central-southern part of the city. This means that more than 50% of the city strongly needs actions (such as increasing the number and surfaces of urban green areas, as well as trees, based on S-AQI values) to improve human well-being through the provision of ecosystem services. The proposed methodology allows deepening the specific situation of each neighborhood, individually analyzing each method and index used. Therefore, it will be possible to identify the actions (a change in land use or a selected choice of trees in the neighborhood) to be adopted or policy to protect the most efficient individuals of trees (e.g., ancient or the biggest trees) and define the economic resources needed to achieve the objective.
Specifically, interventions at the neighborhood level should be based on the results of the scientific methods used for the assessment of provisioning and regulating services, PAM, and S-AQI.
Regarding PAM, the Urban Atlas map was integrated with information from maps provided by Turin Municipality, improving the quality of the information analyzed, reducing the limit of the method [56]. It is also possible to make comparisons with other cities where the method of ecosystem services assess was applied, such as Poznań [56]. Specifically, it is possible to highlight how Poznań and Turin have a common feature, namely that the first city is the green belt of the Ruhr area, while Turin is characterized and surrounded by the ‘Green Crown’, a network of green areas enhanced and protected, by the Piedmont Region. The ecosystem services analyzed are, therefore, greater in the peripheral areas of the two cities than in the central area. However, among the limits of the study, it is highlighted that the quality of land uses was not considered.
Regarding the S-AQI, it considers numerous aspects related to well-being (i.e., allergenicity) and some parameters such as species tolerance to pests and diseases, drought tolerance, and O3 sensitivity, which are fundamental at the level of tree management. Among the limits of the study, it is necessary to point out that S-AQI does not consider the age and size of trees [68], even though these aspects have a great influence on the provision of ecosystem services. The highest weighted average values of the S-AQI per neighborhood, do not correspond to the neighborhoods that have the highest value of species richness. However, a study shows that as species diversity increases, so does human well-being [6]. It may be useful to increase the value of biodiversity when designing new green areas or to restore existing ones, but choosing among plants that also provide an advantage in terms of reducing air pollution. Globally, cities are experimenting with different ways to increase and support tree species richness, thanks to environmental and land cover heterogeneity and socioeconomic factors, in order to deliver ecosystem stability and services [85].
New tree species, after assessing allergenic potentials and stress tolerances [86], could be planted in residential greenery, which has a high renaturation potential, creating new urban realms for urban biodiversity and resilient neighborhoods [87]. Moreover, since many trees of the avenues of Turin are becoming mature, it is possible in the future to replace them, using species suitable for urban conditions, useful to reduce air pollution, allergenicity, and adaptability to the conditions dictated by climate change.
However, a complete and updated census of urban greening is mandatory for planning and managing green areas. The management of urban green areas is essential because there is a close relationship between trees and human health. Specifically, Donovan et al. in 2013 [88] have shown that loss of trees to the emerald ash borer, increased mortality related to cardiovascular and lower-respiratory-tract illness, especially in Counties with above-average median household income.
In addition, our research focused on trees, but it would be interesting to deepen the studies on the role that shrubs play in urban increasing human well-being [89].
The methodology does not presume to be exhaustive from a social point of view, but unlike other methods, explicitly includes this concept in order to identify where there is a greater need for green actions in order to increase the provision of ecosystem services where the socio-demographic indices used to indicate a worse situation. However, a comprehensive database of the socioeconomic characteristics of the people living in the city is needed in order to compare the social demand with the available resources, and plan the development of the city accordingly.
Additional socioeconomic and ecological indicators may be added to the proposed methodology, incorporating local perceptions, and the valuation of other ecosystem services. It is necessary to consider that to preserve the biodiversity of urban green areas, the collaboration of different stakeholders is necessary in order to engage in interdisciplinary research and debate the management, design, and planning of urban biodiversity [7].
Future management and planning strategies for increasing citizens’ well-being should consider the results and the methodology proposed, with the aims of improving the supply of ecosystem services in the city and the preservation of urban biodiversity.
Supplementary Materials
The following are available online at https://0-www-mdpi-com.brum.beds.ac.uk/1999-4907/11/1/25/s1. Table S1: Classes of Provisioning and Regulating Services (according to CICES, v.5.1 [38]) selected for a preliminary assessment in urban landscapes. Modified by [36]. Table S2: Calculation of the number of priority and significant potential UES values and the potential overall ES supply of each land cover unit [36]. P—Priority; S—Significant; I—Insignificant; N—Non-relevant. Table S3: Classification of areas with provisioning and regulating ecosystem services [36]. Table S4: Species, Total number, Species-Specific Air Quality Index (S-AQI) values, and ranking values of trees (modified by [49]) in the City of Turin. Data modified by Albera.TO of March 2019. Table S5: Assigned values to each neighborhood for the following parameters: (A) Ageing index; (B) Housing density; (C) Economically assisted citizens; (D) Provisioning and Regulating Services; (E) S-AQI index.
Author Contributions
Conceptualization—L.B. and F.L.; methodology—L.B.; software—E.P. and L.B.; validation—L.B., E.P. and F.L.; formal analysis—L.B.; investigation—L.B. and E.P.; data curation—L.B. and E.P.; writing—original draft preparation—L.B., E.P. and F.L.; supervision, F.L. All authors have read and agreed to the published version of the manuscript.
Funding
L.B. received a Ph.D. grant from the Italian Ministry of Education, University and Research (MIUR).
Acknowledgments
We are grateful to the Green Office of the Municipality of Turin for the data and suggestions provided.
Conflicts of Interest
The authors declare no conflict of interest.
References
- Luederitz, C.; Brink, E.; Gralla, F.; Hermelingmeier, V.; Meyer, M.; Niven, L.; Panzer, L.; Partelow, S.; Rau, A.L.; Sasaki, R.; et al. A review of urban ecosystem services: Six key challenges for future research. Ecosyst. Serv. 2015, 14, 98–112. [Google Scholar] [CrossRef] [Green Version]
- United Nations. 2018. Available online: https://population.un.org/wup/Publications/Files/WUP2018-Methodology.pdf (accessed on 14 April 2019).
- Kabisch, N. Ecosystem service implementation and governance challenges in urban green space planning—The case of Berlin, Germany. Land Use Policy 2015, 42, 557–567. [Google Scholar] [CrossRef]
- Gómez-Baggethun, E.; Barton, D.N. Classifying and valuing ecosystem services for urban planning. Ecol. Econ. 2013, 86, 235–245. [Google Scholar] [CrossRef]
- European Commission. 2011. Available online: https://ec.europa.eu/environment/nature/biodiversity/comm2006/pdf/EP_resolution_april2012.pdf (accessed on 12 June 2019).
- Carrus, G.; Scopelliti, M.; Lafortezza, R.; Colangelo, G.; Ferrini, F.; Salbitano, F.; Agrimi, M.; Portoghesi, L.; Semenzato, P.; Sanesi, G. Go greener, feel better? The positive effects of biodiversity on the well-being of individuals visiting urban and peri-urban green areas. Landsc. Urban Plan. 2015, 134, 221–228. [Google Scholar] [CrossRef]
- Aronson, M.F.J.; Lepczyk, C.A.; Evans, K.L.; Goddard, M.A.; Lerman, S.B.; Maclvor, J.S.; Nilon, C.H.; Vargo, T. Biodiversity in the city: Key challenges for urban green space management. Front. Ecol. Environ. 2017, 15, 189–196. [Google Scholar] [CrossRef] [Green Version]
- Mitchell, R.; Popham, F. Effect of exposure to natural environment on health inequalities: An observational population study. Lancet Digit. Health 2008, 372, 1655–1660. [Google Scholar] [CrossRef] [Green Version]
- Haaland, C.; Konijnendijk van den Bosch, C. Challenges and strategies for urban green-space planning in cities undergoing densification: A review. Urban For. Urban Green. 2015, 14, 760–771. [Google Scholar] [CrossRef]
- Kopperoinen, L.; Itkonen, P.; Niemelä, J. Using expert knowledge in combining green infrastructure and ecosystem services in land use planning: An insight into a new place-based methodology. Landsc. Ecol. 2014, 29, 1361–1375. [Google Scholar] [CrossRef]
- Dunford, R.; Harrison, P.; Smith, A.; Dick, J.; Barton, D.N.; Martin-Lopez, B.; Kelemen, E.; Jacobs, S.; Saarikoski, H.; Turkelboom, F.; et al. Integrating methods for ecosystem service assessment: Experiences from real world situations. Ecosyst. Serv. 2018, 29, 499–514. [Google Scholar] [CrossRef]
- Vihervaara, P.; Viinikka, A.; Brander, L.; Santos-Martín, F.; Poikolainen, L.; Nedkov, S. Methodological interlinkages for mapping ecosystem services—From data to analysis and decision-support. One Ecosyst. 2019, 4, e26368. [Google Scholar] [CrossRef] [Green Version]
- Peña, L.; Onaindia, M.; Fernández de Manuel, B.; Ametzaga-Arregi, I.; Casado-Arzuaga, I. Analysing the synergies and trade-offs between ecosystem services to reorient land use planning in metropolitan Bilbao (Northern Spain). Sustainability 2018, 10, 4376. [Google Scholar] [CrossRef] [Green Version]
- Cortinovis, C.; Zulian, G.; Geneletti, D. Assessing nature-based recreation to support urban green infrastructure planning in Trento (Italy). Land 2018, 7, 112. [Google Scholar] [CrossRef] [Green Version]
- Arnold, J.; Kleemann, J.; Fürst, C. A differentiated spatial assessment of urban ecosystem services based on land use data in Halle, Germany. Land 2018, 7, 101. [Google Scholar] [CrossRef]
- Giedych, R.; Maksymiuk, G. Specific features of parks and their impact on regulation and cultural ecosystem services provision in Warsaw, Poland. Sustainability 2017, 9, 792. [Google Scholar] [CrossRef] [Green Version]
- Odom Green, O.; Garmestani, A.S.; Albro, S.; Ban, N.C.; Berland, A.; Burkman, C.E.; Gardiner, M.M.; Gunderson, L.; Hopton, M.E.; Schoon, M.L.; et al. Adaptive governance to promote ecosystem services in urban green spaces. Urban Ecosyst. 2015, 19, 77–93. [Google Scholar] [CrossRef]
- Conway, T.M.; Almas, A.D.; Coore, D. Ecosystem services, ecological integrity, and native species planting: How to balance these ideas in urban forest management? Urban For. Urban Green. 2019, 41, 1–5. [Google Scholar] [CrossRef]
- Bolund, P.; Hunhammar, S. Ecosystem services in urban areas. Ecol. Econ. 1999, 29, 293–301. [Google Scholar] [CrossRef]
- Grafius, D.R.; Corstanje, R.; Harris, J.A. Linking ecosystem services, urban form and green space configuration using multivariate landscape metric analysis. Landscape Ecol 2018, 33, 557–573. [Google Scholar] [CrossRef] [Green Version]
- Derkzen, M.L.; van Teeffelen, A.J.A.; Verburg, P.H. Quantifying urban ecosystem services based on high-resolution data of urban green space: An assessment for Rotterdam, the Netherlands. J. Appl. Ecol. 2015, 52, 1020–1032. [Google Scholar] [CrossRef]
- Säumel, I.; Weber, F.; Kowarik, I. Toward livable and healthy urban streets: Roadside vegetation provides ecosystem services where people live and move. Environ. Sci. Policy 2016, 62, 24–33. [Google Scholar] [CrossRef]
- Tyrväinen, L.; Pauleit, S.; Seeland, K.; de Vries, S. Benefits and uses of urban forests and trees. In Urban Forests and Trees; Konijnendijk, C., Nilsson, K., Randrup, T., Schipperijn, J., Eds.; Springer: Berlin/Heidelberg, Germany, 2005; pp. 81–114. [Google Scholar]
- Livesley, S.J.; McPherson, G.M.; Calfapietra, C. The urban forest and ecosystem services: Impacts on urban water, heat, and pollution cycles at the tree, street, and city scale. J. Environ. Qual. 2016, 45, 119–124. [Google Scholar] [CrossRef] [PubMed]
- Salmond, J.A.; Tadaki, M.; Vardoulakis, S.; Arbuthnott, K.; Coutts, A.; Demuzere, M.; Dirks, K.N.; Heaviside, C.; Lim, S.; Macintyre, H.; et al. Health and climate related ecosystem services provided by street trees in the urban environment. Environ. Health 2016, 15, 95–111. [Google Scholar] [CrossRef] [PubMed] [Green Version]
- Davies, H.J.; Doick, K.J.; Hudson, M.D.; Schreckenberg, K. Challenges for tree officers to enhance the provision of regulating ecosystem services from urban forests. Environ. Res. 2017, 156, 97–107. [Google Scholar] [CrossRef] [Green Version]
- Obersteiner, A.; Gilles, S.; Frank, U.; Beck, I.; Häring, F.; Ernst, D.; Rothballer, M.; Hartmann, A.; Traidl-Hoffmann, C.; Schmid, M. Pollen-associated microbiome correlates with pollution parameters and the allergenicity of pollen. PLoS ONE 2016, 11, e0149545. [Google Scholar] [CrossRef] [Green Version]
- Li, Z.; Xu, X.; Thompson, L.A.; Gross, H.E.; Shenkman, E.A.; DeWalt, D.A.; Huang, I.-C. Longitudinal effect of ambient air pollution and pollen exposure on asthma control: The patient-reported outcomes measurement information system (PROMIS) pediatric asthma study. Acad. Pediatrics 2019, 19, 615–623. [Google Scholar] [CrossRef]
- IUCN—Tools for Measuring, Modelling, and Valuing Ecosystem Services. 2018. Available online: https://portals.iucn.org/library/sites/library/files/documents/PAG-028-En.pdf (accessed on 20 November 2019).
- Janhäll, S. Review on urban vegetation and particle air pollution—Deposition and dispersion. Atmos. Environ. 2015, 105, 130–137. [Google Scholar] [CrossRef]
- Grote, R.; Samson, R.; Alonso, R.; Amorim, J.H.; Cariñanos, P.; Churkina, G.; Fares, S.; Thiec, D.L.; Niinemets, Ü.; Mikkelsen, T.N.; et al. Functional traits of urban trees: Air pollution mitigation potential. Front. Ecol. Environ. 2016, 14, 543–550. [Google Scholar] [CrossRef]
- FAO—Guidelines on Urban and Peri-Urban Forestry. 2016. Available online: http://www.fao.org/forestry/urbanforestry/87034/en/ (accessed on 20 November 2019).
- WHO—Health as the Pulse of the New Urban Agenda. 2016. Available online: https://www.who.int/phe/publications/urban-health/en/ (accessed on 20 November 2019).
- Tree Cities of the World—Tree Cities of the World Programme. 2019. Available online: https://treecitiesoftheworld.org/ (accessed on 20 November 2019).
- Gibbons, K.H.; Ryan, C.M. Characterizing comprehensiveness of urban forest management plans in Washington State. Urban For. Urban Green. 2015, 14, 615–624. [Google Scholar] [CrossRef]
- Birke, M.; Rauch, U.; Hofmann, F. Tree bark as a bioindicator of air pollution in the city of Stassfurt, Saxony-Anhalt, Germany. J. Geochem. Explor. 2018, 187, 97–117. [Google Scholar] [CrossRef]
- Achakzai, K.; Khalid, S.; Adrees, M.; Bibi, A.; Ali, S.; Nawaz, R.; Rizwan, M. Air pollution tolerance index of plants around brick kilns in Rawalpindi, Pakistan. J. Environ. Manag. 2017, 190, 252–258. [Google Scholar] [CrossRef]
- Locosselli, G.M.; de Camargo, E.P.; Moreira, T.C.L.; Todesco, E.; de Fátima Andrade, M.; de André, C.D.S.; de André, P.A.; Singer, J.M.; Schwandner Ferreira, L.; Nascimento Saldiva, P.H.; et al. The role of air pollution and climate on the growth of urban trees. Sci. Total Environ. 2019, 666, 652–661. [Google Scholar] [CrossRef] [PubMed]
- Pace, R.; Biber, P.; Pretzsch, H.; Grote, R. Modeling ecosystem services for park trees: Sensitivity of i-tree eco simulations to light exposure and tree species classification. Forests 2018, 9, 89. [Google Scholar] [CrossRef] [Green Version]
- Nowak, D.J.; Crane, D.E.; Stevens, J.C. Air pollution removal by urban trees and shrubs in the United States. Urban For. Urban Green. 2006, 4, 115–123. [Google Scholar] [CrossRef]
- Nayak, D.; Patel, D.P.; Thakare, H.S.; Satashiya, K.; Shrivastava, P.K. Evaluation of air pollution tolerance index of trees. Res. J. Chem. Environ. Sci. 2015, 8, 7–10. [Google Scholar]
- Ministero Dell’ambiente e Della Tutela del Territorio e del Mare. 2018. Available online: https://www.minambiente.it/sites/default/files/archivio/allegati/comitato%20verde%20pubblico/strategia_verde_urbano.pdf (accessed on 6 March 2019).
- Conference of the Parties (COP 21), United Nations. 2015. Available online: https://unfccc.int/process-and-meetings/conferences/past-conferences/paris-climate-change-conference-november-2015/cop-21 (accessed on 13 June 2019).
- Wang, H.F.; Qureshi, S.; Qureshi, B.A.; Qiu, J.X.; Friedman, C.R.; Breuste, J.; Wang, X.K. A multivariate analysis integrating ecological, socioeconomic and physical characteristics to investigate urban forest cover and plant diversity in Beijing, China. Ecol. Indic. 2016, 60, 921–929. [Google Scholar] [CrossRef]
- ISTAT (2018). Available online: http://demo.istat.it/bilmens2018gen/index.html (accessed on 31 May 2019).
- European Environmental Agency—Copernicus Land Monitoring Service. 2018. Available online: https://www.eea.europa.eu/data-and-maps/data/copernicus-land-monitoring-service-urban-atlas (accessed on 14 April 2019).
- Regione Piemonte. 2019. Available online: http://relazione.ambiente.piemonte.it/2019/it/aria/stato/pm10 (accessed on 14 April 2019).
- Migliaretti, G.; Dalmasso, P.; Gregori, D. Air pollution effects on the respiratory health of the resident adult population in Turin, Italy. Int. J. Environ. Health Res. 2007, 17, 369–379. [Google Scholar] [CrossRef] [PubMed]
- Romanazzi, V.; Casazza, M.; Malandrino, M.; Maurino, V.; Piano, A.; Schilirò, T.; Gilli, G. PM10 size distribution of metals and environmental-sanitary risk analysis in the city of Torino. Chemosphere 2014, 112, 210–216. [Google Scholar] [CrossRef] [Green Version]
- Bono, R.; Romanazzi, V.; Bellisario, V.; Tassinari, R.; Trucco, G.; Urbino, A.; Cassardo, C.; Siniscalco, C.; Marchetti, P.; Marcon, A. Air pollution, aeroallergens and admissions to pediatric emergency room for respiratory reasons in Turin, northwestern Italy. BMC Public Health 2016, 16, 722. [Google Scholar] [CrossRef] [Green Version]
- Albera.TO. Available online: http://www.comune.torino.it/verdepubblico/2016/alberi16/nasce-alberato-applicativo-gestione-patrimonio-arboreo.shtml (accessed on 04 March 2019).
- Comune di Torino—Verde Storico. Available online: http://www.comune.torino.it/verdepubblico/patrimonioverde/verdeto/storia.shtml (accessed on 04 March 2019).
- Giorgio Rota Report. 2015. Available online: www.rapporto-rota.it (accessed on 6 June 2019).
- Burkhard, B.; Kroll, F.; Müller, F.; Windhorst, W. Landscapes’ capacities to provide ecosystem services—A concept for land-cover based assessments. Landsc. Online 2009, 15, 1–22. [Google Scholar] [CrossRef]
- Burkhard, B.; Kandziora, M.; Hou, Y.; Müller, F. Ecosystem service potentials, flows and demands-concepts for spatial localisation, indication and quantification. Landsc. Online 2014, 34, 1–32. [Google Scholar] [CrossRef]
- Zepp, H.; Mizgajski, A.; Mess, C.; Zwierzchowska, I. A preliminary assessment of urban ecosystem services in central European urban areas. A methodological outline with examples from Bochum (Germany) and Poznań (Poland). Ber. Geogr. Landeskd. 2016, 90, 67–84. [Google Scholar]
- Urban Atlas. Available online: https://land.copernicus.eu/local/urban-atlas (accessed on 14 April 2019).
- Common International Classification of Ecosystem Services (CICES) v.5.1. Available online: https://cices.eu/ (accessed on 15 April 2019).
- Yang, J.; McBride, J.; Zhou, J.; Sun, Z. The urban forest in Beijing and its role in air pollution reduction. Urban For. Urban Green. 2005, 3, 65–78. [Google Scholar] [CrossRef]
- Manes, F.; Marando, F.; Capotorti, G.; Blasi, C.; Salvatori, E.; Fusaro, L.; Ciancarella, L.; Mircea, M.; Marchetti, M.; Chirici, G.; et al. Regulating ecosystem services of forests in ten Italian metropolitan cities: Air quality improvement by PM 10 and O 3 removal. Ecol. Indic. 2016, 67, 425–440. [Google Scholar] [CrossRef]
- Borbet, T.C.; Gladson, L.A.; Cromar, K.R. Assessing air quality index awareness and use in Mexico City. BMC Public Health 2018, 18, 538. [Google Scholar] [CrossRef] [Green Version]
- Chen, H.; Li, Q.; Kaufman, J.S.; Wang, J.; Copes, R.; Su, Y.; Benmarhnia, T. Effect of air quality alerts on human health: A regression discontinuity analysis in Toronto, Canada. Lancet Planet. Health 2018, 2, e19–e26. [Google Scholar] [CrossRef] [Green Version]
- Kyrkilis, G.; Chaloulakou, A.; Kassomenos, P.A. Development of an aggregate air quality index for an urban Mediterranean agglomeration: Relation to potential health effects. Environ. Int. 2007, 33, 670–676. [Google Scholar] [CrossRef]
- Cheng, W.-L.; Chen, Y.-S.; Zhang, J.; Lyons, T.J.; Pai, J.-L.; Chang, S.-H. Comparison of the revised air quality index with the PSI and AQI indices. Sci. Total Environ. 2007, 382, 191–198. [Google Scholar] [CrossRef]
- Murena, F. Measuring air quality over large urban areas: Development and application of an air pollution index at the urban area of Naples. Atmos. Environ. 2004, 38, 6195–6202. [Google Scholar] [CrossRef]
- Zhan, D.; Kwan, M.-P.; Zhang, W.; Yu, X.; Meng, B.; Liu, Q. The driving factors of air quality index in China. J. Clean. Prod. 2018, 197, 1342–1351. [Google Scholar] [CrossRef]
- Güçlü, Y.S.; Dabanlı, I.; Şişman, E.; Şen, Z. Air quality (AQ) identification by innovative trend diagram and AQ index combinations in Istanbul megacity. Atmos. Pollut. Res. 2019, 10, 88–96. [Google Scholar] [CrossRef]
- Sicard, P.; Agathokleous, E.; Araminiene, V.; Carrari, E.; Hoshika, Y.; De Marco, A.; Paoletti, E. Should we see urban trees as effective solutions to reduce increasing ozone levels in cities? Environ. Pollut. 2018, 243, 163–176. [Google Scholar] [CrossRef] [PubMed]
- Governo Italiano—Presidenza del Consiglio dei Ministri—Urban Index. Available online: https://www.urbanindex.it/indicatori/indice-di-vecchiaia/ (accessed on 15 April 2019).
- ISPRA—Stato Dell’ambiente. 2017. Available online: http://www.isprambiente.gov.it/files2017/pubblicazioni/stato-ambiente/rau-2017/1_Fattori%20sociali%20ed%20economici.pdf (accessed on 15 April 2019).
- Regione Piemonte—40 Anni di Salute a Torino. 2017. Available online: http://www.epiprev.it/materiali/2017/Torino_40_anni/40anni_singole.pdf (accessed on 15 April 2019).
- Groenewegen, P.P.; van den Berg, A.E.; de Vries, S.; Verheij, R.A. Vitamin G: Effects of green space on health, well-being, and social safety. BMC Public Health 2006, 6, 149. [Google Scholar] [CrossRef] [PubMed] [Green Version]
- Bertram, C.; Rehdanz, K. The role of urban green space for human well-being. Ecol. Econ. 2015, 120, 139–152. [Google Scholar] [CrossRef] [Green Version]
- Russo, A.; Escobedo, F.J.; Zerbe, S. Quantifying the local-scale ecosystem services provided by urban treed streetscapes in Bolzano, Italy. AIMS Environ. Sci. 2016, 3, 58–76. [Google Scholar] [CrossRef]
- Richards, D.R.; Edwards, P.J. Quantifying street tree regulating ecosystem services using Google Street View. Ecol. Indic. 2017, 77, 31–40. [Google Scholar] [CrossRef]
- Suchocka, M.; Kosiacka-Beck, E.; Niewiarowska, A. Horticultural therapy as a tool of healing persons with disability on an example of support centre in Kownaty. Ecol. Quest. 2019, 30, 7–18. [Google Scholar] [CrossRef]
- Lis, A.; Pardela, Ł.; Iwankowski, P. Impact of vegetation on perceived safety and preference in city parks. Sustainability 2019, 11, 6324. [Google Scholar] [CrossRef] [Green Version]
- Hunter, M.L.; Redford, K.H.; Lindenmayer, D.B. The complementary niches of anthropocentric and biocentric conservationists. Conserv. Biol. 2014, 28, 641–645. [Google Scholar] [CrossRef]
- Braveman, P.A.; Cubbin, C.; Egerter, S.; Chideya, S.; Marchi, K.S.; Metzler, M.; Posner, S. Socioeconomic status in health research: One size does not fit all. JAMA 2005, 294, 2879–2889. [Google Scholar] [CrossRef]
- Maas, J. Green space, urbanity, and health: How strong is the relation? J. Epidemiol. Community Health 2006, 60, 587–592. [Google Scholar] [CrossRef] [Green Version]
- Artmann, M. The role of urban green spaces in care facilities for elderly people across European cities. Urban For. Urban Green. 2017, 27, 203–213. [Google Scholar] [CrossRef]
- Dadvand, P.; Wright, J.; Martinez, D.; Basagaña, X.; McEachan, R.R.C.; Cirach, M.; Gidlow, C.J.; de Hoogh, K.; Gra, R. Inequality, green spaces, and pregnant women: Roles of ethnicity and individual and neighbourhood socioeconomic status. Environ. Int. 2014, 71, 101–108. [Google Scholar] [CrossRef] [PubMed]
- Suchocka, M.; Jankowski, P.; Błaszczyk, M. Perception of urban trees by polish tree professionals vs. nonprofessionals. Sustainability 2019, 11, 211. [Google Scholar] [CrossRef] [Green Version]
- Battisti, L.; Corsini, F.; Gusmerotti, N.M.; Larcher, F. Management and perception of metropolitan natura 2000 sites: A case study of La Mandria Park (Turin, Italy). Sustainability 2019, 11, 6169. [Google Scholar] [CrossRef] [Green Version]
- Morgenroth, J. Urban tree diversity—Taking stock and looking ahead. Urban For. Urban Green. 2016, 15, 1–5. [Google Scholar] [CrossRef] [Green Version]
- Sjöman, H. Diversity and distribution of the urban tree population in ten major Nordic cities. Urban For. Urban Green. 2012, 11, 31–39. [Google Scholar] [CrossRef] [Green Version]
- Battisti, L.; Pille, L.; Wachtel, T.; Larcher, F.; Säumel, I. Residential greenery: State of the art and health-related ecosystem services and disservices in the city of Berlin. Sustainability 2019, 11, 1815. [Google Scholar] [CrossRef] [Green Version]
- Donovan, G.H.; Butry, D.T.; Michael, Y.L.; Prestemon, J.P.; Liebhold, A.M.; Gatziolis, D.; Mao, M.Y. The relationship between trees and human health: Evidence from the spread of the emerald ash borer. Am. J. Prev. Med. 2013, 44, 139–145. [Google Scholar] [CrossRef]
- Blanusa, T. Urban hedges: A review of plant species and cultivars for ecosystem service delivery in north-west Europe. Urban For. Urban Green. 2019, 44, 126391. [Google Scholar] [CrossRef]
Figure 1.
Land-use classes in Turin neighborhoods.

Figure 2.
Methodological framework of the research.

Figure 3.
Provisioning and regulating services obtained by the Preliminary Assessment Method. Urban Ecosystem Services (UES) significance: 1st class: >7.5; 2nd class: ≤7.5, >3.0; 3rd class: ≤3.0, >0.5; no significance: ≤0.5.
Figure 3.
Provisioning and regulating services obtained by the Preliminary Assessment Method. Urban Ecosystem Services (UES) significance: 1st class: >7.5; 2nd class: ≤7.5, >3.0; 3rd class: ≤3.0, >0.5; no significance: ≤0.5.

Figure 4.
Trees present on Albera.To system classified by their S-AQI values.

Figure 5.
(A) Average values of the Provisioning and Regulating services of Turin neighborhoods—PAM; (B) Average values of S-AQI at the neighborhood scale; for neighborhoods 21 and 22 data are not available.
Figure 5.
(A) Average values of the Provisioning and Regulating services of Turin neighborhoods—PAM; (B) Average values of S-AQI at the neighborhood scale; for neighborhoods 21 and 22 data are not available.

Figure 6.
Socio-demographic characteristics of the neighborhoods’ (A) Aging index; (B) Housing density; (C) Economically assisted citizens.
Figure 6.
Socio-demographic characteristics of the neighborhoods’ (A) Aging index; (B) Housing density; (C) Economically assisted citizens.

Figure 7.
Qualitative evaluation (high, medium, low) map of Turin neighborhoods, according to ecosystem services levels and socio-demographic conditions. For neighborhoods 21 and 22 data are not available.
Figure 7.
Qualitative evaluation (high, medium, low) map of Turin neighborhoods, according to ecosystem services levels and socio-demographic conditions. For neighborhoods 21 and 22 data are not available.


Table 1.
Applied formulas and classes’ subdivision for socio-demographic analyses at the neighborhood scale.
Table 1.
Applied formulas and classes’ subdivision for socio-demographic analyses at the neighborhood scale.
| Index | Formula | Unit of Measurement | Classes | |||
|---|---|---|---|---|---|---|
| Low | Medium-Low | Medium-High | High | |||
| Ageing index [69] 1 | - | ≤150 | 151–200 | 201–250 | >250 | |
| Housing density [70] 1 | Inhabitants/km2 | ≤3000 | 3001–9000 | 9001–15,000 | >15,000 | |
| Economically assisted citizens2 | % | ≤0.5 | 0.51–1 | 1.10–1.50 | >1.50 | |
P1: Population aged 65 years or over; P2: Population aged 14 years or less; P3: Total number of inhabitants; S: Neighborhood’s surface; P4: number of economically assisted citizens. 1 Data analyzed refer to 31 December 2018 and were provided by the Turin City’s Statistical Office. 2 Elaboration of data published on the Giorgio Rota Report. Data referred to 2015.
Table 2.
Assigned values to four classes where are grouped the socio-demographic characteristics and ecosystem services supply at the neighborhood level. (A) Aging index; (B) Housing density; (C) Economically assisted citizens; (D) Provisioning and Regulating Services; (E) S-AQI index.
Table 2.
Assigned values to four classes where are grouped the socio-demographic characteristics and ecosystem services supply at the neighborhood level. (A) Aging index; (B) Housing density; (C) Economically assisted citizens; (D) Provisioning and Regulating Services; (E) S-AQI index.
| A | B | C | D | E | |
|---|---|---|---|---|---|
| Low | 2 | 2 | 2 | −2 | −2 |
| Medium-low | 1 | 1 | 1 | −1 | −1 |
| Medium-high | −1 | −1 | −1 | 1 | 1 |
| High | −2 | −2 | −2 | 2 | 2 |
Table 3.
Area, number of trees per km2, and tree species richness of Turin neighborhoods.
| Neighborhoods | Area 1 (km2) | N° of Trees/km2 | Tree Species Richness |
|---|---|---|---|
| 1. Centro | 3.77 | 1051 | 75 |
| 2. San Salvario | 2.34 | 1222 | 81 |
| 3. Crocetta | 2.77 | 1417 | 42 |
| 4. San Paolo | 2.22 | 917 | 52 |
| 5. Cenisia | 2.33 | 1019 | 71 |
| 6. San Donato | 3.02 | 818 | 56 |
| 7. Aurora | 2.67 | 980 | 53 |
| 8. Vanchiglia | 3.38 | 965 | 59 |
| 9. Nizza Millefonti | 3.51 | 370 | 52 |
| 10. Mercati Generali | 3.46 | 883 | 70 |
| 11. Santa Rita | 3.57 | 1190 | 78 |
| 12. Mirafiori Nord | 3.79 | 1240 | 74 |
| 13. Pozzo Strada | 4.22 | 1112 | 73 |
| 14. Parella | 4.91 | 815 | 98 |
| 15. Le Vallette | 7.54 | 487 | 68 |
| 16. Madonna di Campagna | 7.40 | 282 | 81 |
| 17. Borgata Vittoria | 3.86 | 355 | 55 |
| 18. Barriera di Milano | 2.83 | 507 | 52 |
| 19. Falchera | 12.62 | 180 | 66 |
| 20. Regio Parco | 6.92 | 318 | 69 |
| 21. Madonna del Pilone | 15.5 | - | - |
| 22. Borgo Po e Cavoretto | 13.61 | - | - |
| 23. Mirafiori Sud | 11.44 | 451 | 77 |
1 The surfaces do not consider the areas occupied by rivers.
© 2019 by the authors. Licensee MDPI, Basel, Switzerland. This article is an open access article distributed under the terms and conditions of the Creative Commons Attribution (CC BY) license (http://creativecommons.org/licenses/by/4.0/).
Share and Cite
MDPI and ACS Style
Battisti, L.; Pomatto, E.; Larcher, F. Assessment and Mapping Green Areas Ecosystem Services and Socio-Demographic Characteristics in Turin Neighborhoods (Italy). Forests 2020, 11, 25. https://0-doi-org.brum.beds.ac.uk/10.3390/f11010025
AMA Style
Battisti L, Pomatto E, Larcher F. Assessment and Mapping Green Areas Ecosystem Services and Socio-Demographic Characteristics in Turin Neighborhoods (Italy). Forests. 2020; 11(1):25. https://0-doi-org.brum.beds.ac.uk/10.3390/f11010025
Chicago/Turabian StyleBattisti, Luca, Enrico Pomatto, and Federica Larcher. 2020. "Assessment and Mapping Green Areas Ecosystem Services and Socio-Demographic Characteristics in Turin Neighborhoods (Italy)" Forests 11, no. 1: 25. https://0-doi-org.brum.beds.ac.uk/10.3390/f11010025
Note that from the first issue of 2016, this journal uses article numbers instead of page numbers. See further details here.