Article

Does Ozone Alter the Attractiveness of Japanese White Birch Leaves to the Leaf Beetle Agelastica coerulea via Changes in Biogenic Volatile Organic Compounds (BVOCs): An Examination with the Y-Tube Test

1
Graduate School of Agriculture, Hokkaido University, Sapporo 060-8589, Japan
2
School of Food and Nutritional Sciences, University of Shizuoka, Shizuoka 422-8526, Japan
3
Research Faculty of Agriculture, Hokkaido University, Sapporo 060-8589, Japan
4
School of Applied Meteorology, Nanjing University of Information Science & Technology (NUIST), Nanjing 210044, China
*
Authors to whom correspondence should be addressed.
Submission received: 25 November 2019 / Revised: 29 December 2019 / Accepted: 30 December 2019 / Published: 2 January 2020
(This article belongs to the Special Issue Impacts of Ozone on Forest Plants and Ecosystems)

Abstract

:
Elevated ground-level ozone (O3) reduced C-based defense chemicals; however, severe grazing damages were found in leaves grown in the low O3 condition of a free air O3-concentration enrichment (O3-FACE) system. To explain this phenomenon, this study investigates the role of BVOCs (biogenic volatile organic compounds) as signaling compounds for insect herbivores. BVOCs act as scents for herbivore insects to locate host plants, while some BVOCs show high reactivity to O3, inducing changes in the composition of BVOCs in atmospheres with elevated O3. To assess the aforementioned phenomenon, profiles of BVOCs emitted from birch (Betula platyphylla var. japonica Hara) leaves were analyzed ex situ, and Y-tube insect preference tests were conducted in vitro to study the insect olfactory response. The assays were conducted in June and August or September, according to the life cycle of the adult alder leaf beetle Agelastica coerulea Baly (Coleoptera: Chrysomelidae). The Y-tube tests revealed that the leaf beetles were attracted to BVOCs, and O3 per se had neither an attractant nor a repellent effect. BVOCs became less attractant when mixed with highly concentrated O3 (>80 ppb). About 20% of the total BVOCs emitted were highly O3-reactive compounds, such as β-ocimene. The results suggest that BVOCs emitted from the birch leaves can be altered by elevated O3, thus potentially reducing the attractiveness of leaves to herbivorous insects searching for food.

1. Introduction

Ground-level ozone (O3) has been elevated in the last decades, especially in east Asia [1,2,3]. O3 is a strong oxidant at high concentrations, and can damage photosynthesis, growth, and development of plants [4,5]. O3 can also enhance the susceptibility of plants to insect herbivores and diseases, potentially disrupting the disease triangle [6,7]. Most carbon-based defense chemicals are synthesized from photosynthates; thus, plant defense capacity can be decreased by elevated O3 concentrations [8]. This is particularly important in rural and mountainous areas, where O3 levels are higher than in cities [9].
Damages by herbivores are responsible for losses of net primary production up to 15% in temperate forests [8]; however, herbivory can be altered by atmospheric contaminants. For example, we have previously found that insect herbivores systematically grazed leaves of different tree species in ambient O3 plots more than in elevated O3 plots of a free-air O3-concentration enrichment (FACE) system [10,11,12]. However, even if, in that situation, the leaves in the elevated O3 condition had lower chemical defense capacities [12,13], leaves from the elevated O3 conditions were often preferred by insects in choice laboratory assays [13]. The results of this array of studies suggest that the field observations for reduced herbivory in the elevated O3 plots were not because of changes in leaf chemical defense capacity or insect oviposition, hinting at a potential role of biogenic volatile organic compounds (BVOCs) in these observations.
Plants emit a variety of BVOCs, including many types, such as monoterpene (MT: C10H16), sesquiterpene (SQT: C15H24), and alcohol [14]. BVOCs have a biological role in plant–insect interactions, as herbivores and pollinators use BVOCs as chemical cues [15,16]. However, BVOCs emitted from plants are impacted by O3 [17,18]. BVOCs have reactivity with O3 [19,20] and decay after being emitted [16,21,22]. Previous research with Y-tube tests revealed that, while the striped cucumber beetle Acalymma vittatum F. (Coleoptera: Chrysomelidae) did not show any response to O3 per se, it less frequently selected BVOCs of flowers when the air was mixed with high O3 concentrations [23]. Fuentes et al. [23] concluded that the disruption of BVOCs because of reaction with O3 was responsible for the decreasing attractiveness of BVOCs to the beetles. The phenomenon that insects graze less in elevated O3 [11,13] was especially found in a system with alder leaf beetle Agelastica coerulea Baly (Coleoptera: Chrysomelidae) and Japanese white birch (Betula platyphylla var. japonica Hara; hereafter, white birch). Are the observations with striped cucumber beetle and BVOCs of cucumber flower applicable to the interaction between alder leaf beetle and white birch? If so, what kinds of BVOCs emitted from birch leaves do act as herbivore signals? Studying these questions is essential for understanding and predicting how plant–herbivore interactions may occur in an O3-polluted atmosphere; such influences remain underexplored in the literature.
To assess these questions, we investigated the changes in BVOCs under elevated O3 and how they potentially affect the grazing of the leaf beetle. To this end, Y-tube preference tests were conducted to elucidate the behavior of alder leaf beetles under elevated O3. We hypothesized that the adult leaf beetles would less frequently cvisit leaves when BVOCs are mixed with elevated O3 concentrations. To identify specific BVOCs emitted from white birch and understand the insect preference results, we also assessed the profile of BVOCs emitted from the birch leaves.

2. Materials and Methods

2.1. Plant Material

White birch, a common species in forests and often grown as boulevard in cities of Hokkaido in Japan [10,11,13], has heterophyllous leaves known as early and late leaves. Early leaves expand from the beginning of May, while late leaves start to develop after complete expansion of early leaves from around mid-July in northern Japan [24]. Therefore, most leaves after August are usually late leaves. This developmental pattern matches the life cycle of the oligophagous alder leaf beetle.
For olfactory response tests, branches of white birch were collected just before the tests from ambient plots of the FACE system at Sapporo experimental forest of Hokkaido University; the ambient O3 concentration was low [5]. Sampled trees were all five years old (averaged height: 5 m, averaged diameter at breast height: 3.5 cm), and sampled branches (all sampled from same height above ground, ≈2.5 m) included four or five leaves from the top of the shoot.
Five individuals of white birch were used for BVOCs collections. They were clone individuals, made by grafting from the same six-year old mother tree grown in the Sapporo experimental forest, grown in a greenhouse.

2.2. Insects

Adult alder leaf beetles, a major oligophagous pest of Betulaceae trees [25,26], were collected from white birch saplings grown in the ambient plots of the FACE system as plant material for olfactory response tests in spring (June, first generation) and summer (August–September, second generation), 2017.
The life cycle of this insect has been described previously [13]. The first generation of the insect corresponds to the period of the early leaves of white birch in June, whereas the second generation corresponds to the period of the late leaves of white birch in August or September. Although larvae of the leaf beetle graze leaves heavily in July, they cannot fly, and thus cannot move far from where they hatched. For this reason, larvae were not studied in the olfactory response tests.

2.3. Olfactory Response Test (Y-Tube Test)

Two-choice olfactory response tests (Figure 1) were conducted to evaluate the attractiveness of leaves in each atmospheric treatment with a Y-shaped glass olfactometer (inner diameter: 17 mm, arm length: 55 mm, stem length: 150 mm) in June and August of 2017. Considering the BVOC reaction with O3 in the field, a UV-transparent vinyl house was constructed, where Y-tube tests were conducted. The temperature in chambers was averaged as 34 °C at full sunshine and average photosynthetic photon flux density was around 940 µmol m−2s−1 during olfactory tests. The aeration flow rate into each arm was controlled at 0.5 L min−1 with an electric exhaust pump (APN-240MAN-1, Iwaki, Tokyo, Japan) and flowmeters (RK 1650, KOFLOC, Kyoto, Japan). O3 concentration was controlled with an O3 monitor (Model 202, 2B Technologies, Boulder, Colorado, USA) and an automatic three-way valve. Pure air was generated through the active charcoal [27] for the O3 elimination tank.
Leaf beetles were subjected to starving for at least one hour before the Y-tube tests began. At the beginning of each trial, one insect was placed in the mouth of tube stem, and then the mouth was capped with a net that allows air flow and works as a stopper for insects. The Y-tube was covered with a papery towel to block visual information that insects can receive from the outer experimental environment. The Y-tube was rotated 180° after every two trials to prevent directional biases caused by background conditions in the experimental room. Insects were observed for five minutes in each trial [23,28,29]. A choice was marked “decided” if insects crossed the halfway point of an arm of the Y-tube and visited one air flow more frequently, or if insects continuously stayed at one side for one minute within the trial time (five minutes). If insects did not cross the half point of the Y-tube at all, the choice was regarded as “no choice”, and the trial was discarded. The Y-tube olfactometer was cleaned with ethanol and dried every five trials. In this study, three groups of tests were conducted to reveal the air that insects prefer: (1) O3 versus cleaned air (CA), (2) CA versus BVOCs (emitted from leaves), and (3) BVOCs versus BVOCs mixed with O3 (BVOC + O3).
Test (1), which checks whether O3 per se induces an attractant/repellent effect to the adult leaf beetle, was conducted 20 times in total, while test (2) was conducted 30 times (the discarded trials owing to no choice are excluded from these counts). In each test, O3 concentration was set to 40, 80, or 120 ppb; 40 and 80 ppb were approximately the concentrations in control and elevated O3 plots, respectively, in the FACE system where the earlier observations were made [10,11,13], and 120 ppb was set to represent a more polluted atmosphere.

2.4. Sampling of BVOCs

BVOCs were sampled with a branch chamber method (Figure 2) with clone saplings of white birch in June and September 2018. Because the life cycle of the leaf beetle was delayed as a result of the cooler climate in the experimental year, the timing of sampling of BVOCs was matched with the life cycle of the insect. The saplings were moved to a laboratory with an air temperature of around 25 °C and a photosynthetic photon flux density of 200 µmol m−2s−1.
In this method, cleaned air was sent at a constant 3 L/min flow rate into a Teflon bag, where one shoot was covered. BVOCs emitted in the bag were sampled into sampling tube (Tenax TA, GL Science, Tokyo, Japan; Carbotrap, Supelco, Bellefonte, PA, USA) with inlet air pumps (MP-Σ30NII, SHIBATA, Tokyo, Japan) for 30 min and two samples were collected per individual. To calculate the emission rate, the temperature in the bag was observed with a recorder (TR-52i, T&D, Tokyo, Japan).

2.5. Gas Chromatograph Mass Spectrometer (GC-MS) Analyses

The sampling tube was mounted on an automated two-stage thermal desorber (Turbo Matrix ATD650, Perkin Elmer Instruments, Fremont, CA, USA), heated at 280 °C for 10 min, and then the BVOCs were desorbed and re-concentrated into a thin cold trap part and cooled at −20 °C. Thereafter, the cold trap part was heated rapidly to 280 °C for 10 s, and the desorbed BVOCs were introduced into a capillary column (SLBTM—5 ms; inner diameter 0.25 mm, length 60 m, thickness 0.5 µm, Supelco) settled in a gas chromatograph mass spectrometer (GCMS-QP2010, SHIMADZU, Japan). The column was maintained at 35 °C for 5 min and then heated to 250 °C at 5 °C min−1. After electron-impact ionization (EI-method), each compound was identified by scan analysis method (m/z: 40 to 400). Helium gas (>99.99995%) was used as carrier gas for the GC at a ratio of 1.0 mL min−1 and the split ratio was set to 1:22 with a one-stage splitting. An internal standardization method was applied using toluene-D8. Compounds, whose standard samples were available, were identified by matching with the retention time and mass spectrum of each standard value. If not, by searching the mass spectrum of each compound obtained from the EI-method in the database of the National Institute of Standards and Technology (NIST, U.S. Department of Commerce), a compound whose similarity matched best with the measured value of the EI-method was regarded as identified.
Calibration curves showing the relationship between the chromatogram area and the injection amount (nmol) were created from the analytical values of each standard sample with different concentrations, and the amounts of each compound in the BVOCs samples were quantified using these calibration curves. For compounds for which the calibration curves could not be created because of a lack of the standard samples, calibration curves of these compounds having the same or similar molecular weight were substituted.
Emission rate, E (nmol m−2s−1), was calculated based on Formula (1):
E = C s × V i n S ,
where Cs is the concentration (nmol mol−1) of each compound in the chamber, Vin is the inlet aeration rate, and S is the leaf area (m2) of samples emitting compounds. Leaf areas were analyzed using photo-editing software (Image J, National Institutes of Health, Bethesda, MD, USA) after scanning each leaf sample (EPSON GT-S630, Tokyo, Japan). Then, relative emission rates (%) of each compound or chemical group were calculated as the specific emission rate divided by the total emission rate and multiplied by 100. The result value as one individual was averaged with two samples.

2.6. Lifetime of BVOCs with O3

From BVOCs sampled in this study, we detected reactive compounds with O3. On the basis of the data of previous atmospheric chemistry studies [14,21,22], which show lifetimes of some compounds at 28.4 ppb O3, reaction rates with O3, and lifetimes at given O3 concentrations, could be calculated using Formulas (2), (3) [22], and (4):
[x]t = [x]t0 exp (−k2 [O3] t),
l i f e t i m e = 1 [ O 3 ] k 2 ,
molecules   cm 3 = ppb   × 1 22.41 × 273.15 273.15 + T × 6.02 × 10 11 ,
where [x]t0 and [x]t mean the amounts of a BVOC, at initial time and when given seconds have passed, respectively. Parameter k2 represents the reaction rate with O3, [O3] denotes the concentration in molecules cm−3, and T (25 °C) is the temperature in the room. Known (at 28.4 ppb O3) and theoretical lifetimes (at 80.0 ppb O3) of these compounds are shown in Table 1 (see the next page). In this paper, compounds whose lifetimes are calculated under an hour at 80 ppb O3 were defined as “O3-reactive-compounds”, and seven compounds, cis-/trans-β-ocimene, limonene, 2-carene, γ-terpinene, β-linalool, α-copaene, and β-caryophyllene, were detected.

2.7. Statistical Analysis

Data of emission rate and ratio of each compound were tested for significant differences (α = 0.05) with individual t test between seasons (early and late leaves), which was Student’s or Welch’s t-test, according to each test for homogeneity of variance. Data of olfactory response tests were analyzed with a binominal test between treatments (α = 0.05). All statistical analyses were operated using Excel 2016.

3. Results

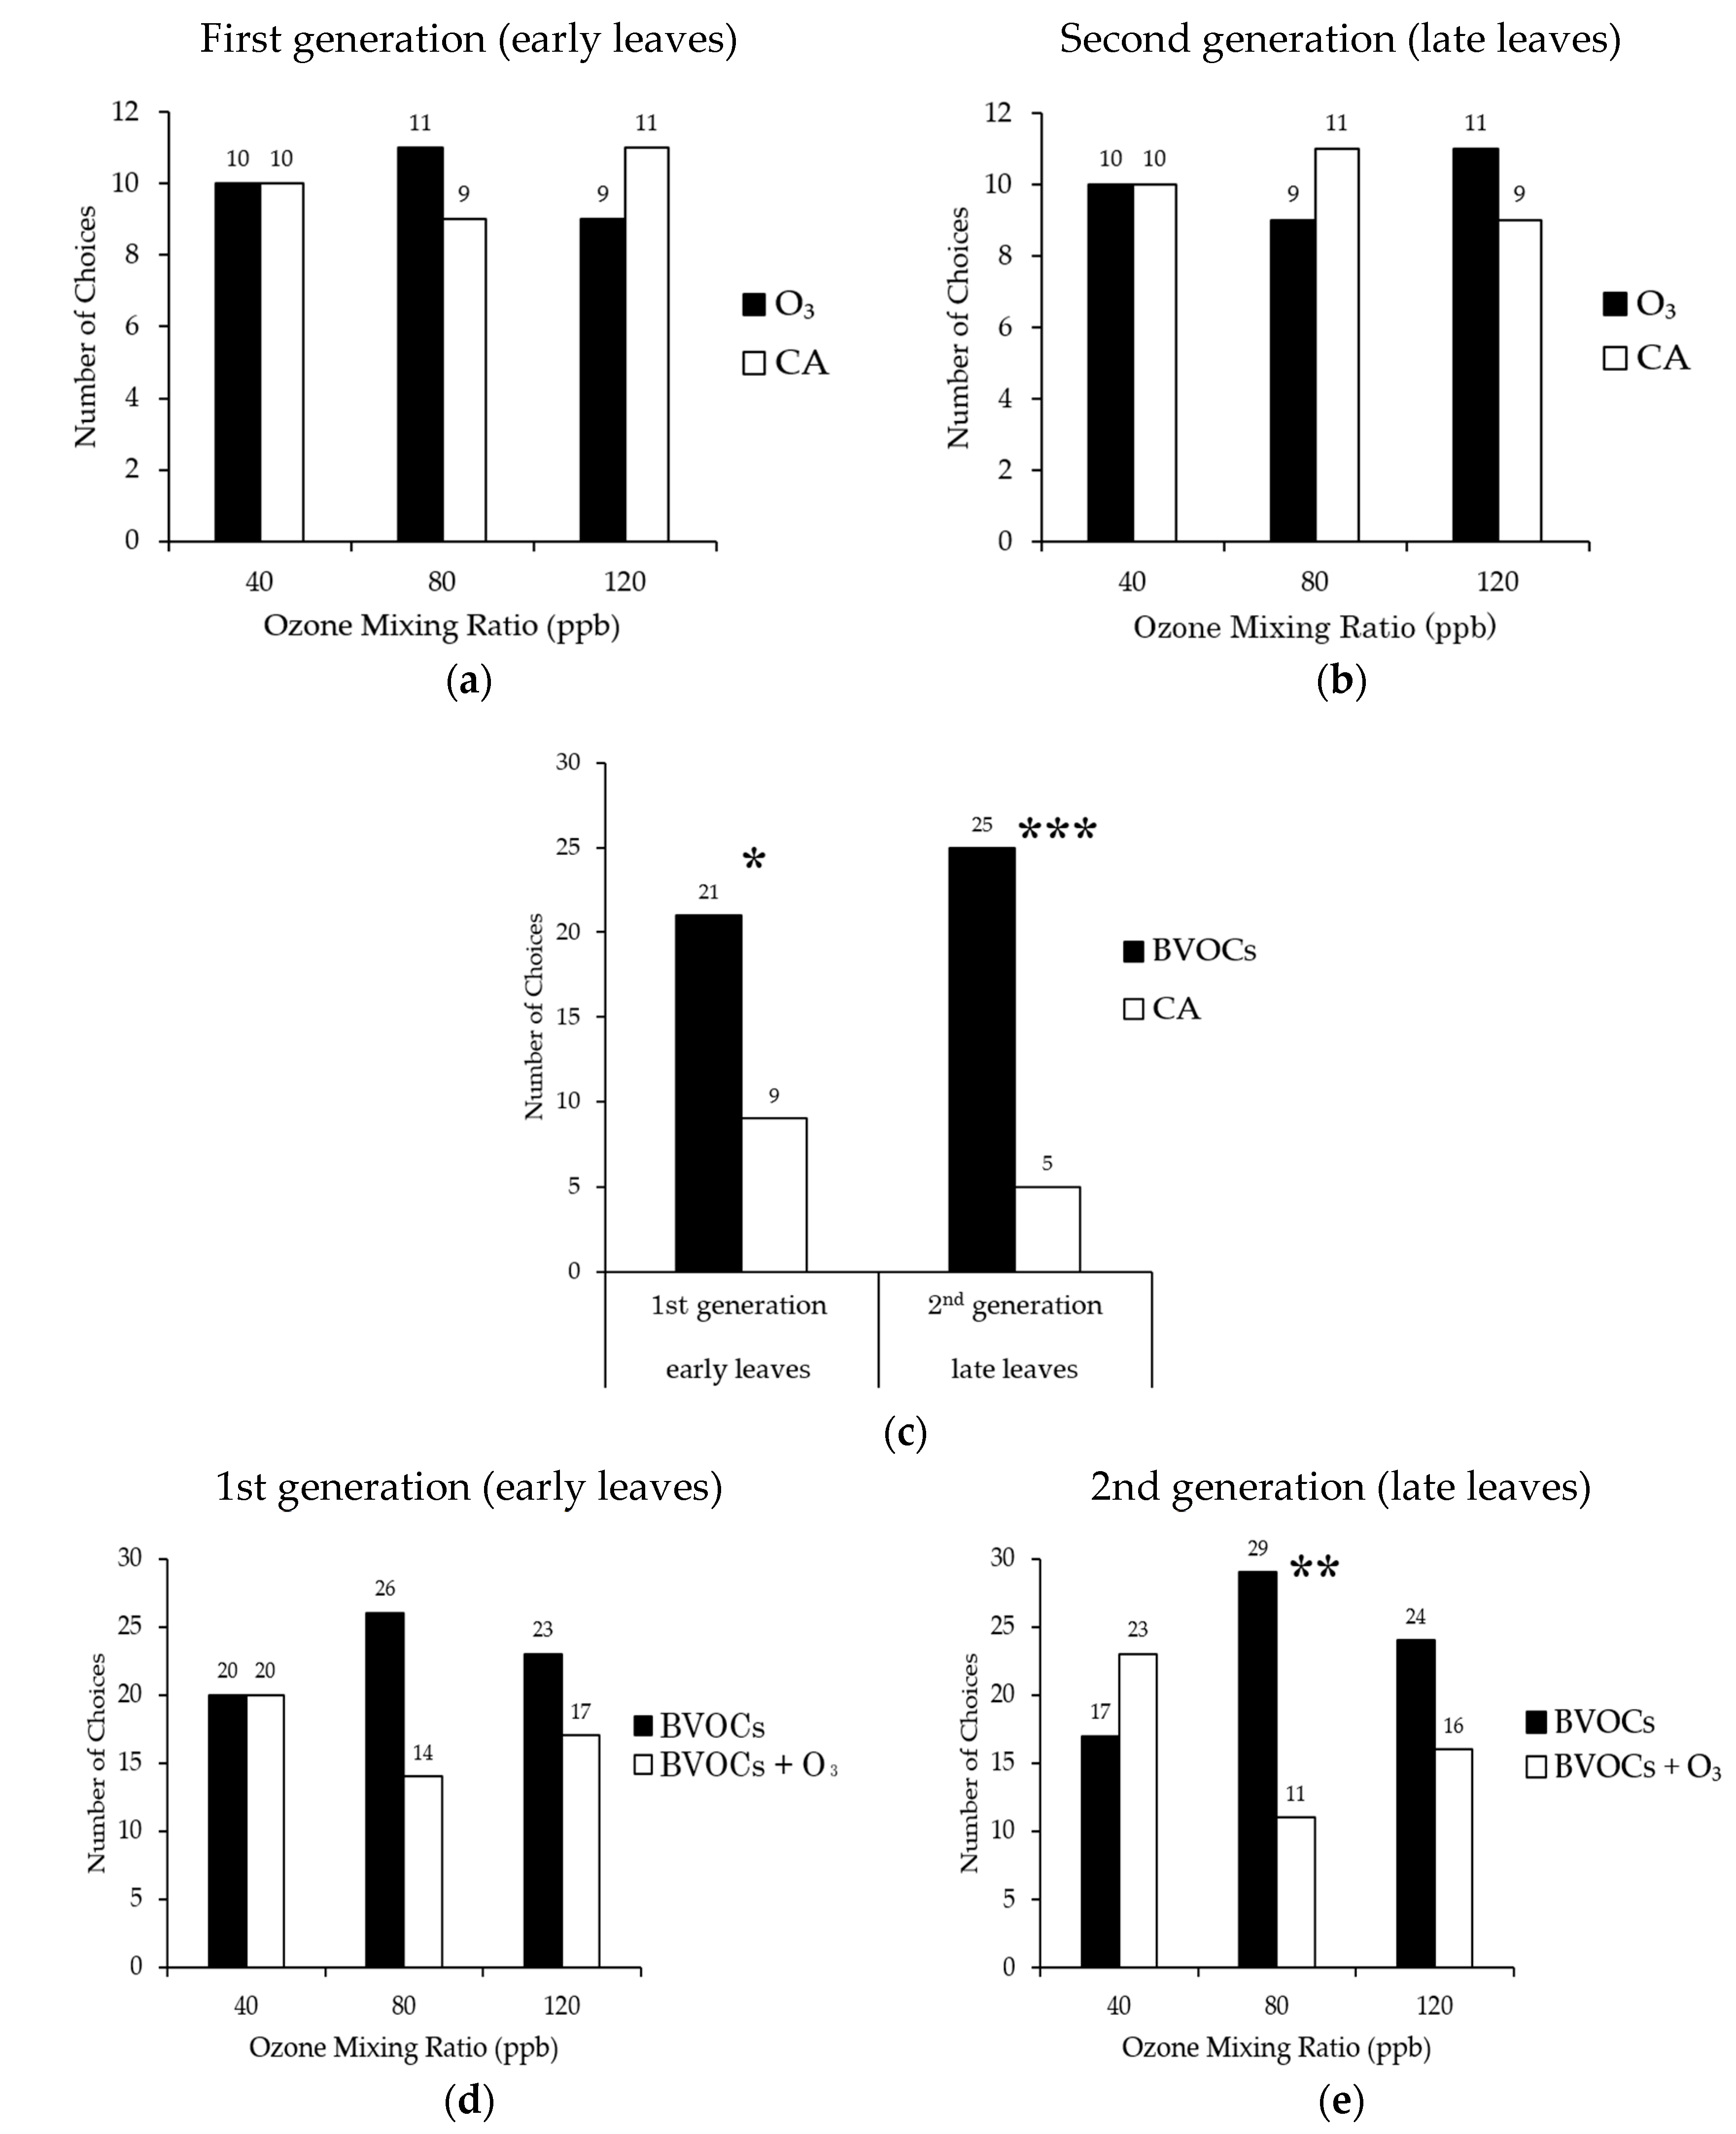
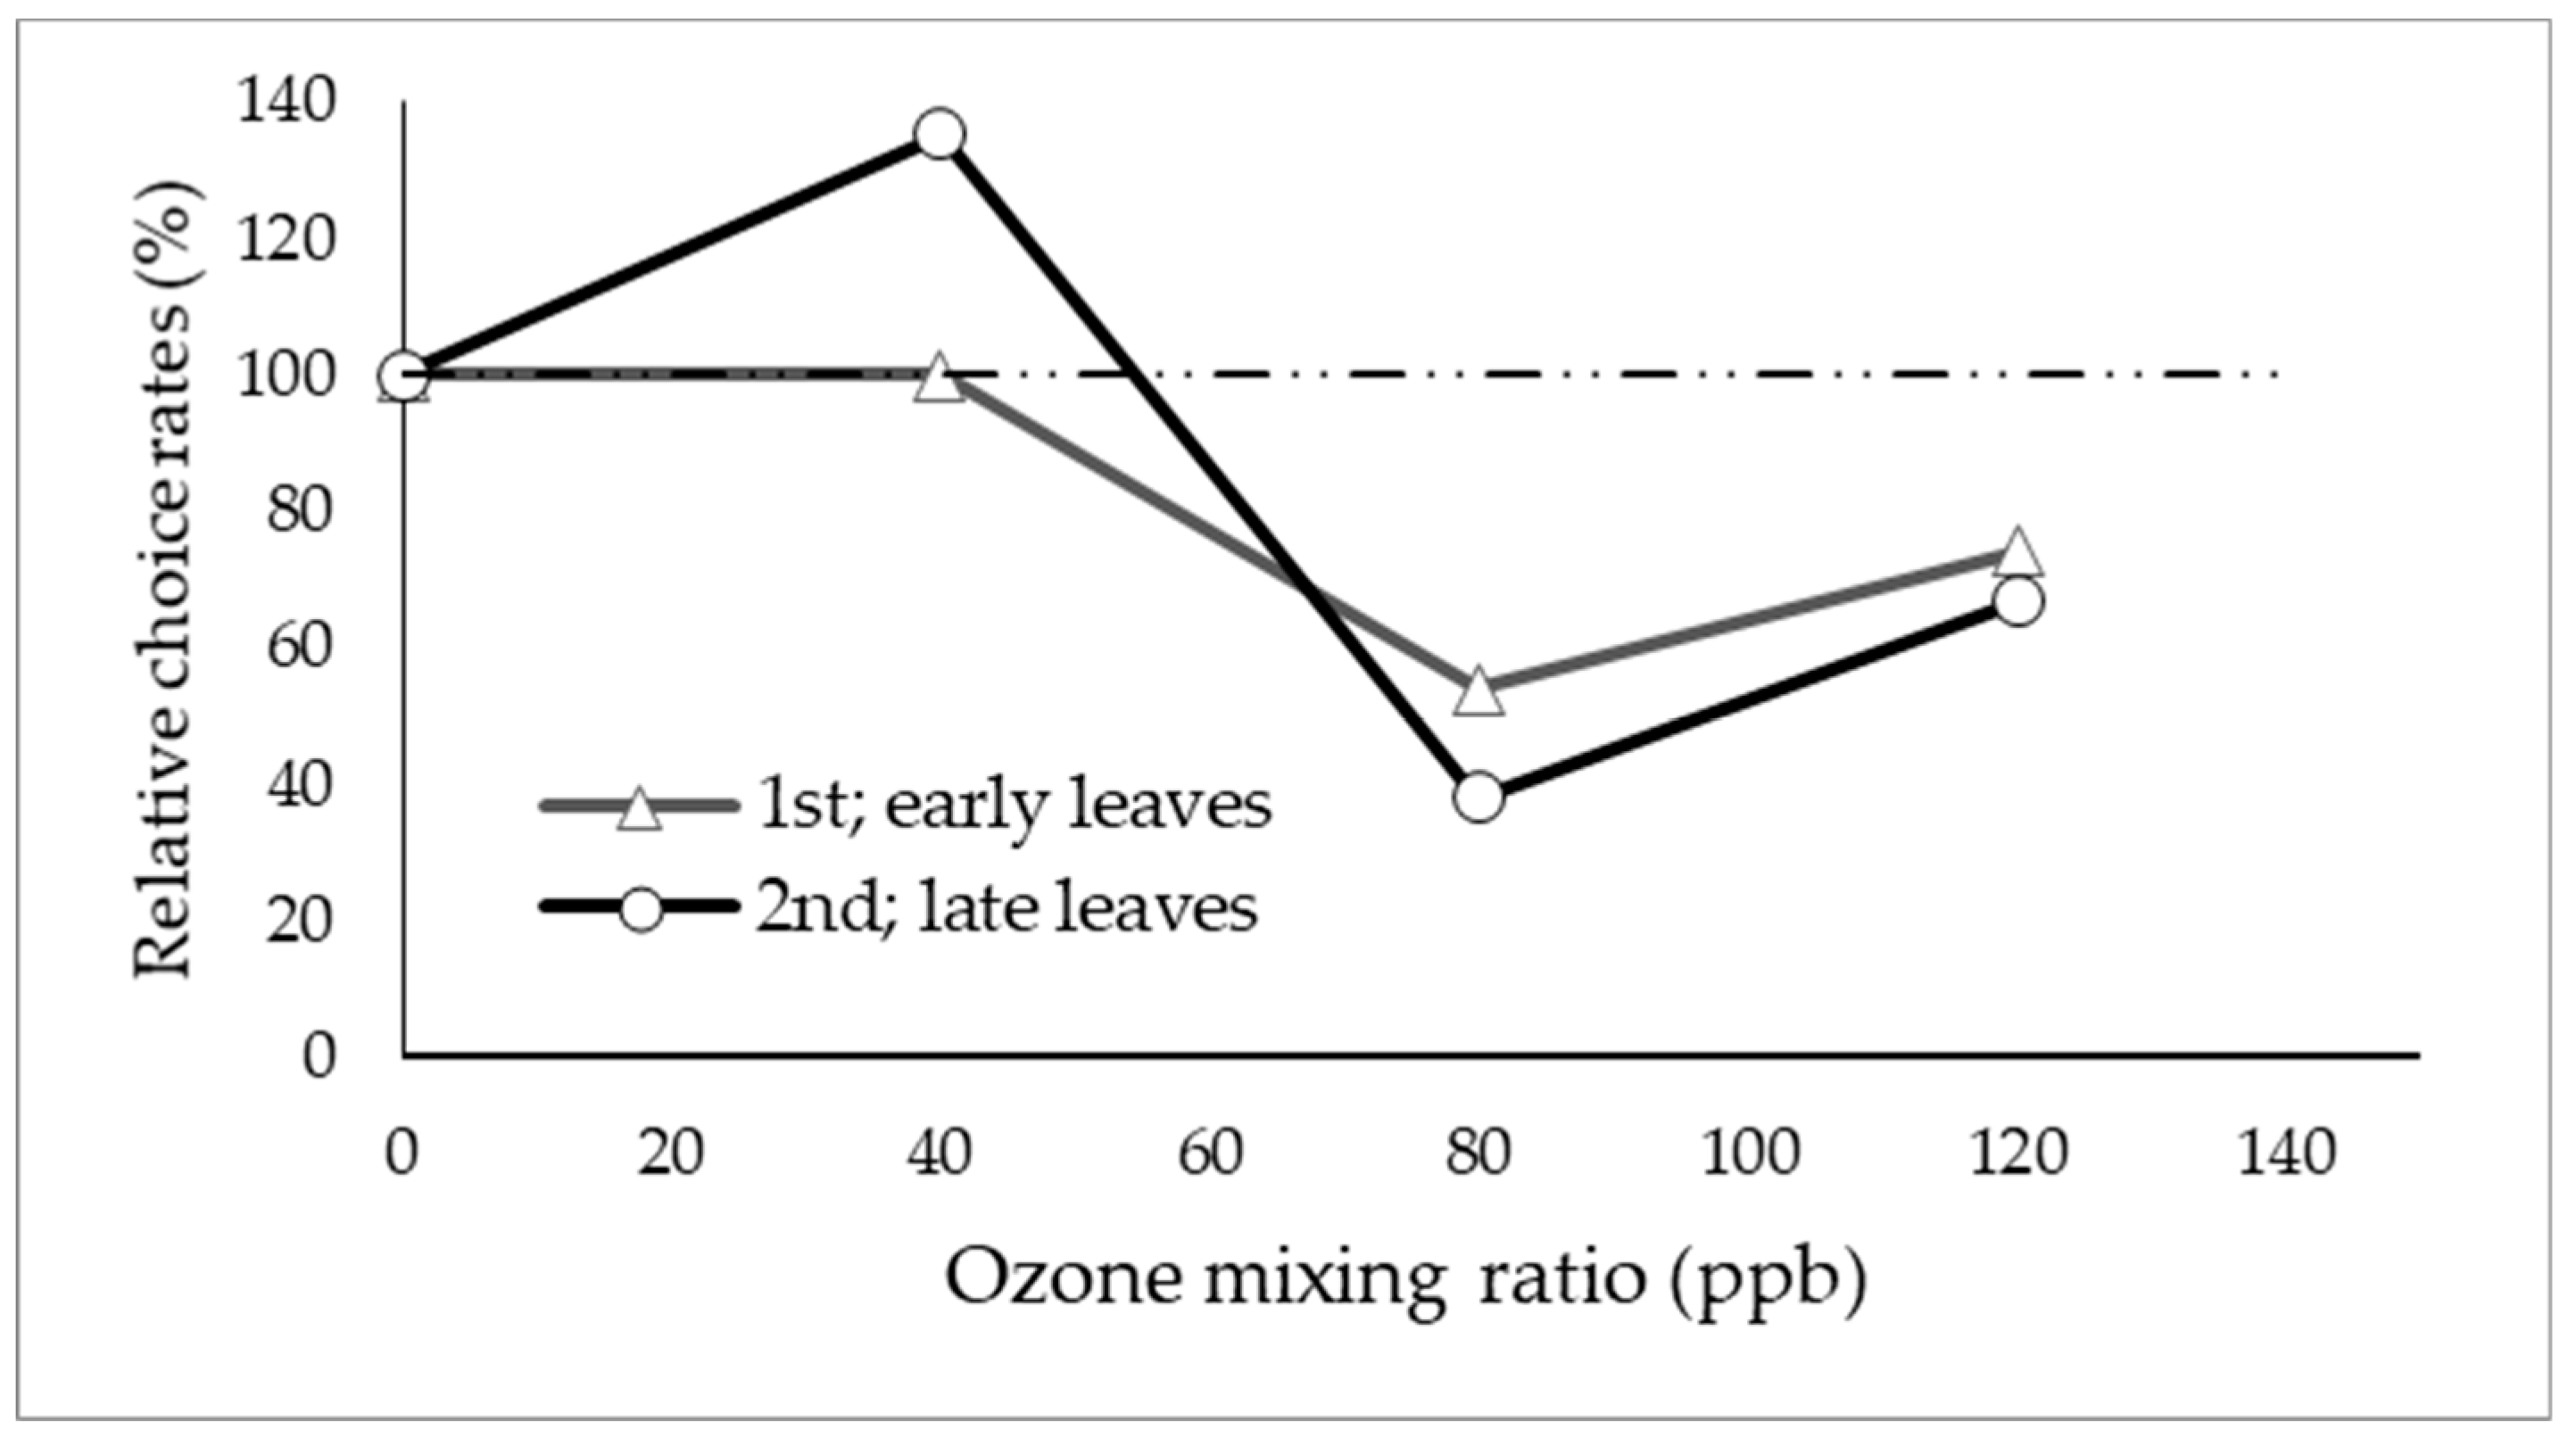
3.1. Olfactory Response Test (Y-Tube Test)

The adult leaf beetles showed no preference/avoidance against O3 per se at any concentrations in test (1) O3 versus cleaned air (CA) containing no BVOCs (Figure 3a,b). They preferred BVOCs emitted from leaves of white birch trough CA in test (2) (Figure 3c; first generation: p < 0.05, second generation: p < 0.001). On the basis of these results of test (1) in June and (2) in August, the beetles show no selective difference regardless of the levels of O3 concentration.
In test (3) (Figure 3d,e), BVOCs versus BVOCs mixed with O3 (BVOC + O3), the leaf beetles of both first and second generation larvae had no preference between BVOCs and BVOCs + O3 at 40 ppb in June and August (BVOCs emitted from early and late leaves, respectively). At 80 ppb, although not statistically significant, first generation as well as second generation in August (p < 0.01) tended to prefer BVOCs over BVOCs + O3 (p = 0.08). The attractiveness of BVOCs from leaves was apparently degraded by higher O3 exposure from the results at 40 and 80 ppb O3. However, at 120 ppb, although insects more frequently preferred BVOCs by comparison with that at 40 ppb O3, the differences were not statistically significant in both seasons.

3.2. Sampling of BVOCs

3.2.1. BVOCs’ Emission Rates and Composition

It was found that BVOCs emitted from white birch had phenological differences corresponding to the lifecycle of alder leaf beetles both in quantity and quality. In dominances of BVOCs (Table 2), MT was a dominant group both in early and late leaves; the dominance was much more pronounced in late leaves (96.57%).
The detailed profile of the BVOCs is shown as each relative composition rate in Table 3 (see next page). The total emission rate of late leaves (in September) was significantly higher than that of early leaves (in June). Sabinene, which is a kind of MT, showed the highest emission rate in both leaves. The number of compounds emitted from early (30 species) and late (27 species) leaves was similar. However, the compositions were significantly different from June (early leaves) to September (late leaves). Four compounds, cis-/trans-β-ocimene, trans-sabinene-hydrate, and neo-allo-ocimene, were increased, and five compounds, hexanal, cis-3-hexen-1-ol, linalool oxide, β-linalool, and geranyl nitrile, were decreased.

3.2.2. O3 Reactive Compounds

In this study, we detected eight compounds as O3-reactive compounds, namely cis-/trans-β-ocimene, limonene, 2-carene, γ-terpinene, β-linalool, α-copaene, and β-caryophyllene, and the lifetimes were calculated as 15.7, 42.6, 36.2, 59.6, 19.7, 53.2, and 0.7 min at 80 ppb O3 concentration, respectively. The total dominances of O3-reactive compounds were over 20% in both seasons, that is, 21.61 ± 2.20 (average value ± SE) in early leaves and 25.60 ± 1.67 in late leaves.

4. Discussion

4.1. Behavior of Alder Leaf Beetles in High O3 Environment

From the Y-tube experiments, alder leaf beetles showed preference to BVOCs of Japanese white birch; however, the attractiveness of BVOCs decreased at higher O3 concentrations. It was noted that there were over 20% dominances by O3-reactive compounds in the BVOCs emissions.
There are two possible mechanisms explaining why alder leaf beetles less frequently visited leaves of white birch growing in a high O3 concentration. One is that O3-reactive compounds functioned as attractant against the leaf beetles in low O3 conditions. In this case, decay of O3-reactive compounds might have directly affected their behavior in an O3-enriched atmosphere (BVOCs–O3 reaction). The other is the collapse of the BVOCs’ composition owing to the decrease of some O3-reactive compounds, which results in less attractiveness. In such a situation, key attractant compounds may be a lot, not only including O3-reactive compounds. In other words, the “causes” of decreasing attractiveness are O3-reactive compounds, but the “factors” of attractiveness per se include other BVOCs. The latter mechanism related to BVOCs’ composition is plausible because most of BVOCs compounds found in this study were common in other plants. Other studies also mentioned the importance of composition for the attractiveness of BVOCs [30]. By either or both working mechanisms, it is estimated that decreasing concentrations of a part of BVOCs, such as O3-reactive compounds in the atmosphere, even if they do not show major composition rates, impede alder leaf beetles from finding their host white birch in a high O3 environment.

4.2. Multiplicity of BVOCs

Considering the multiplicity of BVOCs in white birch, a tendency of preference of alder leaf beetles can become complex to observe and interpret. For example, white birch has a rich variety of BVOCs, about 30 compounds, whereas a lot of low or non-emitters are also found in nature. In addition, atmospheric lifetimes of BVOC vary, from a few minutes to hours or days, and there are oxidative products dependent on BVOCs transformation after the reaction with O3 [22,31]. Therefore, functional changes of BVOCs consisting of many compounds may be biphasic, like test (3) at 120 ppb in this study (Figure 3d,e and Figure 4), because multiple reactions proceed simultaneously. Whether the oxidative products work as attractant or repellent to alder leaf beetles defines how a function changes as the O3 level increases.
It is also noted that the composition ratio was different between spring and summer when the first and second generation of adult alder leaf beetles grazed. This result means they may detect specific BVOCs’ composition in each season or common balance consisting of certain compounds in BVOCs between early and late leaves. In this study, we could not identify a common balance because of the multiplicity of BVOCs in white birch. To clarify the relationship between BVOCs’ profile and behavior of the leaf beetles, at first, Y-tube preference tests should be operated with single candidate compounds, such as O3-reactive ones and oxidative products. Then, GC-MS analysis will enable understanding the result of these preference tests, for example, comparison of BVOCs’ profiles before and after the reaction with elevated O3.

5. Conclusions

Considering BVOC emission, the effect of herbivory on leaves should be considered. In the case where BVOCs attract herbivorous insects to the host plants, it is estimated that grazing damage would increase at an accelerated pace. Specific emissions by damaged leaves are found in many plants, both qualitatively and quantitatively [33,34], which are known as HIPVs (herbivore induced plant volatiles). White birch is not an exception of HIPV emitters; β-ocimene, β-linalool, and β-caryophyllene increased in damaged white birch leaves (unpublished data, N. Masui).
Responses by insects to HIPVs are dependent on the host plants and the insects. There are examples both of repellence [34,35] and attractiveness [36] to the herbivorous insects after leaves are grazed, which are direct effects of herbivory by insects. In some cases, HIPVs recruit natural predators against the insects, which is known as an indirect defense [37]. On the basis of these findings, induced defense should be considered to explain herbivory behavior.

Author Contributions

N.M. conducted the experiments and authored the first draft of the manuscript, T.M. and A.T. provided GC-MS for BVOC, H.M. guided chemical analyses, E.A. contributed in statistics and logics and revised the manuscript, and T.W. and T.K. offered basic research plan and research fund. All authors have read and agreed to the published version of the manuscript.

Funding

This research was funded by the Kuribayashi Educational Scholarship and Academic Foundation (Sapporo, Japan), grant number PK341563, and by JST SICORP Grant Number JPMJSC18HB, Japan. E.A. acknowledges support from The Startup Foundation for Introducing Talent of Nanjing University of Information Science & Technology (NUIST), Nanjing, China, Grant Number 003080.

Acknowledgments

We thank late K. Ichikawa and F. Satoh for support in managing the experimental nursery. N.M. and T.K. appreciate S. Sakamoto for his kind guidance and help to make clonal birch and H. Tobita and M. Kitao for their kind help in using an ozone monitor (2BTech). T.K., E.A., and N.M. are grateful to R. Matyssek for his continuous encouragement.

Conflicts of Interest

The authors declare no conflict of interest.

References

  1. Koike, T.; Watanabe, M.; Hoshika, Y.; Kitao, M.; Matsumura, H.; Funada, R.; Izuta, T. Effects of Ozone on Forest Ecosystems in East and Southeast Asia. Dev. Environ. Sci. 2013, 13, 371–390. [Google Scholar] [CrossRef]
  2. Akimoto, H.; Mori, Y.; Sasaki, K.; Nakanishi, H.; Ohizumi, T.; Itano, Y. Analysis of monitoring data of ground-level ozone in Japan for long- term trend during 1990–2010: Causes of temporal and spatial variation. Atmos. Environ. 2015, 102, 302–310. [Google Scholar] [CrossRef]
  3. Nagashima, T.; Sudo, K.; Akimoto, H.; Kurokawa, J.; Ohara, T. Long-term change in the source contribution to surface ozone over Japan. Atmos. Chem. Phys. 2017, 17, 8231–8246. [Google Scholar] [CrossRef] [Green Version]
  4. Matyssek, R.; Wieser, G.; Calfapietra, C.; De Vries, W.; Dizengremel, P.; Ernst, D.; Jolivet, Y.; Mikkelsen, T.N.; Mohren, G.M.J.; Le Thiec, D.; et al. Forests under climate change and air pollution: gaps in understanding and future directions for research. Environ. Pollut. 2012, 160, 57–65. [Google Scholar] [CrossRef] [PubMed]
  5. Agathokleous, E.; Kitao, M.; Komatsu, M.; Tamai, Y.; Saito, H.; Harayama, H.; Uemura, A.; Tobita, H.; Koike, T. Effects of soil nutrient availability and ozone on container-grown Japanese larch seedlings and role of soil microbes. J. Forestry Res. 2019, 1–7. [Google Scholar] [CrossRef] [Green Version]
  6. Matyssek, R.; Wieser, G.; Fleischmann, F.; Grűnhage, L. Ozone Research, Quo Vadis? Lessons from the Free-Air Canopy Fumigation Experiment at Kranzberg Forest. Dev. Environ. Sci. 2013, 13, 103–129. [Google Scholar] [CrossRef]
  7. Chappelka, A.H.; Grulke, N.E. Disruption of the ‘disease triangle’ by chemical and physical environmental change. Plant Biol. 2016, 18, 5–12. [Google Scholar] [CrossRef]
  8. Lindroth, R.L. Impacts of Elevated Atmospheric CO2 and O3 on forests: Phytochemistry, Trophic Interactions, and Ecosystem Dynamics. J. Chem. Ecol. 2010, 36, 2–21. [Google Scholar] [CrossRef]
  9. Gregg, J.W.; Jones, C.G.; Dawson, T.E. Urbanization effects on tree growth in the vicinity of New York City. Nature 2003, 424, 183–187. [Google Scholar] [CrossRef]
  10. Sakikawa, T.; Shi, C.; Nakamura, M.; Watanabe, M.; Oikawa, M.; Satoh, F.; Koike, T. Leaf phenology and insect grazing of Japanese white birch saplings grown under free-air ozone exposure. J. Agric. Meteorol. 2011, 72, 80–84. [Google Scholar] [CrossRef] [Green Version]
  11. Abu ElEla, S.; Agathokleous, E.; Ghazawy, N.A.; Amin, T.R.; ElSayed, W.M.; Koike, T. Enzyme activity modification in adult beetles (Agelastica coerulea) inhabiting birch trees in an ozone-enriched atmosphere. Environ. Sci. Pollut. Res. 2018, 25, 32675–32683. [Google Scholar] [CrossRef] [PubMed] [Green Version]
  12. Sugai, T.; Okamoto, S.; Agathokleous, E.; Masui, N.; Satoh, F.; Koike, T. Leaf defense capacity of Japanese elm (Ulmus davidiana var. japonica) seedlings subjected to a nitrogen loading and insect herbivore dynamics in a free air ozone-enriched environment. Environ. Sci. Pollut. Res. 2019, 1–11. [Google Scholar] [CrossRef] [PubMed]
  13. Agathokleous, E.; Sakikawa, T.; Abu ElEla, S.; Mochizuki, T.; Nakamura, M.; Watanabe, M.; Kawamura, K.; Koike, T. Ozone alters the feeding behavior of the leaf beetle Agelastica coerulea (Coleoptera: Chrysomelidae) into leaves of Japanese white birch (Betula platyphylla var. japonica). Environ. Sci. Pollut. Res. 2017, 24, 17577–17583. [Google Scholar] [CrossRef] [PubMed]
  14. Atkinson, R.; Arey, J. Gas-phase tropospheric chemistry of biogenic volatile organic compounds: A review. Atmos. Environ. 2003, 37, S197–S219. [Google Scholar] [CrossRef]
  15. Holopainen, J.K.; Blande, J.D. Where do herbivore-induced plant volatiles go? Front. Plant Sci. 2013, 4, 1–13. [Google Scholar] [CrossRef] [PubMed] [Green Version]
  16. Blande, J.D.; Holopainen, J.K.; Niinemets, Ü. Plant volatiles in polluted atmospheres: Stress responses and signal degradation. Plant. Cell. Environ. 2014, 37, 1892–1904. [Google Scholar] [CrossRef] [Green Version]
  17. Karabourniotis, G.; Liakopoulos, G.; Nikolopoulos, D.; Bresta, P. Protective and defensive roles of non-glandular trichomes against multiple stresses: Structure–function coordination. J. Forestry Res. 2019. [Google Scholar] [CrossRef] [Green Version]
  18. Roeland, S.; Moretti, M.; Amorim, J.H.; Branquinho, C.; Fares, S.; Morelli, F.; Niinemets, Ü.; Paoletti, E.; Pinho, P.; Sgrigna, G.; et al. Towards an integrative approach to evaluate the environmental ecosystem services provided by urban forest. J. Forestry Res. 2019, 30, 1981–1996. [Google Scholar] [CrossRef] [Green Version]
  19. Pinto, D.M.; Blande, J.D.; Souza, S.R.; Nerg, A.-M.; Holopainen, J.K. Plant Volatile Organic Compounds (VOCs) in Ozone (O3) Polluted Atmospheres: The Ecological Effects. J. Chem. Ecol. 2010, 36, 22–34. [Google Scholar] [CrossRef]
  20. Li, T.; Blande, J.D.; Holopainen, J.K. Atmospheric transformation of plant volatiles disrupts host plant finding. Sci. Rep. 2016, 6, 1–10. [Google Scholar] [CrossRef]
  21. Fuentes, J.D.; Lerdau, M.; Atkinson, R.; Baldocchi, D.; Bottenheim, J.W.; Ciccioli, P.; Lamb, B.; Geron, C.; Gu, L.; Guenther, A.; et al. Biogenic Hydrocarbons in the Atmospheric Boundary Layer: A Review. Bull. Amer. Meteor. 2000, 81, 1537–1575. [Google Scholar] [CrossRef] [Green Version]
  22. McFrederick, Q.S.; Kathilankal, J.C.; Fuentes, J.D. Air pollution modifies floral scent trails. Atmos. Environ. 2008, 42, 2336–2348. [Google Scholar] [CrossRef]
  23. Fuentes, J.D.; Roulston, T.H.; Zenker, J. Ozone impedes the ability of a herbivore to find its host. Environ. Res. Lett. 2013, 8, 014048. [Google Scholar] [CrossRef]
  24. Koike, T. Physiological ecology of the growth characteristics of Japanese mountain birch in Northern Japan: A comparison with Japanese white birch. In Vegetation Sciences in Forestry: Global Perspective Based on Forest Ecosystems of East and Southeast Asia (Handbook of Vegetation Science); Box, E.O., Peet, R.K., Masuzawa, T., Yamada, I., Fujiwara, K., Maycock, P.F., Eds.; Kluwer Academic Publishers: Dordrecht, The Netherlands, 1995; Volume 12, pp. 409–422. [Google Scholar]
  25. Park, I.K.; Lee, S.G.; Shin, S.C.; Kim, C.S.; Ahn, Y.J. Feeding and attraction of Agelastica coerulea. (Coleoptera: Chrysomelidae) to Betulaceae plants. J. Econ. Entomol. 2004, 97, 1978–1982. [Google Scholar] [CrossRef] [PubMed]
  26. Jung, C.H.; Han, K.S.; Boo, K.S. Identification of Volatiles Responsive to the Alder Leaf Beetle (Agelastica coerulea) from its Host Plant, the Japanese Alder (Alnus glutinosa). J. Asia Pac. Entomol. 2000, 3, 33–40. [Google Scholar] [CrossRef]
  27. Tani, A.; Kawawata, Y. Isoprene emission from the major native Quercus spp. in Japan. Atmos. Environ. 2008, 42, 4540–4550. [Google Scholar] [CrossRef]
  28. Shimoda, T.; Ozawa, R.; Arimura, G.; Takabayashi, J.; Nishioka, T. Olfactory responses of two specialist insect predators of spider mites toward plant volatiles from lima bean leaves induced by jasmonic acid and/or methyl salicylate. Appl. Entomol. Zool. 2002, 37, 535–541. [Google Scholar] [CrossRef] [Green Version]
  29. Brilli, F.; Ciccioli, P.; Frattoni, M.; Prestininzi, M.; Spanedda, A.F.; Loreto, F. Constitutive and herbivore-induced monoterpenes emitted by Populus × euroamericana leaves are key volatiles that orient Chrysomela populi beetles. Plant. Cell. Environ. 2009, 32, 542–552. [Google Scholar] [CrossRef]
  30. Bruce, T.J.A.; Wadhams, L.J.; Woodcock, C.M. Insect host location: A volatile situation. Trends. Plant. Sci. 2005, 10, 269–274. [Google Scholar] [CrossRef]
  31. Reissell, A.; Aschmann, S.M.; Atkinson, R.; Arey, J. Products of the OH radical- and O3-initiated reactions of myrcene and ocimene. J. Geophys. Res. 2002, 107. [Google Scholar] [CrossRef]
  32. Agathokleous, E. Environmental hormesis, a fundamental non-monotonic biological phenomenon with implications in ecotoxicology and environmental safety. Ecotox. Environ. Saf. 2018, 148, 1042–1053. [Google Scholar] [CrossRef] [Green Version]
  33. Copolovici, L.; Kännaste, A.; Remmel, T.; Vislap, V.; Niinemets, Ü. Volatile emissions from Alnus glutionosa induced by herbivory are quantitatively related to the extent of damage. J. Chem. Ecol. 2011, 37, 18–28. [Google Scholar] [CrossRef]
  34. Kessler, A.; Baldwin, I.T. Defensive function of herbivore-induced plant volatile emissions in nature. Science 2001, 291, 2141–2144. [Google Scholar] [CrossRef] [PubMed]
  35. De Moraes, C.M.; Lewis, W.J.; Paré, P.W.; Alborn, H.T.; Tumlinson, J.H. Herbivore-infested plants selectively attract parasitoids. Nature 1998, 393, 570–573. [Google Scholar] [CrossRef]
  36. Bolter, C.J.; Dicke, M.; Van Loon, J.J.A.; Visser, J.H.; Posthumus, M.A. Attraction of Colorado potato beetle to herbivore-damaged plants during herbivory and after its termination. J. Chem. Ecol. 1997, 23, 1003–1023. [Google Scholar] [CrossRef]
  37. Dicke, M. Behavioural and community ecology of plants that cry for help. Plant. Cell. Environ. 2009, 32, 654–665. [Google Scholar] [CrossRef]
Figure 1. Olfactory response test (Y-tube preference test). Each arrow in this figure indicates the aerial direction.
Forests 11 00058 g001
Figure 2. Branch chamber method for sampling of volatiles emitted from leaves of white birch. Each arrow in this figure means the aerial direction.
Forests 11 00058 g002
Figure 3. Y-tube preference test {1} O3 vs. cleaned air (CA) (a) with first generation of adult leaf beetles and with second generation (b), test (2) biogenic volatile organic compounds (BVOCs; from leaves of white birch) vs. CA (c), and test (3) BVOCs vs. BVOCs + O3 with first generation (d) and second generation (e). The values on bars are total number of choices to each side of Y-tube in each test. Astericks stand for p > 0.05 *; p > 0.01 **; and p > 0.001 *** in the binominal test.
Forests 11 00058 g003
Figure 4. Relative choice rates versus biogenic volatile organic compounds (BVOC; emitted from leaves of white birch without O3 mixture) of adult alder leaf beetles. First and second means first and second generation of adult leaf beetles, respectively. Each rate was calculated from data of (d,e) in Figure 3. Dashed line indicates theoretical rate (100%) in the case in which no BVOCs’ degradation occurs by O3. The biphasic response of insect choices to BVOCs mixed with O3 cannot be considered a “hormetic response” [32] with certainty, because it may be solely upon changes in the atmospheric composition rather than changes in the leaf quality.
Forests 11 00058 g004
Table 1. Biogenic volatile organic compounds’ (BVOCs) atmospheric lifetimes.
k2[O3] 28.4 ppb[O3] 80.0 ppb
Monoterpenes
Camphene9.2 × 10−1918.0d6.4d
2-Carene2.3 × 10−161.7h36.2m
3-Carene3.6 × 10−1711.0h3.9h
Limonene2.0 × 10−162.0h42.6m
Myrcene4.8 × 10−1650.0m17.7m
cis-/trans-Ocimene5.4 × 10−1644.0m15.7m
α-Phellandrene3.0 × 10−158.0m2.8m
β-Phellandrene4.7 × 10−178.4h3.0h
α-Pinene8.6 × 10−174.6h1.6h
β-Pinene1.5 × 10−171.1d0.4d
Sabinene8.3 × 10−174.8h1.7h
α-Terpinene2.4 × 10−141.0m0.4m
γ-Terpinene1.4 × 10−162.8h59.6m
Terpinolene1.8 × 10−1513.0m4.6m
Sesquiterpenes
β-Caryophyllene1.2 × 10−142.0m0.7m
α-Cedrene2.8 × 10−1714.0h5.0h
α-Copaene1.6 × 10−162.5h53.2m
α-Humulene1.2 × 10−142.0m0.7m
Oxygenates
1,8-Cineole->110d-
cis-3-Hexen-1-ol6.4 × 10−176.2h2.2h
cis-3-Hexenyl acetate5.4 × 10−177.3h2.6h
Linalool4.3 × 10−1655.0m19.7m
2-Methyl-3-buten-2-ol9.7 × 10−181.7d0.6d
6-Methyl-5-hepten-2-one4.0 × 10−161.0h21.3m
Lifetimes at 28.4 ppb (26 nmol mol−1) O3 are known values shown in previous studies [14,21]. On the basis of these values, reaction rates (k2) and lifetimes at 80 ppb, which was the concentration of order value in the free air O3-concentration enrichment (FACE) system, were calculated. “m”, “h”, and “d” indicate “minute”, “hour”, and “day”, respectively.
Table 2. Dominances of biogenic volatile organic compounds (BVOCs) at chemical group level.
GroupEmission Rate (%)F-ValueT-test
Early LeavesLate Leaves
JuneSeptemberTypep-Value
MT (monoterpene)65.252 ± 2.63796.569 ± 0.27293.79W**
Oxygenated-MT17.119 ± 2.0282.366 ± 0.092481.95W**
SQT (sesquiterpene)7.971 ± 3.9550.217 ± 0.0506186.57Wn.s
N-compound3.272 ± 0.5580.173 ± 0.045156.94W**
GLV (green leaf volatile)6.386 ± 0.9780.613 ± 0.24515.97W**
Organic acid-ester-0.062 ± 0.024---
Values in this table are average value (%) ± SE (n = 5). Individual t-test: p < 0.01 **; n.s, not significant; -, not found. F-test at each group was conducted as two-sided test (α = 0.05;); Rejection region of F-value is ≤0.104 and ≥9.605; “S” and “W” in this table mean Student’s and Welch’s t-test conducted at each group, respectively.
Table 3. Biogenic volatile organic compounds’ (BVOCs) Composition rates (%) of leaves of Japanese white birch at compounds level.
JuneSeptemberF ValueT-test
Number of Compounds3027Typep Value
Total Emission rate (μmol m−2s−1)0.983 ± 0.1822.115 ± 0.1341.85S**
Name of compoundsRTGroup
hexanal16.53GLV0.724 ± 0.1950.151 ± 0.04420.10W*
cis-3-hexen-1-ol18.82GLV1.059 ± 0.1110.462 ± 0.2113.64S*
α-thujene21.72MT1.485 ± 0.1331.566 ± 0.1881.99Sn.s
α-pinene22.13MT7.495 ± 0.2597.786 ± 0.2291.27Sn.s
camphene22.84MT0.243 ± 0.0270.297 ± 0.0321.40Sn.s
sabinene23.56MT40.980 ± 2.21250.107 ± 1.8041.50S*
β-pinene23.88MT3.299 ± 0.0883.459 ± 0.1432.64Sn.s
trans-3-hexenyl acetate24.32GLV4.009 ± 0.831
cis-2-hexenyl acetate24.54GLV0.594 ± 0.134
2-carene25.13MT0.600 ± 0.0810.610 ± 0.1252.41Sn.s
o-cymene25.39MT1.789 ± 0.6351.623 ± 0.4402.08Sn.s
trans-β-ocimene25.48MT0.992 ± 0.1744.334 ± 0.3253.47S**
limonene25.58MT0.454 ± 0.0590.669 ± 0.0412.08S*
β-phellandrene25.71MT1.006 ± 0.0981.022 ± 0.1442.16Sn.s
p-Cineole25.78Oxy-MT1.170 ± 0.4410.238 ± 0.0111552.13Wn.s
cis-β-ocimene25.89MT4.249 ± 0.79717.920 ± 1.3492.87S**
γ-terpinene26.53MT1.474 ± 0.2031.467 ± 0.3222.52Sn.s
trans-sabinene-hydrate27.01Oxy-MT0.911 ± 0.1171.437 ± 0.0495.60S**
linalool oxide27.48Oxy-MT4.706 ± 0.7700.510 ± 0.044307.73W**
β-linalool27.71Oxy-MT10.333 ± 1.9290.181 ± 0.0362829.78W**
geranyl nitrile28.11N3.272 ± 0.5580.173 ± 0.045156.94W**
neo-allo-ocimene28.65MT1.185 ± 0.2155.709 ± 0.4263.93S**
methyl salicylate31.14Oa-est0.062 ± 0.024
ylangene36.40SQT0.900 ± 0.4270.035 ± 0.0101666.55Wn.s
α-copaene36.57SQT0.731 ± 0.3360.022 ± 0.0063104.84Wn.s
β-bourbonene36.88SQT1.470 ± 0.6220.074 ± 0.0161451.45Wn.s
β-caryophyllene37.93SQT0.743 ± 0.3170.034 ± 0.0081409.37Wn.s
β-copaene38.13SQT0.547 ± 0.276
aristolene38.29SQT2.461 ± 1.448
α-farnesene39.35SQT0.030 ± 0.005
germacrene39.48SQT0.807 ± 0.437
α-guaiene39.73SQT0.312 ± 0.1380.023 ± 0.006482.87Wn.s
Values in this table means average composition rates (%) in whole ± SE (n = 5); RT: Retention Time. MT: Monoterpen, SQT: Seaquiterpene, N: N-compounds, Oxy-: Oxygenated-, Oa-est: Organic acid-ester; In individual t-test, Asterisk stands for p-value < 0.05 *; p < 0.01 **; horizontal line “−” means “Not found”; + means < 0.001 μmol m−2s−1, n.s means “not significant”. F-test at each compound was conducted as two-sided test (α = 0.05); Rejection region of F-value is ≤ 0.104 and ≥ 9.605; “S “and “W” in this table means Student’s and Welch’s t-test conducted at each compound, respectively.

