The Development of Pneumatic Fatigue Test Rig for Wood-Based Specimens


Biotechnical Faculty, University of Ljubljana, 1000 Ljubljana, Slovenia
*
Author to whom correspondence should be addressed.
Forests 2020, 11(11), 1187; https://0-doi-org.brum.beds.ac.uk/10.3390/f11111187
Submission received: 21 October 2020
/
Revised: 5 November 2020
/
Accepted: 6 November 2020
/
Published: 10 November 2020
(This article belongs to the Special Issue Performance of Wood and Wood-Based Materials)
Abstract
:In product design, the focus is increasingly shifting towards optimizing and increasing the efficiency of the development process. This can be achieved with advanced numerical tools, but these methods require precise knowledge of material properties. One of the desired properties is the dynamic load behavior of the material. The research is directly related with the company that developed the slender wooden beams used in industry to produce windows of larger dimensions (height over 3 m). For the testing of wooden beams, the pneumatic four-point bending fatigue test rig was developed. In this paper, the whole structure of the test rig is described in detail. Based on the performed experiments of dynamic strength, the Woehler curve was determined, which serves as a necessary input for further numerical simulation of the fatigue process of wood-based beams. Knowledge of the response of wood to dynamic loads is very important to predict its life expectancy in various products.
1. Introduction
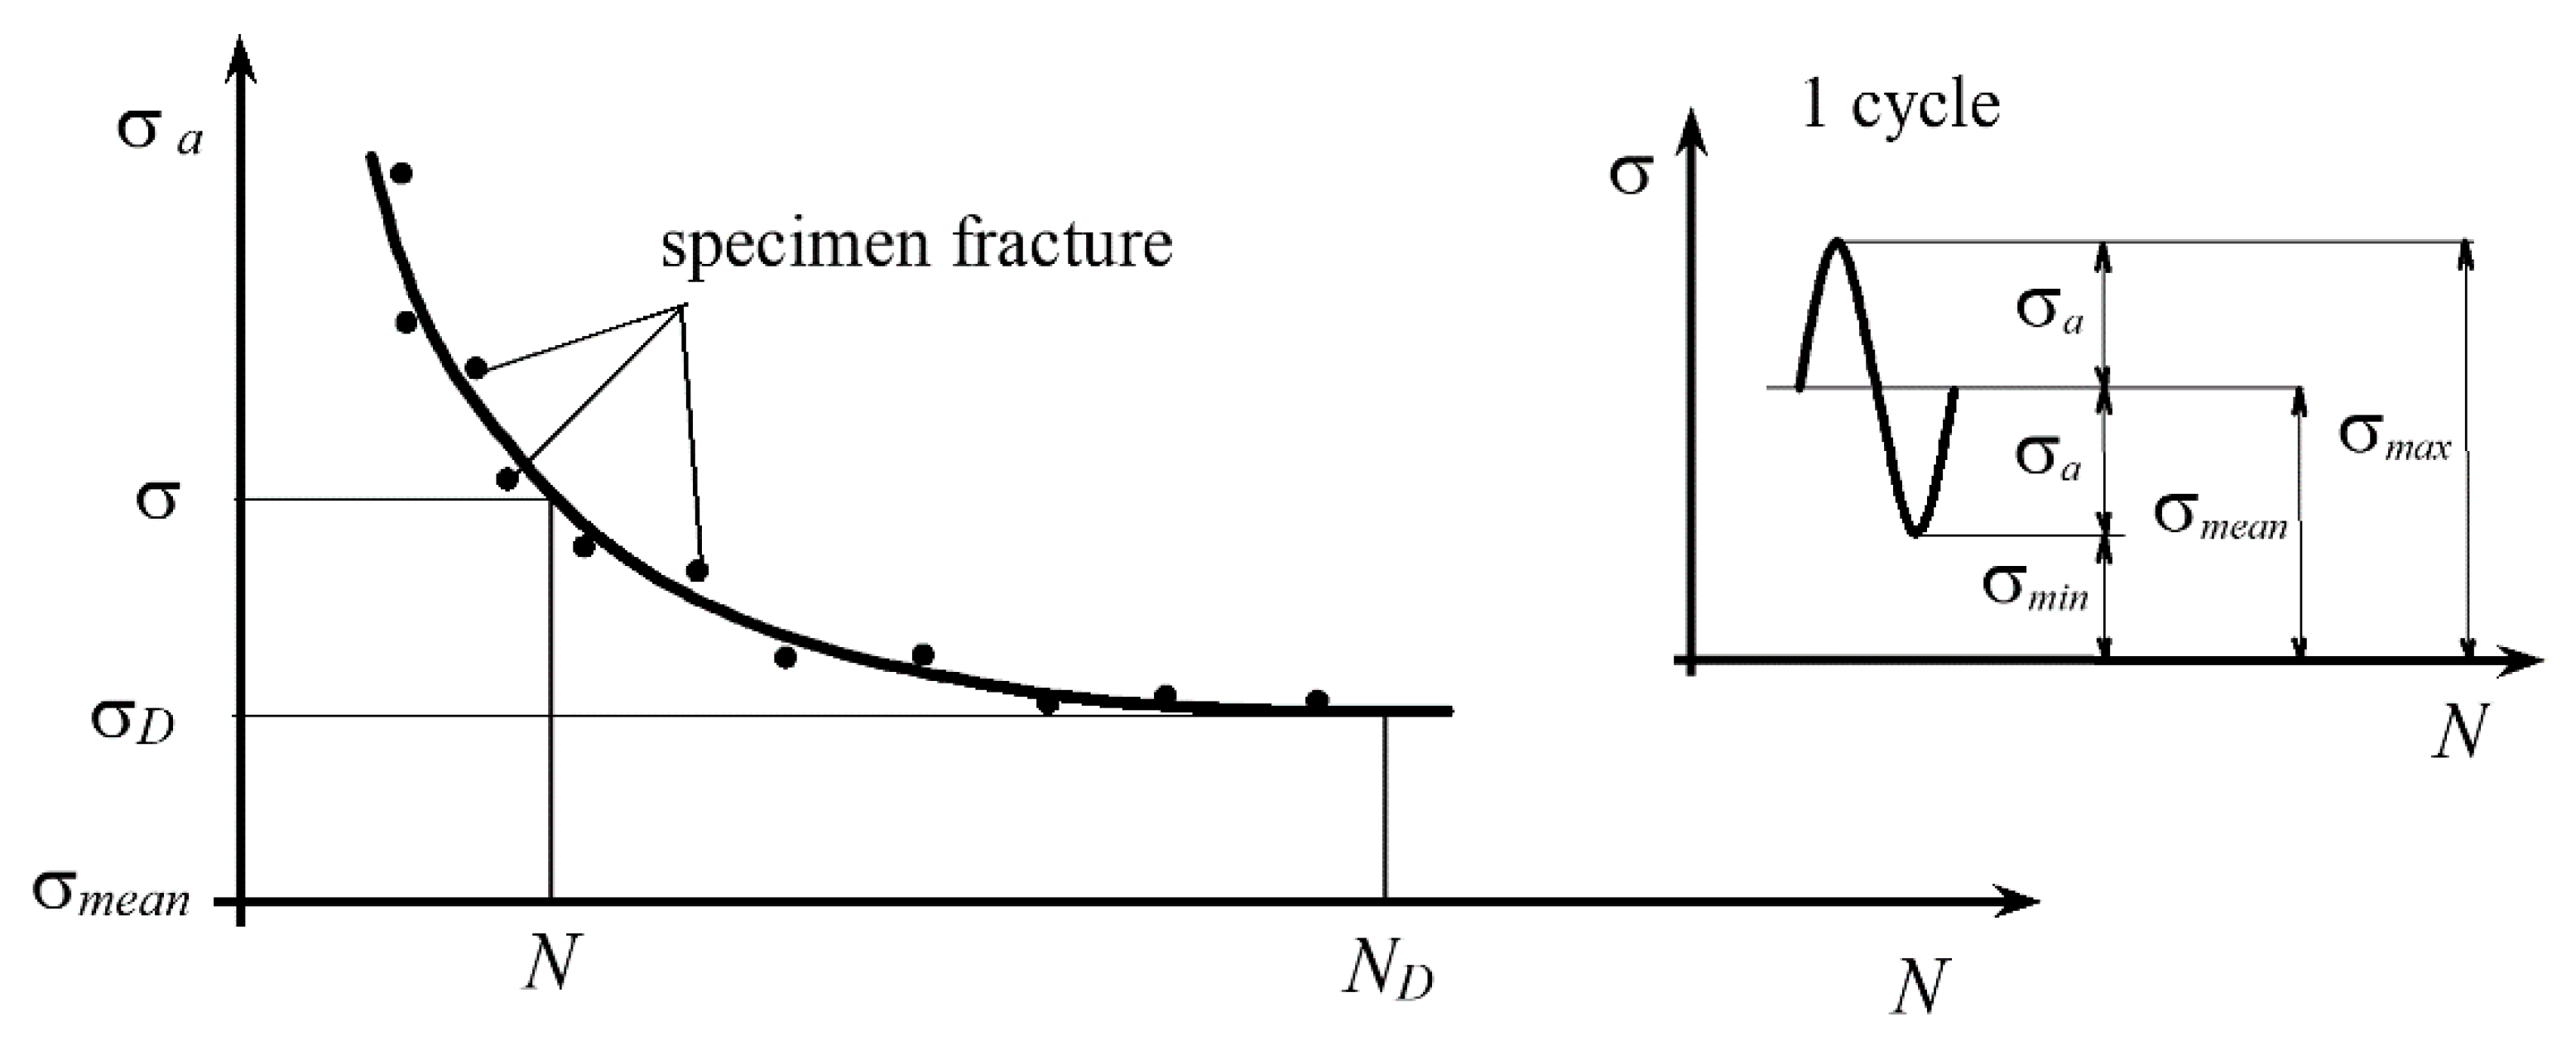
When designing parts and structures, various physical models must be taken into account, which can lead to damage, failure or collapse of a part or an entire structure. The collapse of a part can be caused by a sudden overload (resulting in an impact fracture) or by a regular or continuous change of stress at lower levels under the influence of dynamic stress, which after a certain time leads to fatigue and, consequently, permanent fracture. Repeated loading causes permanent deformation, cracks and fractures even at stresses of lower levels, which would not lead to permanent deformation under static loads. Due to the occurrence of fatigue, the strength of the material under dynamic load is 20 to 60% lower than under static load [1]. The dynamic strength depends on the type of load and the number of load oscillations. It is determined experimentally by dynamic testing of specimens in special test rigs for fatigue tests. The test specimens are subjected to dynamic loads of a certain intensity until a crack or a fracture occurs. For a given series of test specimens, the mean stress is a constant σmean = const., and the amplitude stress σA is gradually reduced with each subsequent test specimen, recording the number of load cycles N at which each test specimen was permanently fractured. The test results are shown in σ–N (S–N) diagrams in the form of the number of load cycles N until the occurrence of a crack or a fracture in a curve of the dynamic strength of the material (S–N curve, Woehler curve) (Figure 1). The constant value, to which the curve asymptotically approaches, represents the maximum nominal stress under a periodically changing load that the test piece can withstand for an unlimited number of oscillations without fracture; it is called the permanent dynamic strength of the material.
In recent years, wood has become an increasingly interesting alternative to steel and concrete due to increased environmental awareness and the general trend towards sustainable construction. The construction industry produces about 32% of all waste. In addition to this, more than 50% of non-renewable raw materials are used in the construction industry. All these indicators give wood a certain chance and they also increase its applicability for construction purposes (wooden houses, bridges, etc.).
Wood is a heterogeneous material with mechanical properties that vary greatly both within a tree and between trees. Products made from biological materials such as wood often have complex mechanical behavior. Although such materials have been used for thousands of years, their mechanical behavior is not yet fully understood. They often vary in their properties from sample to sample and show non-linear mechanical behavior at higher loads. Moisture changes lead to shrinkage or swelling and changed mechanical properties. Wood also shows a dependence on the loading rate, such as creep and viscoelasticity [2]. However, recently wood has been re-discovered as a building material, which can also be subjected to cyclic (fatigue) loads.
One of the first studies related to the fatigue of wood was carried out by Wood [3], who presented the so-called “Madison curve” as the relationship between stress and duration of loading. In recent years, much research has been carried out to explain the fatigue phenomena of wood [4,5,6]. The general conclusion of these studies is that the fatigue properties of wood are significantly influenced by the amount of water contained in the wood. In addition, the dynamic strength of wood by pulsating loading (R = 0) is higher when compared to the completely reversed loading (R = −1) at the same peak stress. The dynamic load factor R defines the type of load R = Fmin/Fmax = σmin/σmax (Figure 1).
Recently, researchers have analyzed various parameters influencing the fatigue behavior of wood. Wood is in fact a natural and anisotropic material with considerable variability in its mechanical properties. In timber construction, wooden parts are usually connected by dowels or screws, which represent stress concentrations due to holes, notches, etc. This notch effect has a negative influence on the fatigue behavior of wooden components, especially in the area of high cycle fatigue [7]. Liu and Ross [8] developed a mathematical model to predict the fatigue strength of Douglas-fir beams under sinusoidal loading. They concluded that for a given mean stress the fatigue life decreases with an increase in amplitude stress. Furthermore, for a given stress amplitude, the fatigue life decreases with an increase in the mean stress. The authors also found that the fatigue life is almost independent of the load frequency. Yildirim et al. [9] investigated the fatigue behavior of Scots pine and beech wood using a three-point bending test at different stress levels (from 40 to 80% of the static breaking strength of the material). The authors concluded that the fatigue strength of beech is higher compared to Scots pine. Mejri et al. [10] have analyzed the influence of hygrothermal ageing on the fatigue behavior of wood fibre composites under bending stress. The authors concluded that the damage mechanisms are directly influenced by ageing. When analysing the fatigue behavior of wood components, some authors also considered fracture mechanics and fatigue crack growth theories. The proposed approaches refer to Mode-I [11,12,13], Mode-II [14,15,16] or Mixed-Mode-I+II [17] fatigue crack growth. The fatigue process is thus present in wood and occurs in many structures, such as furniture [18], roof structures, wind turbine blades [19], bridges and windows, which are the subject of this research.
The share of wood-based windows (i.e., wooden and aluminium–wooden profiled windows) is the largest (66%) among certified windows for low-energy houses, due to their high energy efficiency and their beneficial life cycle assessment characteristics [20]. A contemporary architectural design of buildings integrates wooden products in the building envelope as well as in the interior. One of the reasons for this is that it was proven that the use of natural wood in buildings has a positive psychological, emotional and health impacts on the people living in such an environment [21]. Windows have an important role (solar gains through glazing), effecting the energy efficiency of the building. Consequently, there has been a gradual increase in the proportion of the transparent part of the building envelope, over the last decade. Windows are more and more frequently placed from the bottom to the top of individual storeys, with heights exceeding 3.0 m, or even over several storeys, with heights exceeding 5.0 m. Wooden windows with heights exceeding 3 m, with slim profiles, are desired and the wooden window industry is in search for innovative solutions on how to make such wooden profiles that would limit bending deflections (functionality—ealing of window), performed by cyclic wind loads. Over the last twenty years, many studies have been performed with regard to the flexural rigidity and load-bearing capacity of hybrid beams not only experimentally [22,23,24,25,26] but also analytically [25,27,28,29,30,31] and numerically [32,33,34,35,36]. In most of the mentioned studies, much larger cross sections than those used for windows were investigated (e.g., up to 500 mm in height) [29,32]. Only a few researchers have studied the reinforcing effect on specimens with cross sections smaller than 100 mm × 100 mm [25,31,35], where limited space for reinforcements is available, as in the case discussed in this article.
To improve the performance of window frames of greater heights, an optimized aluminum-reinforced slim wooden beam profile was already developed in coorporation with the selected company that produces wooden windows [25]. The paper presents the development of a pneumatic four-point bending fatigue test rig used to evaluate the dynamic behavior of such a developed hybrid wooden beam. The design of a fatigue test rig depends, to a large extent, on the test specimens being used. This includes the geometry, the material properties and the experimental procedure, which also defines the required force. All the selected components of the test rig are described in detail. Based on the performed experiments of dynamic strength, the Woehler curve was determined according to the principle proposed by Klemenc and Fajdiga [37,38]. The scatter of Woehler curves is modelled with a conditional, two parameter Weibull density of probability distribution, in relation to which the shape parameter is determined with a neural network, whereas the scale parameter will follow functional dependency of the durability curve. Determined Woehler curve serves as a necessary input for further numerical simulation of the fatigue process of wood-based beams.
Knowledge of the response of wood to dynamic loads (experimental and numerical) is very important today and will become increasingly important for future applications and the use of wood to predict its life expectancy in various products.
2. Materials and Methods
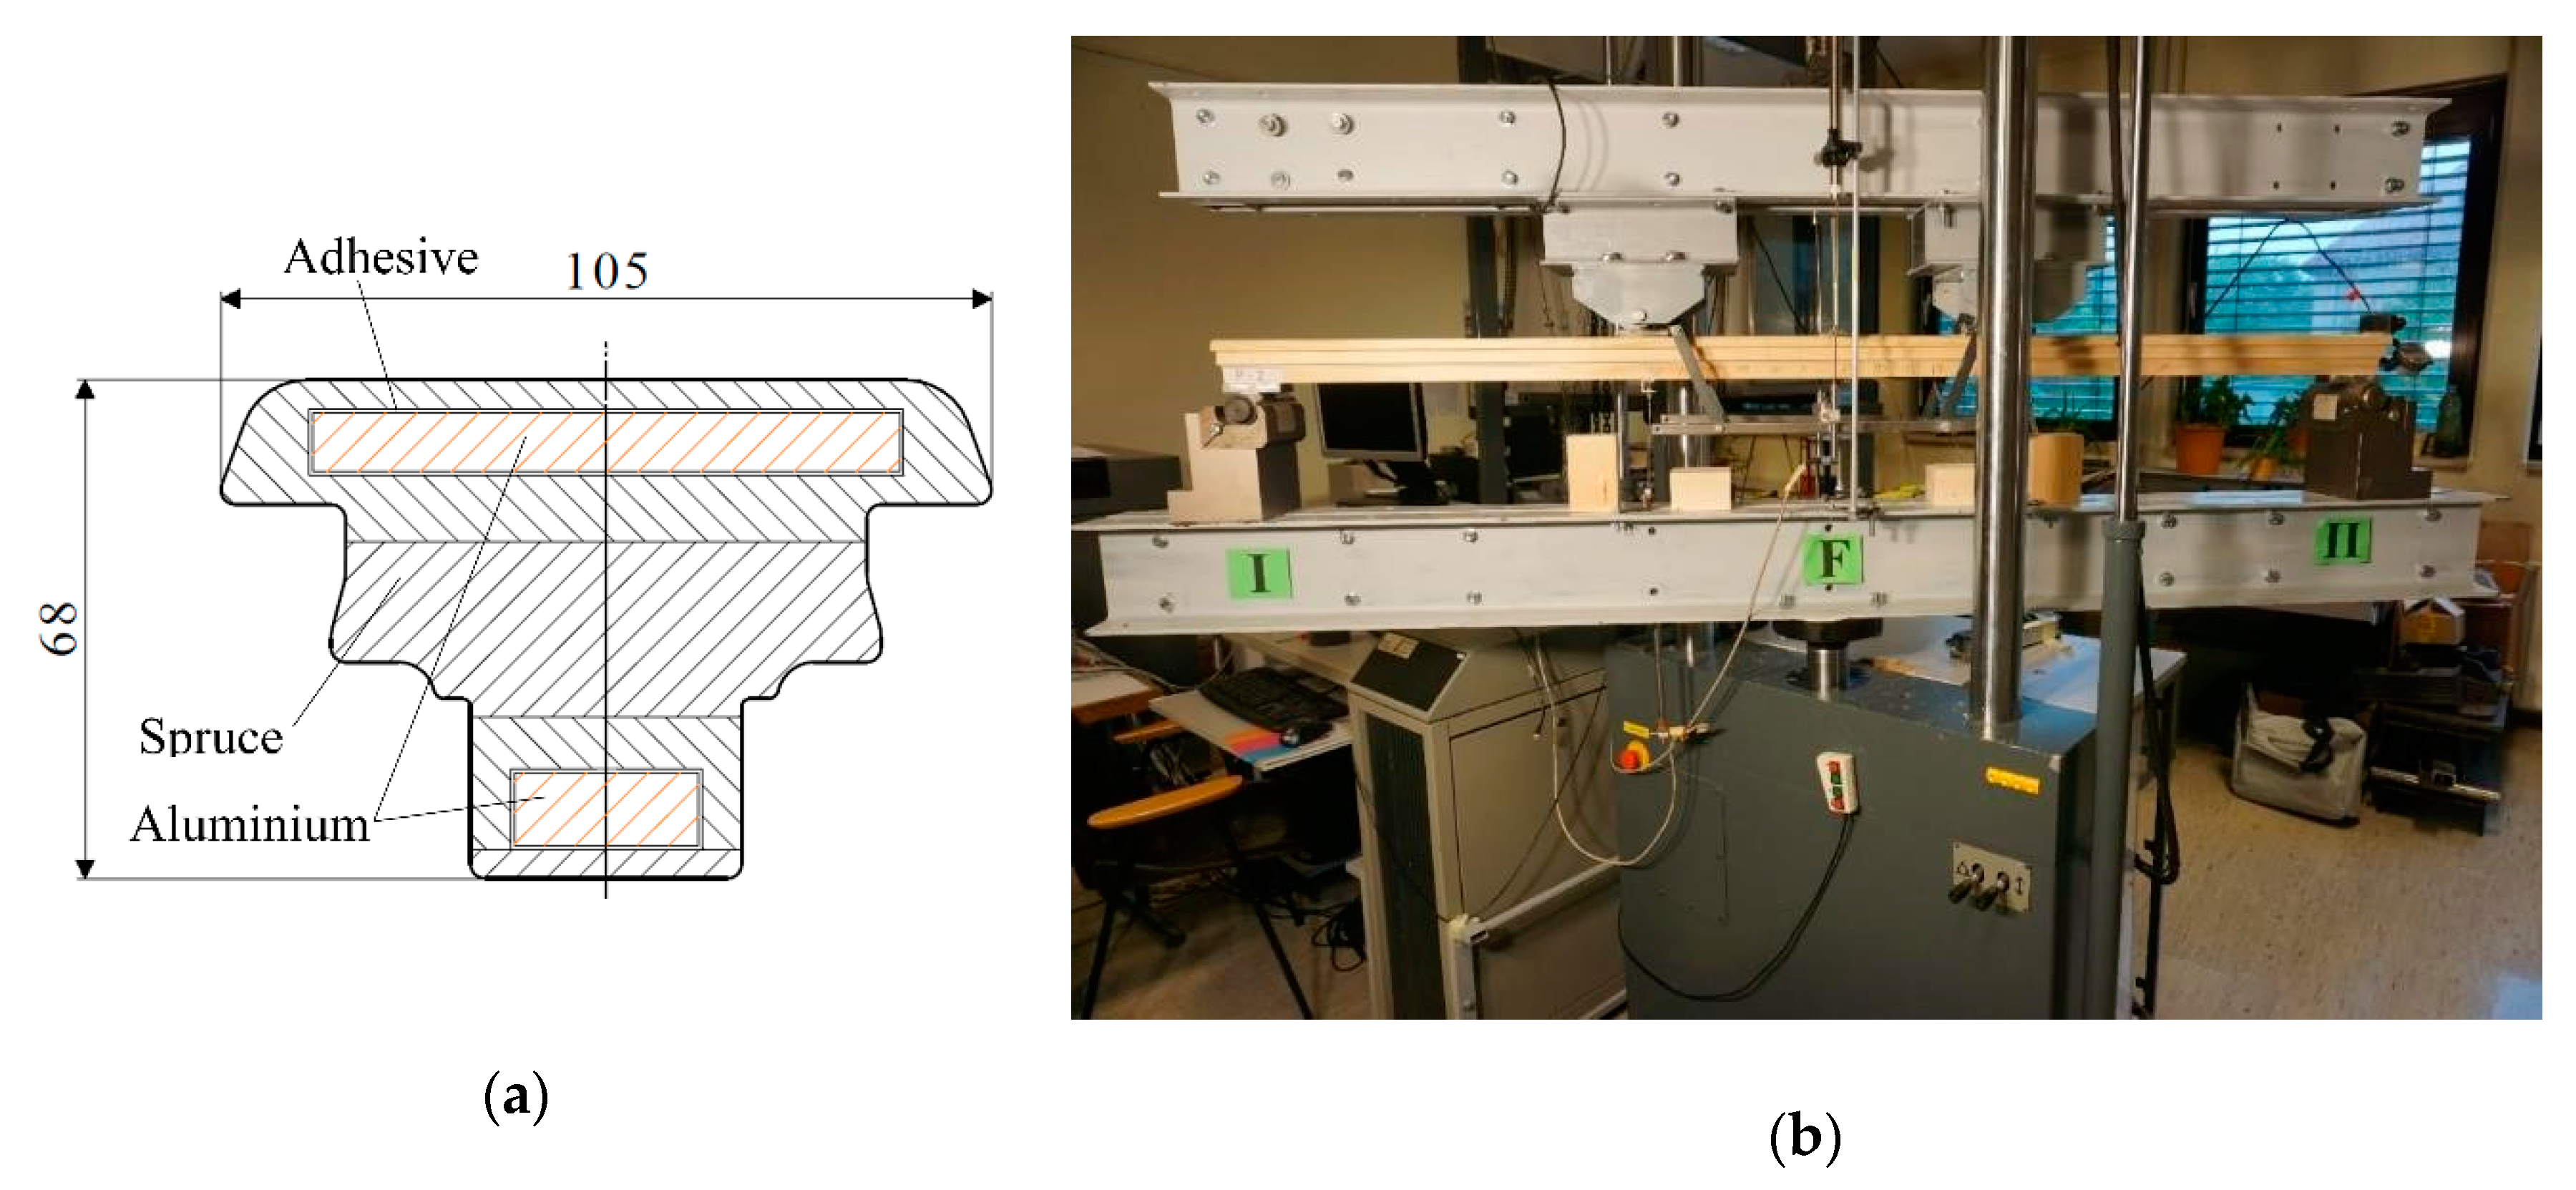
Basic guidelines for the design of the test rig construction are the requirements of the selected company producing wooden windows (M SORA d.d., Žiri, Slovenia) for the length of the test beam (1950 mm) and the maximum dynamic load P = 35 kN (dynamic load factor R = 0). The selected dimensions and loads are the result of numerical simulations already carried out to optimize the aluminum-reinforced wooden beam profile and the static bending tests (Figure 2b) carried out on the optimized beam [25,26,36,39]. All test specimens were manufactured using the following materials: wood species—Norway spruce, aluminum reinforcements—AW 6060-T66 and two-component polyurethane adhesive—COSMO PU 200.280 (Figure 2a). The cross-section of the aluminum-reinforced wooden beam is shown in Figure 2a.
The four-point bending tests up to failure were performed using a universal servo-hydraulic testing machine Roell Amsler HA 100 (Zwick GmbH & Co. KG, Ulm, Germany) [25], Figure 2b. The bending load tests were carried out in displacement (i.e., stroke) control mode with an actuator movement speed of 0.1 mm/s until failure. On each specimen, deflections were measured at two points with linear voltage displacement transducers (LVDTs). All physical properties (i.e., displacements, strains and load P) were measured and recorded with a Dewesoft DEWE 2500 data acquisition system [25].
2.1. Construction of Test Rig
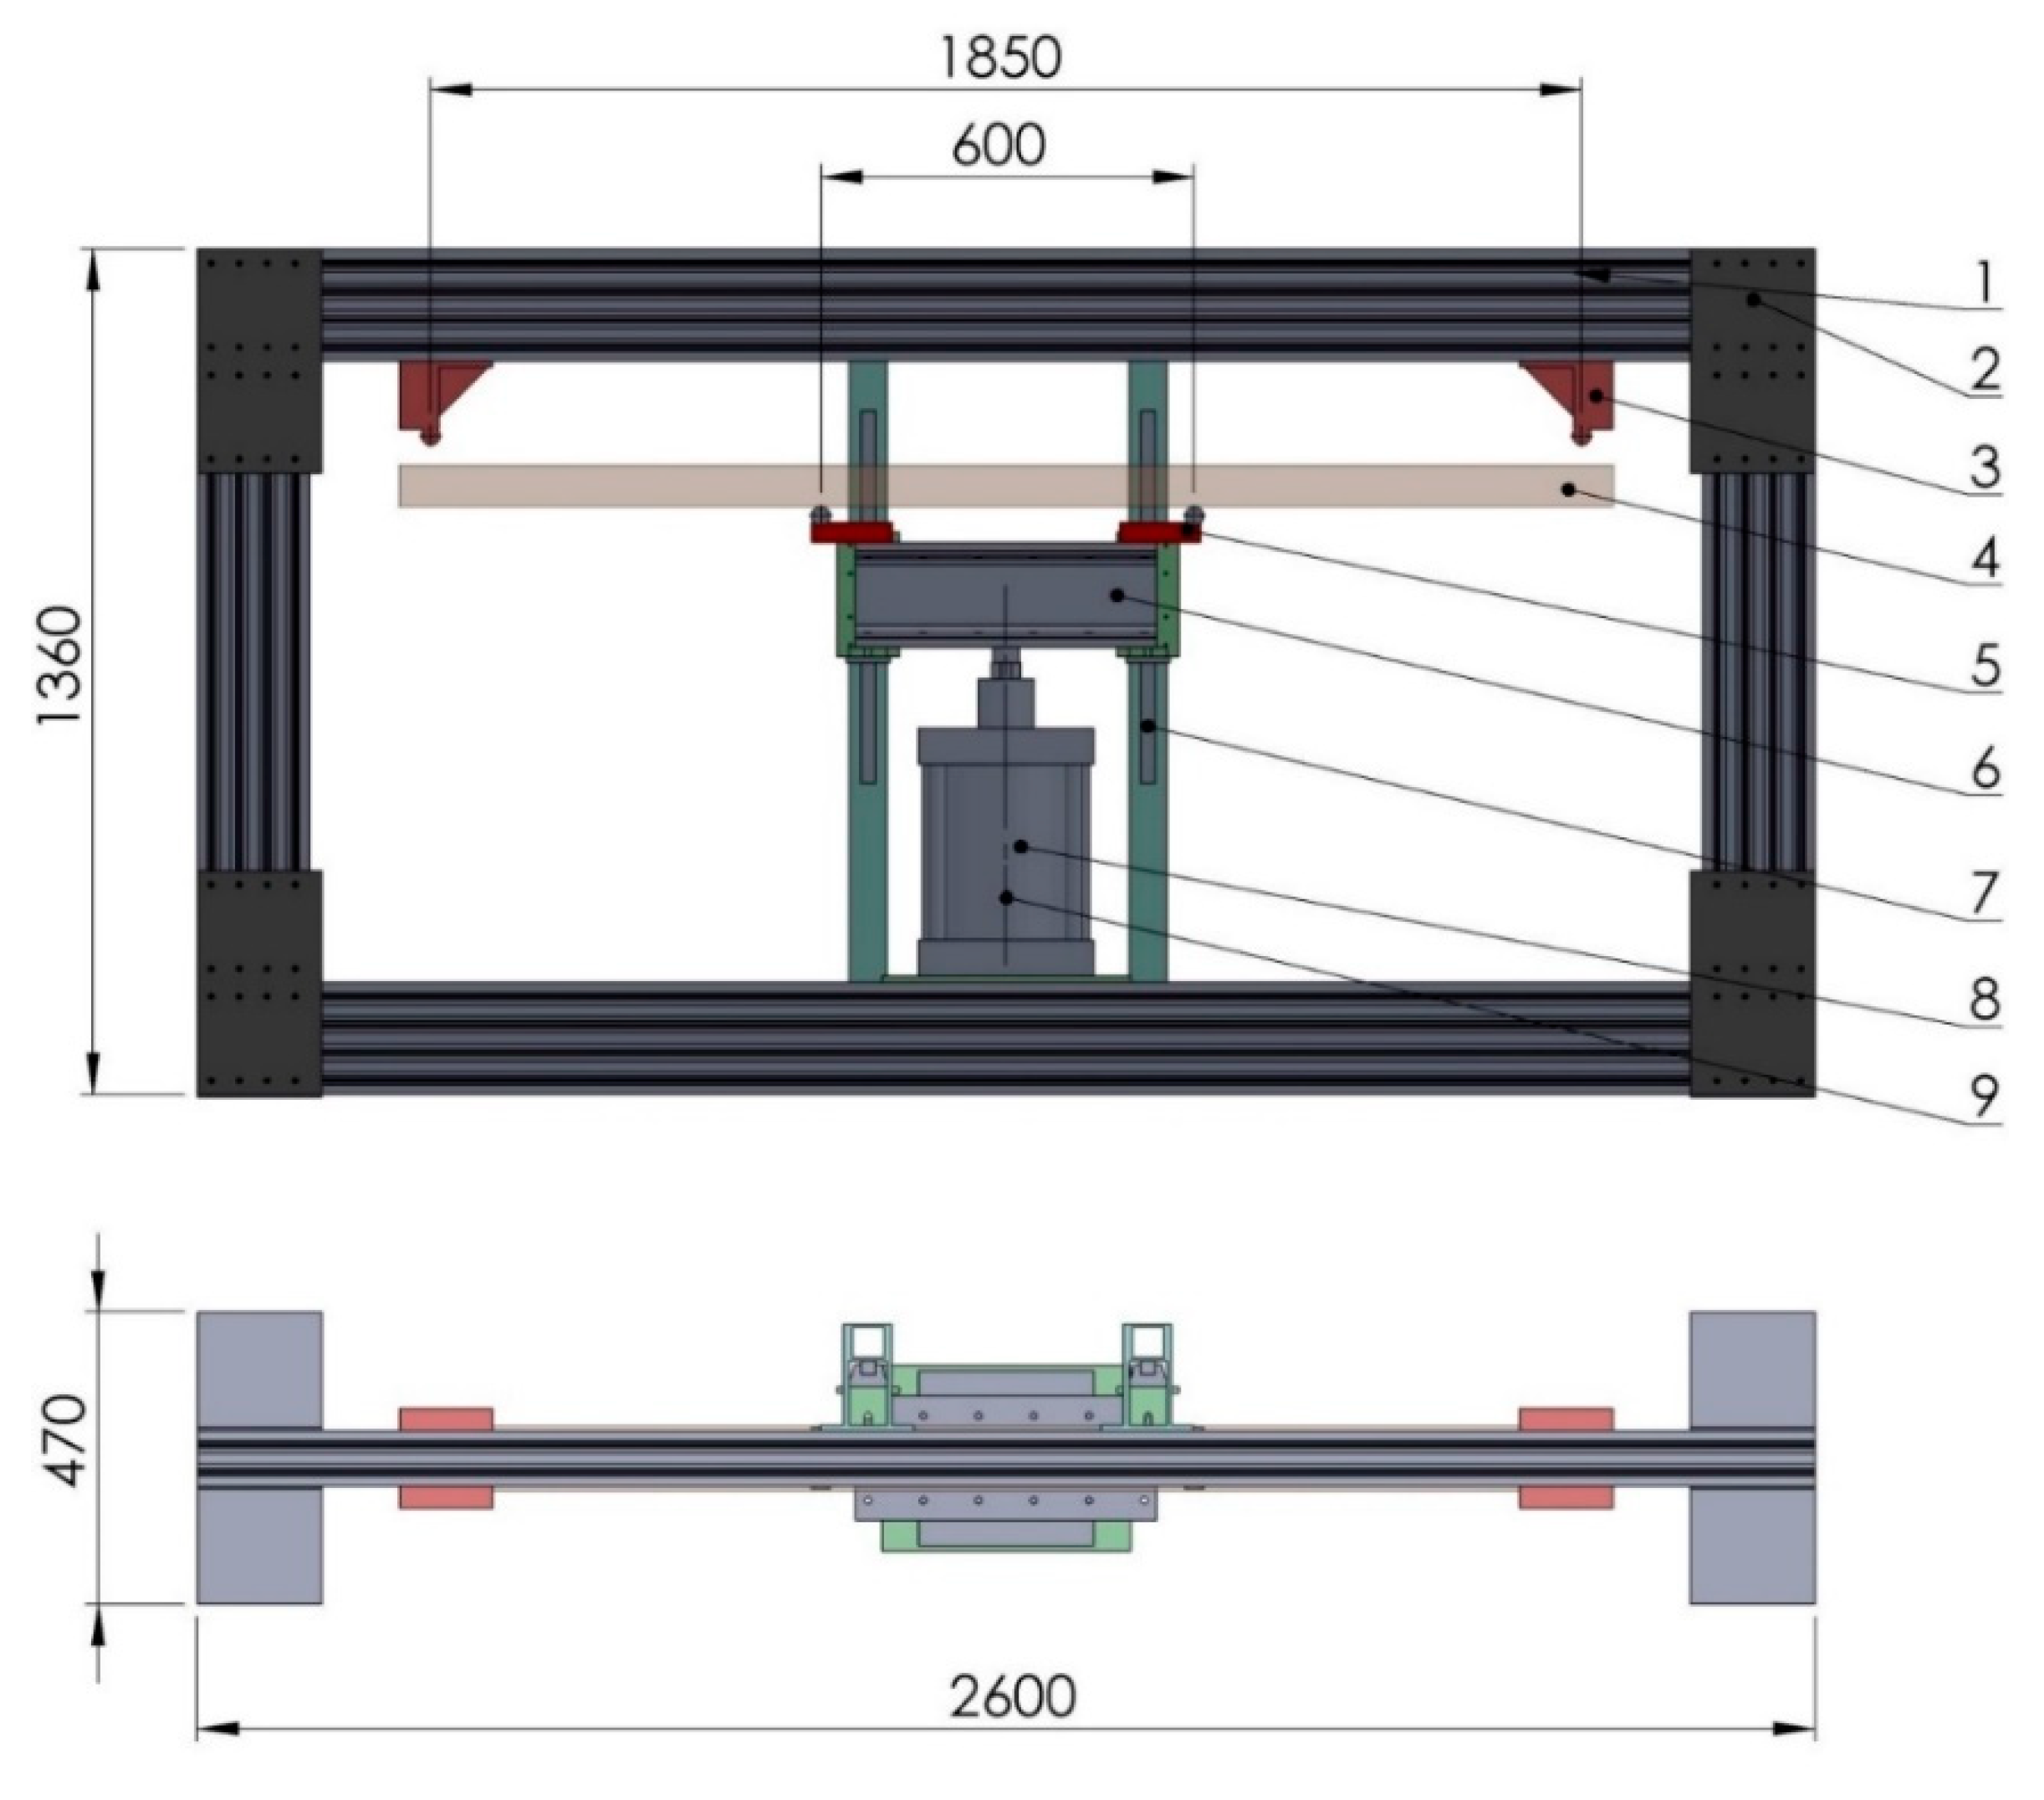
The basic guideline for the selection and design of the test rig construction was a large and fast flexibility depending on the shape and size of the test specimen. A composite drawing of the test rig structure is shown in Figure 3.
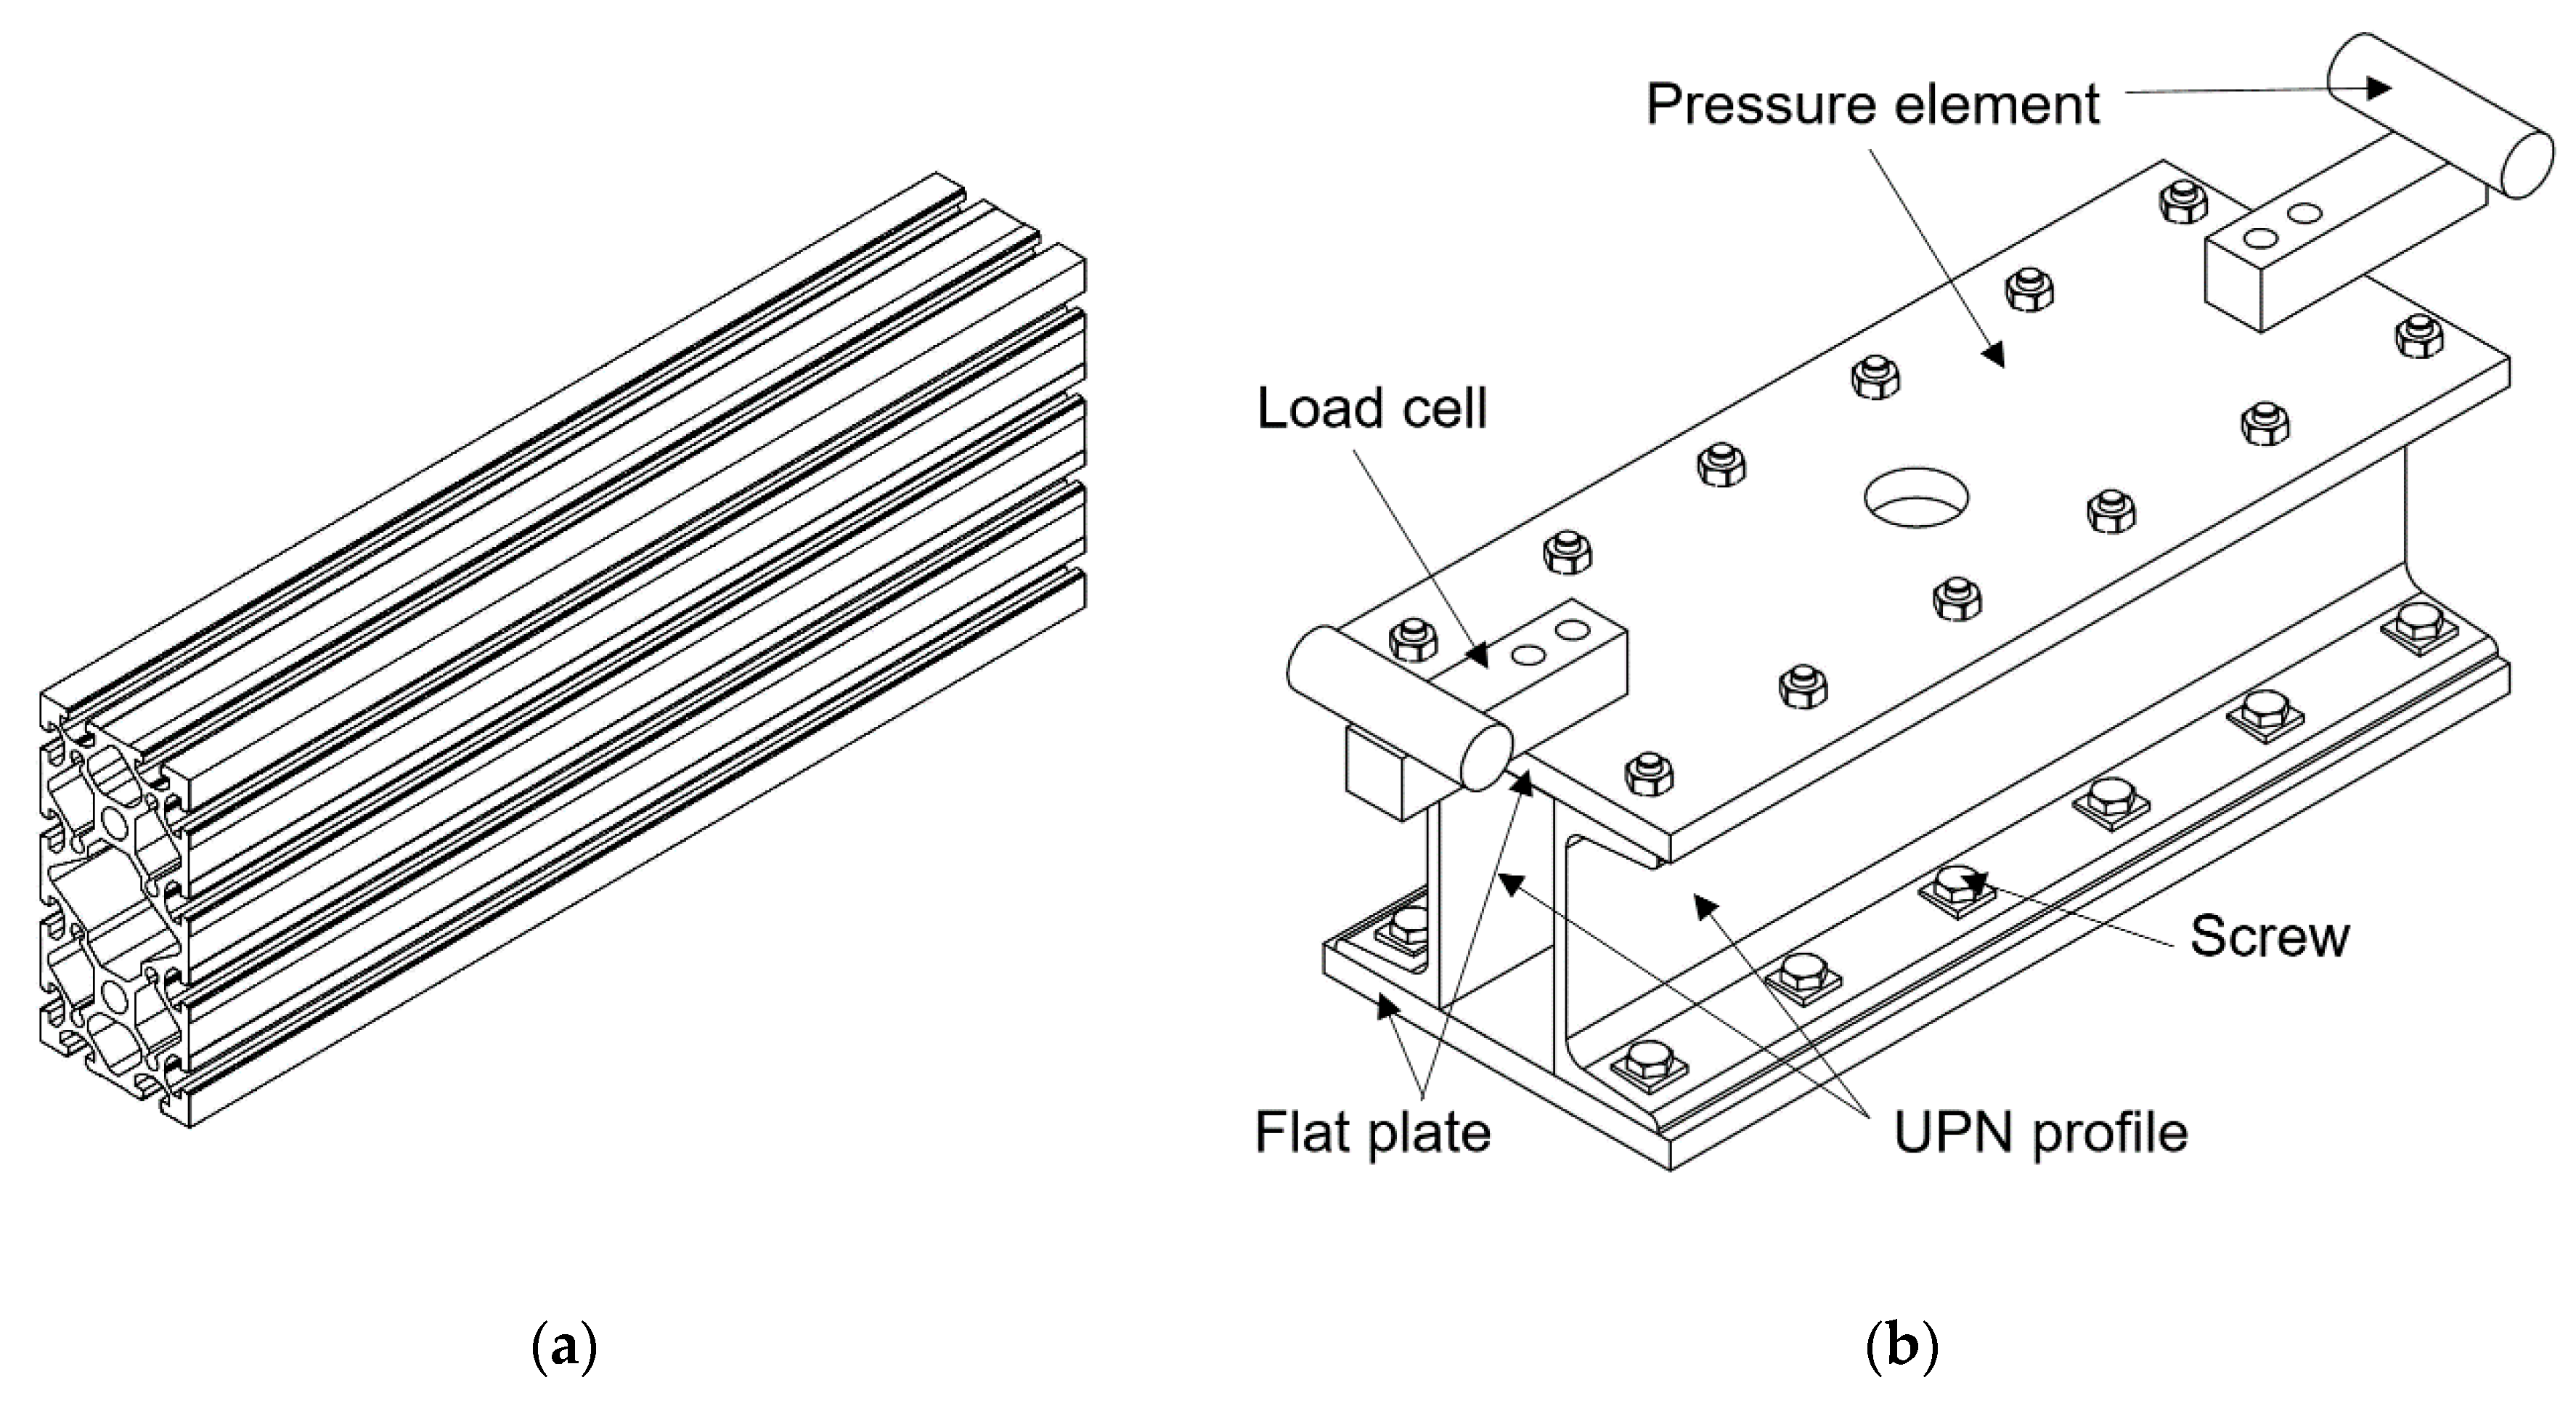
The structure consists of extruded aluminum profiles (Figure 4a). The grooves on the profile allow easy mounting of the components and adjustment to the length of the workpiece. The dimensions of the profile have been chosen according to the permissible beam deformation at the maximum static breaking loads of the reinforced beams obtained from the industrial partner. With the help of the Finite Element Method (FEM), the stress–strain analyses are carried out at critical boundary conditions, i.e., at a cylinder load of 35 kN. The final dimension of the profile is further increased by the test type, as fatigue tests are carried out—which also influences the fatigue of the test rig frame.
The press element consists of two UPN 140 profiles (Figure 4b). They are bolted to flat steel plates of 200 × 15 mm. The bolted construction enables the replacement and reworking of components from the assembly and operation of the device; it also enables the replacement of parts due to possible damage. The two FTKL 2000 load cells are bolted on the top side. The pneumatic cylinder is screwed on the bottom side via the interface (Figure 3). Due to the possibility of an asymmetrical breakage and the resulting overload of the load cell and the pneumatic cylinder, the pressure element is connected to the ball linear guideway Hiwin HGW 25 HA (Figure 3).
2.2. Test Rig Actuator System
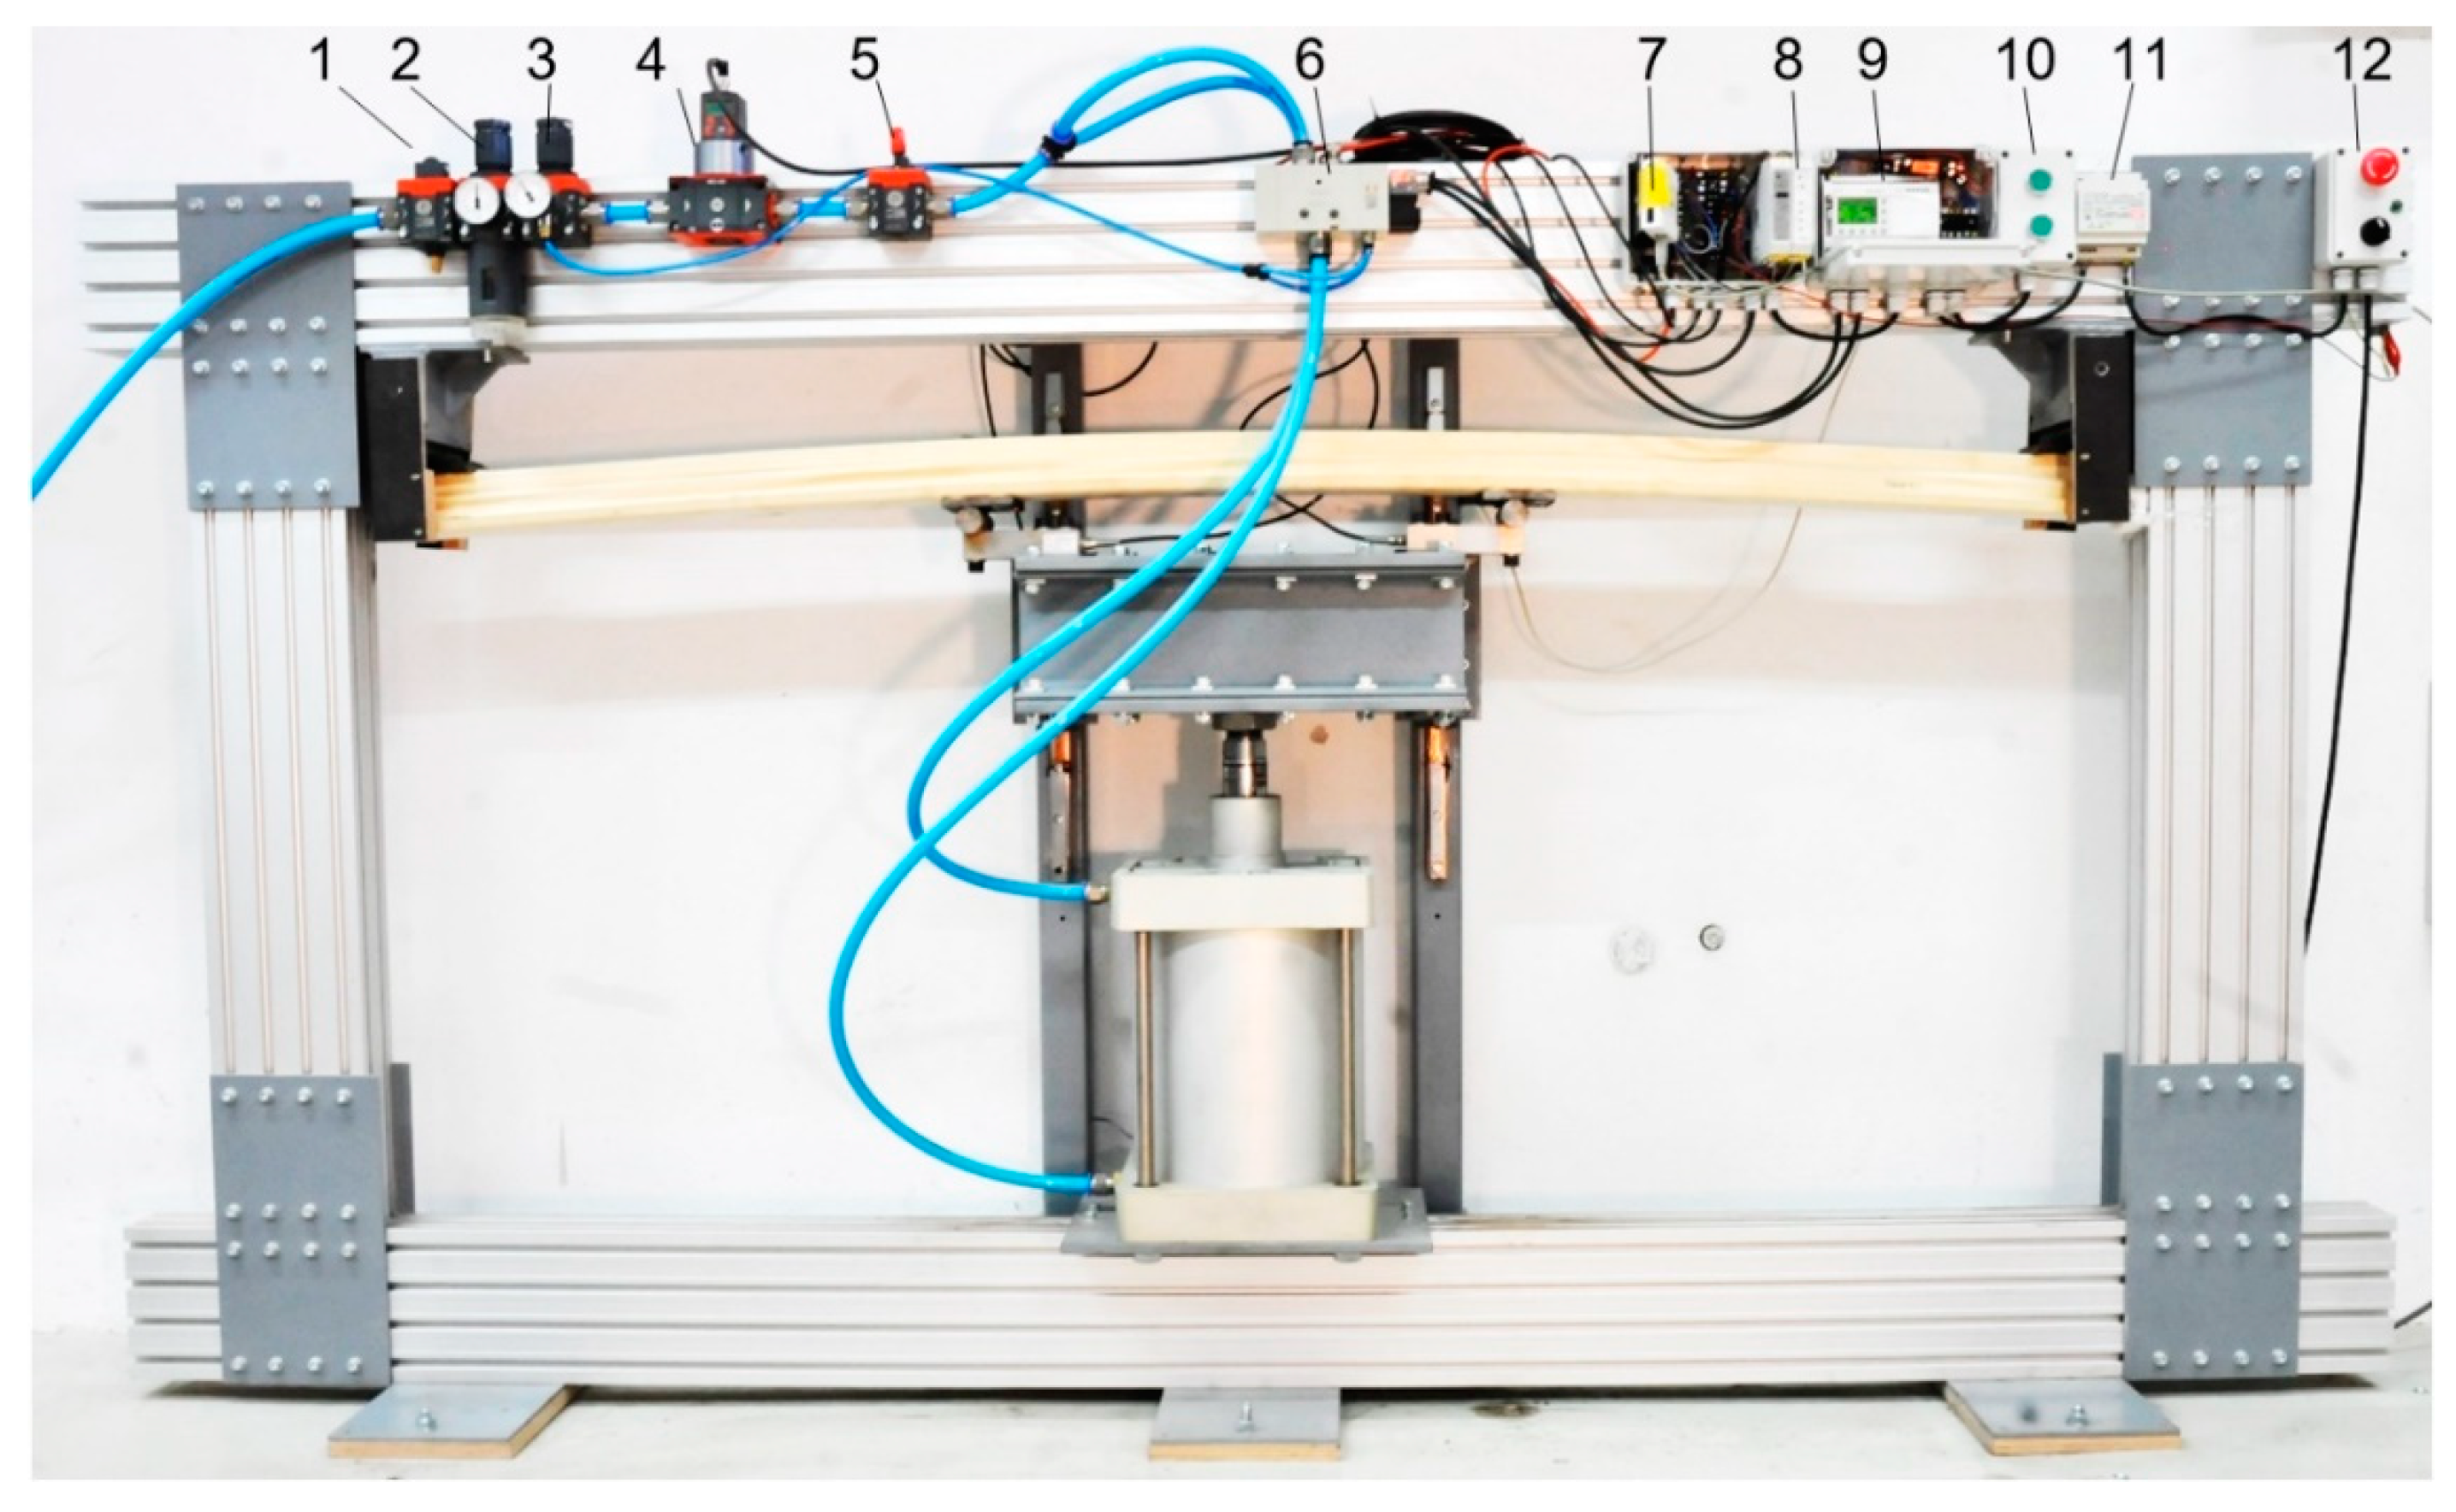
It is known from Section 2.1 that the required force is 35 kN, which summarizes the actuator selection options. To perform the cyclically pulsating load (R = 0), a pneumatic system was used consisting of a compressed air preparation unit, a control unit, a digital air regulator, two valves and a cylinder (Figure 5). In addition to the above elements, there are also switches for pressure overload and air cut-off, as well as a regulator for the supporting pressure required to operate the valves (Figure 5). The entire pneumatic system is designed for working pressures of up to 10 bar.
A two-way pneumatic cylinder with a piston diameter of 250 mm and a stroke of 200 mm was used to load the specimens (Figure 3 and Figure 5). The cylinder can be operated with air in both directions and has built-in pneumatic damping in both end positions of the piston. Inside the piston, there is a built-in magnet, through which the movement of the piston can be read with a special position sensor. The cylinder has a declared wide operating pressure range of 1.5 to 10 bar, although in combination with built-in valves it has been proven to operate at pressures down to 0.5 bar. The speed of the cylinder is declared to be 30 to 5000 mm/s, but this value depends on the air mass flow at a given pressure and the corresponding dimensioning of the supply system. Initially, the cylinder operates in the lower speed range (slow movements). Theoretically, the cylinder is capable of generating a thrust force F in the range between 2454 N and 34,361 N, which is directly dependent on the pressure (0.5 to 7 bar) and the piston area (diameter 250 mm). In the opposite case, the traction mode, in which the piston returns to the starting point, taking into account the reduction in the piston area by the mounted piston rod (diameter 50 mm), the traction force is reduced “only” by 4% compared to the thrust force. To determine the pressure at which the cylinder must be actuated to achieve the target force at which the loads are applied, the characteristics of this dependence must be measured. For this purpose, the thrust force of the cylinder on the load cell at the set pressure has been measured, thus determining the pressure–force relationship.
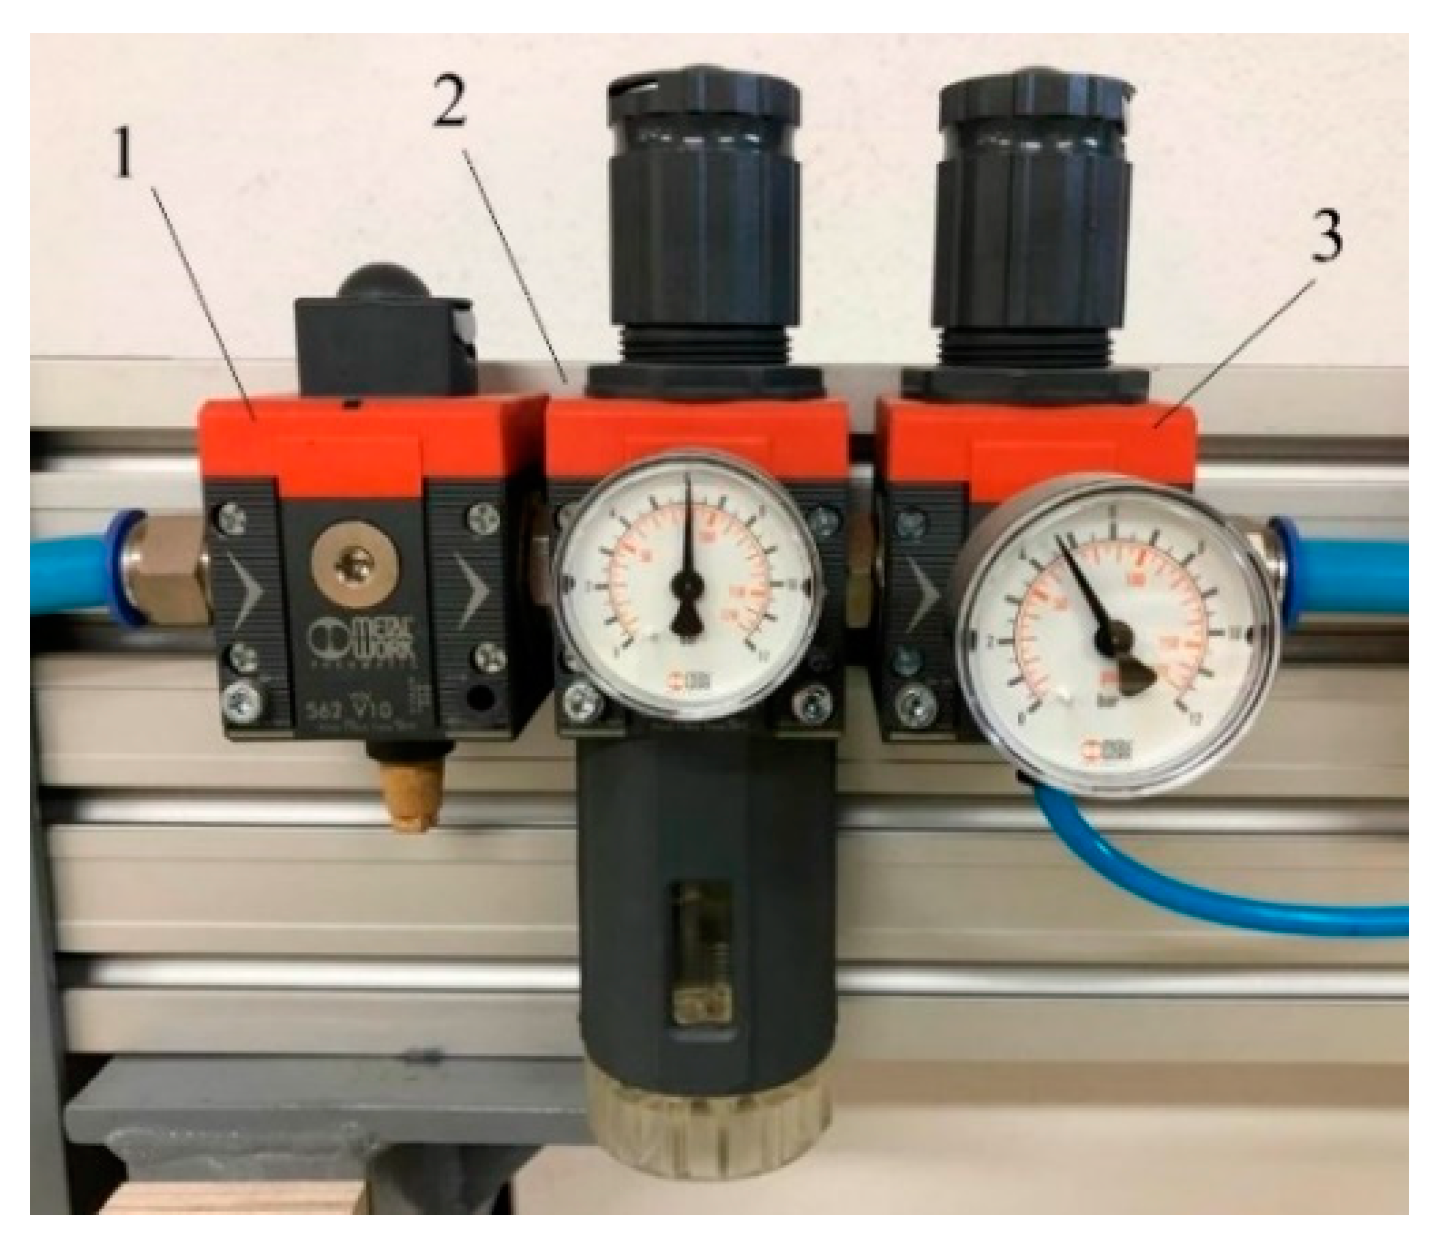
Before air is introduced into the pneumatic system, it must be properly filtered and regulated. The air for such a system must not contain lubricants, since all pneumatic elements are already supplied with the applied lubricants and the additional use of these lubricants could contribute to the acceleration of the wear process or to the improper operation of the elements. Excess moisture that accumulates in the compressed air supply system must be removed as it causes corrosion of the pneumatic elements. It is therefore recommended to add a condensation and solid particle collection unit for each pneumatic system. Such an element is normally located on the combined unit with the intake air regulator (Figure 6).
The pressure in the entire pneumatic system is adjusted with the main regulator. The actual air supply to which the test unit is connected can produce a maximum pressure of 7 bar. An additional regulator is included in the part of the preparation group that only serves to provide the supporting pressure for the valve control (Figure 6). There is also a manual shut-off valve at the inlet before the regulators, which allows the entire system to be disconnected from the air supply and is used for shutdowns or non-operational and maintenance work on the test rig (Figure 6).
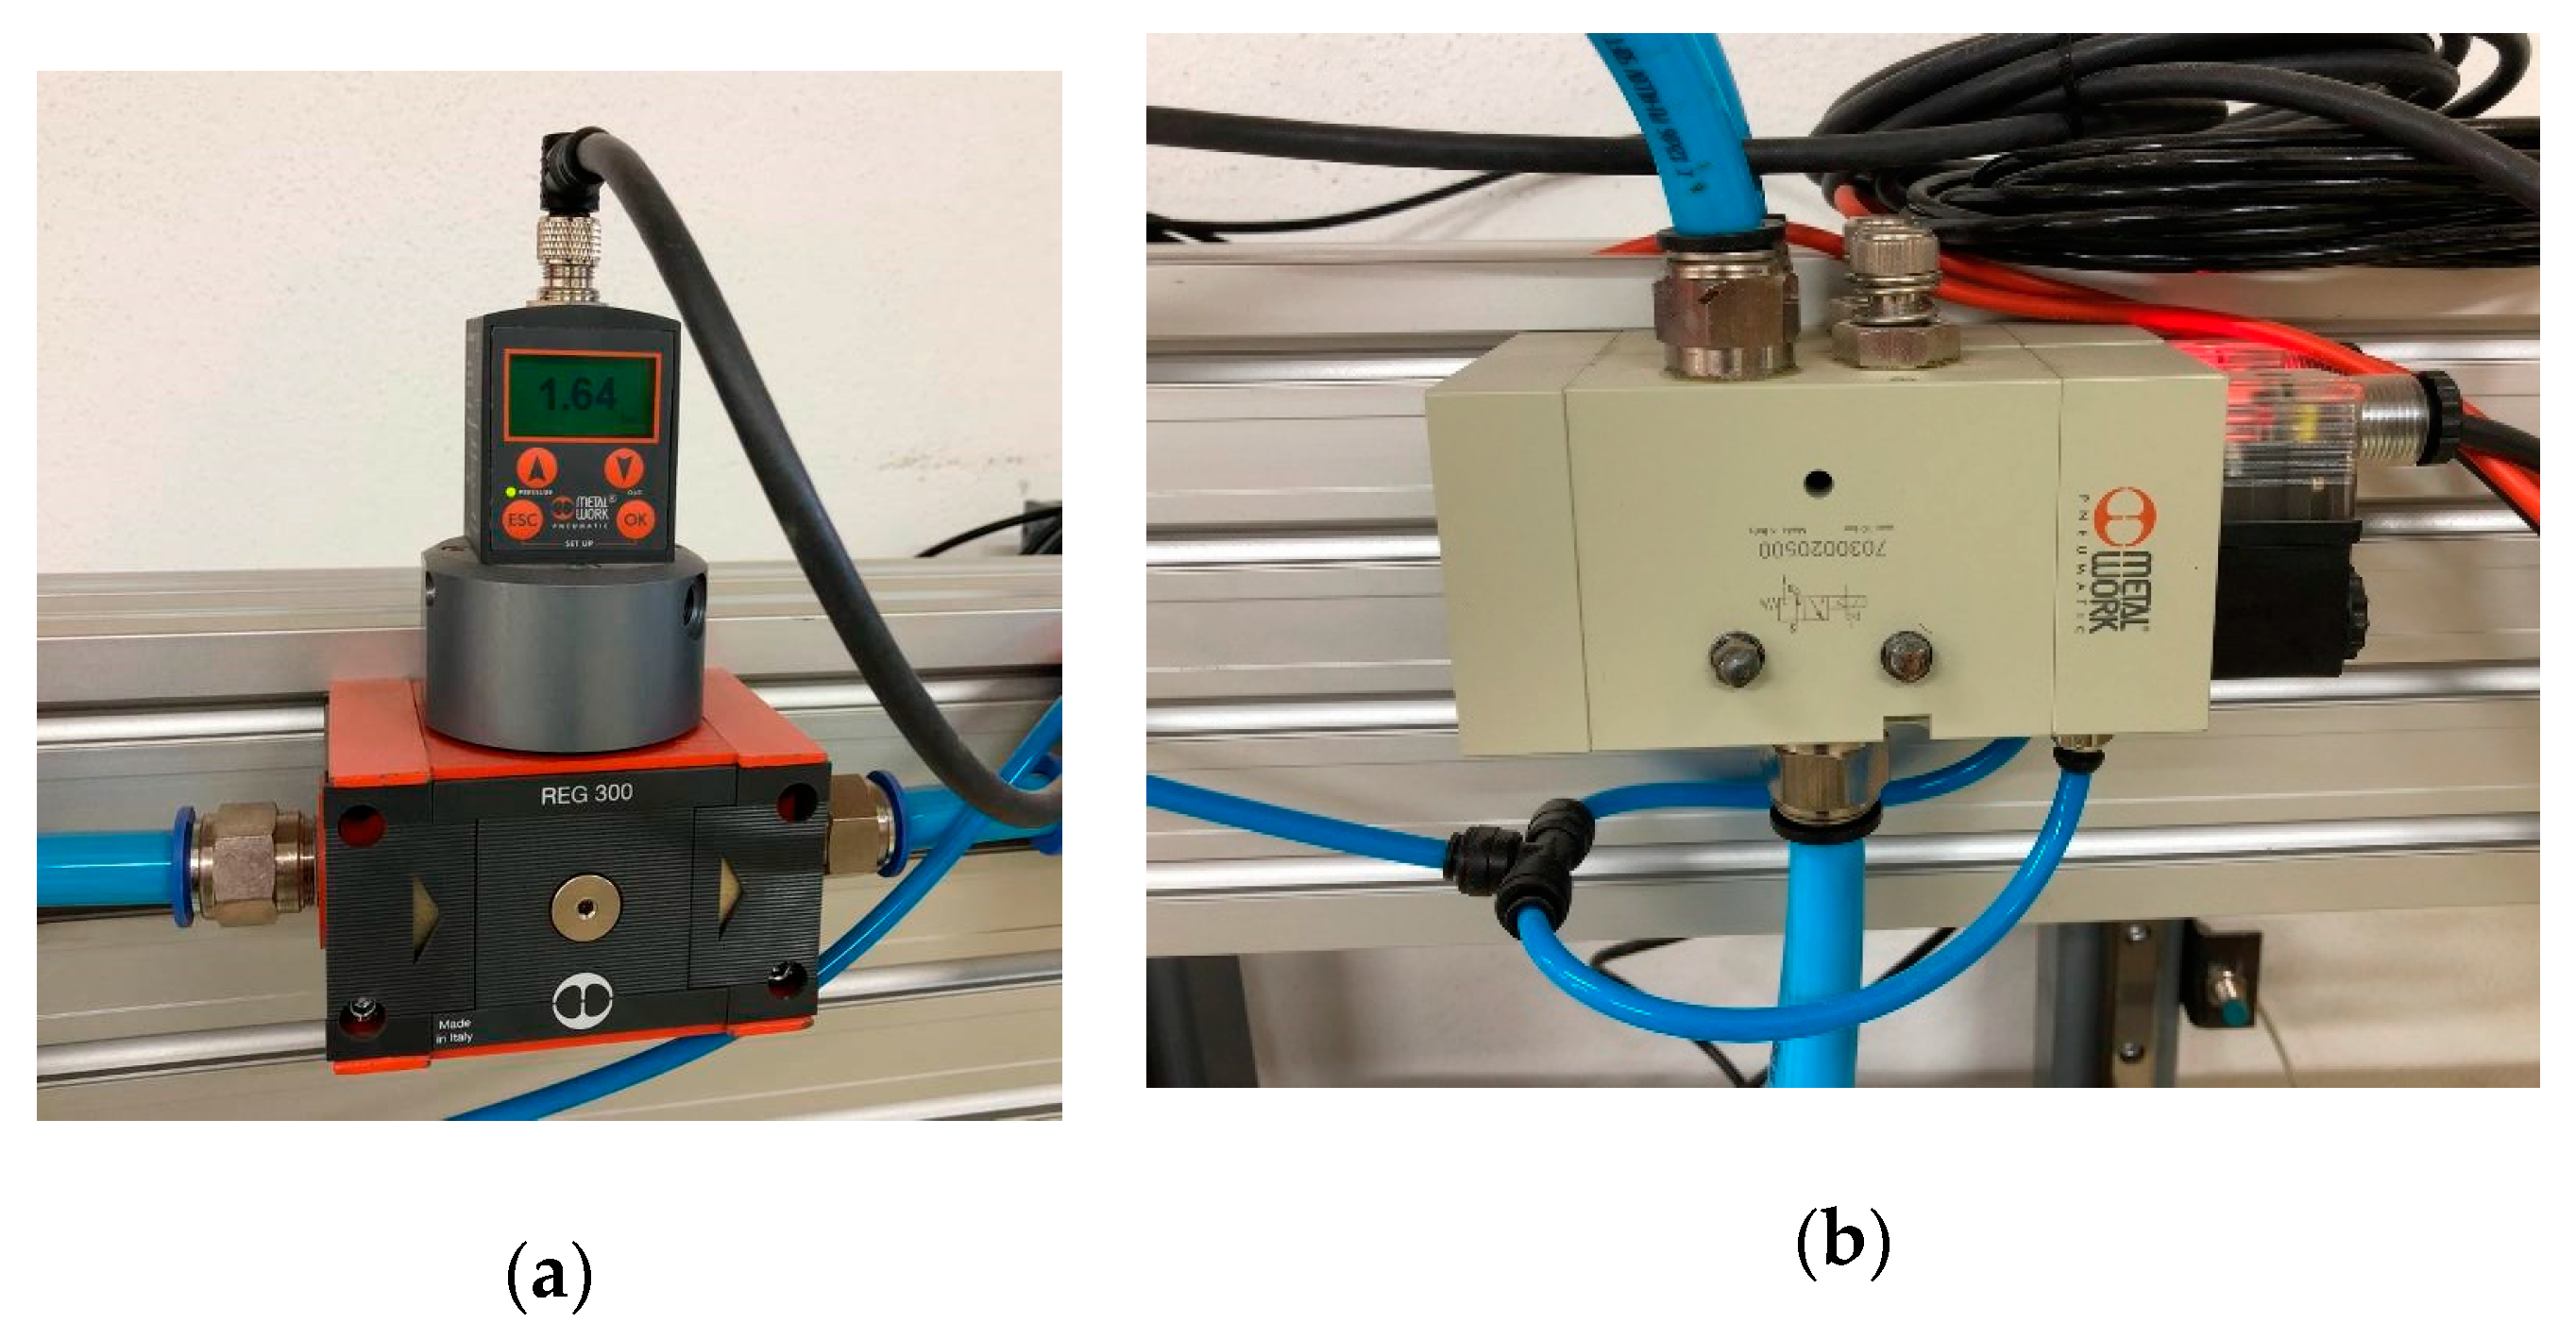
In order to precisely determine the air pressure and to maintain its value independent of fluctuations in the supply system (taking into account that the supply pressure must not be below the set point), the device is additionally equipped with a Regtronic 300 digital pressure regulator, which precisely monitors the pressure and readjusts it if necessary (Figure 7a). The regulator has a screen on the front panel, which displays the actual pressure, as well as buttons for setting the desired pressure and other pressure control parameters. It is also equipped with an analog input and output, digital communication RS 232 and an alarm output.
The built-in electropneumatic 3/2 valves are monostable, i.e., they have only one “energised” or activated state, which is achieved by switching on the electromagnet which presses inside the directional control valve, thus switching between the pneumatic channels. If the power supply to the electromagnet is interrupted, the directional control valve returns to its original state due to the built-in spring, which acts in the opposite direction than the electromagnet. In this way it is possible to switch electronically between two pneumatic channels. The system uses two valves, each of which controls the movement of the cylinder in one direction only (Figure 7b). Therefore, periodic switching between the two valves was performed to achieve a cyclic operation of the cylinder suitable for a fatigue test rig. Built-in pneumatic valves require a back-up pressure to perform valve switching at very low pressures (practically 0 bar and above). The minimum required value of back-up pressure value for these valves is 2.5 bar.
2.3. Control System of the Test Rig
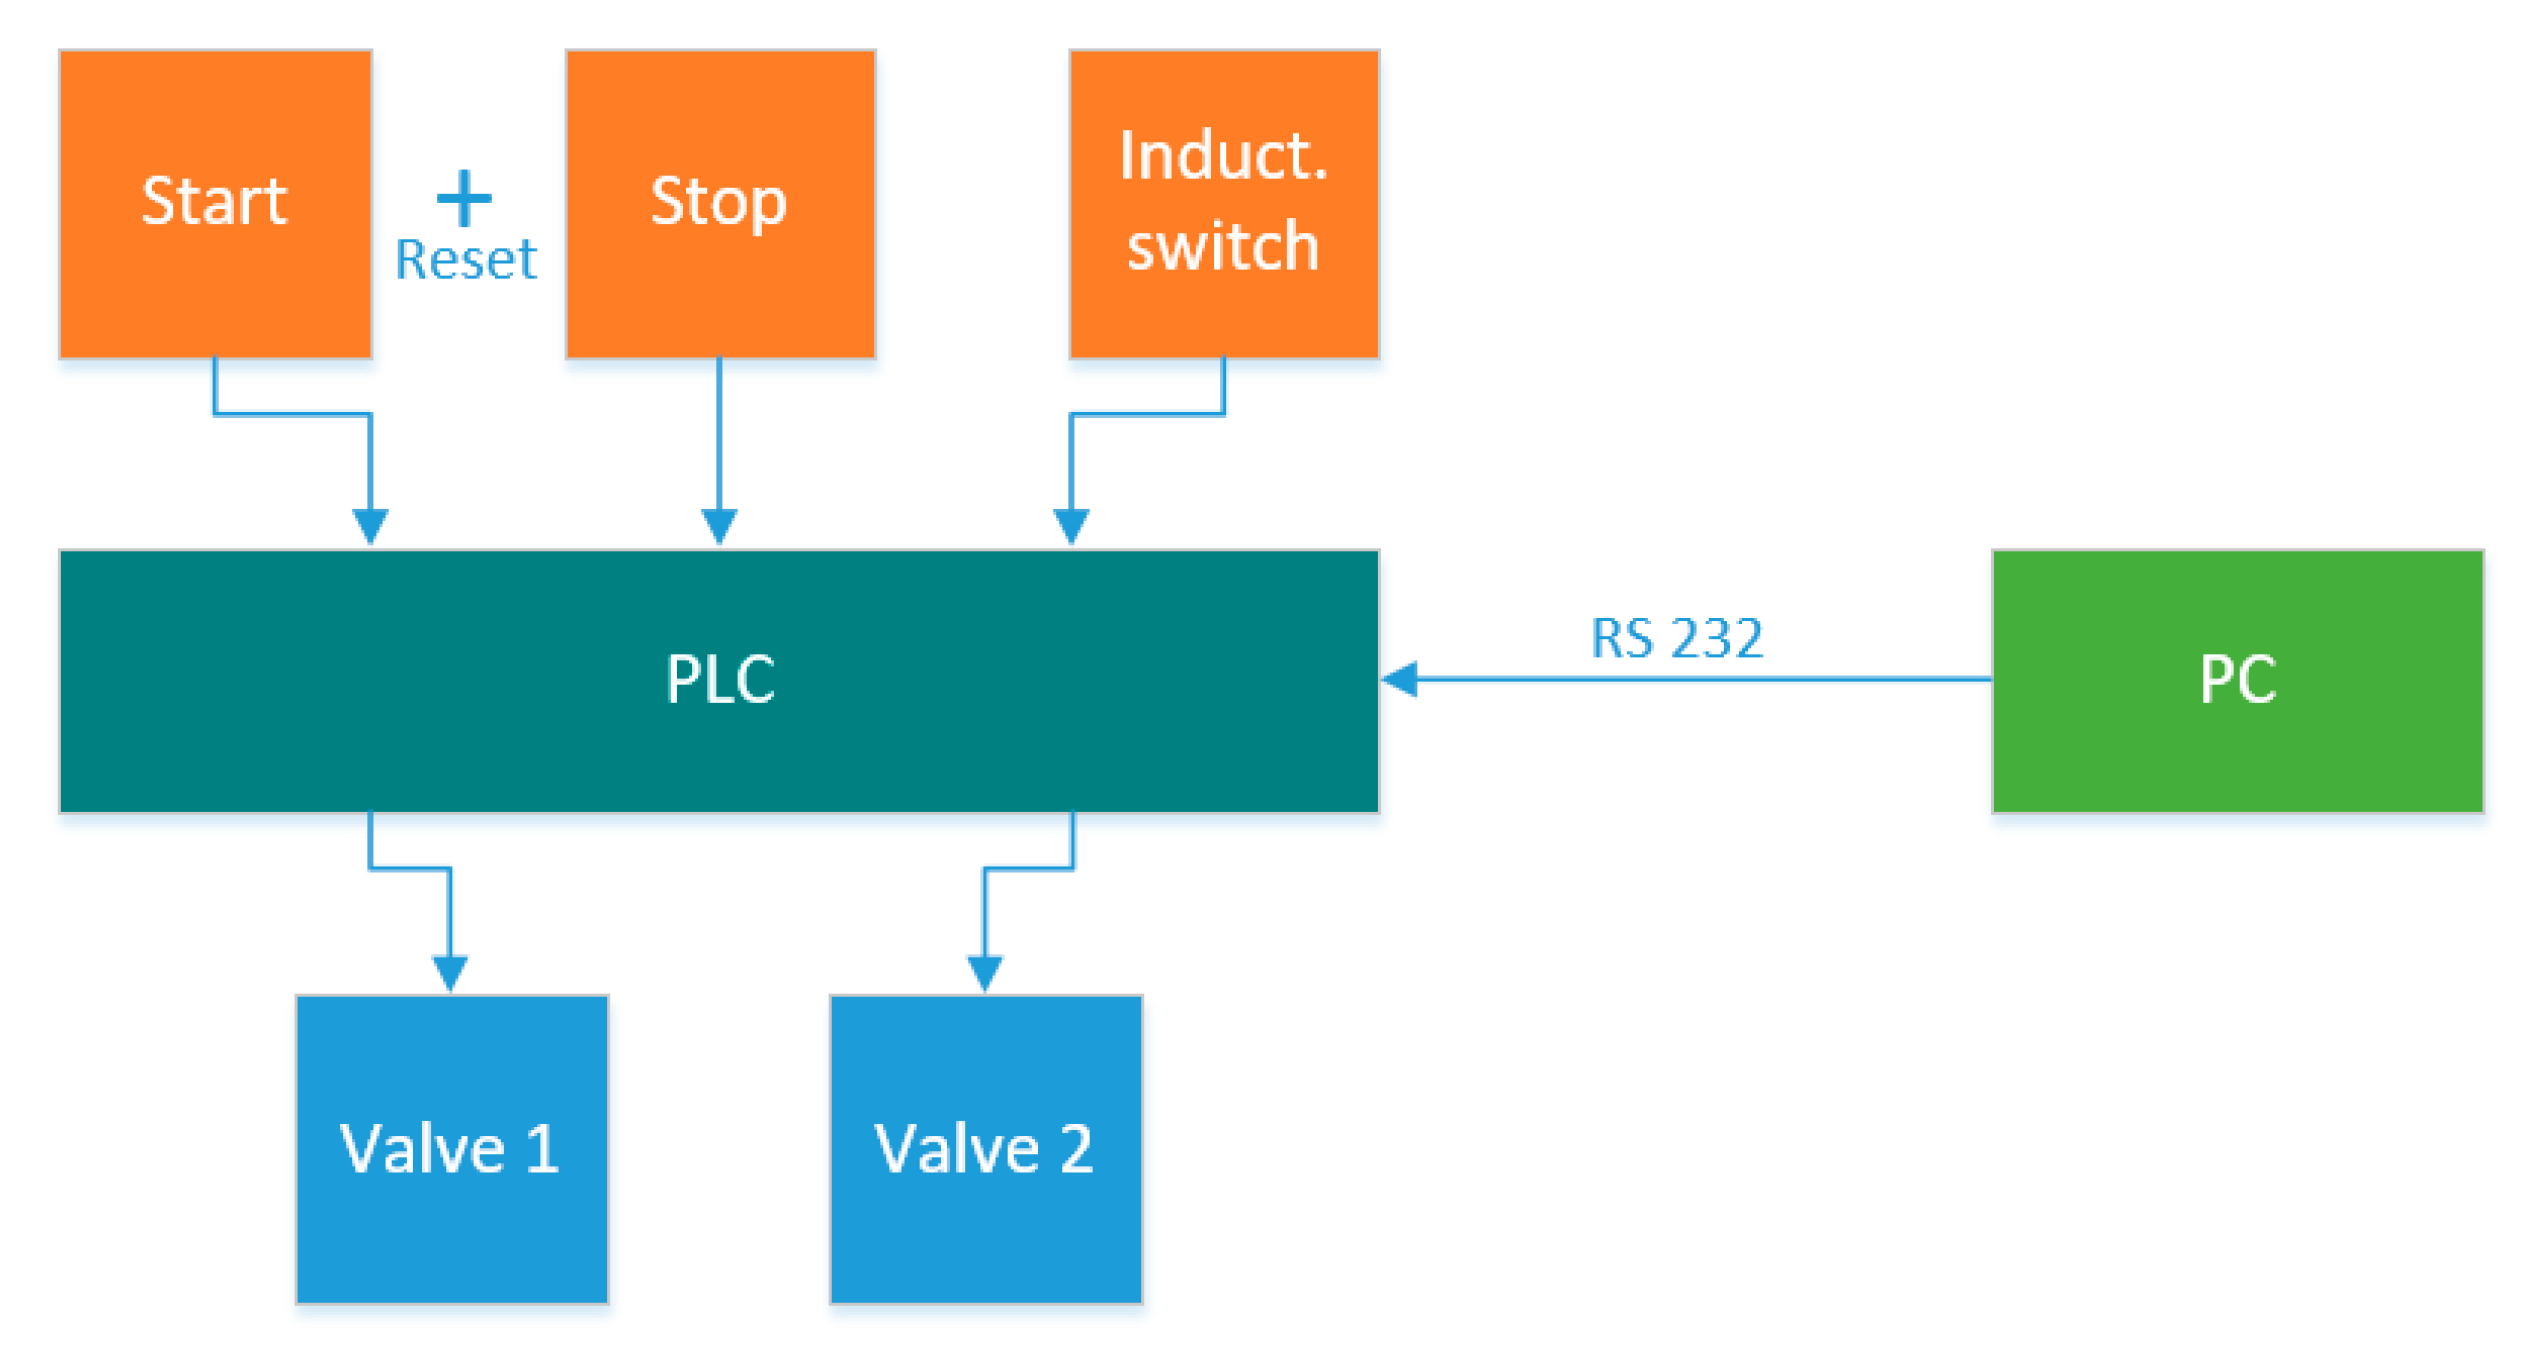
The control system of the fatigue test rig ensures the cyclic loading of the test specimen with the possibility to change the test dynamics; it counts the number of loads and stops the test in case of failure of the test specimen (inductive switch). For this purpose, a programmable logic controller (PLC) can be used. The block diagram of the control system of the fatigue test rig is shown in Figure 8.
A Start button (upper button) is used to start the experiment and a Stop button (lower button) to stop the experiment (Figure 9). Pressing both buttons simultaneously clears the PLC counter and is used before starting a new experiment. The inductive switch serves as a safety switch and is only triggered when the cylinder piston exceeds a certain stroke (approximately 150 mm). This is set manually by moving the sensor attached to the guides, which the cylinder piston only reaches when the test specimen collapses. Two cylinder control valves are connected to the relay output of the controller. A Mitsubishi Programmable PLC Logic Controller with the designation AL2-14MR-D was used to control the pneumatic system (Figure 9).
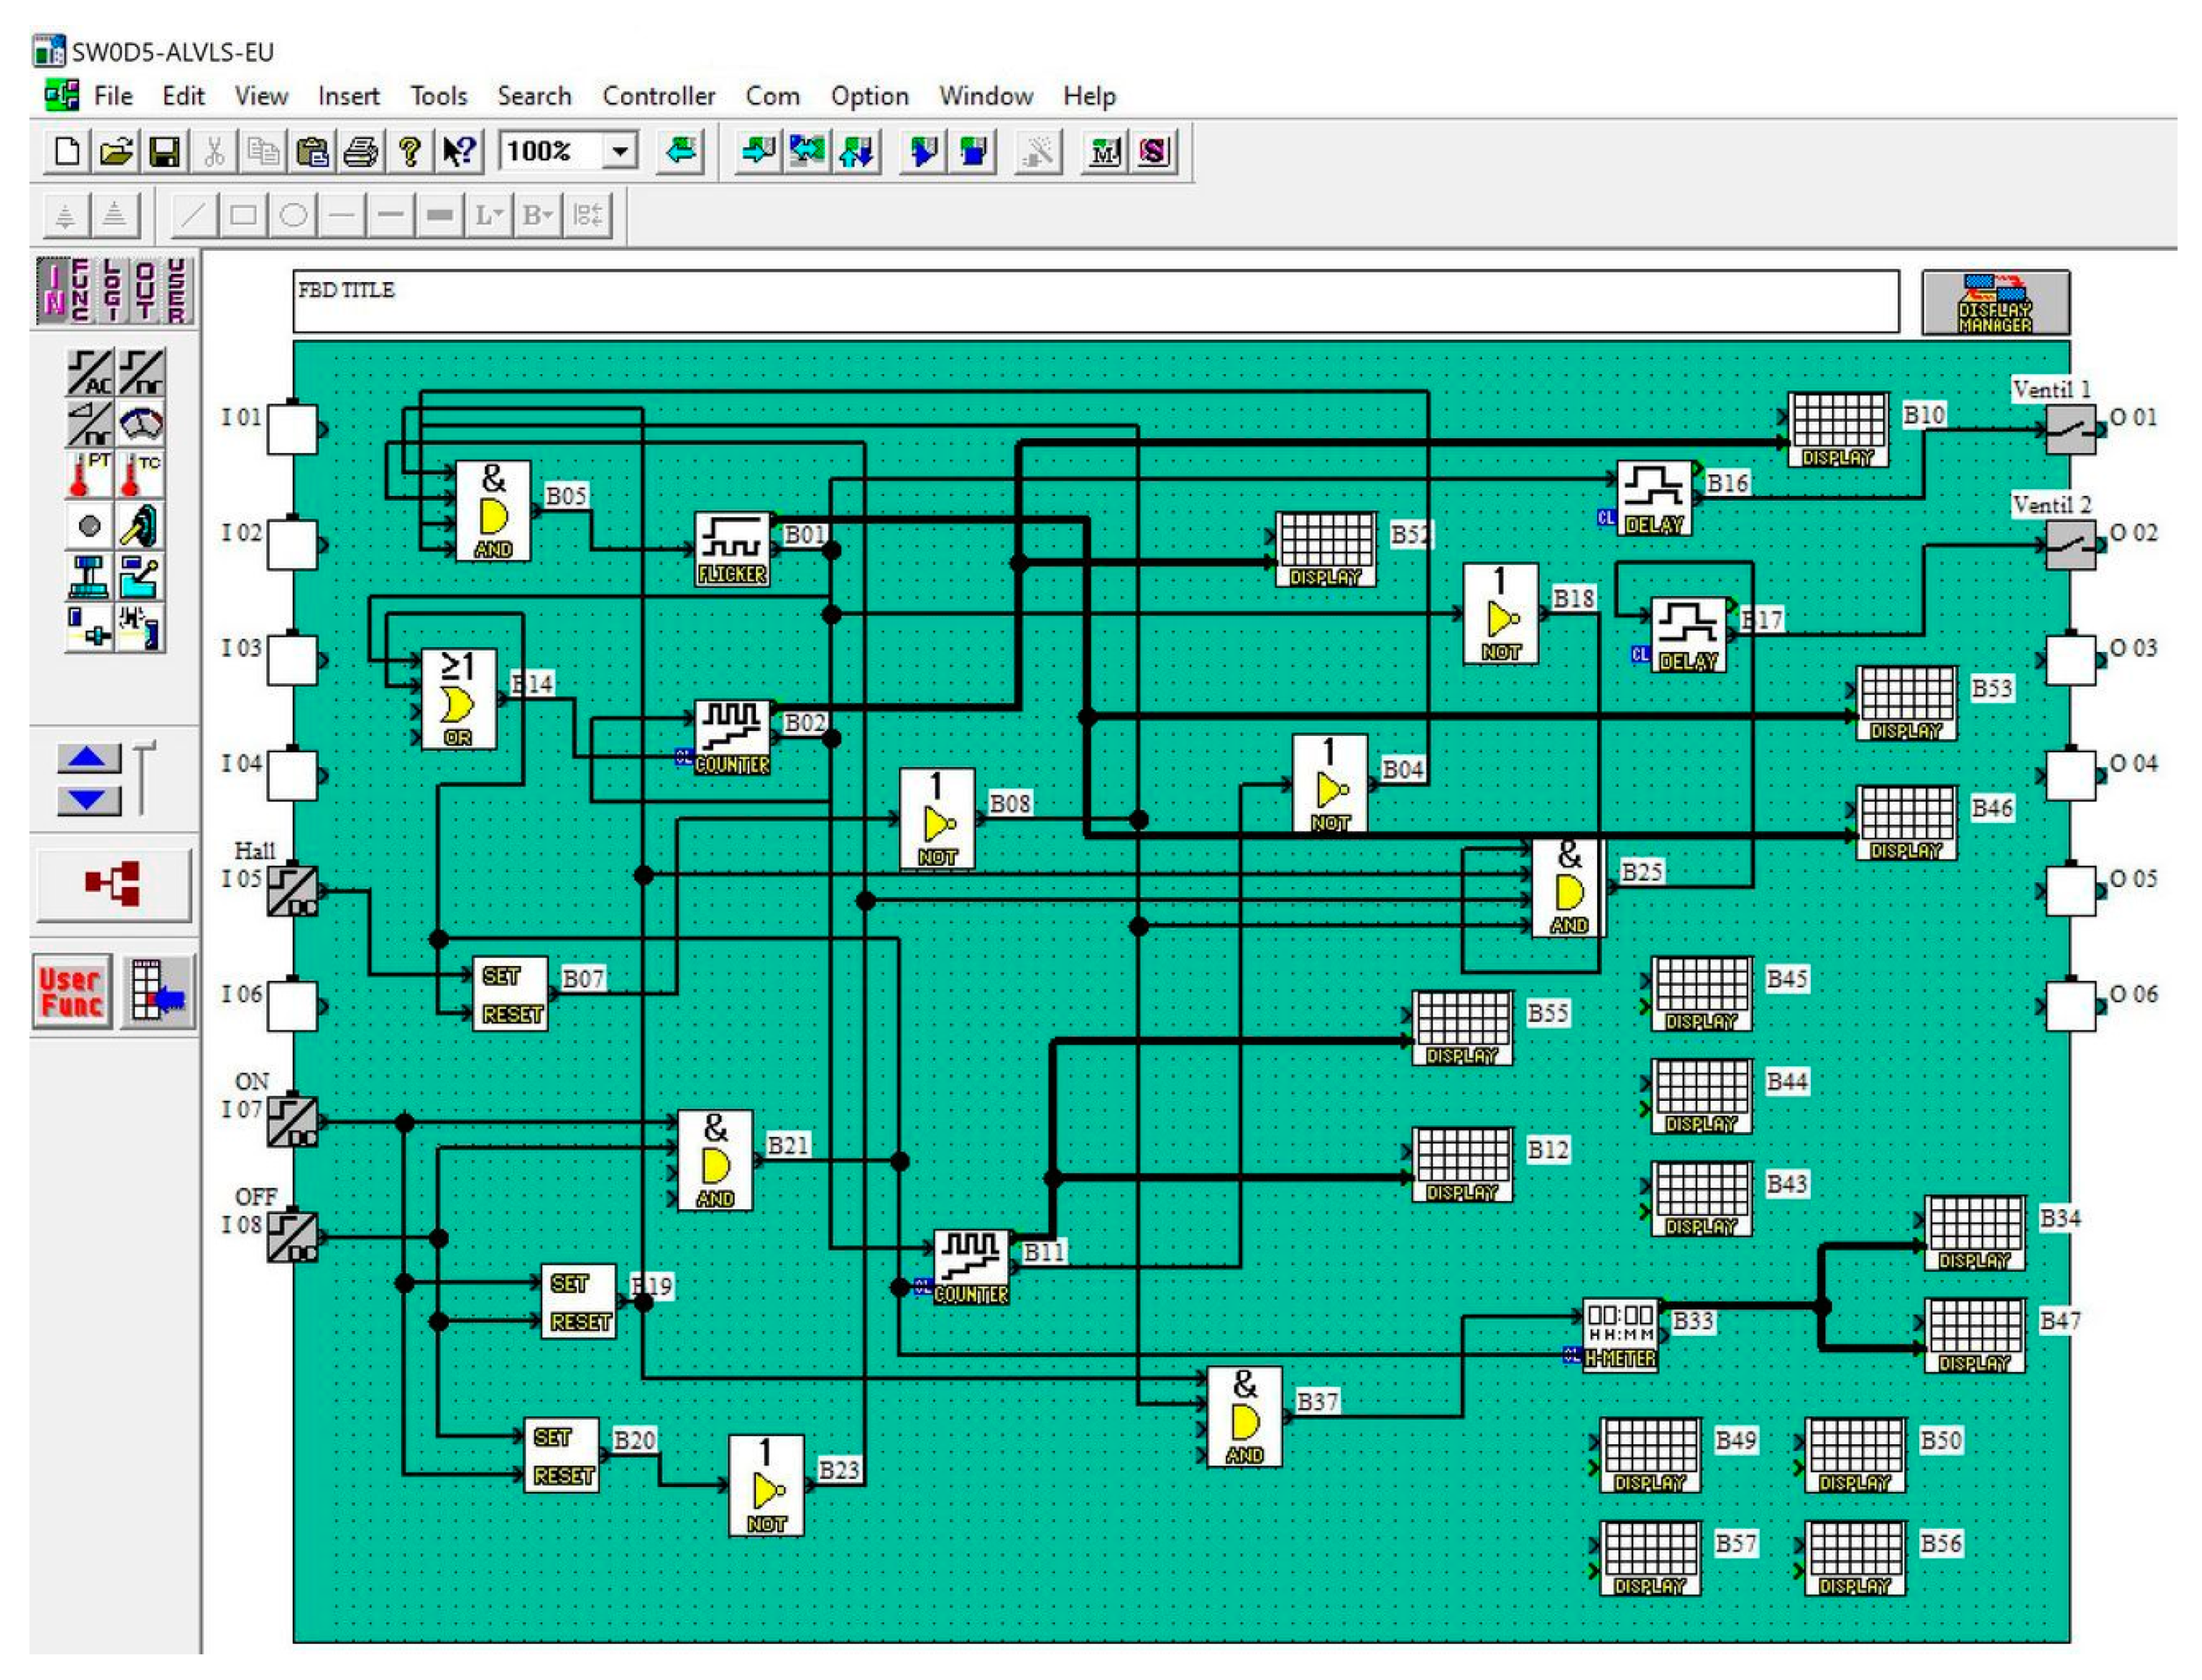
This controller has eight digital inputs and six relay outputs. The controller has an LCD screen (Figure 9) on the front panel where you can display various parameters and data. The PLC has been programmed so that the loading and unloading time can be adjusted with the buttons next to the screen (Figure 9). The main programming of the PLC is done by the PC program Alpha Programming (Figure 10).
The controller has been programmed so that when all operating conditions are met, the system switches between the valves according to a predetermined dynamic. The dynamic is defined by the “flicker” function, where both the duration of the on and off time can be set. These values are general but can also be set individually if required. During the test, the recording of the load cycles was carried out with a counter. In certain test cases, the number of load cycles can be much higher than the upper limit of the counter (215 = 32,768). A solution was therefore found by using two counters, with the limit of the first counter set at 10,000 units and an additional counter that only counts tens of thousands. This means that the system can currently run up to a good 327 million cycles before stopping, as long as it does not meet any of the test stop conditions. The controller screen displays information about the duration of each experiment, the number of cycles completed and the valve opening times. Due to the dimensioning of the system, the fatigue frequency for the current setup is limited to a maximum of 0.063 Hz and corresponds to a 16 s cycle interval—an eight second load period is followed by an eight-second relaxation period.
2.4. Testing Rig Measuring System
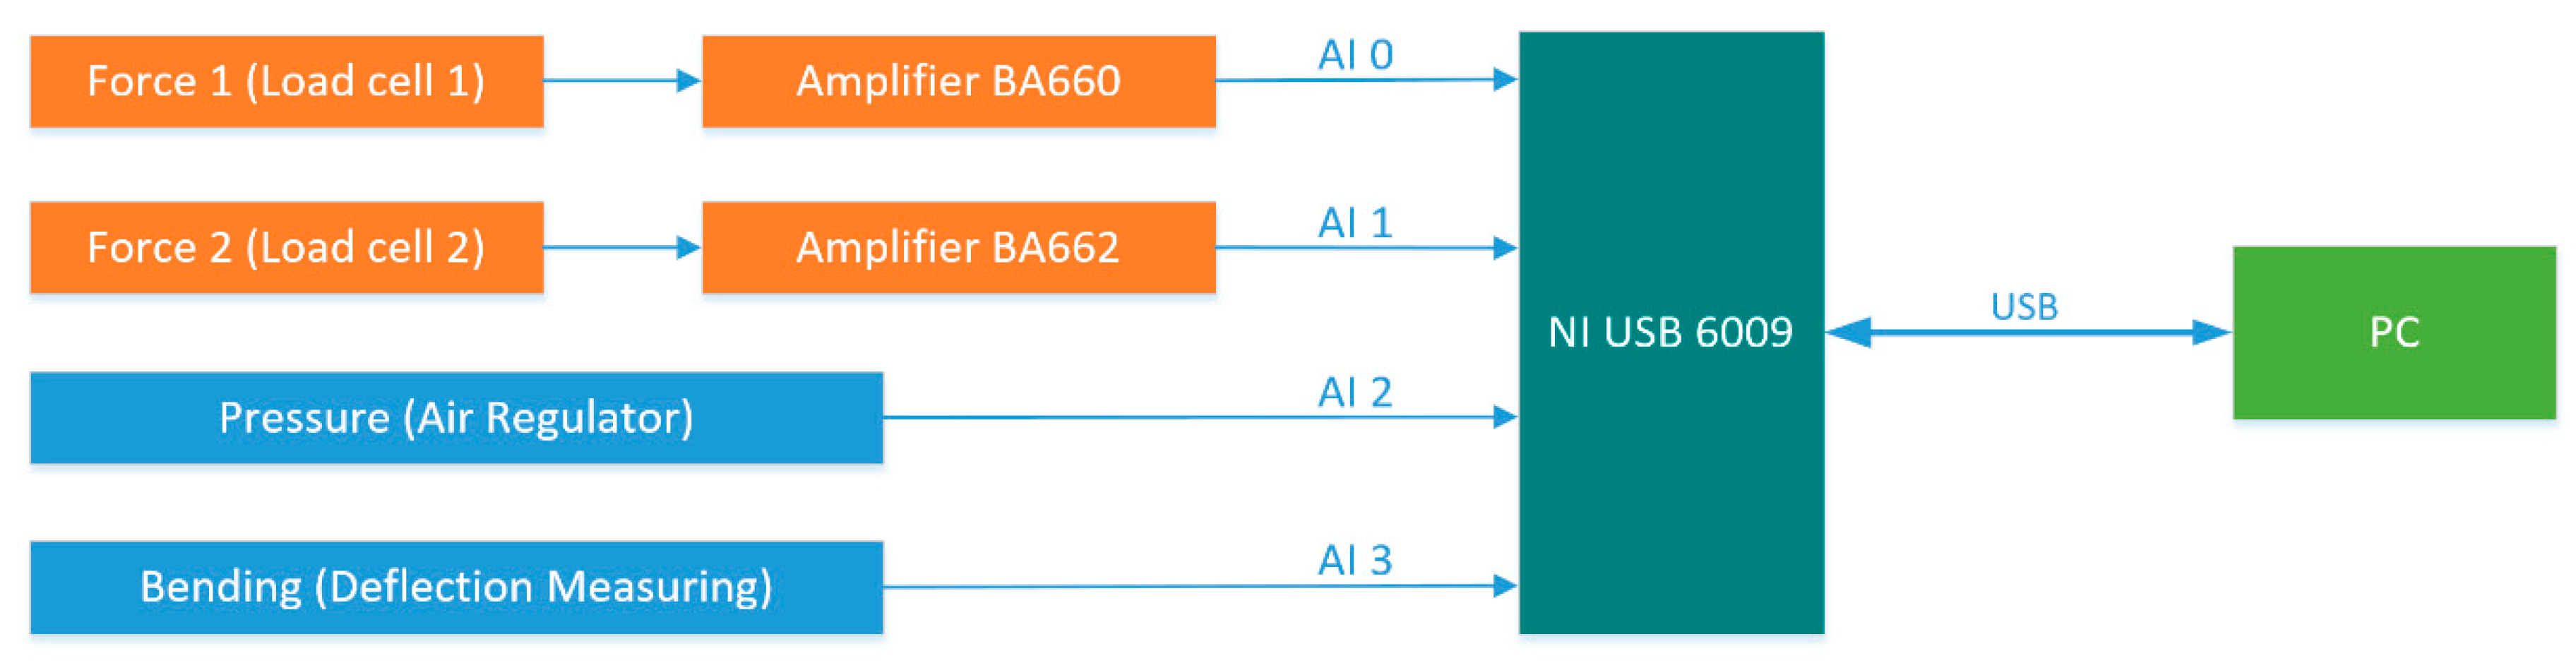
During the test the number of load cycles, the load force and the bending of the test piece were measured. Figure 11 shows a block diagram of an existing measurement system.
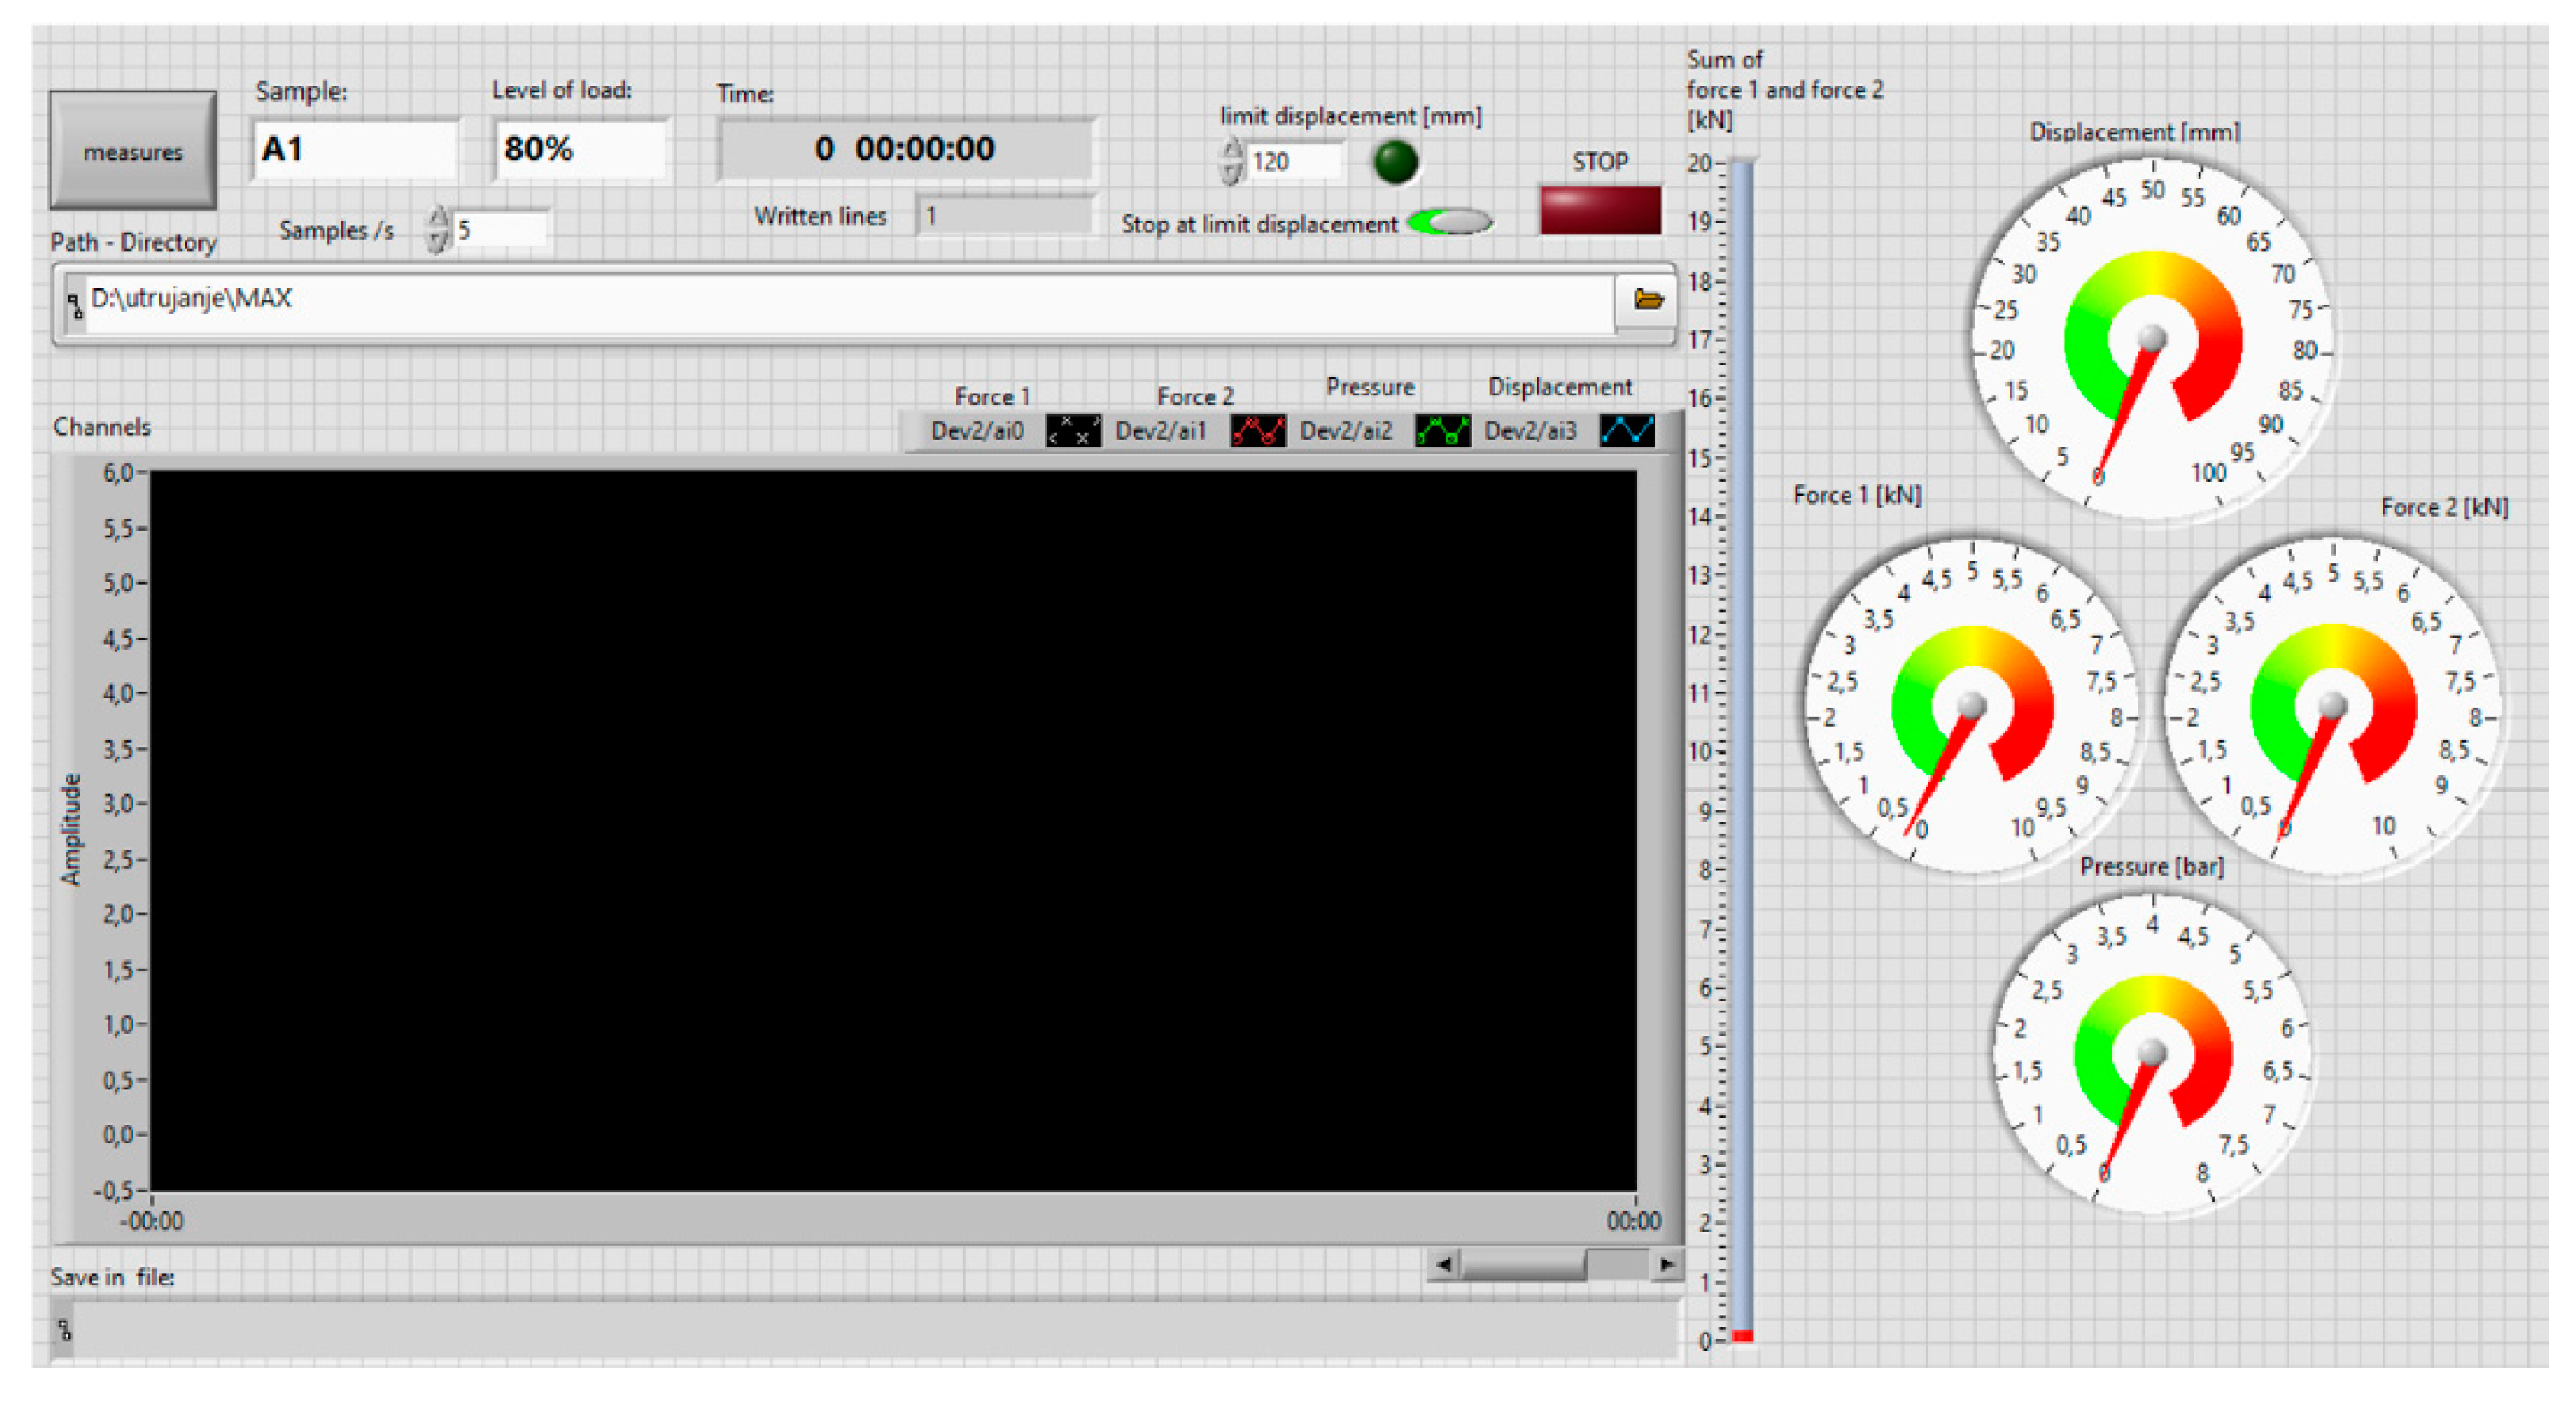
For recording the measured values of the sensors, the measuring interface of the company, National Instruments, with the marking NI USB 6009 (Figure 11) was used, and in the software package, LabView, a special software interface (Figure 12) was developed, which allows one to display and record the measurements in the desired binary file (TDMS) and to stop the measurements if the test specimen collapses. Due to the complexity and the large amount of data, the analysis of the measurement results is performed separately.
2.4.1. Measurement of Input Force
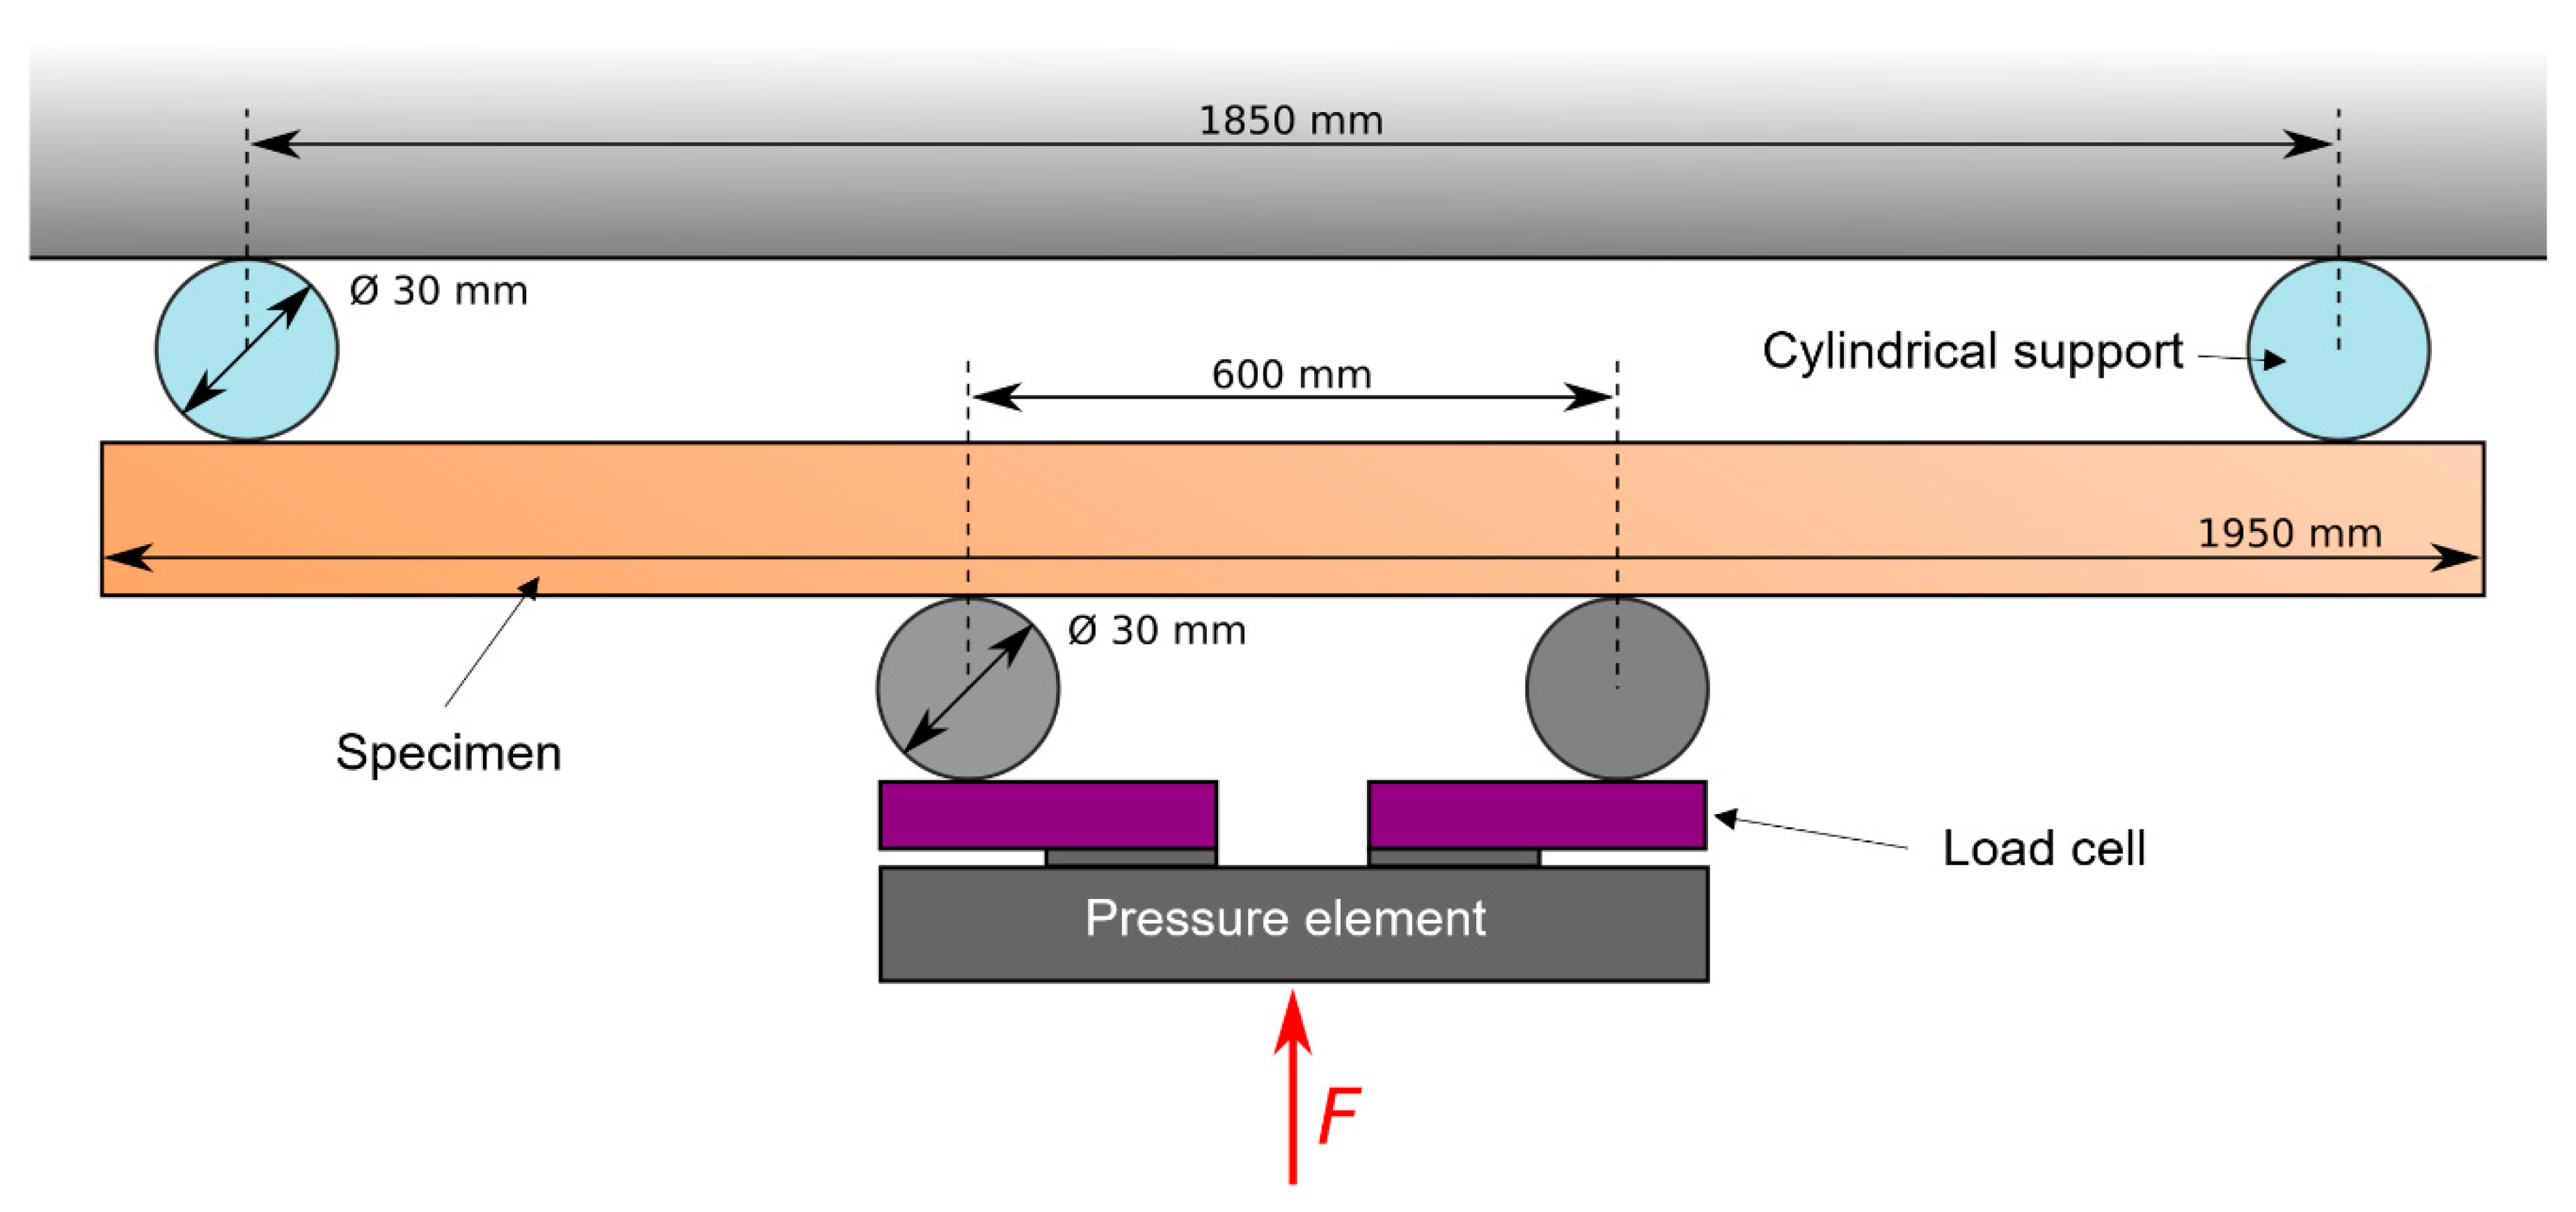
The fatigue test on a specimen works based on the principle of four-point bending, whereby force is applied to the specimen by a compression element via two rollers with a diameter of 30 mm at a distance of 600 mm from each other (Figure 13). The specimen is supported at the ends by two fixed cylindrical elements with identical dimensions at a distance of 1850 mm.
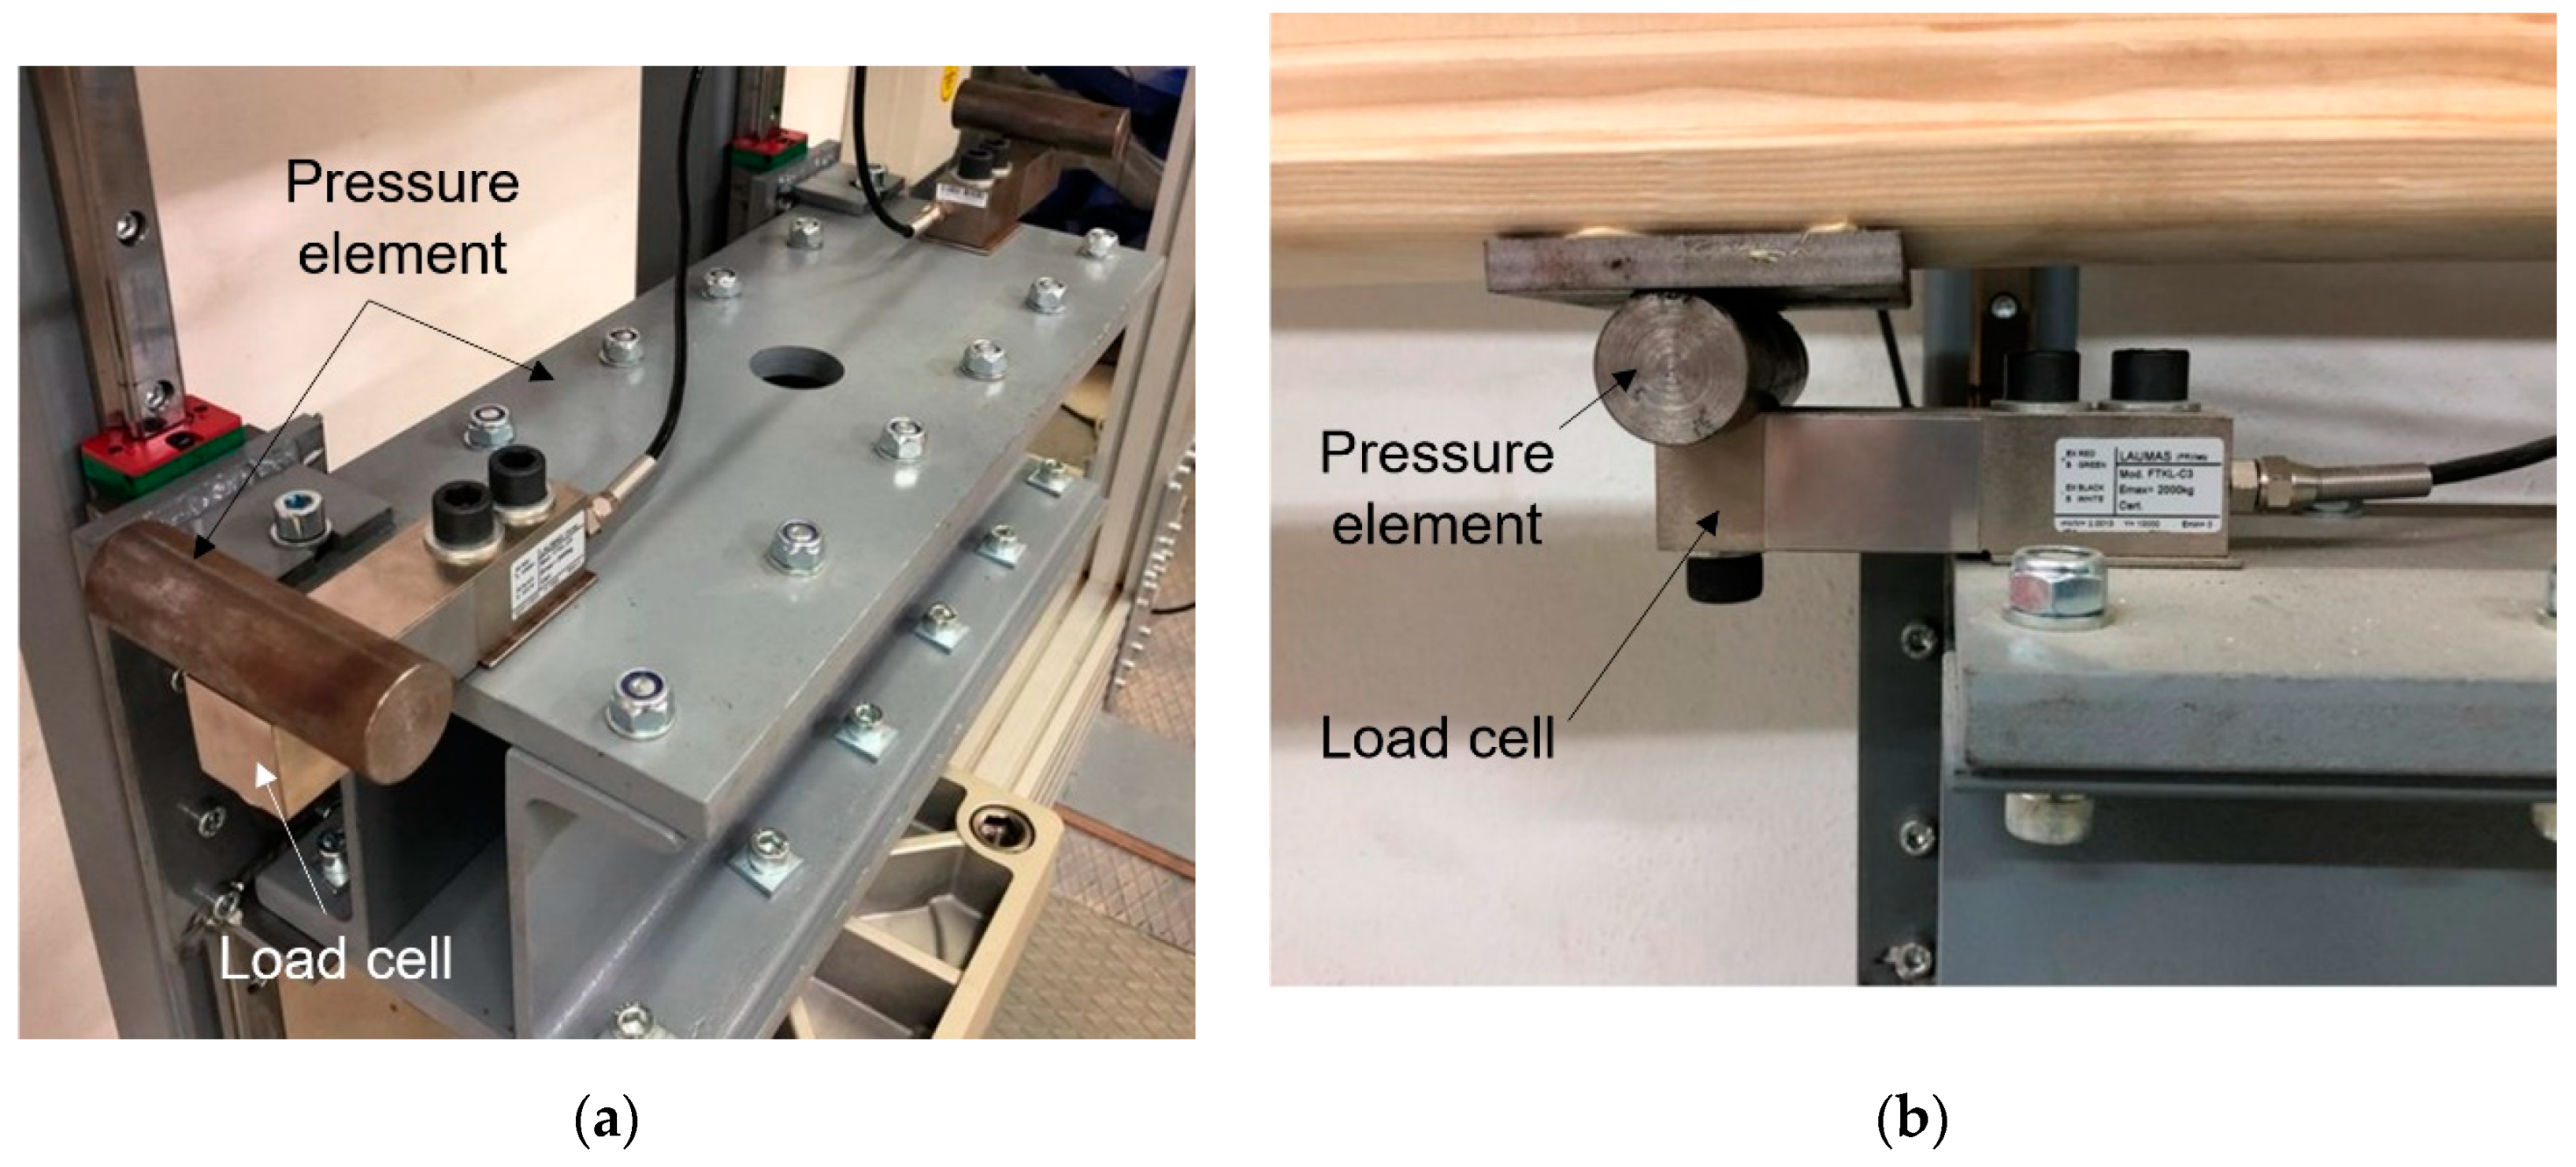
To facilitate design and operation, the system is arranged upside down, i.e., the pressure element presses upwards on the test specimen and the side supports are at the top (Figure 13). Such an arrangement does not make operation significantly more difficult, but one must be aware that the pressure force is not equal to the product of the pressure in the cylinder and piston area, as friction losses due to the use of guides, and of course the weight of the pressure element itself, must be taken into account. Therefore, in such a system, it makes sense to measure the force directly below the pressure rollers (Figure 13 and Figure 14). For this purpose, two measuring cells (type FTKL) with a maximum individual load capacity of 2000 kg and shear operation (Figure 14) are used.
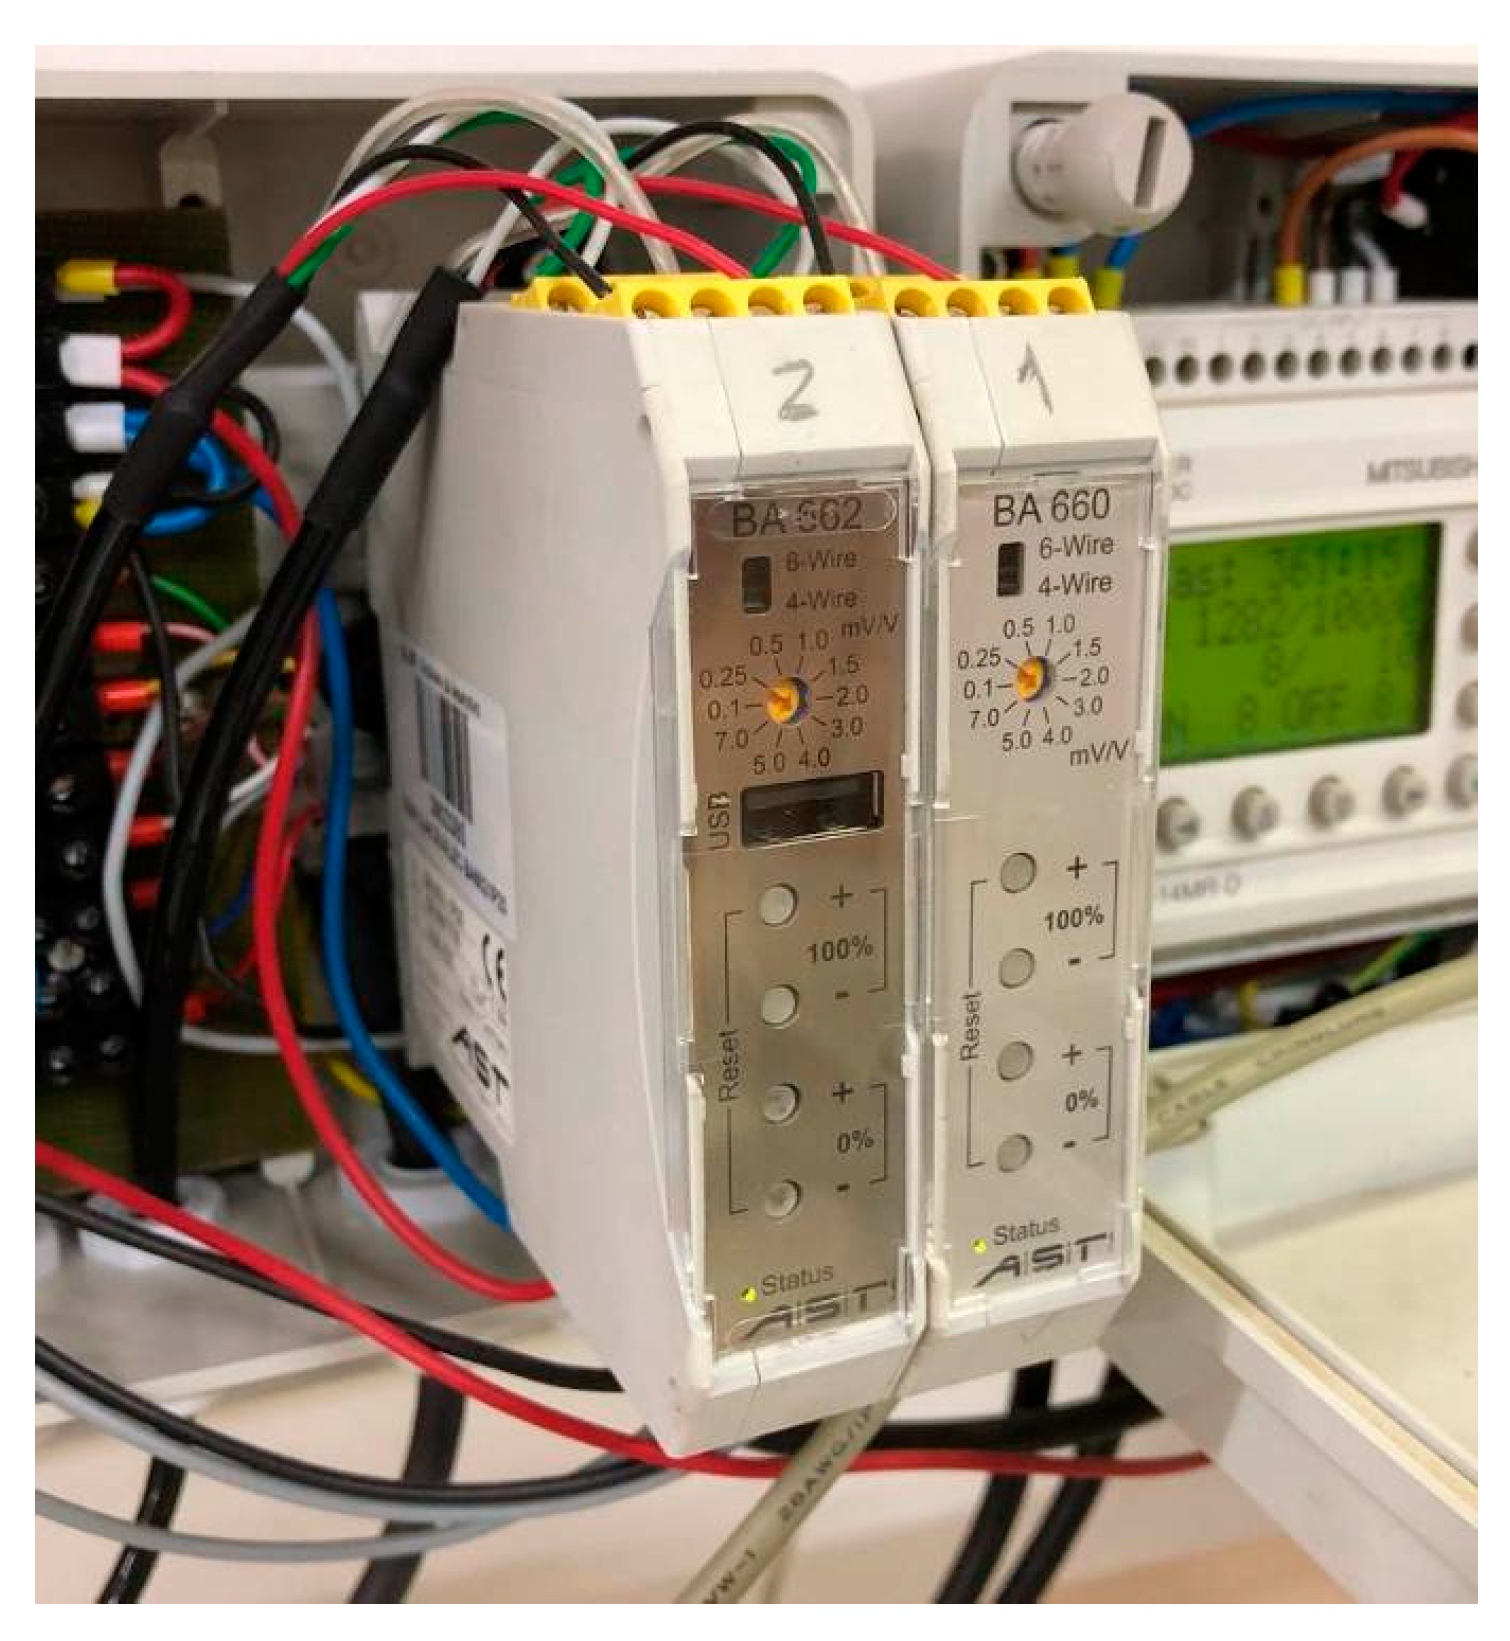
The load cells were connected to a measurement amplifier BA 662/660 (A.S.T.—Angewandte System Technik GmbH, Dresden, Germany), which ensures sufficient amplification and filtering of the load cell measurement signal (Figure 15).
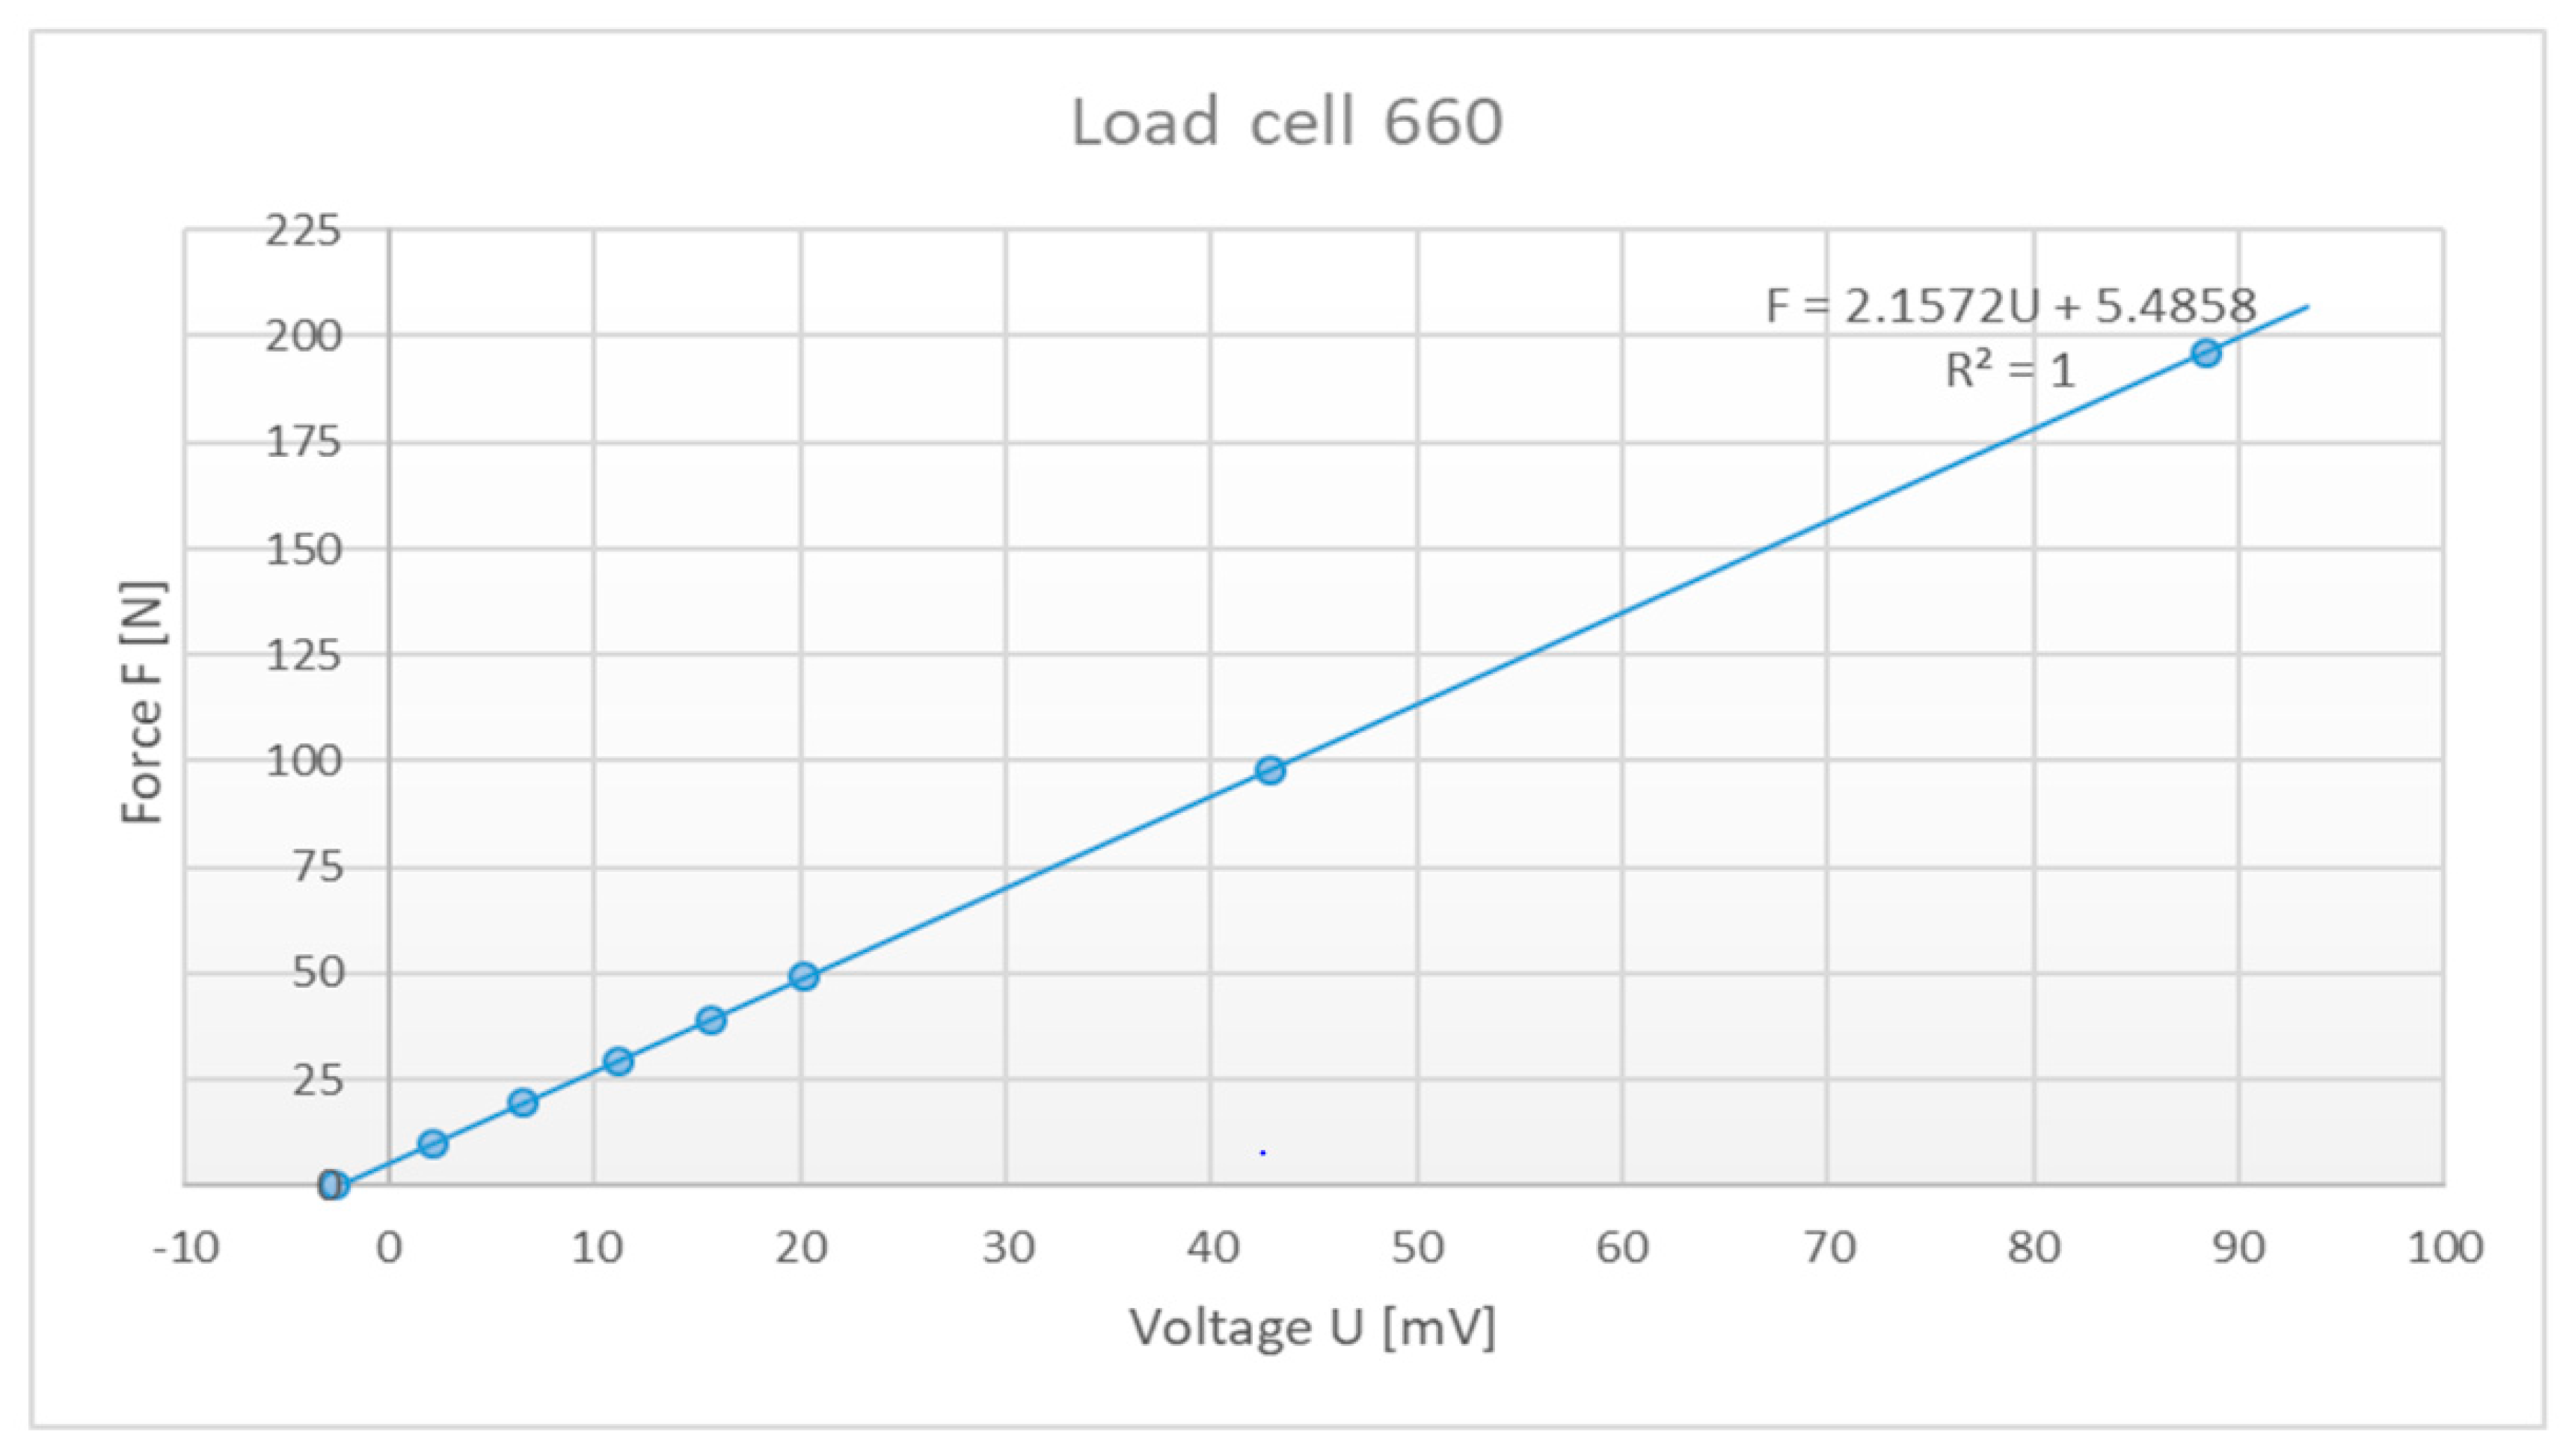
The calibration of the built-in load cells was performed by placing known masses of weights on the load cells and reading the values of the output voltages from the amplifier. Due to the limited set of weights (2 × 1 kg, 2 × 2 kg and 2 × 10 kg) the measurements were only carried out in the lower force range. For load cell 1 connected to amplifier 660, the dependence between the voltage U in millivolts and the force F in Newton (Figure 16) was determined according to the following Equation (1):
The calibration was carried out in the same way for load cell 2 on amplifier 662, Equation (2):
The measured dependency (voltage–force) was extrapolated to the entire measuring range of the forces.
2.4.2. Bending Measurement of Specimen
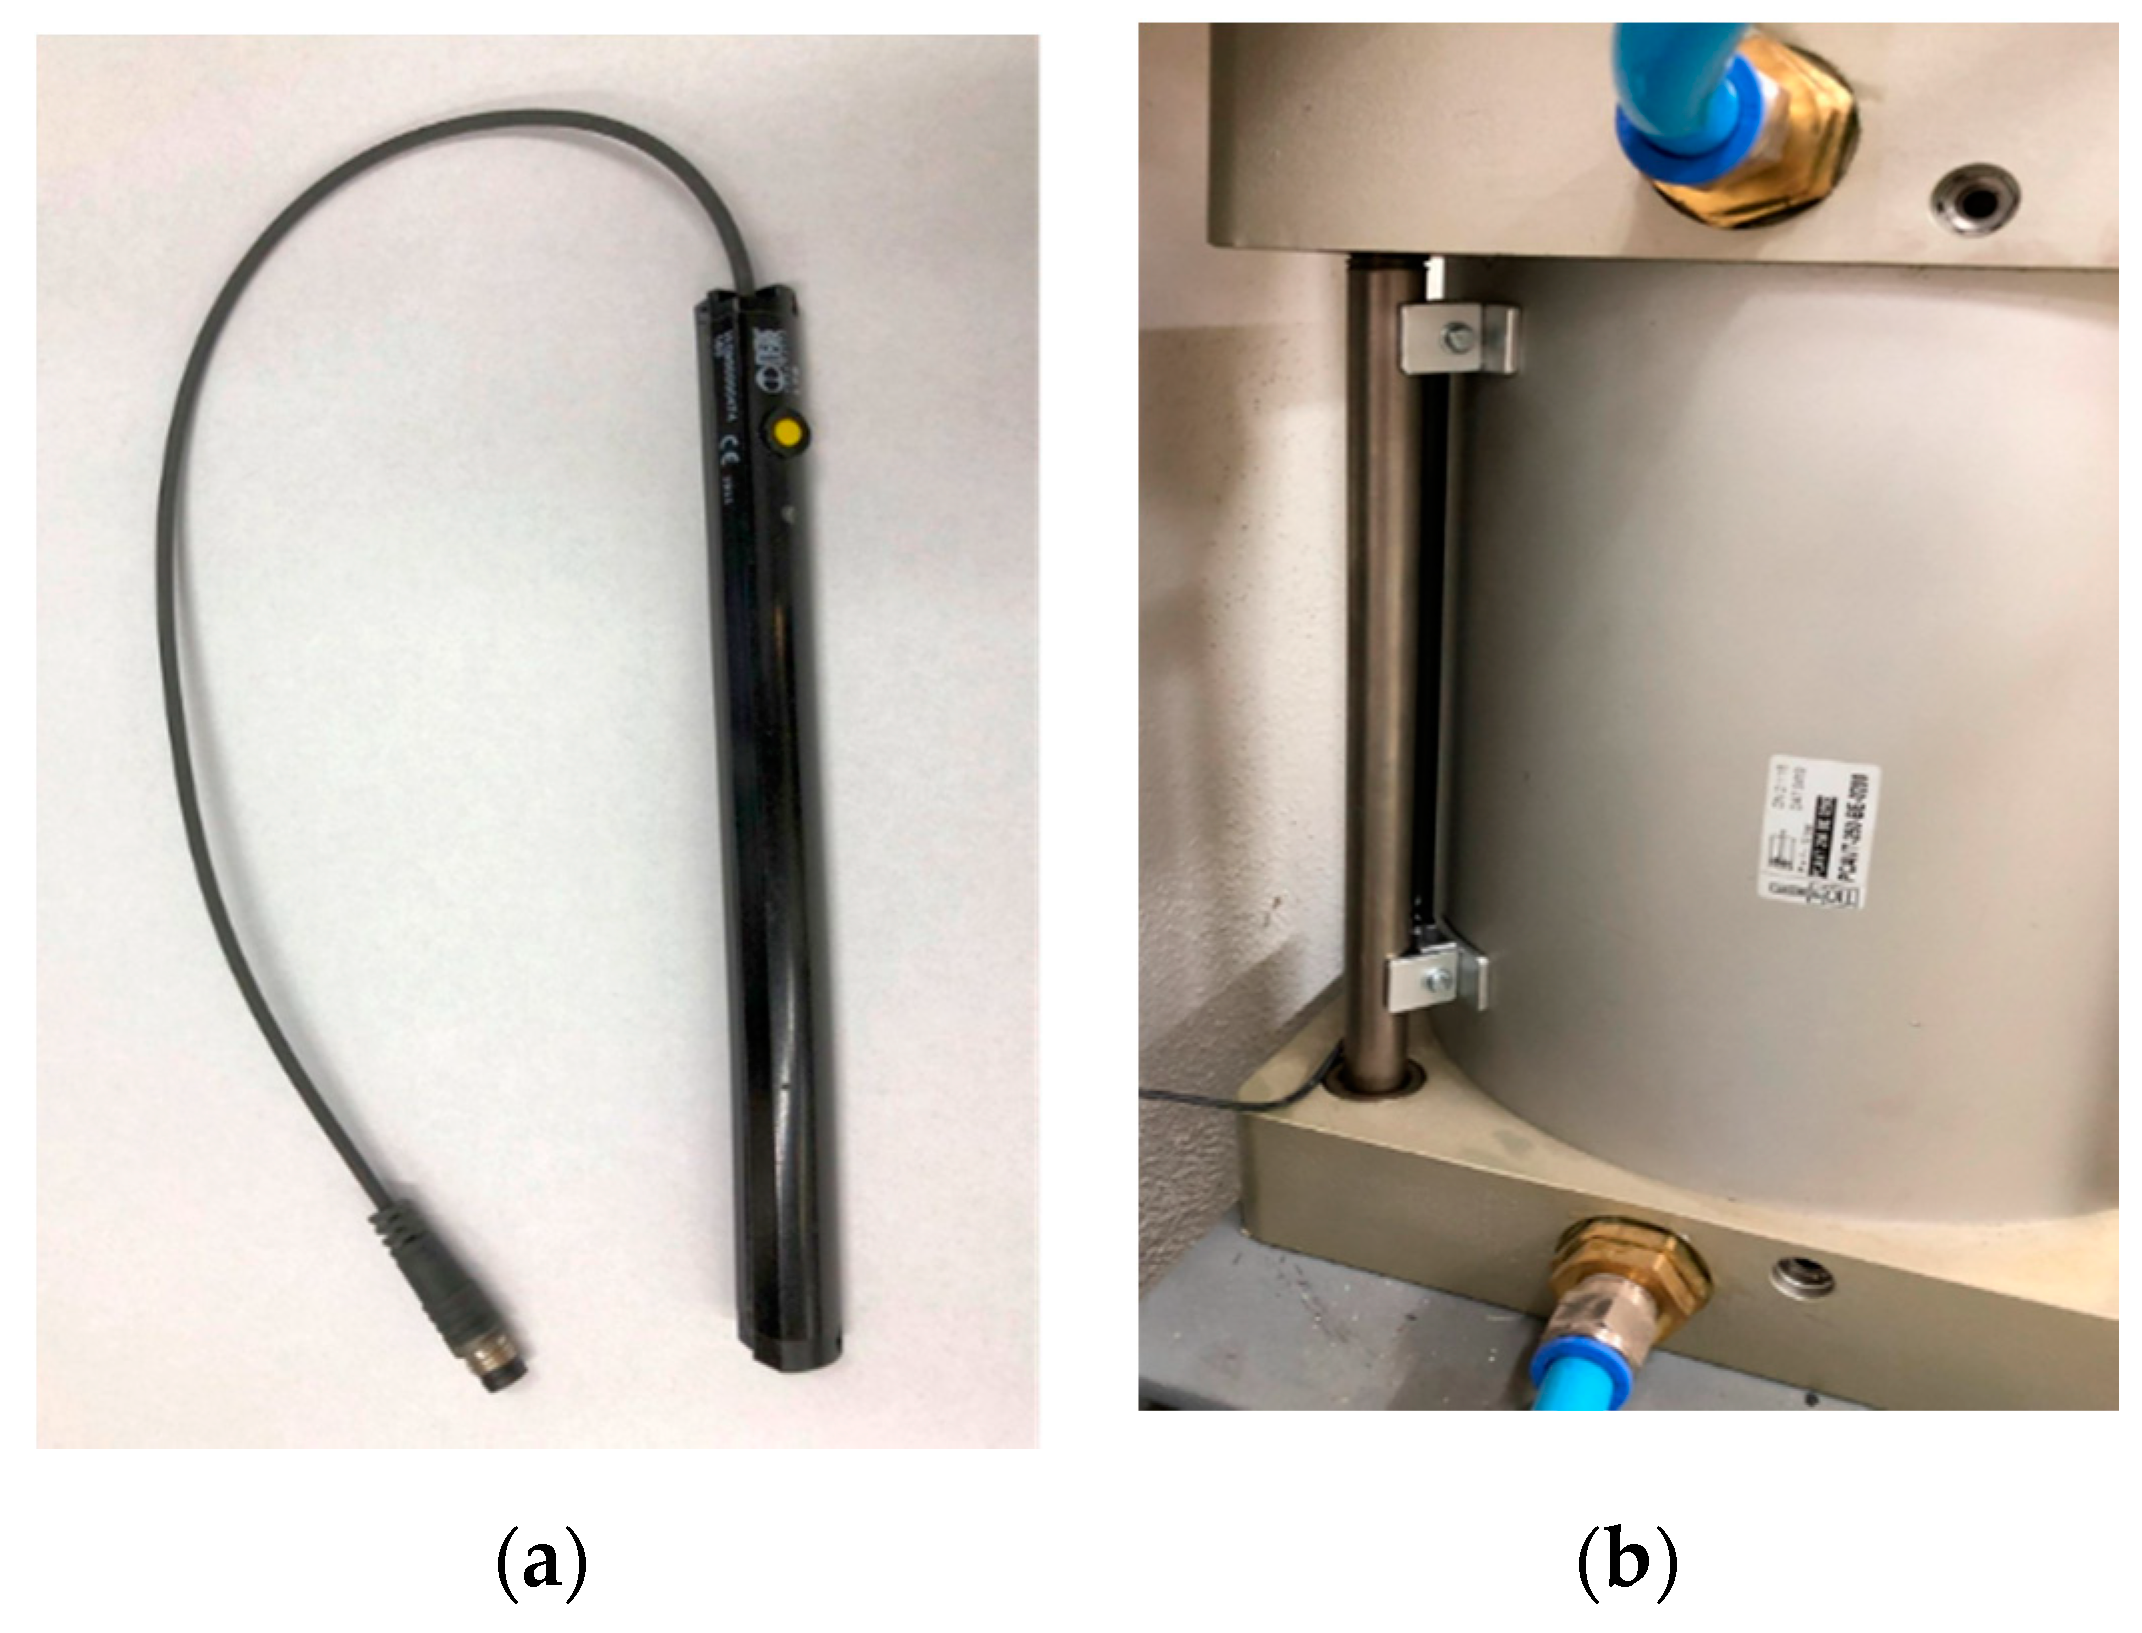
In addition to force measurements, the bending of the sample under the load was also measured in a four-point bending test. The measuring system is designed in such a way that the position of the piston can be monitored without contact. The sensor is attached to the cylinder housing and follows the movement of the magnet, which is mounted inside the cylinder on the piston itself, without contact (Figure 17). The measuring system operates on the phenomenon of magnetostriction, in which the dimensions of the crystal lattice of ferromagnetic materials (iron, nickel and cobalt) change under the influence of a changing external magnetic field [40]. In principle, the phenomenon of magnetostriction is present in all ferromagnets, but it is practically measurable and only useful in some cases if the deformations are large enough (in the order of µm/m). The non-contact nature of the measuring system ensures a long life without maintenance.
2.5. Fatigue Life Data Analysis
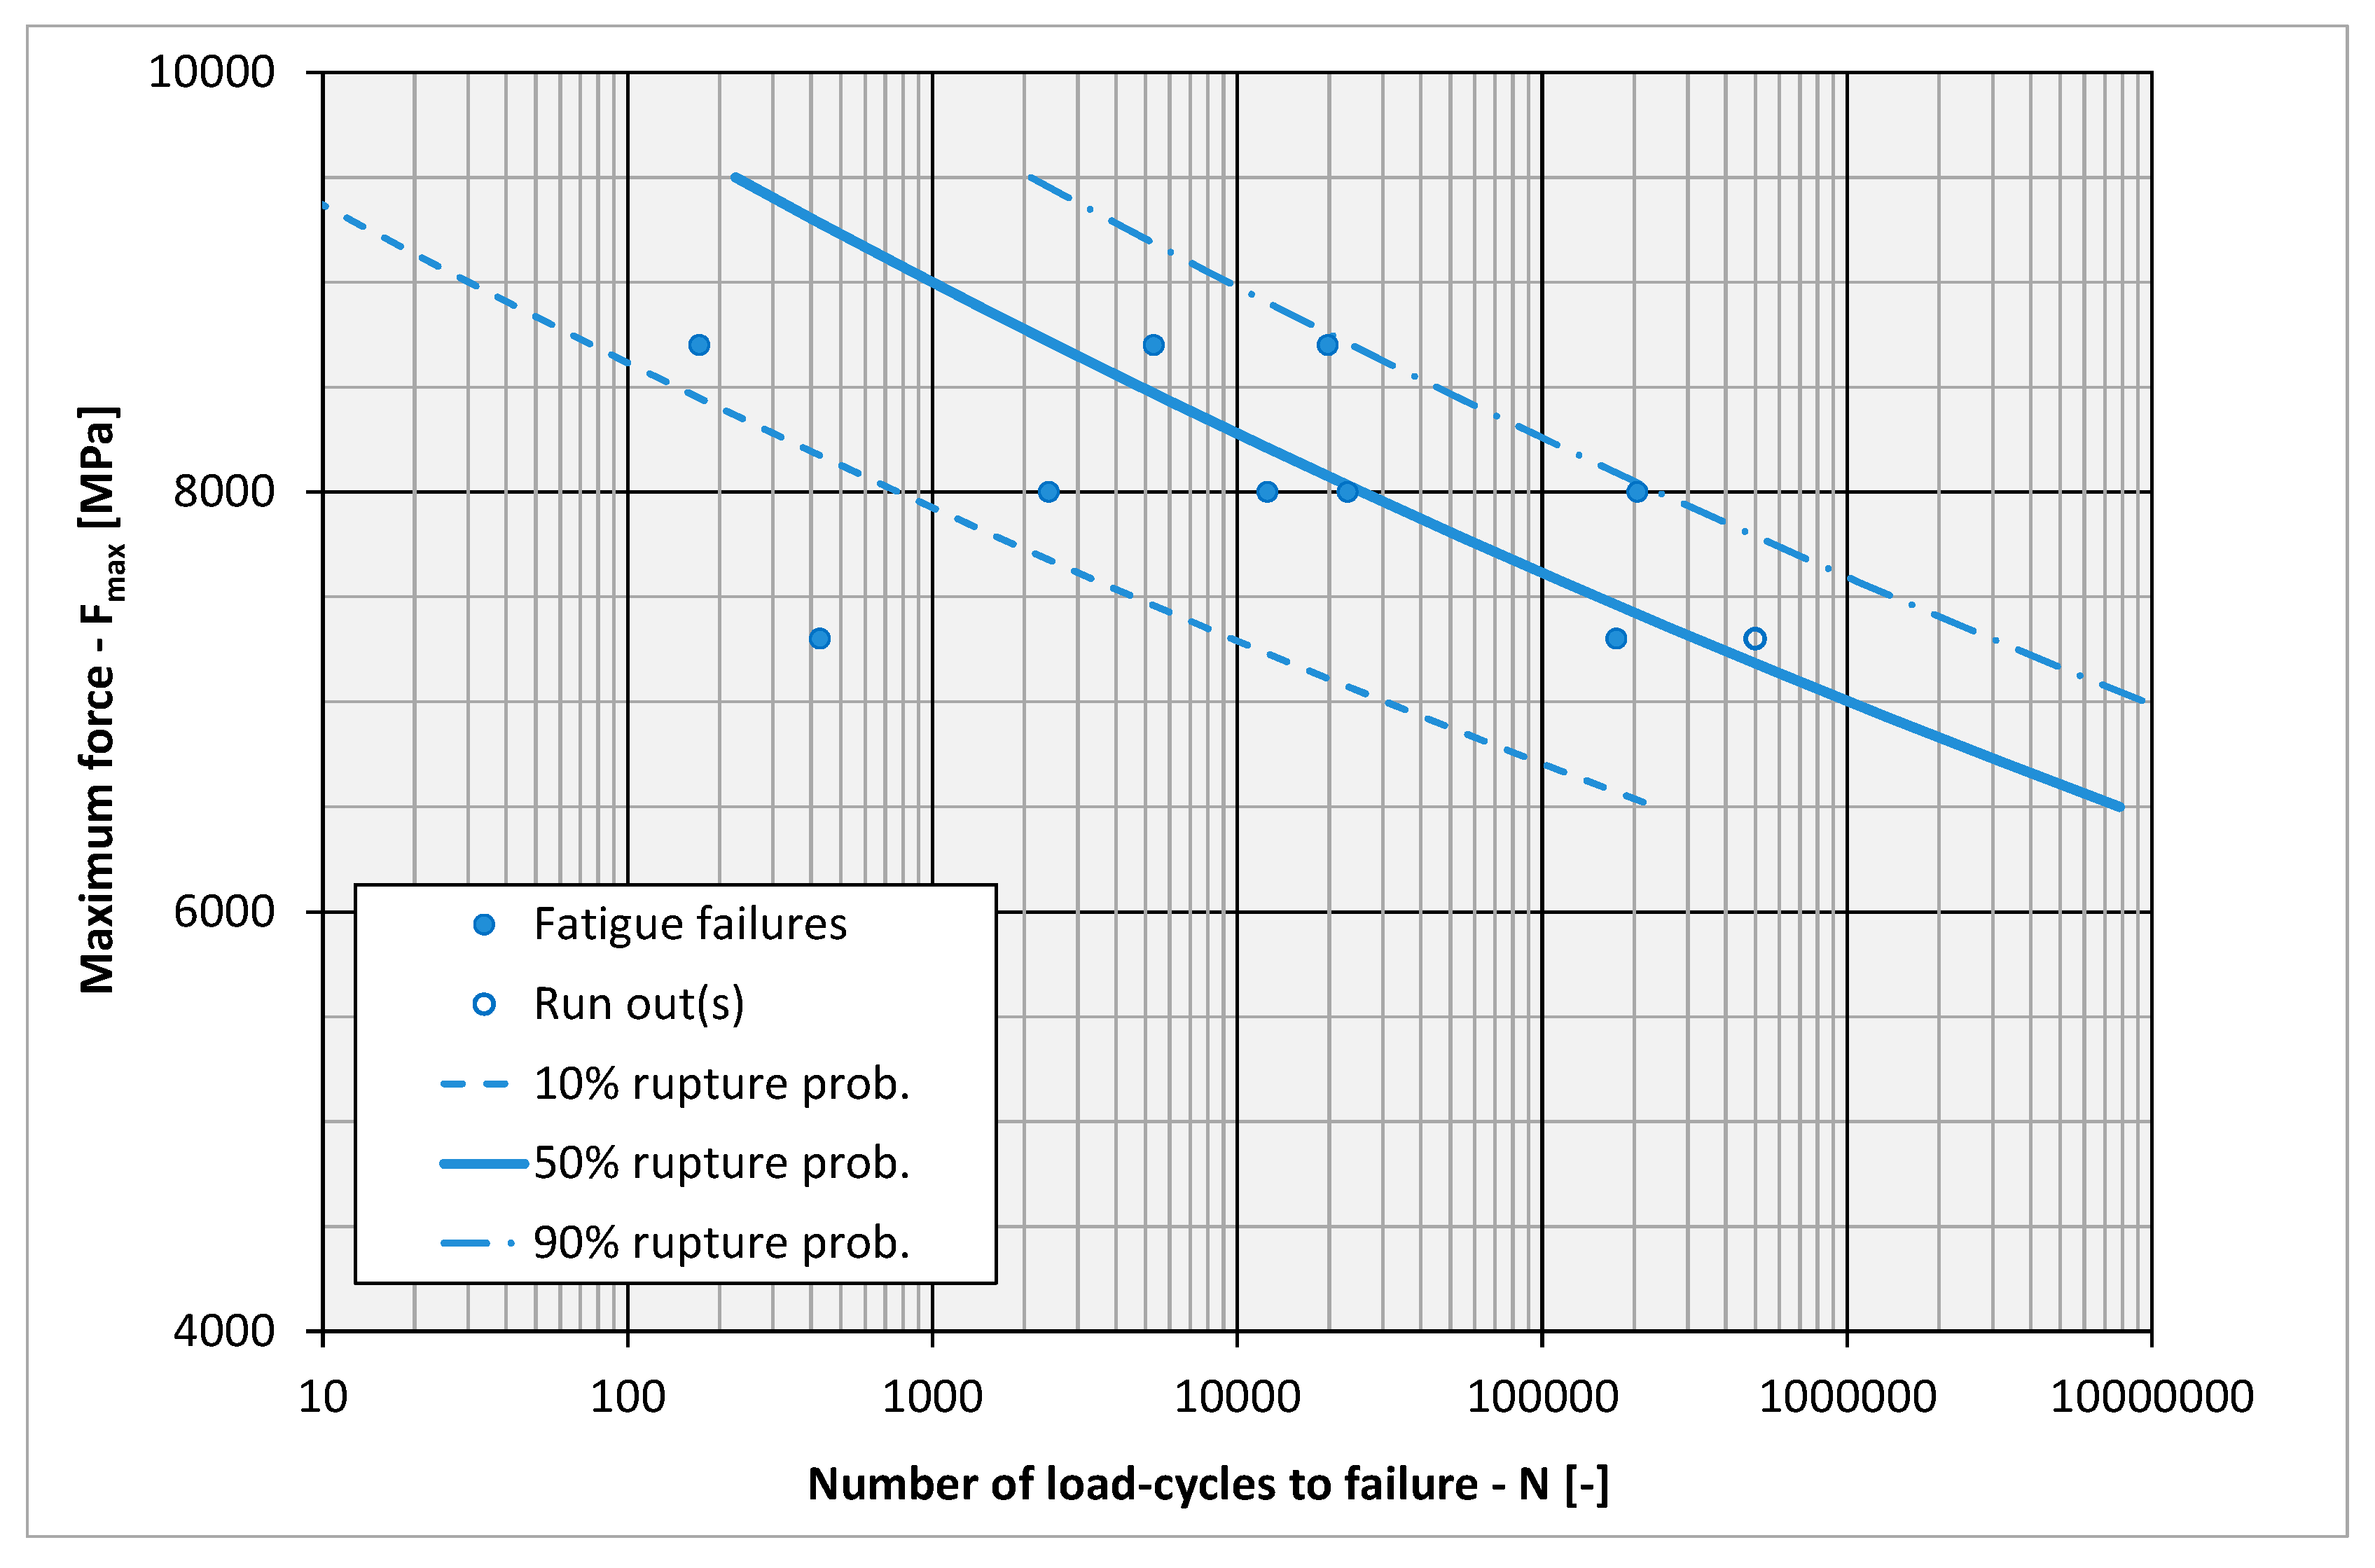
For a profiled bending beam made of spruce wood only a few fatigue tests have been carried out so far. To shorten the test time, the fatigue tests were terminated after 500,000 load cycles. The test data are shown in Figure 18 in Section 3 together with a modelled Woehler curve. The Woehler curve was determined according to the principle proposed by Klemenc and Fajdiga [37] and improved by Klemenc [38]. Within this approach, the Woehler curve is modelled using the conditional Weibull probability density function , whose scale parameter η depends on the load force F by an inverse power-law:
The three parameters, i.e., a Weibull shape parameter β, an intercept A and a slope B in a logN-logF diagram determine the Woehler curve model. In this way, it is possible to model both a trend and a scatter of the Woehler curve. The three unknown parameters β, A and B are estimated on the basis of the experimental fatigue-life data set } using the following maximum likelihood cost function L:
δi is an indicator of a fatigue failure (δi = 1) or a run-out experiment (δi = 0). is a cumulative probability function of the probability density function from the following Equation (3):
The maximisation of the objective function L in Equation (5) against the parameters β, A and B was performed with a real-valued genetic algorithm, as explained in [38]. Ten runs of the genetic algorithm from different random initial values were repeated.
3. Results and Discussion
After several months of operation of the test rig, it can be determined that the system works reliably and robustly. However, there are some limitations due to the small number of functions offered by the PLC and therefore it might be useful to combine the control and data acquisition in a more advanced system that reacts dynamically and adapts itself during the test. There are solutions on the market that allow not only the control of the test rig but also the recording of all relevant test parameters (forces, deflection); test parameters are recorded either locally on flash media (SD card) or saved at a network location [40]. However, such systems do not offer solutions for the processing and analysis of the measurement data and this still has to be carried out separately, which is an additional disadvantage besides the very high purchase price. At the same time, it would make sense to use the already existing outputs (analog and digital) on the measurement interface NI USB 6009 and thus change the amplitude and frequency of the load in the fatigue process. In a more complex implementation of PLC with the measuring system on the test rig, the frequency and time of the valve opening could also be actively changed (e.g., FM—frequency modulation) and the load intensity could be controlled by adjusting the pressure on the pressure regulator (e.g., AM—amplitude modulation).
Despite the known purpose of the test rig, the design of the test rig took into account the customer’s wish to be able to perform other tests on the test rig in the future, both dynamic (tension, compression) and static, which meet the test requirements of ISO 13061-4: 2014 [41] and ISO 13061-3: 2014 [42] for determining the modulus of elasticity and bending strength. For this purpose, it would be necessary to introduce a new regime, in addition to the existing cyclic operation, in which the piston movements are precisely controlled. According to the standard ISO 13061-4: 2014 [41], the test specimen must fail within a time frame between 0.5 and 5 min at constant velocity of the pressure element. With existing components, a closed velocity control loop could be realized. An existing (already used) contactless magnetic position measuring system would be used to measure the velocity. The control algorithm would be implemented in a LabView application using the existing measurement interface NI USB 6009. The constant velocity of the cylinder piston or pressure element would be provided by the existing pressure regulator, with the pressure being adjustable via the analog voltage input.
A cost analysis of the test rig components was also performed. Table 1 shows the total costs for the main components of the test facility. The cost analysis shows that the test rig is much more cost-effective for the customer and the intended use compared to commercial test equipment.
A total of ten fatigue-life tests were performed at three load levels of force F: 8700 N, 8000 N and 7300 N (see Figure 18). Nine tests resulted in fatigue failures and the terminal value of 500,000 load cycles was reached in one test at the lowest load level.
The ten experimental data points from Figure 18 were used to estimate the parameters β, A and B of the modelled Woehler curve according to the procedure in Section 2.5. In each of the repetitions of the genetic algorithm, a convergence to the final value of the parameters β, A and B was achieved between 10,000 and 100,000 iterations. The highest value of the objective function L was 103.5697. The corresponding values of the parameters in Equations (3) and (4) are: β = 0.5378, A = 112.1910 and B = −27.5385. The relatively low value of the shape parameter β indicates a high scattering of the test results, which is confirmed by an outlier at the loading level of F = 7300 N, which is far to the left of the Woehler curve for 10% probability of failure. On the other hand, the slope parameter B for spruce beams is two to three times lower compared to the typical slopes of the Woehler curves for structural steels and aluminium alloys. This means that spruce wood is less sensitive to the fatigue phenomenon than the typical structural metals.
4. Conclusions
The test rig was developed in cooperation with a company that manufactures large wooden windows (height over 3 m to 6 m). The dimensions of the aluminum-reinforced wooden beam were decisive for the design of the test rig and its components. The components of the test rig are presented, and their characteristics and tasks are explained. The test rig has been working robustly and reliably for a long time. The cost analysis of the test rig components shows that, for the specific company producing wooden windows, the construction of a dedicated test facility with the possibility to adapt it to the company’s test requirements is much cheaper than commercial test facilities. With the presented in-house developed test rig, it is possible to perform fatigue life tests on bending beams. Despite the significant scattering of the fatigue test data, they allow an estimation of the Woehler curve and its scattering. The first experimental results show that spruce wood is less sensitive to the fatigue phenomenon than typical metals. The results in the form of S–N curves serve as input parameters in FEM analyses of material fatigue, which allows the prediction of the duration of the product (such as a hybrid wooden beam).
Author Contributions
Conceptualisation, G.F., D.R. and B.G.; methodology, G.F., D.R. and B.G.; conceived and designed the fatigue test rig, G.F., D.R., D.V. and B.G.; assembled the testing rig, D.R., D.V. and B.G.; controlling system of the test rig, D.R. and B.G.; writing—original draft preparation, G.F.; writing—review and editing, G.F., D.R. and B.G.; supervision, G.F. All authors have read and agreed to the published version of the manuscript.
Funding
This work was supported by the Slovenian Research Agency “ARRS” in the framework of the Research Programme: “Development Evaluation P2-0182” and Slovenian Ministry of Education, Science and Sport, and European Regional Development Fund in the scope of project TIGR4smart, grant number 5441-1/2016/116.
Conflicts of Interest
The authors declare no conflict of interest.
References
- Wang, C.; Cheng, L.-P.; Wang, C.; Xiong, Z.-Q.; Wei, S.-M. Dynamic mechanical characteristics and failure mode of serpentine under a three-dimensional high static load and frequent dynamic disturbance. PLoS ONE 2019, 14, e0222684. [Google Scholar] [CrossRef]
- Smith, I.; Landis, E.; Gong, M. Fracture and Fatigue in Wood; John Wiley & Sons Ltd.: Chichester, UK, 2003. [Google Scholar]
- Wood, L. Relation of Strength of Wood to Duration of Laods; United States Department of Agriculture: Madison, WI, USA, 1951.
- Karenlampi, P.P.; Tynjala, P.; Strom, P. Off-axis fatigue loading of steamed wood. Int. J. Fatigue 2002, 24, 1235–1242. [Google Scholar] [CrossRef]
- Dourado, N.; de Moura, M.F.S.F.; de Jesus, A. Fatigue-fracture characterization of wood under mode I loading. Int. J. Fatigue 2019, 121, 265–271. [Google Scholar] [CrossRef]
- Clerc, G.; Brunner, A.J.; Josset, S.; Niemz, P.; Pichelin, F.; Van de Kuilen, J.W.G. Adhesive wood joints under quasi-static and cyclic fatigue fracture Mode II loads. Int. J. Fatigue 2019, 123, 40–52. [Google Scholar] [CrossRef]
- Tannert, T.; Vallee, T.; Hehl, S. Experimental and numerical investigations on adhesively bonded hardwood joints. Int. J. Adhes. Adhes. 2012, 37, 65–69. [Google Scholar] [CrossRef]
- Liu, J.Y.; Ross, R.J. Energy criterion for fatigue strength of wood structural members. J. Eng. Mater-T ASME 1996, 118, 375–378. [Google Scholar] [CrossRef]
- Yildirim, M.N.; Uysal, B.; Ozcifci, A.; Ertas, A.H. Determination of Fatigue and Static Strength of Scots Pine and Beech Wood. Wood Res. 2015, 60, 679–685. [Google Scholar]
- Mejri, M.; Toubal, L.; Cuilliere, J.C.; Francois, V. Hygrothermal aging effects on mechanical and fatigue behaviors of a short-natural-fiber-reinforced composite. Int. J. Fatigue 2018, 108, 96–108. [Google Scholar] [CrossRef]
- De Moura, M.F.S.F.; Goncalves, J.P.M. Cohesive zone model for high-cycle fatigue of adhesively bonded joints under mode I loading. Int. J. Solids Struct. 2014, 51, 1123–1131. [Google Scholar] [CrossRef] [Green Version]
- Jia, J.H.; Davalos, J.F. Study of load ratio for mode-I fatigue fracture of Wood-FRP-bonded interfaces. J. Compos. Mater. 2004, 38, 1211–1230. [Google Scholar] [CrossRef]
- Simon, I.; Banks-Sills, L.; Fourman, V. Mode I delamination propagation and R-ratio effects in woven composite DCB specimens for a multi-directional layup. Int. J. Fatigue 2017, 96, 237–251. [Google Scholar] [CrossRef]
- Yoshihara, H.; Ohta, M. Measurement of mode II fracture toughness of wood by the end-notched flexure test. J. Wood Sci. 2000, 46, 273–278. [Google Scholar] [CrossRef]
- Yoshihara, H. Mode II R-curve of wood measured by 4-ENF test. Eng. Fract. Mech. 2004, 71, 2065–2077. [Google Scholar] [CrossRef]
- Kim, H.B.; Naito, K.; Oguma, H. Mode II fatigue crack growth properties of adherends bonded with DP8005: End-notched flexible tests. Int. J. Fatigue 2018, 111, 333–344. [Google Scholar] [CrossRef]
- Chousal, J.A.G.; de Moura, M.F.S.F. Mixed-mode I+II continuum damage model applied to fracture characterization of bonded joints. Int. J. Adhes. Adhes. 2013, 41, 92–97. [Google Scholar] [CrossRef]
- Bao, Z.; Eckelman, C.; Gibson, H. Fatigue strength and allowable design stresses for some wood composites used in furniture. Holz Roh Werkst. 1996, 54, 377–382. [Google Scholar] [CrossRef]
- Mishnaevsky, L.; Branner, K.; Petersen, H.N.; Beauson, J.; McGugan, M.; Sorensen, B.F. Materials for Wind Turbine Blades: An Overview. Materials 2017, 10, 1285. [Google Scholar] [CrossRef] [Green Version]
- PHI Certified Component Database. Available online: https://database.passivehouse.com/en/components/list/window (accessed on 27 September 2020).
- Jimenez, P.; Bregenzer, A.; Eibel, K.; Denk, E.; Grote, V.; Kelz, C.; Moser, M. Wood or Laminate?—Psychological Research of Customer Expectations. Forests 2016, 7, 275. [Google Scholar] [CrossRef] [Green Version]
- Jasieńko, J.; Nowak, T. Solid timber beams strengthened with steel plates—Experimental studies. Constr. Build. Mater. 2014, 63, 81–88. [Google Scholar] [CrossRef]
- Alhayek, H.; Svecova, D. Flexural Stiffness and Strength of GFRP-Reinforced Timber Beams. J. Compos. Constr. 2012, 16, 245–252. [Google Scholar] [CrossRef]
- Andor, K.; Lengyel, A.; Polgár, R.; Fodor, T.; Karácsonyi, Z. Experimental and statistical analysis of spruce timber beams reinforced with CFRP fabric. Constr. Build. Mater. 2015, 99, 200–207. [Google Scholar] [CrossRef]
- Subic, B.; Fajdiga, G.; Lopatic, J. Bending Stiffness, Load-Bearing Capacity and Flexural Rigidity of Slender Hybrid Wood-Based Beams. Forests 2018, 9, 703. [Google Scholar] [CrossRef] [Green Version]
- Šubic, B.; Fajdiga, G.; Lopatič, J. Bending of wooden based hybrid beams: Experimental analysis. In Proceedings of the WCTE 2016, Austria, Vienna, 22–25 August 2016; pp. 1–8. [Google Scholar]
- Borri, A.; Corradi, M. Strengthening of timber beams with high strength steel cords. Compos. Part B Eng. 2011, 42, 1480–1491. [Google Scholar] [CrossRef]
- Fiorelli, J.; Dias, A.A. Analysis of the strength and stiffness of timber beams reinforced with carbon fiber and glass fiber. Mater. Res. 2003, 6, 193–202. [Google Scholar] [CrossRef] [Green Version]
- Winter, W.; Tavoussi, K.; Pixner, T.; Parada, F.R. Timber-Steel-Hybrid Beams for Multi-Storey Buildings. In Proceedings of the World Conference on Timber Engineering 2012 (WCTE 2012), Auckland, New Zealand, 15–19 July 2012. [Google Scholar]
- Thorhallsson, E.; Hinriksson, G.; Snæbjörnsson, J. Strength and stiffness of glulam beams reinforced with glass and basalt fibres. Compos. Part B Eng. 2017, 115, 300–307. [Google Scholar] [CrossRef]
- Nadir, Y.; Nagarajan, P.; Ameen, M.; Arif, M.M. Flexural stiffness and strength enhancement of horizontally glued laminated wood beams with GFRP and CFRP composite sheets. Constr. Build. Mater. 2016, 112, 547–555. [Google Scholar] [CrossRef]
- Valipour, H.; Crews, K. Efficient finite element modelling of timber beams strengthened with bonded fibre reinforced polymers. Constr. Build. Mater. 2011, 25, 3291–3300. [Google Scholar] [CrossRef]
- Kim, Y.J.; Harries, K.A. Modeling of timber beams strengthened with various CFRP composites. Eng. Struct. 2010, 32, 3225–3234. [Google Scholar] [CrossRef]
- Taheri, F.; Nagaraj, M.; Khosravi, P. Buckling response of glue-laminated columns reinforced with fiber-reinforced plastic sheets. Compos. Struct. 2009, 88, 481–490. [Google Scholar] [CrossRef]
- De Jesus, A.M.; Pinto, J.M.; Morais, J.J. Analysis of solid wood beams strengthened with CFRP laminates of distinct lengths. Constr. Build. Mater. 2012, 35, 817–828. [Google Scholar] [CrossRef]
- Kovačič, A.; Šubic, B.; Fajdiga, G. Computer modelling of hybrid wooden beams for window frames. In Proceedings of the CompWood 2017, Austria, Vienna, 7–9 June 2017; Technischen Universität Vienna: Austria, Vienna, 2017; p. 64. [Google Scholar]
- Klemenc, J.; Fajdiga, M. Estimating S-N curves and their scatter using a differential ant-stigmergy algorithm. Int. J. Fatigue 2012, 43, 90–97. [Google Scholar] [CrossRef]
- Klemenc, J. Influence of fatigue-life data modelling on the estimated reliability of a structure subjected to a constant-amplitude loading. Reliab. Eng. Syst. Safe 2015, 142, 238–247. [Google Scholar] [CrossRef]
- Fajdiga, G.; Rajh, D.; Necemer, B.; Glodez, S.; Sraml, M. Experimental and Numerical Determination of the Mechanical Properties of Spruce Wood. Forests 2019, 10, 1140. [Google Scholar] [CrossRef] [Green Version]
- Data Logging Analyzer-MELQIC | MITSUBISHI ELECTRIC, FA. Available online: https://www.mitsubishielectric.com/fa/products/cnt/melqic/index.html (accessed on 9 September 2020).
- ISO 13061-4:2014. Physical and Mechanical Properties of Wood—Test Methods for Small Clear Wood Specimens—Part 4: Determination of Modulus of Elasticity in Static Bending; International Organization for Standardization: Geneva, Switzerland, 2014; p. 6. [Google Scholar]
- ISO 13061-3:2014. Physical and Mechanical Properties of Wood—Test Methods for Small Clear Wood Specimens—Part 3: Determination of Ultimate Strength in Static Bending; International Organization for Standardization: Geneva, Switzerland, 2014; p. 5. [Google Scholar]
Figure 1.
Dynamic strength curve for a given σmean.

Figure 2.
(a) Cross section of a specimen with aluminium reinforcement, (b) the test equipment for performing the 4-point bending tests [25].
Figure 2.
(a) Cross section of a specimen with aluminium reinforcement, (b) the test equipment for performing the 4-point bending tests [25].

Figure 3.
Components of the test rig: 1. Frame, 2. Frame connecting plate, 3. Support, 4. Specimen, 5. Load cell, 6. Pressure element, 7. Pressure element guide, 8. Pneumatic cylinder, 9. Displacement sensor.
Figure 3.
Components of the test rig: 1. Frame, 2. Frame connecting plate, 3. Support, 4. Specimen, 5. Load cell, 6. Pressure element, 7. Pressure element guide, 8. Pneumatic cylinder, 9. Displacement sensor.

Figure 4.
(a) Alu profile; (b) press element.

Figure 5.
Fatigue test rig components: 1. Cut-off switch, 2. Air preparation unit, 3. Regulator for the support pressure, 4. Digital air regulator, 5. Pressure overload switch, 6. Two valves, 7. Measuring interface, 8. Load cell amplifier, 9. Programmable logic controller (PLC), 10. Switches (Start–Stop), 11. Power supply, 12. Main power switch (emergency Stop).

Figure 6.
Preparatory group: 1. Cut-off switch, 2. Main regulator, 3. Additional regulator.

Figure 7.
(a) Digital pressure regulator; (b) two monostable valves.

Figure 8.
Block diagram of the control system of the fatigue test rig.

Figure 9.
Mitsubishi Alpha2 PLC.

Figure 10.
PLC program for cyclic control of a pneumatic cylinder.

Figure 11.
Block diagram of the measuring system of the testing rig.

Figure 12.
Software interface.

Figure 13.
Four-point bending test and its main components.

Figure 14.
(a) Pressure element with load cells; (b) the side profile of the load cell during fatigue of a wood specimen.
Figure 14.
(a) Pressure element with load cells; (b) the side profile of the load cell during fatigue of a wood specimen.

Figure 15.
AST signal amplifier for load cells.

Figure 16.
Voltage—force ratio graph for load cell 1 (660).

Figure 17.
(a) Non-contact displacement sensor, (b) and in the mounted state next to the cylinder.

Figure 18.
Experimental data and the modelled Woehler curves for different probabilities of failure.
Figure 18.
Experimental data and the modelled Woehler curves for different probabilities of failure.


Table 1.
Approximate component costs.
| Item | Cost (EUR) |
|---|---|
| Frame | 1300 |
| Pneumatics | 2200 |
| Guide | 400 |
| Controller | 150 |
| Load cells | 400 |
| Consumables | 500 |
| Total | 4950 |
Publisher’s Note: MDPI stays neutral with regard to jurisdictional claims in published maps and institutional affiliations. |
© 2020 by the authors. Licensee MDPI, Basel, Switzerland. This article is an open access article distributed under the terms and conditions of the Creative Commons Attribution (CC BY) license (http://creativecommons.org/licenses/by/4.0/).
Share and Cite
MDPI and ACS Style
Fajdiga, G.; Rajh, D.; Vidic, D.; Gospodarič, B. The Development of Pneumatic Fatigue Test Rig for Wood-Based Specimens. Forests 2020, 11, 1187. https://0-doi-org.brum.beds.ac.uk/10.3390/f11111187
AMA Style
Fajdiga G, Rajh D, Vidic D, Gospodarič B. The Development of Pneumatic Fatigue Test Rig for Wood-Based Specimens. Forests. 2020; 11(11):1187. https://0-doi-org.brum.beds.ac.uk/10.3390/f11111187
Chicago/Turabian StyleFajdiga, Gorazd, Denis Rajh, Drago Vidic, and Bojan Gospodarič. 2020. "The Development of Pneumatic Fatigue Test Rig for Wood-Based Specimens" Forests 11, no. 11: 1187. https://0-doi-org.brum.beds.ac.uk/10.3390/f11111187
Note that from the first issue of 2016, this journal uses article numbers instead of page numbers. See further details here.