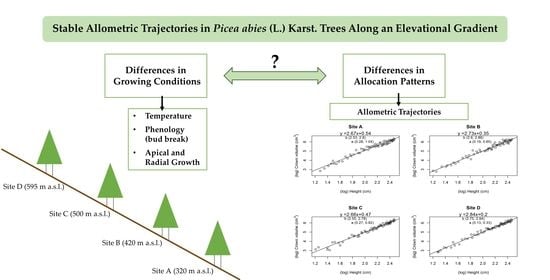
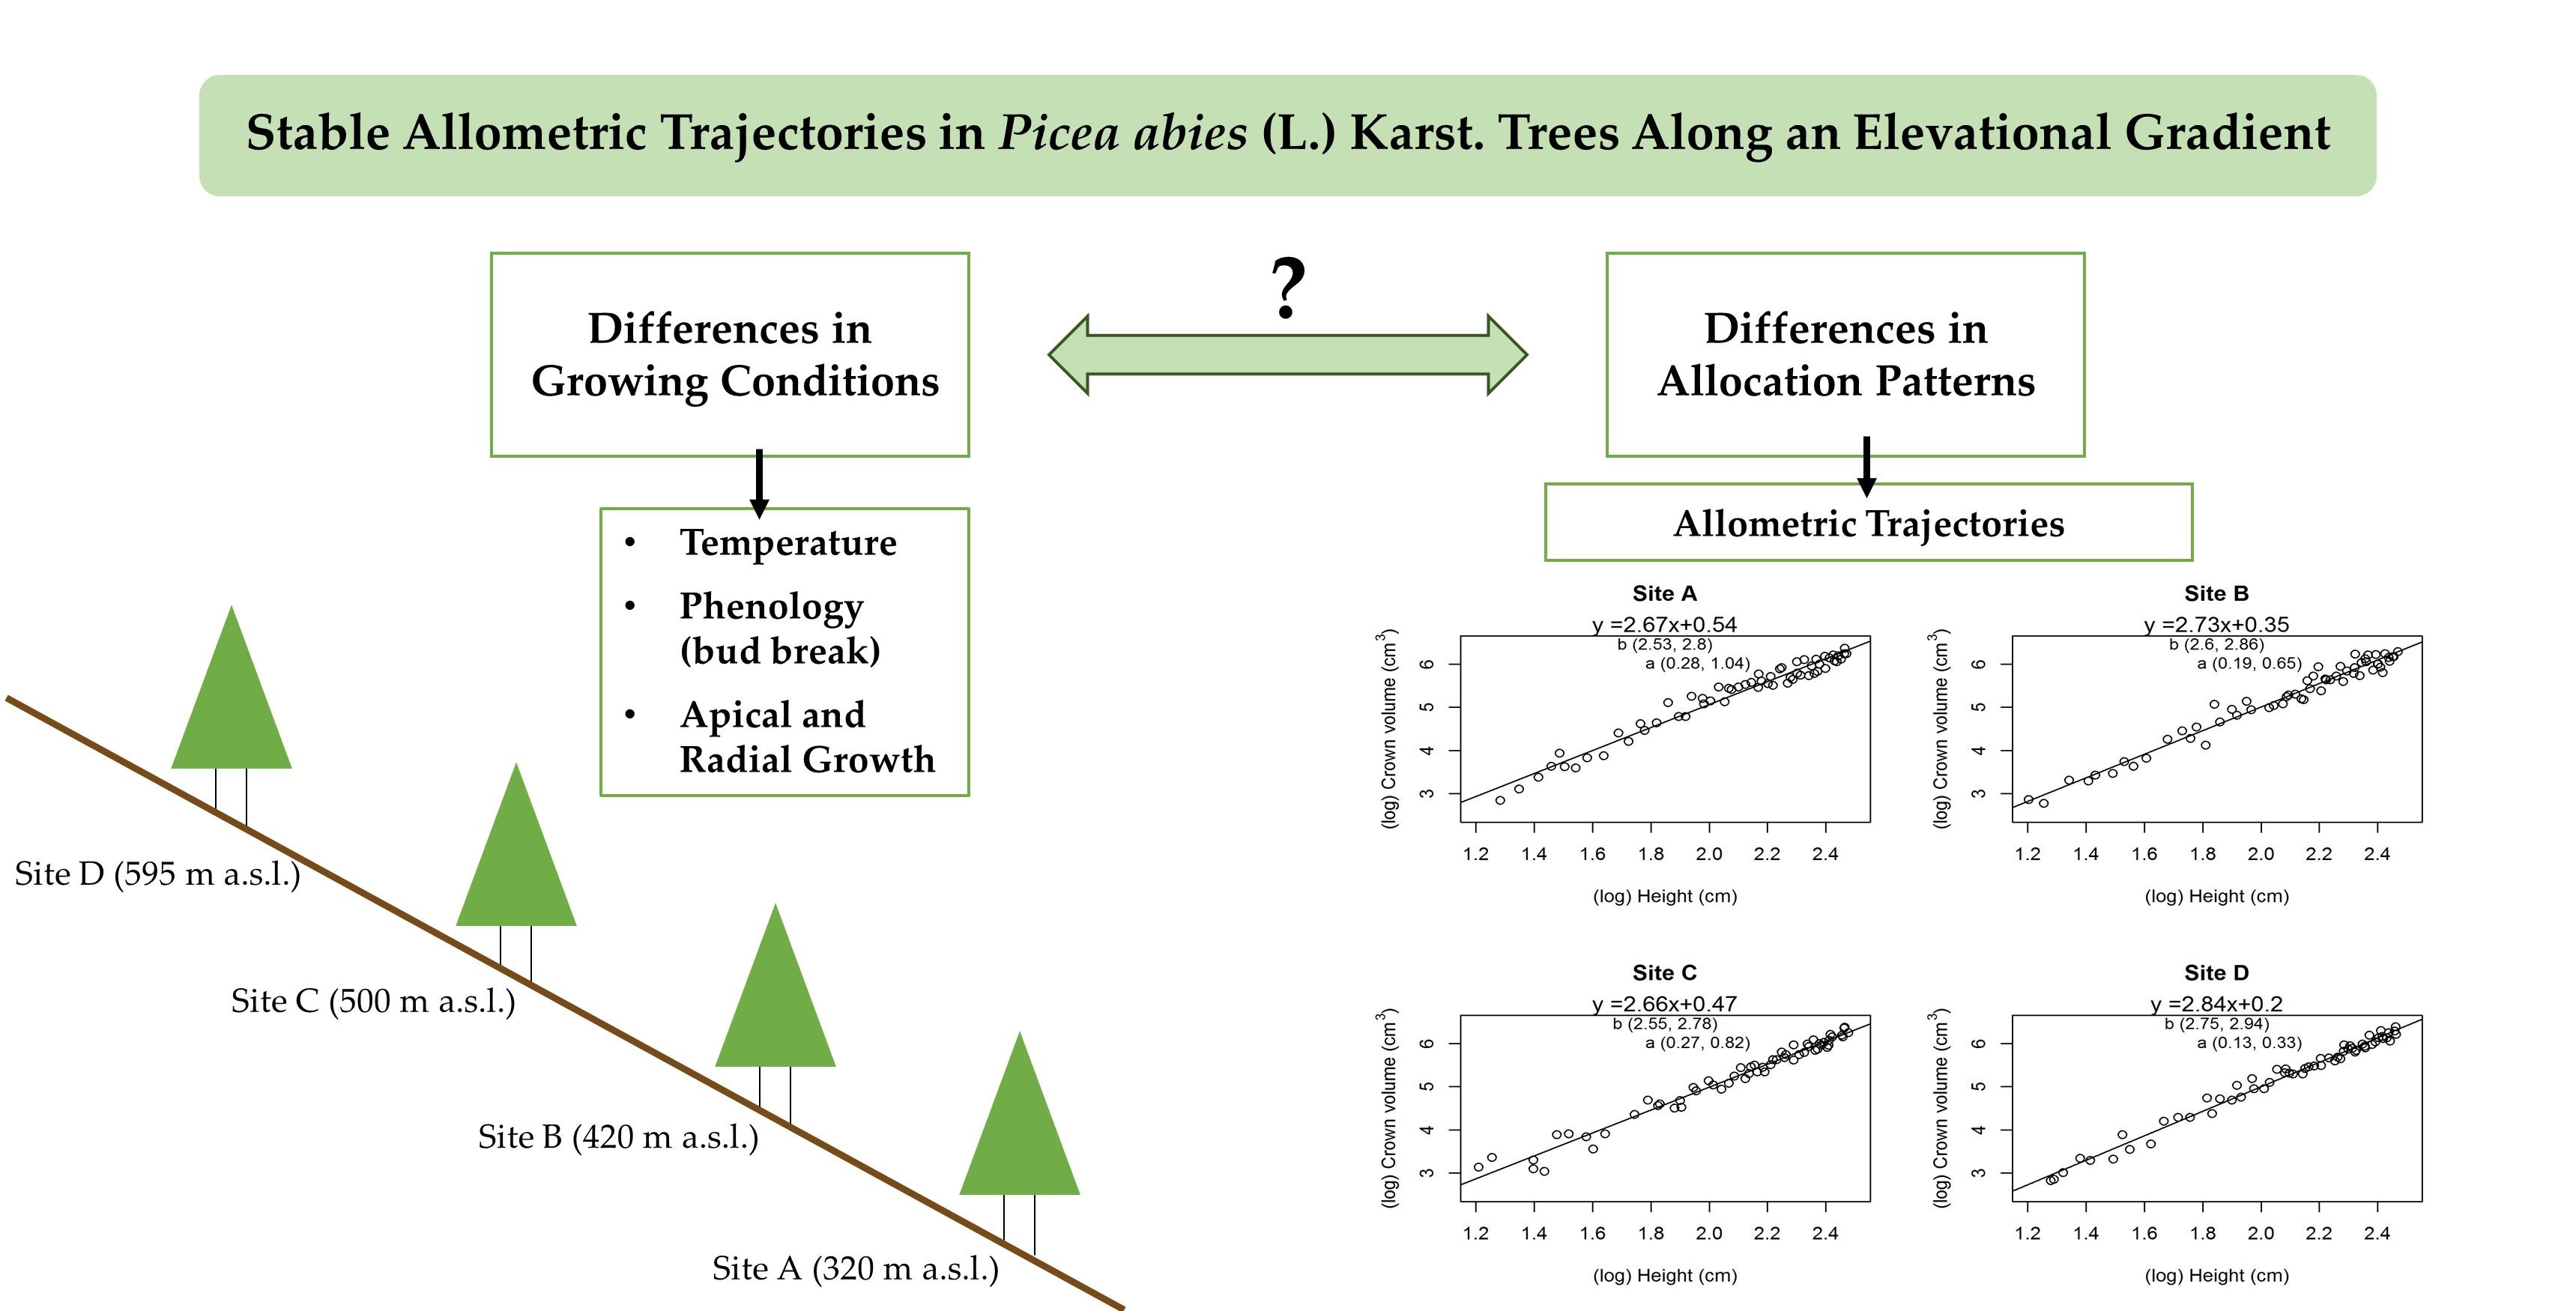
Stable Allometric Trajectories in Picea abies (L.) Karst. Trees along an Elevational Gradient


1
Department of Land, Environment, Agriculture and Forestry (TeSAF), University of Padua, 35020 Legnaro (PD), Italy
2
Department of Forestry and Wildlife Management, Faculty of Applied Ecology, Agricultural Sciences and Biotechnology, Inland Norway University of Applied Sciences, 2480 Evenstad, Norway
*
Author to whom correspondence should be addressed.
Forests 2020, 11(11), 1231; https://0-doi-org.brum.beds.ac.uk/10.3390/f11111231
Submission received: 26 October 2020
/
Revised: 14 November 2020
/
Accepted: 17 November 2020
/
Published: 23 November 2020
(This article belongs to the Special Issue Growth and Allocation of Woody Biomass in Forest Trees Based on Environmental Conditions)
Abstract
:The effect of temperature on tree phenology and growth has gained particular attention in relation to climate change. While a number of reports indicate that warming can extend the length of the growing season and enhance tree growth rates, it is still debated whether temperature also affects biomass partitioning. Addressing the question of whether trees grown at different elevations invest similarly in various organs, we established four sites along an elevational gradient (320 to 595 m a.s.l.) in managed Norway spruce (Picea abies (L.) Karts) stands regenerating after clearcuts in central Norway. There, differences in temperature, bud break, tree growth, and allometric scaling were measured in small spruce trees (up to 3 m height). The results showed that bud break and shoot growth are affected by temperature, as lower sites completed the bud break process 5 days earlier than the higher sites did. There was some evidence indicating that the summer drought of 2018 affected tree growth during the season, and the implications of this are discussed. The allometric scaling coefficients did not change for the crown volume (slope value range 2.66–2.84), crown radius (0.77–0.89), and tree diameter (0.89–0.96) against tree height. A slight difference was found in the scaling coefficients of crown length against tree height (slope value range 1.04–1.12), but this did not affect the general scaling of the crown volume with tree height. Our results showed that different local environmental conditions affect both the growth rate and phenology in Norway spruce trees but, on the contrary, that the biomass partitioning among different parts of the tree remains essentially unchanged. This demonstrates that the allometric approach is an important tool for unraveling true vs. apparent plant plasticity, which in turn is an essential awareness for predicting plant responses to environmental changes.
1. Introduction
In temperate and boreal ecosystems, trees shift between growth and dormancy in cycles that are synchronized with seasonal environmental change, allowing survival in unfavourable seasons. These cycles are defined by physiological processes occurring in different plant tissues in response to local variations in temperature, day length, and light in terms of quantity and quality [1,2,3,4]. In addition, the magnitude and direction of phenological response to changes in temperature can be species-specific and/or site-specific [1,5]. Moreover, the uncertainty pertaining to climate change in terrestrial ecosystems calls for a better understanding of the thermal regulation of tree phenology and growth [5,6,7,8].
It is well known that growing seasons are shorter in colder climates—e.g., at higher latitudes and elevations [9,10,11]. Still, there is need for more species-specific research on the direct effect of temperature on phenology in the field, since most studies take place in controlled- and semi-controlled settings and therefore do not account for natural fluctuations in environmental conditions [3]. Temperature is the main environmental factor influencing bud break and apical growth in temperate and boreal climates [1,12,13], so we expect a later start of the growing season and lower growth rates at higher elevations. In these environments, temperature represents one main limiting factor for tree growth. The increase in temperatures due to anthropogenic climate change will therefore affect the distribution of many boreal tree species, both because of a change in environmental conditions [14,15] and because of an increased frequency and intensity of disturbance events such as fire [16,17] and windstorms [18].
Norway spruce is one tree species which will be affected by climate change. Its vast distribution, which spans from sea level in Northern Europe to 2400 m a.s.l. in the Italian Alps [19], makes it susceptible both to expansion and disturbance dynamics in the future [20,21]. The rapidity of climate change, opposed to the slow rate of expansion associated with seed dispersal, may cause the species distribution to shrink significantly [22,23] Additionally, the increased frequency of primary and secondary disturbances will decrease vitality in spruce forests [20,24]. Studying the effect of temperature on spruce growth and phenology in northern climates under field conditions can therefore provide significant contributions to the ecological knowledge of a tree species of primary ecological and economic importance in Northern Europe [19,25]. In particular, we ask whether spruce acclimates to colder, less favourable growth conditions by modifying its biomass partitioning. To answer this question, we adopt an allometric perspective and study how the scaling relationships of different functional traits vary during ontogenesis in a natural field setting.
Allometry is based on the observation that many traits (morphological, physiological, and ecological traits alike) in living organisms are integrated at the genetic, physiological, functional, and developmental levels [26]. Allometric relationships have been observed extensively in plants and are well known in forestry and forest ecology [27], and allometric models have long been used to infer valuable information, such as timber volume or global C stocks, from easily measurable field data [28,29,30,31].
At the tree level, allometric relationships define the balance that must exist between different functional parts in order to maintain functionality and increase fitness [32]. The fact that these scaling relationships are commonly observed within a very limited set of possible exponents suggests a strong driver of natural selection against individuals that deviate from “the least-bad” structure [33,34] and underlies existing models [35,36,37] and theories [38,39]. However, there is still uncertainty regarding the stability of allometric relationships between certain structural parts [30,40,41,42].
Investigating allometric scaling trajectories and their continuity or variations under different conditions (tree species, elevation, latitude, forest structure, stage of recovery from previous disturbance, etc.) can therefore provide significant contribution to the interpretation of forest structure and dynamics. In particular, studying allometric trajectories can give valuable insight into plant allocation patterns [43,44,45,46]. Reich et al. [47] found that trees allocate more biomass to leaves in warmer climates, while root development is favored in colder, nutrient-limited environments. This trend is more pronounced in conifers, therefore we could expect Norway spruce to grow comparatively fewer leaves at higher elevations. However, other studies have found little variations in the relationship between crown volume and tree height in forests with different compositions, disturbance histories, and elevations, but within limited latitudinal ranges [35,36,37]. This highlights the need for more field-based research on the drivers of tree structural balance and allocation patterns.
In this study, we aim to address gaps in existing knowledge on the climatic regulation of allocation patterns in Picea abies. Our objective is to contribute to the understanding of basic drivers of biomass partitioning. We focus on temperature, which is a particularly critical factor in the context of global warming. By adopting an allometric approach to quantify differences in the structural balance of trees, we propose a simple and easily replicable method to discern between true and apparent plasticity. Furthermore, by studying the variability of allometric trajectories within juvenile stands, we aim to unravel the variability of allocation patterns in young trees, an under-represented aspect in the literature since most studies compare the allometric scaling of juvenile stands to mature forests [31,48,49,50,51]. Therefore, we provide observational data that can improve our current understanding of environmental influence over a critical phase of stand development in a key European tree species.
In order to investigate possible variations in growth and allometric scaling trajectories due to temperature, we measured Norway spruce saplings along an elevational gradient in a northern continental climate. To quantify the differences in growing conditions, we observed the bud break process and tree growth throughout the season in relation to measured temperatures in selected plots. Further, we investigated whether the trees modified their structural balance in response to environmental variations by comparing allometric scaling trajectories.
Therefore, we aimed to test:
- The influence of temperature on bud break and tree growth in order to quantify differences in the growing conditions along the gradient;
- The stability of allometric trajectories with ontogenesis along the gradient.
We expect a positive effect of temperature on bud break and tree growth. The evidence behind this expectation comes from existing literature on the subject, which agrees on identifying temperature as the main environmental cue influencing bud break [1,2,12,13].
We also expect that allometric relationships, given their fundamental importance in determining tree fitness, are constant along the gradient. This hypothesis is based on the general quantitative theory of forest structure and dynamics [38,39] and is backed by existing studies providing evidence of the stability of allometric relationships despite environmental variations [33,35,36,37].
2. Materials and Methods
2.1. Experimental Set
The study area (61°25′29.9″ N, 11°04′46.6″ E) is located on a hillslope in the Glomma river valley, Inland county, Norway. The climate is continental, with a precipitation peak during the summer and generally low temperatures, resulting in a boreal biome (Figure 1). The conditions during data collection in the summer of 2018 were exceptionally warm and dry due to a severe drought that happened in Central and Northern Europe at the time. The event was quantified as “unprecedented” by Buras et al. [52]. In Norway, the season was described as “the hottest and driest summer since registrations started back in year 1900” by the Norwegian Meteorological Institute [53]. Available data suggest a strong influence of the drought on the study area, with the mean temperatures in May and July being more than 5 °C higher than average and the precipitation levels in July and August being more than 50 and 30 mm, respectively, lower than usual (Figure 1).
The field study was set up in mono-layered stands, dominated by Norway spruce and managed with a production purpose. Study sites were distributed among stands that underwent clearcutting between 2010 and 2011 and were planted with saplings in 2012: site A (320 m a.s.l.), B (420 m a.s.l.), C (500 m a.s.l.), and D (595 m a.s.l.).
The varieties of Norway spruce planted in the sites were “Opsahl” in sites A, B, and C and “Kaupanger” in site D. Opsahl was selected to maximize stand yield in the climatic conditions of the area. Seeds belonging to this variety were collected from stands with an average latitude of 61.11° N [54]. Kaupanger, on the other hand, was selected for its resistance to frost, particularly because of the anticipated dormancy in autumn. The average latitude of origin was 61.23° N [55]. In the field, we were not able to distinguish between individuals of natural and artificial origins. We accounted for this possible source of variation by including tree variety in our models, which allowed us to test its effect on growth and phenology at the site level.
2.2. Local Performance
To measure phenology and growth during the growing season, we established five plots for each site. The plots were established sparsely to account for possible local variations within the stand, while following these criteria: (i) areas with rocky or steeper soil were avoided, trying to limit the difference in soil water availability; (ii) each plot was more than 15 m from the border with the nearest forest stand. This was done to limit the edge effect of the nearby mature forest ecosystem due to shading and belowground competition.
After the determination of each plot center, we selected 10 juvenile trees among healthy individuals (showing no signs of desiccation or missing apical bud) in the vicinity of the center. Five plots were selected for each site, yielding 50 trees per site and a total of 200 trees across the sites. These individuals were marked with red tape and given IDs. This was done to perform repeated measurements of the following growth processes:
- Apical bud break process, measured every two days from 18 May to 5 June 2018;
- Apical shoot elongation, measured every three weeks from 23 May to 4 September 2018;
- Diameter at 20 cm from root collar, measured every three weeks from 23 May to 4 September 2018.
Our study design limited us to certain tree sizes and prevented us from performing a random sampling of trees, therefore sampled individuals should not be considered representative of the whole site in terms of tree size.
The values of apical shoot growth and diameter increment were normalized over tree height and diameter, respectively, as recorded at the start of the season. This allowed us to evaluate and compare the growth rate of trees of different dimensions during the season. The height and diameter values used for the normalization were measured at the start of the growing season.
Apical stages of bud break were classified using a phenological scale dedicated to spruce, adapted from Fløistad and Granhus [56]: (0) dormant buds; (1) buds slightly swollen; (2) buds swollen, bud scales still covering the new needles; (3) bud scales diverging, no elongation of needles; (4) elongation of needles, needles not yet spread; (5) needles spread. Compared to the original scale [56], ours is shorter and relies only on qualitative aspects. We removed stages relying exclusively on quantitative criteria, as they are inaccurate in evaluating bud break under field conditions.
At each plot, temperature loggers were installed, yielding a total of 20 loggers. We used HOBO 8K pendant® waterproof temperature loggers (Onset Computer Corporation, 470 MacArthur Blvd., Bourne, MA, USA), each placed inside a white solar shield case specifically built to shelter the logger from the influence of direct sunlight while also granting aeration. Temperature data were logged every 10 min. Due to logistic problems, the loggers were installed in the field as late as 3 July, well into the growing season. We recorded data from the 3 July until 24 September. We obtained the missing data (15 May to 3 July) by imputation, modelling the relationship between each logger and the Evenstad weather station, which was located 4 km away from the sites. The specific coefficients defining these relationships are available in Table S1 of the Supplementary Materials.
2.3. Allometric Relationships
The collection of allometric data occurred in the same sites (i.e., the same clearcut stands) as the measurement of bud break and growth.
We sampled trees varying from 10 to 300 cm in height and divided them into six groups on the basis of height: 0–50, 50–100, 100–150, 150–200, 200–250, and 250–300 cm. We sampled 10 trees per height interval, resulting in 60 trees per site and a total of 240 trees. Each tree was only sampled once; we sampled all sites between 19 and 24 September.
Because of this height range constraint, the trees sampled for allometric data included, but were not limited to, individuals on which we performed phenological and growth analyses. Plants were sampled based on their height and health status (no visible sign of desiccation, no broken branches or missing tips). We took the following measurements: (1) tree height; (2) tree base diameter; (3) crown radius (Rcro)—i.e., the distance between the tip of the longest branch and the stem; (4) crown insertion height—i.e., the distance between the lowest active branch in the canopy and the ground. From these, we obtained also (5) crown length (Lcro)—i.e., the distance between the lowest active branch and the apical tip—and (6) crown volume (Vcro), obtained by multiplying the crown length by the square of the crown radius (Vcro = Lcro × Rcro2). As in previous studies [35,36], this simple formula is preferred over other approaches to estimate crown volume because it easily allows one to investigate the relative change in crown volume—namely, the scaling exponent of Vcro—with tree height. The use of more complicated formulas to approach crown shapes (e.g., cone) does not improve the estimation of scaling parameters.
2.4. Statistical Analyses
All the statistical analyses were performed using the R software, version 3.6.1 [57].
We first tested for significant differences in the growing conditions between different sites. We applied analysis of variance (ANOVA) to test for differences in temperature, phenology, and growth. For temperature, we compared the mean of hourly temperatures. For phenology, we considered the day (in progressive “day of the year” DOY values) on which the final stage of bud break (stage 5) was reached. For growth, we considered the total apical shoot elongation and total diameter increment values, normalized over tree height and tree diameter, respectively.
We applied either the parametric ANOVA or Kruskal–Wallis tests depending on the data distribution. Normality in the data and residual distribution was tested with the Shapiro–Wilk test. The homogeneity of variance was tested with the Bartlett test.
Since the ANOVA only reveals that “at least” one site is different from the others, in the case of significant (p < 0.05) response we applied the Tukey (for parametric ANOVA) or Dunn (for Kruskal–Wallis) post hoc tests to determine specific differences between sites (complete statistical outputs available in Table S2 of the Supplementary Materials).
Additionally, we fitted mixed-effect models on phenology and growth to test the influence of temperature, daylength, date, and variety over the processes of bud break (including all observed stages) and apical shoot elongation (including all elongation measurements). In that respect, the temperature values from each plot were linked to the response variables measured from the saplings in the plots. For the mixed-effect models, we included plot (i.e., each plot’s ID) as a random term when it improved the model and thus accounted for non-measured local environmental variations. We applied cumulative link mixed-effect models (R package “ordinal” [58]) to phenological-scale values, testing for the effect of temperature, daylength, and variety. We applied linear mixed-effect models (R packages “lme4” [59] and “lmerTest” [60]) to apical growth values, testing for the effect of temperature, date, and variety. We tested whether the inclusion of a random variable improved the models by comparing the AIC (Akaike Information Criterion) values of the mixed-effect models with that of models which did not include random variables (glm for continuous variables and clm for ordinal variables). Finally, we performed an AIC-based model selection using the dredge automated model selection function in the “MuMIn” package [61].
Repeated measurements of tree diameter resulted in being very prone to measurement errors because of the field conditions and small size scale of our trees. In order to reduce the error, we only used the first and last measurements to obtain the total diameter increment for the whole season. This allowed us to test for differences between the sites using ANOVA, but the full data series was not reliable for mixed-effect modelling.
Finally, we investigated allometric scaling to assess whether differences in growth are reflected in differences in the structural balance of the trees. We considered the scaling of crown volume, crown radius, crown length, and tree base diameter over tree height. All the scaling parameters were transformed by a base 10 logarithmic function, which allowed us to model the allometric relationship as a linear regression (Equation (1)) [62].
where y and x are the structural traits being considered (e.g., crown volume and tree height) and b is the scaling exponent and a is the intercept—i.e., the coefficients that define the relationship.
(log)y = b(log)x + (log)a,
This approach allowed us to the quantify site-specific values for the allometric scaling exponent (b). Comparing b values, we were able to investigate the variation in allometric trajectories along the elevational gradient—i.e., the structural balance between traits—in different sites. Similarity or differences between sites are expressed by the confidence intervals (C.I.) of the b parameter; overlapping C.I. values for the b parameters indicate similarity.
3. Results
3.1. Local Performance
The ANOVA revealed significant (p < 0.001, χ2 =21.158, df = 3) temperature differences between the sites. The post hoc Dunn test identified the two lower (A and B) and the two higher (C and D) sites as statistically different (Table 1 and Table 2), with higher mean temperatures at lower elevations. More specifically, site A was warmer than sites C (p < 0.001) and D (p = 0.002). Similarly, site B was warmer than sites C (p = 0.005) and D (p = 0.018).
The tree size variables varied in a similar fashion, as the ANOVA results identify significant differences between sites also for height (p < 0.001, F = 13.4, df = 3) and diameter (p < 0.001, χ2 = 26.232, df = 3) values, measured at the start of the season (23 May). Post hoc tests revealed differences between the two lower and two higher sites, with trees being smaller at higher elevations (Table 3). The trees in sites A and B resulted in being higher than the trees in sites C and D, with p-values < 0.001. The trees in site A also had larger diameters those in than sites C (p < 0.001) and D (p = 0.009). Similarly, individuals in site B had larger diameters than those in sites C (p < 0.001) and D (p = 0.004).
To compare the timing of growth onset across sites, we considered the day of completion of the bud break process—namely, the date in which each individual reached stage 5 of the phenological scale. It took 13 days, from 18 May to 31 May, for all individuals in sites A and B to complete the bud break process. This happened 5 days earlier than in sites C and D, where the process was completed on 5 June (Figure 2).
The mean date of completion of the bud break process is only one to two days earlier in lower sites A and B (Table 4). Nevertheless, applying ANOVA revealed significant (p = 0.0015, χ2 = 15.395, df = 3) differences between the sites. The post hoc analysis results indicate an earlier mean date of bud break in site A than in site D (p = 0.017) and in site B than sites C (p = 0.021) and D (p = 0.003) (Table 4).
The CLMM that was applied on the apical stage data included the random variable “plot”, and indicated a significant (p < 0.001, Z = 28.15, S.E. = 0.03002) positive (0.845) correlation between temperature and bud break. Tree variety and daylength were discarded during model selection, indicating no influence of these variables over the bud break process.
Tree growth differed significantly between sites according to ANOVA, in terms of both normalized apical shoot elongation (p = 0.0318, F = 3, df = 3) and normalized diameter increment (p = 0.0014, χ2 = 15.51, df = 3). The differences in apical growth are limited, as the only significant difference is between sites A and C (p = 0.048), with site A growing comparatively less than site C. The differences in diameter increment are stronger, as the normalized radial growth in site A was lower than in sites C (p = 0.0138) and D (p = 0.0026), and lower in site B than in site D (p = 0.03) (Table 5). These differences do not follow the same elevational pattern observed for temperature, tree size, and phenology; when looking at normalized growth values, trees in lower sites grew similarly or even less than those at higher elevations.
The LME (linear mixed effect) model applied to apical shoot growth for the whole growing season showed a significant positive influence of temperature on growth (coeff = 14.1238, p = 0.00904, t = 2.619, S.E. = 5.39236). The inclusion of “date” improved the model but did not have a significant effect (p = 0.16104, t = 1.403, S.E. = 0.52593). Date, however, had a significant negative interaction with temperature (coeff = −0.07035, p = 0.01252, t = −2.505, S.E. = 0.02809), indicating that the influence of temperature on apical shoot growth decreased over time. Including “plot” as a random variable accounting for environmental variation improved the model, while the “variety” variable was discarded during model selection.
Unexpectedly, the diameter increment during the season displayed a peaks-and-trough pattern. This pattern was found in all four sites, but the trough was deeper in lower sites (Figure 3). In the three-week period from 13 June to 4 July, the average normalized diameter increment values were lower in all sites if compared with the previous and following three-week periods. This means that the growth either slowed down or stopped altogether in the middle of the season. The normalized apical shoot growth values do not show any interruption and simply decrease to a stop, with most of the elongation being over by 4 July (Figure 3).
3.2. Allometric Relationships
The slope coefficients in the linear regression function, modelling the allometric scaling of the crown volume vs. tree height, did not show significant differences among sites (Figure 4).
Further modelling of the allometric scaling of structural parameters other than the crown volume supports this result, with the allometric trajectories being consistently similar in all sites for the values of tree diameter (D), crown length (Lcro), and crown radius (Rcro) over tree height (H) (Table 6). One single exception is the Lcro vs. H relationship in site A (Table 6), whose b value is significantly higher than in other sites.
4. Discussion
Our results are in line with the present literature concerning the role of temperature in regulating bud break in northern tree species [1,2] and provide detailed modelling of this process under field conditions. This increases the strength of the current projections, associating an earlier growth onset with the increasing temperatures linked to climate change [5,6,7].
Similarly, we expected to see higher growth rates in warmer sites, but the normalized values of apical and radial growth appear irregular and do not follow the same pattern as the elevational temperature gradient. When looking at the radial increment values (Figure 3), our data point to a slowing in the tree growth rate during the season, which contrasts with existing knowledge [63] and possibly indicates the influence of the year’s drought.
Although we lack the necessary data to determine the drivers behind these patterns, we argue that the observed significant differences in growth rates point to differences in the growing conditions between sites. Despite these variations, we find that the exponents of allometric trajectories are similar in the four sites. This provides evidence that spruce saplings maintain the same trajectories of structural balance during growth, regardless of the local growing conditions.
The measured temperatures along the elevational gradient indicate two distinct local climates: a “lower” area, comprising sites A and B and ranging from 320 to 420 m a.s.l., and a “higher” area comprising sites C and D and ranging from 500 to 595 m a.s.l. (Table 1 and Table 2). The sampled trees in these sites seem to mirror these conditions, with trees in low-elevation sites (A–B) being significantly bigger than those at higher elevations (C–D) both in height and diameter (Table 3). Similarly, the positive influence of temperature on bud break caused saplings at the lower, warmer sites A and B to experience a faster growth onset. Lower sites showed a faster rate of completion (perc. of trees reaching the final stage) during the whole period (Figure 2), and completed the process 5 days earlier than the higher sites did. Differences in the mean day of completion of the bud break process are limited, amounting only to one to two days, but still indicate a later start of the season at higher elevations (Table 4). This is consistent with existing knowledge, as temperature is the main environmental cue influencing bud break in northern tree species [1,2] and temperatures decrease with increasing elevation, resulting in delayed bud break [9,10,11].
Despite the variation in phenology across elevation, the measured values of tree growth did not follow such a pattern, as the growth rate variables were generally of smaller value at lower elevation, and the differences between the sites were much less pronounced. The values of normalized apical shoot elongation appear to be significantly different only between sites A and C, with trees in the lowest site A producing comparatively shorter shoots. Differences in the normalized diameter increment are slightly more evident (Table 5), but again indicate that trees in lower sites had a comparatively lower radial increment than trees in higher sites. Overall, it appears that bigger trees in lower sites (A and B) grew comparatively less than smaller trees in higher sites (C and D) during the season. This appears to be in contrast with the well-known direct correlation between temperature and growth rate, as confirmed by our modelling. This inconsistency could be explained, at least for radial growth values, by the pattern of measured values during the season (Figure 3). Rossi et al. [63] found that conifers in cold climates increase their radial growth rate with day length, with a peak at the day of maximum day length. This would be the summer solstice, 21 June 2018—i.e., at the time of the season when we recorded the lowest radial growth rates (Figure 3). This discrepancy is likely due to the summer drought of 2018 [52,53]. Severe effects of the drought on forests were observed in Central Europe during the same event [64], and similar or worse effects likely happened in Scandinavia, where deviations from the norm where stronger [52].
The warm and dry conditions of the summer may have caused the peak-and-trough pattern either by slowing down the tree growth or by causing the shrinking of the xylem cells due to dehydration [65]. It appears that lower-elevation sites were more affected by this event (Figure 3). This would explain the comparatively higher radial growth values observed in the higher-elevation sites C and D (Table 5), where lower temperatures may have diminished the drought effect. This is an untested hypothesis, since assessing and quantifying the local impacts of the drought was not within the scopes of our study and would need further investigation. Furthermore, the fact that our measurements cover such a small area makes it difficult to generalize our results. However, given the existing knowledge on the effects of the 2018 summer drought [52,64] and the prospected increase in the frequency of extreme events due to ongoing clime change [66], we consider this aspect of our study relevant enough to be discussed.
The growth rate pattern for the normalized apical shoot elongation values is consistently similar in all sites; after an initial peak, it slows down and almost stops by 4 July (Figure 3). The significant negative effect of the interaction between the temperature and date variables shows a decrease in the positive effect of temperature on growth over time. This is due to apical growth cessation during the season, while temperatures are still high. Unlike radial growth, there is no recovery in the growth rate after it slows down. This may be caused by the fixed growth pattern of P. abies; at the start of the season, the bud already contains all the cell primordia that will develop during the season [2]. As soon as the pre-determined number of cells has developed, apical shoot growth stops and the apical bud enters dormancy. We have no way to establish whether the apical shoot growth ceased because all of the bud primordia properly developed or because the drought forced an early dormancy of the apical buds.
Variety does not seem to have a significant effect on bud break or apical shoot elongation. This is unexpected, as the characteristics of the two varieties are very different. Trees planted in sites A, B, and C belong to the “Opsahl” variety and are selected to maximize stand yield [54,55]. Therefore, we expected to see some differences—e.g., higher growth rates in these sites. Our sampling involved both natural and artificial regeneration, so it is possible that we sampled few individuals of non-local origin and the influence of genotypes was not represented in the dataset. Another possibility is that the drought offset the effect of different varieties. If lower-elevation sites really grew less because of the drought, this may have counterbalanced the effect of the “Opsahl” variety. Again, it should be noted that this hypothesis is untested, but this should be discussed and investigated by future studies. The possible management implications for Scandinavian forestry in the face of climate change are huge, given the importance of Norway spruce in the area [19]. As the tree species distribution is projected to change dramatically [14,15], spruce forests will experience more frequent primary and secondary disturbances [22,24]. Observed and predicted increases in forest growth with global warming [67,68] could be disrupted by these events, as noted by other studies [69,70]. Our results seem to point in this direction, and highlight the need for more field-based studies to adapt future silviculture to the changing climate.
Although the variations in tree growth rates during the season do not reflect the elevational temperature gradient, they were significant nonetheless. This points to local differences in growing conditions, with factors other than temperature influencing growth onset and growth rates during the same season. Despite these differences, the scaling exponents that define the allometric relationships of structural parts of the trees do not vary significantly (Figure 4, Table 6). This means that crown volume, stem diameter, crown length, and crown radius grow similarly, in relation to tree height, in all four sites. The only exception appears to be the scaling relationship Lcro vs. H (Table 6), as the scaling value C.I.s of site A do not overlap with other sites, being slightly higher. A higher scaling value of Lcro vs. H means that the trees in site A tend to favor vertical growth over time. This is offset by the relatively lower scaling rate in site A for Rcro vs. H (Table 6). As a result, the scaling of Vcro vs. H is the same in all sites (Figure 4). Therefore, it would appear that trees in site A develop comparatively narrower crowns over time.
The difference between the slope values of Lcro vs. H is minimal, yet this is a noteworthy discrepancy since the common knowledge is that Norway spruce tends to grow narrower crowns in colder, harsher environments typically associated with higher elevations and latitudes [71,72]. The fact that this applies to the lowest and warmest site A is surprising. It was observed in the field that competition with Betula spp. is stronger at lower elevations, likely because of the higher temperatures. It is possible that this drives spruce saplings in site A to favor vertical growth in early development phases. Despite this, the general balance between productive organs (in our case, crown volume) and tree dimension (tree height) follows the same trajectory in all sites. An important aspect of our study is that the regeneration of both natural and artificial origin comes from a restricted range of latitudes (61.11° N to 61.25° N). Another study conducted by Anfodillo et al. [35] found that the scaling exponent of crown volume versus tree height does not vary significantly (2.22 to 2.31) between four temperate mountain forests with different composition and disturbance levels but within a restricted range of latitudes (46.06° N to 47.27° N). Sellan et al. [36] obtained a similar outcome when comparing the scaling exponents (3.30 to 3.38) of three tropical forest plots with different species richness and composition between 0° and 1° N. Therefore, latitude appears to be one major factor influencing the slope of the locally optimal allometric relationships between these traits.
The continuity in the measured scaling exponents supports the hypothesis that allometric relationships are fundamental to tree functioning and, therefore, that trees acclimate to local conditions by changing their growth rate while maintaining an optimal structural balance during onthogenesis [33]. From this perspective, allometric relationships are a major constraint that governs tree growth, and can be a powerful tool in modelling tree and forest dynamics. This is consistent with the general quantitative theory of allometry proposed by West, Brown, and Enquist [38,39]. It is fundamental to keep in mind that this is observed for the scaling of structural parts versus tree height. The scaling of traits versus diameter has shown more variability in response to environmental variation [30,40,73].
5. Conclusions
In this study, we quantified the influence of temperature on bud break and growth under field conditions. Temperatures follow an elevational gradient, being higher in lower sites and positively influencing the bud break process. Consequently, the season started earlier at lower elevation sites. Differences in growth appear less consistent with temperature, as the bigger trees in the lowest, warmest site A grew comparatively less than in the higher sites C and D. The values of diameter increment during the season point to a possible negative influence of the exceptional 2018 summer drought, which would explain this discrepancy.
The measured differences in temperatures and growth point to significant differences in local growing conditions. Despite this, the allometric relationships of crown volume and tree diameter versus tree height do not vary along the elevational gradient. This indicates that young spruce trees do not appear to modify their structural balance and biomass partitioning to acclimate to local conditions. The allometries of crown length and crown radius versus tree height are stable as well, with the exception of a minor difference in crown length in site A, which did not have an impact on the overall crown volume–height balance.
Our data support the hypothesis that maintaining specific allometric trajectories is fundamental for tree functioning, even at such a young age of tree and stand development. By comparing the growing conditions and allometric scaling in Norway spruce saplings, we offer insight into the ecological factors regulating its growth and allocation patterns. We show that the simple application of an allometric approach can provide valuable information on true vs. apparent plant plasticity, thereby increasing our understanding of tree and forest dynamics and our predictive ability in the face of climate change.
We recommend that future studies wishing to understand variations in tree biomass partitioning adopt a similar allometric-based perspective. On a broader scale, further investigations are needed to fully understand the drivers of allometric scaling in trees. Working along gradients is one efficient way of testing for the variations and drivers of tree and forest growth in the ongoing effort to formulate a comprehensive theory. Additionally, our results highlight the importance of field-based studies that allow for unforeseen changes in environmental conditions. As climate change intensifies, extreme events such as droughts are projected to increase in a diffused manner [66], and field studies can provide useful data on tree responses to such disturbances.
Supplementary Materials
The following are available online at https://0-www-mdpi-com.brum.beds.ac.uk/1999-4907/11/11/1231/s1: Table S1: Intercept and slope values defining the relationship between the temperature in each plot and the Evenstad weather station. These values were used to compute missing temperature values for the period ranging from 15 May to 3 July, Table S2: Results for post hoc tests performed to identify statistical differences between sites. “Comparison” columns indicate the two sites being compared. Significance levels for p-values: “***” 0.001, “**” 0.01, “*” 0.05. Z = Z value for Dunn test; p.unadj = unadjusted p-value for Dunn test; p.adj = p-value adjusted to multiple comparisons; diff = difference in average between compared sites; lwr = lower value for 95% C.I.; upr = upper value for 95% C.I.
Author Contributions
Conceptualization and methodology, C.M., C.B.S. and T.A.; formal analysis, C.M., C.B.S. and T.A.; investigation, C.M., C.B.S.; resources, C.B.S.; data curation, C.M., C.B.S.; visualization, C.M.; writing—original draft preparation, C.M.; writing—review and editing, C.M., C.B.S. and T.A.; supervision, C.B.S., T.A. All authors have read and agreed to the published version of the manuscript.
Funding
This research received no external funding. The APC (Article Processing Charges) were partially funded by the Department of Land, Environment, Agriculture and Forestry (TeSAF) of the University of Padua, 35020 Legnaro (PD), Italy.
Acknowledgments
We would like to thank J. Olsen from NMBU, Ås (Norway) for sharing her knowledge of boreal tree species phenology; R. Aamold from the Norwegian Forest Management Company (Statskog), for allowing us to work in the stands and providing useful information about forestry practices and tree provenances; A. Poleo from the Dpt. Of Forestry, Wildlife and Management, INN, Evenstad (Norway) for providing the temperature loggers for our study. This study was conceived and fieldwork carried out during an Erasmus+ study exchange program financed by the European Union.
Conflicts of Interest
The authors declare no conflict of interest.
References
- Hänninen, H.; Tanino, K. Tree seasonality in a warming climate. Trends Plant Sci. 2011, 16, 412–416. [Google Scholar] [CrossRef] [PubMed]
- Junttila, O. Regulation of annual shoot growth cycle in northern tree species. In Physiology of Northern Plants under Changing Environment; Research Signpost: Kerala, India, 2007; pp. 177–210. [Google Scholar]
- Olsen, J.E. Light and temperature sensing and signaling in induction of bud dormancy in woody plants. Plant Mol. Biol. 2010, 73, 37–47. [Google Scholar] [CrossRef] [PubMed]
- Strømme, C.B.; Julkunen-Tiitto, R.; Krishna, U.; Lavola, A.; Olsen, J.E.; Nybakken, L. UV-B and temperature enhancement affect spring and autumn phenology in Populus tremula: Climate change effects on tree phenology. Plant Cell Environ. 2015, 38, 867–877. [Google Scholar] [CrossRef] [PubMed]
- Körner, C.; Basler, D. Phenology under Global Warming. Science 2010, 327, 1461–1462. [Google Scholar] [CrossRef] [PubMed]
- Cleland, E.E.; Chuine, I.; Menzel, A.; Mooney, H.A.; Schwartz, M.D. Shifting plant phenology in response to global change. Trends Ecol. Evol. 2007, 22, 357–365. [Google Scholar] [CrossRef]
- Khanduri, V.P.; Sharma, C.M.; Singh, S.P. The effects of climate change on plant phenology. Environmentalist 2008, 28, 143–147. [Google Scholar] [CrossRef]
- Morin, X.; Lechowicz, M.J.; Augspurger, C.; O’keefe, J.; Viner, D.; Chuine, I. Leaf phenology in 22 North American tree species during the 21st century. Glob. Chang. Biol. 2009, 15, 961–975. [Google Scholar] [CrossRef]
- Jyske, T.; Mäkinen, H.; Kalliokoski, T.; Nöjd, P. Intra-annual tracheid production of Norway spruce and Scots pine across a latitudinal gradient in Finland. Agric. For. Meteorol. 2014, 194, 241–254. [Google Scholar] [CrossRef]
- Moser, L.; Fonti, P.; Buntgen, U.; Esper, J.; Luterbacher, J.; Franzen, J.; Frank, D. Timing and duration of European larch growing season along altitudinal gradients in the Swiss Alps. Tree Physiol. 2010, 30, 225–233. [Google Scholar] [CrossRef]
- Rossi, S.; Anfodillo, T.; Čufar, K.; Cuny, H.E.; Deslauriers, A.; Fonti, P.; Frank, D.; Gričar, J.; Gruber, A.; Huang, J.-G.; et al. Pattern of xylem phenology in conifers of cold ecosystems at the Northern Hemisphere. Glob. Chang. Biol. 2016, 22, 3804–3813. [Google Scholar] [CrossRef] [Green Version]
- Hänninen, H. Effects of Climatic Change on Overwintering of Forest Trees in Temperate and Boreal Zones. In Proceedings of the International Conference on Impacts of Global Change on Tree Physiology and Forest Ecosystems, Wageningen, The Netherlands, 26–29 November 1996; Mohren, G.M.J., Kramer, K., Sabaté, S., Eds.; Forestry Sciences. Springer: Dordrecht, The Netherlands, 1997; pp. 149–158, ISBN 978-94-015-8949-9. [Google Scholar]
- Sarvas, R. Investigations on the Annual Cycle of Development of Forest Trees. Active Period; Communicationes Instituti Forestalis Fenniae: Helsinki, Finland, 1972; Volume 76. [Google Scholar]
- Dyderski, M.K.; Paź, S.; Frelich, L.E.; Jagodziński, A.M. How much does climate change threaten European forest tree species distributions? Glob. Chang. Biol. 2018, 24, 1150–1163. [Google Scholar] [CrossRef] [PubMed]
- Sykes, M.T.; Prentice, I.C. Climate change, tree species distributions and forest dynamics: A case study in the mixed conifer/northern hardwoods zone of northern Europe. Clim. Chang. 1996, 34, 161–177. [Google Scholar] [CrossRef]
- Amiro, B.D.; Stocks, B.J.; Alexander, M.E.; Flannigan, M.D.; Wotton, B.M. Fire, climate change, carbon and fuel management in the Canadian boreal forest. Int. J. Wildland Fire 2001, 10, 405–413. [Google Scholar] [CrossRef]
- Walker, X.J.; Baltzer, J.L.; Cumming, S.G.; Day, N.J.; Ebert, C.; Goetz, S.; Johnstone, J.F.; Potter, S.; Rogers, B.M.; Schuur, E.A.G.; et al. Increasing wildfires threaten historic carbon sink of boreal forest soils. Nature 2019, 572, 520–523. [Google Scholar] [CrossRef]
- Gregow, H.; Laaksonen, A.; Alper, M.E. Increasing large scale windstorm damage in Western, Central and Northern European forests, 1951–2010. Sci. Rep. 2017, 7, 46397. [Google Scholar] [CrossRef] [Green Version]
- San Miguel Ayanz, J.; de Rigo, D.; Caudullo, G.; Durrant, T.H.; Mauri, A. European Atlas of Forest Tree Species; Publication Office of the European Union: Luxembourg, 2016; ISBN 978-92-79-36740-3. [Google Scholar]
- Jönsson, A.M.; Linderson, M.-L.; Stjernquist, I.; Schlyter, P.; Bärring, L. Climate change and the effect of temperature backlashes causing frost damage in Picea abies. Glob. Planet. Chang. 2004, 44, 195–207. [Google Scholar] [CrossRef]
- Prentice, I.C.; Sykes, M.T.; Cramer, W. A simulation model for the transient effects of climate change on forest landscapes. Ecol. Model. 1993, 65, 51–70. [Google Scholar] [CrossRef]
- Bradshaw, R.H.; Holmqvist, B.H.; Cowling, S.A.; Sykes, M.T. The effects of climate change on the distribution and management of Picea abies in southern Scandinavia. Can. J. For. Res. 2000, 30, 1992–1998. [Google Scholar] [CrossRef]
- Pitelka, L.; Ash, J.; Berry, S.; Bradshaw, R.; Brubaker, L.B.; Clark, J.; Davis, M.; Dyer, J.; Gardner, R.; Gitay, H.; et al. Plant migration and climate change. Am. Sci. 1997, 85, 464–473. [Google Scholar]
- Schlyter, P.; Stjernquist, I.; Bärring, L.; Jönsson, A.; Nilsson, C. Assessment of the impacts of climate change and weather extremes on boreal forests in northern Europe, focusing on Norway spruce. Clim. Res. 2006, 31, 75–84. [Google Scholar] [CrossRef]
- Jansson, G.; Danusevičius, D.; Grotehusman, H.; Kowalczyk, J.; Krajmerova, D.; Skrøppa, T.; Wolf, H. Norway Spruce (Picea abies (L.) H.Karst.). In Forest Tree Breeding in Europe: Current State-of-the-Art and Perspectives; Pâques, L.E., Ed.; Managing Forest Ecosystems; Springer: Dordrecht, The Netherlands, 2013; pp. 123–176. ISBN 978-94-007-6146-9. [Google Scholar]
- Shingleton, A.W. Allometry: The Study of Biological Scaling. Nat. Educ. Knowl. 2010, 3, 2. [Google Scholar]
- Niklas, K.J. Plant Allometry: The Scaling of Form and Process; University of Chicago Press: Chicago, IL, USA, 1994; ISBN 0-226-58080-6. [Google Scholar]
- Chave, J.; Réjou-Méchain, M.; Búrquez, A.; Chidumayo, E.; Colgan, M.S.; Delitti, W.B.C.; Duque, A.; Eid, T.; Fearnside, P.M.; Goodman, R.C.; et al. Improved allometric models to estimate the aboveground biomass of tropical trees. Glob. Chang. Biol. 2014, 20, 3177–3190. [Google Scholar] [CrossRef] [PubMed]
- Chave, J.; Andalo, C.; Brown, S.; Cairns, M.A.; Chambers, J.Q.; Eamus, D.; Fölster, H.; Fromard, F.; Higuchi, N.; Kira, T.; et al. Tree allometry and improved estimation of carbon stocks and balance in tropical forests. Oecologia 2005, 145, 87–99. [Google Scholar] [CrossRef] [PubMed]
- Duncanson, L.I.; Dubayah, R.O.; Enquist, B.J. Assessing the general patterns of forest structure: Quantifying tree and forest allometric scaling relationships in the United States: Forest allometric variability in the United States. Glob. Ecol. Biogeogr. 2015, 24, 1465–1475. [Google Scholar] [CrossRef]
- Pilli, R.; Anfodillo, T.; Carrer, M. Towards a functional and simplified allometry for estimating forest biomass. For. Ecol. Manag. 2006, 237, 583–593. [Google Scholar] [CrossRef]
- West, G.B. A General Model for the Origin of Allometric Scaling Laws in Biology. Science 1997, 276, 122–126. [Google Scholar] [CrossRef]
- Anfodillo, T.; Petit, G.; Sterck, F.; Lechthaler, S.; Olson, M.E. Allometric Trajectories and “Stress”: A Quantitative Approach. Front. Plant Sci. 2016, 7. [Google Scholar] [CrossRef] [Green Version]
- Enquist, B.J. Universal scaling in tree and vascular plant allometry: Toward a general quantitative theory linking plant form and function from cells to ecosystems. Tree Physiol. 2002, 22, 1045–1064. [Google Scholar] [CrossRef] [Green Version]
- Anfodillo, T.; Carrer, M.; Simini, F.; Popa, I.; Banavar, J.R.; Maritan, A. An allometry-based approach for understanding forest structure, predicting tree-size distribution and assessing the degree of disturbance. Proc. R. Soc. B 2013, 280, 20122375. [Google Scholar] [CrossRef]
- Sellan, G.; Simini, F.; Maritan, A.; Banavar, J.R.; de Haulleville, T.; Bauters, M.; Doucet, J.-L.; Beeckman, H.; Anfodillo, T. Testing a general approach to assess the degree of disturbance in tropical forests. J. Veg. Sci. 2017, 28, 659–668. [Google Scholar] [CrossRef]
- Simini, F.; Anfodillo, T.; Carrer, M.; Banavar, J.R.; Maritan, A. Self-similarity and scaling in forest communities. Proc. Natl. Acad. Sci. USA 2010, 107, 7658–7662. [Google Scholar] [CrossRef] [Green Version]
- Enquist, B.J.; West, G.B.; Brown, J.H. Extensions and evaluations of a general quantitative theory of forest structure and dynamics. Proc. Natl. Acad. Sci. USA 2009, 106, 7046–7051. [Google Scholar] [CrossRef] [Green Version]
- West, G.B.; Enquist, B.J.; Brown, J.H. A general quantitative theory of forest structure and dynamics. Proc. Natl. Acad. Sci. USA 2009, 106, 7040–7045. [Google Scholar] [CrossRef] [PubMed] [Green Version]
- Anderson-Teixeira, K.J.; McGarvey, J.C.; Muller-Landau, H.C.; Park, J.Y.; Gonzalez-Akre, E.B.; Herrmann, V.; Bennett, A.C.; So, C.V.; Bourg, N.A.; Thompson, J.R.; et al. Size-related scaling of tree form and function in a mixed-age forest. Funct. Ecol. 2015, 29, 1587–1602. [Google Scholar] [CrossRef]
- Muller-Landau, H.C.; Condit, R.S.; Chave, J.; Thomas, S.C.; Bohlman, S.A.; Bunyavejchewin, S.; Davies, S.; Foster, R.; Gunatilleke, S.; Gunatilleke, N.; et al. Testing metabolic ecology theory for allometric scaling of tree size, growth and mortality in tropical forests. Ecol. Lett. 2006, 9, 575–588. [Google Scholar] [CrossRef]
- Russo, S.E.; Wiser, S.K.; Coomes, D.A. Growth-size scaling relationships of woody plant species differ from predictions of the Metabolic Ecology Model. Ecol. Lett. 2007, 10, 889–901. [Google Scholar] [CrossRef] [PubMed]
- Weiner, J. Allocation, plasticity and allometry in plants. Perspect. Plant Ecol. Evol. Syst. 2004, 6, 207–215. [Google Scholar] [CrossRef]
- Xie, J.-B.; Xu, G.-Q.; Jenerette, G.D.; Bai, Y.; Wang, Z.-Y.; Li, Y. Apparent plasticity in functional traits determining competitive ability and spatial distribution: A case from desert. Sci. Rep. 2015, 5, 12174. [Google Scholar] [CrossRef] [Green Version]
- Cheng, D.-L.; Niklas, K.J. Above- and Below-ground Biomass Relationships across 1534 Forested Communities. Ann. Bot. 2007, 99, 95–102. [Google Scholar] [CrossRef]
- Poorter, H.; Niklas, K.J.; Reich, P.B.; Oleksyn, J.; Poot, P.; Mommer, L. Biomass allocation to leaves, stems and roots: Meta-analyses of interspecific variation and environmental control: Tansley review. New Phytol. 2012, 193, 30–50. [Google Scholar] [CrossRef]
- Reich, P.B.; Luo, Y.; Bradford, J.B.; Poorter, H.; Perry, C.H.; Oleksyn, J. Temperature drives global patterns in forest biomass distribution in leaves, stems, and roots. Proc. Natl. Acad. Sci. USA 2014, 111, 13721–13726. [Google Scholar] [CrossRef] [PubMed] [Green Version]
- Fatemi, F.R.; Yanai, R.D.; Hamburg, S.P.; Vadeboncoeur, M.A.; Arthur, M.A.; Briggs, R.D.; Levine, C.R. Allometric equations for young northern hardwoods: The importance of age-specific equations for estimating aboveground biomass. Can. J. For. Res. 2011, 41, 881–891. [Google Scholar] [CrossRef]
- Peichl, M.; Arain, M.A. Allometry and partitioning of above- and belowground tree biomass in an age-sequence of white pine forests. For. Ecol. Manag. 2007, 253, 68–80. [Google Scholar] [CrossRef]
- Poorter, H.; Jagodzinski, A.M.; Ruiz-Peinado, R.; Kuyah, S.; Luo, Y.; Oleksyn, J.; Usoltsev, V.A.; Buckley, T.N.; Reich, P.B.; Sack, L. How does biomass distribution change with size and differ among species? An analysis for 1200 plant species from five continents. New Phytol. 2015, 208, 736–749. [Google Scholar] [CrossRef] [PubMed]
- Seo, Y.O.; Lumbres, R.I.C.; Lee, Y.J. Partitioning of above and belowground biomass and allometry in the two stand age classes of Pinus rigida in South Korea. Life Sci. J. 2012, 9, 3553–3559. [Google Scholar]
- Buras, A.; Rammig, A.; Zang, C.S. Quantifying impacts of the 2018 drought on European ecosystems in comparison to 2003. Biogeosciences 2020, 17, 1655–1672. [Google Scholar] [CrossRef] [Green Version]
- Lippestad, H. Cooperation Is a Must for Adaptation to and Mitigation of Climate Change. Available online: https://www.met.no/en/archive/cooperation-is-a-must-for-adaptation-to-and-mitigation-of-climate-change (accessed on 25 May 2020).
- Skogfrøverket Frøplantasje nr. 1122 Opsahl. Available online: http://www.skogfroverket.no/userfiles/files/Fr%C3%B8plantasjeveiledning/Fr%C3%B8kildebeskrivelser_april2018/1122_Opsahl.pdf (accessed on 1 April 2020).
- Skogfrøverket Frøplantasje, nr. 1221 Kaupanger. Available online: http://www.skogfroverket.no/userfiles/files/Fr%C3%B8plantasjeveiledning/Fr%C3%B8kildebeskrivelser_april2018/1221_Kaupanger-Frost.pdf (accessed on 1 April 2020).
- Fløistad, I.S.; Granhus, A. Bud break and spring frost hardiness in Picea abies seedlings in response to photoperiod and temperature treatments. Can. J. For. Res. 2010, 40, 968–976. [Google Scholar] [CrossRef]
- R Core Team. R: A Language and Environment for Statistical Computing; R Core Team: Vienna, Austria, 2019. [Google Scholar]
- Christensen, R.H.B. Ordinal—Regression Models for Ordinal Data. 2019. Available online: https://rdrr.io/cran/ordinal/ (accessed on 17 November 2020).
- Bates, D.; Mächler, M.; Bolker, B.; Walker, S. Fitting Linear Mixed-Effects Models Using lme4. J. Stat. Softw. 2015, 67, 1–48. [Google Scholar] [CrossRef]
- Kuznetsova, A.; Brockhoff, P.B.; Christensen, R.H.B. lmerTest Package: Tests in Linear Mixed Effects Models. J. Stat. Softw. 2017, 82, 1–26. [Google Scholar] [CrossRef] [Green Version]
- Barton, K. MuMIn: Multi-Model Inference. 2019. Available online: https://rdrr.io/cran/MuMIn/ (accessed on 17 November 2020).
- Niklas, K.J. Plant allometry: Is there a grand unifying theory? Biol. Rev. 2004, 79, 871–889. [Google Scholar] [CrossRef]
- Rossi, S.; Deslauriers, A.; Anfodillo, T.; Morin, H.; Saracino, A.; Motta, R.; Borghetti, M. Conifers in cold environments synchronize maximum growth rate of tree-ring formation with day length. New Phytol. 2006, 170, 301–310. [Google Scholar] [CrossRef] [PubMed] [Green Version]
- Schuldt, B.; Buras, A.; Arend, M.; Vitasse, Y.; Beierkuhnlein, C.; Damm, A.; Gharun, M.; Grams, T.E.E.; Hauck, M.; Hajek, P.; et al. A first assessment of the impact of the extreme 2018 summer drought on Central European forests. Basic Appl. Ecol. 2020, 45, 86–103. [Google Scholar] [CrossRef]
- Mäkinen, H.; Nojd, P.; Saranpaa, P. Seasonal changes in stem radius and production of new tracheids in Norway spruce. Tree Physiol. 2003, 23, 959–968. [Google Scholar] [CrossRef] [PubMed] [Green Version]
- IPCC. Climate Change 2014: Synthesis Report. Contribution of Working Groups I, II and III to the Fifth Assessment Report of the Intergovernmental Panel on Climate Change; Core Writing Team, Pachauri, R.K., Meyer, L.A., Eds.; IPCC: Geneva, Switzerland, 2014; p. 151. [Google Scholar]
- Kellomäki, S.; Peltola, H.; Nuutinen, T.; Korhonen, K.T.; Strandman, H. Sensitivity of managed boreal forests in Finland to climate change, with implications for adaptive management. Philos. Trans. R. Soc. B Biol. Sci. 2008, 363, 2339–2349. [Google Scholar] [CrossRef] [Green Version]
- Kauppi, P.E.; Posch, M.; Pirinen, P. Large Impacts of Climatic Warming on Growth of Boreal Forests since 1960. PLoS ONE 2014, 9, e111340. [Google Scholar] [CrossRef] [Green Version]
- Kurz, W.A.; Stinson, G.; Rampley, G. Could increased boreal forest ecosystem productivity offset carbon losses from increased disturbances? Phil. Trans. R. Soc. B 2008, 363, 2259–2268. [Google Scholar] [CrossRef] [Green Version]
- D’Orangeville, L.; Houle, D.; Duchesne, L.; Phillips, R.P.; Bergeron, Y.; Kneeshaw, D. Beneficial effects of climate warming on boreal tree growth may be transitory. Nat. Commun. 2018, 9, 3213. [Google Scholar] [CrossRef] [Green Version]
- Caré, O.; Müller, M.; Vornam, B.; Höltken, A.; Kahlert, K.; Krutovsky, K.; Gailing, O.; Leinemann, L. High Morphological Differentiation in Crown Architecture Contrasts with Low Population Genetic Structure of German Norway Spruce Stands. Forests 2018, 9, 752. [Google Scholar] [CrossRef] [Green Version]
- Geburek, T.; Robitschek, K.; Milasowszky, N. A tree of many faces: Why are there different crown types in Norway spruce (Picea abies [L.] Karst.)? Flora Morphol. Distrib. Funct. Ecol. Plants 2008, 203, 126–133. [Google Scholar] [CrossRef]
- Lines, E.R.; Zavala, M.A.; Purves, D.W.; Coomes, D.A. Predictable changes in aboveground allometry of trees along gradients of temperature, aridity and competition. Glob. Ecol. Biogeogr. 2012, 21, 1017–1028. [Google Scholar] [CrossRef]
Figure 1.
Mean temperature (T) and cumulative precipitation (P) monthly values for the study area. Long-term average values for the period 1961–1990 (“long”) are shown together with the mean values recorded in 2018 (“2018”). Temperature data were measured at Evenstad’s weather station (4 km from study area), precipitation data were measured at Rena’s weather station (~30 km south of study area). Source of the data: Norwegian Meteorological Institute (www.yr.no).

Figure 2.
Cumulative percentage of trees reaching the final stage of bud break by site.

Figure 3.
Normalized values of diameter increment (a) and shoot elongation (b) measured throughout the growing season of 2018. Notice the peaks-and-trough pattern in (a), which points to a decrease in the diameter increment during the season. Error bars represent the standard error.
Figure 3.
Normalized values of diameter increment (a) and shoot elongation (b) measured throughout the growing season of 2018. Notice the peaks-and-trough pattern in (a), which points to a decrease in the diameter increment during the season. Error bars represent the standard error.

Figure 4.
Linear regression models for the allometric scaling of crown volume over height. Regression equations are shown above each plot. Black lines represent the regression model. Dots represent observations. Values in brackets are the 95% confidence intervals (C.I.) of the slope (b) and intercept (a) coefficients.


Table 1.
Results of the post hoc test used to assess the differences in hourly temperature (°C) between sites for the growing season of 2018 (15 May to 4 September). “Group” letters identify significantly (p < 0.05) different groups, where “a” is the group with the lower value. Corresponding mean temperature (°C) values for the growing season are also shown for each site. Values in brackets represent the standard error (S.E.).
| Site | Group | Mean T (°C) |
|---|---|---|
| A (320 m a.s.l.) | b | 17.16 (±0.1) |
| B (420 m a.s.l.) | b | 17.09 (±0.1) |
| C (500 m a.s.l.) | a | 16.39 (±0.1) |
| D (595 m a.s.l.) | a | 16.49 (±0.1) |
Table 2.
Means of the hourly temperature differences between the sites, calculated for the growing season of 2018 (15 May to 4 September). Each value is the mean difference between the site in the first column and the one in the first row of the table. Values are shown in °C; values in brackets represent the standard error (S.E.).
| A | B | C | D | |
|---|---|---|---|---|
| A | / | 0.17 (±0.01) | 0.80 (±0.02) | 0.75 (±0.03) |
| B | / | 0.64 (±0.01) | 0.59 (±0.02) | |
| C | / | −0.05 (±0.02) |
Table 3.
Results of the post hoc tests used to assess the differences in tree height and diameter in all four sites. Values were measured at the start of the growing season (23 May). “Group” letters identify significantly (p < 0.05) different groups, where “a” is the group with the lower value. Corresponding mean height (cm) and diameter (cm) values are also shown for each site. Values in brackets represent the standard error (S.E.).
| Site | Group | Mean Height (cm) |
|---|---|---|
| A (320 m a.s.l.) | b | 169.97 (±5.2) |
| B (420 m a.s.l.) | b | 166.44 (±5.3) |
| C (500 m a.s.l.) | a | 136.35 (±4.7) |
| D (595 m a.s.l.) | a | 137.47 (±4.7) |
| Site | Group | Mean Diameter (cm) |
| A (320 m a.s.l.) | b | 3.16 (±0.11) |
| B (420 m a.s.l.) | b | 3.19 (±0.10) |
| C (500 m a.s.l.) | a | 2.55 (±0.10) |
| D (595 m a.s.l.) | a | 2.75 (±0.11) |
Table 4.
Results of the post hoc test used to assess differences in the bud break process in the study sites. The parameter being tested is the mean date of completion of the bud break process (in day of the year values). “Group” letters identify statistically different groups, where “a” is the group with the lower value. Dates are expressed as “day of the year” (DOY) progressive values, the corresponding dd/mm dates are also shown. Values in brackets represent the standard error (S.E.).
| Site | Group | Mean Date (DOY) | Approximate Date |
|---|---|---|---|
| A (320 m a.s.l.) | ab | 144.98 (±0.29) | 25 May |
| B (420 m a.s.l.) | a | 144.67 (±0.31) | 25 May |
| C (500 m a.s.l.) | bc | 146.47 (±0.53) | 26 May |
| D (595 m a.s.l.) | c | 146.62 (±0.4) | 27 May |
Table 5.
Results of the post hoc tests used to assess the differences in tree growth during the season. Parameters being tested were the mean normalized values of apical shoot elongation and diameter increment. Mean values, both normalized and absolute (cm), are also shown for each site. “Group” letters identify statistically different groups, where “a” is the group with the lower value. Values in brackets represent the standard error (S.E.).
| Site | Group | Mean Normalized Shoot Elongation | Mean Shoot Elongation (cm) |
|---|---|---|---|
| A | a | 0.22 (±0.01) | 37.48 (±2.2) |
| B | ab | 0.25 (±0.01) | 42.12 (±1.9) |
| C | b | 0.26 (±0.01) | 35.77 (±1.7) |
| D | ab | 0.23 (±0.01) | 32.32 (± 2) |
| Site | Group | Mean Normalized Diameter Increment | Mean Diameter Increment (cm) |
| A | a | 0.105 (±0.007) | 0.334 (±0.02) |
| B | ab | 0.112 (±0.008) | 0.351 (±0.02) |
| C | bc | 0.139 (±0.009) | 0.348 (±0.02) |
| D | c | 0.138 (±0.007) | 0.374 (±0.02) |
Table 6.
Summary of the resulting a and b coefficients and relative C.I. (confidence intervals, 95%) that describe the different allometric relationships in the four sites.
Table 6.
Summary of the resulting a and b coefficients and relative C.I. (confidence intervals, 95%) that describe the different allometric relationships in the four sites.
| Allometric Relationship | Site | Slope (b) | C.I. (2.5%) | C.I. (97.5%) | Intercept (a) | C.I. (2.5%) | C.I. (97.5%) |
|---|---|---|---|---|---|---|---|
| Diameter Vs. Height (D vs. H) | A | 0.96 | 0.91 | 0.99 | 0.03 | 0.02 | 0.03 |
| B | 0.89 | 0.85 | 0.94 | 0.03 | 0.03 | 0.04 | |
| C | 0.91 | 0.86 | 0.96 | 0.03 | 0.02 | 0.04 | |
| D | 0.93 | 0.88 | 0.98 | 0.03 | 0.02 | 0.04 | |
| Crown Length Vs. Height (Lcro vs. H) | A | 1.12 | 1.1 | 1.15 | 0.48 | 0.43 | 0.54 |
| B | 1.04 | 1.03 | 1.06 | 0.74 | 0.68 | 0.79 | |
| C | 1.04 | 1.02 | 1.06 | 0.71 | 0.66 | 0.79 | |
| D | 1.06 | 1.03 | 1.09 | 0.63 | 0.55 | 0.72 | |
| Crown radius Vs. Height (Rcro vs. H) | A | 0.77 | 0.7 | 0.84 | 1.05 | 0.78 | 1.48 |
| B | 0.84 | 0.78 | 0.91 | 0.69 | 0.5 | 0.95 | |
| C | 0.81 | 0.75 | 0.86 | 0.81 | 0.62 | 1.05 | |
| D | 0.89 | 0.84 | 0.94 | 0.58 | 0.45 | 0.72 |
Publisher’s Note: MDPI stays neutral with regard to jurisdictional claims in published maps and institutional affiliations. |
© 2020 by the authors. Licensee MDPI, Basel, Switzerland. This article is an open access article distributed under the terms and conditions of the Creative Commons Attribution (CC BY) license (http://creativecommons.org/licenses/by/4.0/).
Share and Cite
MDPI and ACS Style
Mura, C.; Strømme, C.B.; Anfodillo, T. Stable Allometric Trajectories in Picea abies (L.) Karst. Trees along an Elevational Gradient. Forests 2020, 11, 1231. https://0-doi-org.brum.beds.ac.uk/10.3390/f11111231
AMA Style
Mura C, Strømme CB, Anfodillo T. Stable Allometric Trajectories in Picea abies (L.) Karst. Trees along an Elevational Gradient. Forests. 2020; 11(11):1231. https://0-doi-org.brum.beds.ac.uk/10.3390/f11111231
Chicago/Turabian StyleMura, Claudio, Christian Bianchi Strømme, and Tommaso Anfodillo. 2020. "Stable Allometric Trajectories in Picea abies (L.) Karst. Trees along an Elevational Gradient" Forests 11, no. 11: 1231. https://0-doi-org.brum.beds.ac.uk/10.3390/f11111231
Note that from the first issue of 2016, this journal uses article numbers instead of page numbers. See further details here.