Transport Work for the Supply of Pine Sawlogs to the Sawmill


Department of Forest Utilization, Institute of Forest Sciences, Warsaw University of Life Sciences-SGGW, 159 Nowoursynowska St., 02-776 Warsaw, Poland
*
Author to whom correspondence should be addressed.
Forests 2020, 11(12), 1340; https://0-doi-org.brum.beds.ac.uk/10.3390/f11121340
Submission received: 23 November 2020
/
Revised: 13 December 2020
/
Accepted: 14 December 2020
/
Published: 16 December 2020
(This article belongs to the Special Issue Forests for a Better Future: Sustainability, Innovation and Interdisciplinarity)
Abstract
:The aim of the presented research is to characterize the scale of transport work performed on the supply of large-size pine wood to the sawmill, with indication of factors influencing structure and parameters. Analyzes were carried out for deliveries to a sawmill in northern Poland, which supplies pine sawlogs and long wood assortments. The distance of deliveries on public and forest roads was determined, as well as transport work for each type of road and the total value. The transport work was defined as a multiplication of driven kilometers with the load and the weight of the load in ton kilometers. Data on the transport distance were obtained on the basis of information from the driver, and the parameters of the transported pine sawlogs from the delivery note. Based on the collected data over a period of 12 months, the transport work was determined for selected courses. The total transport work for the 1509 analyzed deliveries was 3,447,486 ton-kilometers (tkm). The average transport work for one course amounted to 2286 tkm and was characterized by a high variability SD = 1207. The minimum value of the transport work was recorded at the level of 83 tkm, and the maximum as much as 7803 tkm. The median of the analyzed deliveries was 2220 tkm, while the first quartile Q1 = 1358, and the third quartile Q3 = 2997. With very similar cargo volumes (m3) and cargo weight (kg) the transport distance and the total number of deliveries have a significant effect on the transport work performed with the transport of timber. Purchase of wood in seven forest districts located up to 50 km from the sawmill accounts for 30.1% of the analyzed deliveries (1509), resulting in only transport work at the level of 476,104 tkm, which is only 13.8% of the total transport work of all deliveries.
1. Introduction
In Poland, there is one dominant round wood supplier (44.7 million m3 in 2018 [1]): the State Forests National Forest Holding. The wood offered throughout the country is sold by 430 State Forest Districts, and the buyers are the highly dispersed and fragmented sawmill industry [2,3]. In such a situation, ensuring a properly functioning, direct wood supply chain [4,5], which is of great importance in the costs of timber harvesting [6,7], enables optimization [8,9].
In the literature on the improvement of the efficiency of wood transport to sawmills, the following issues can be distinguished:
One of the latest analyses carried out in the transport of wood is the reduction of exhaust emissions. The latest results of Finnish research show unequivocally that the use of vehicles with a maximum permissible weight of 76 Mg in 2017 allowed to reduce the distance traveled by 4% and 0.1 Mt in reduction of CO2 emissions in road transport [24]. Other Finnish simulations show that 76-ton trucks had a 12% lower productivity, 4% higher fuel consumption and a 6% higher transport cost compared to 84-ton vehicles [25]. Increasing the permissible weight of the transport vehicle in Finland has contributed to the reduction of CO2 and nitrogen oxides NOx emissions and economic benefits [34]. The recently published results of research in Poland concerning the transport of large-size pine wood indicate that reducing the volume of load from 30 m3 to 25 m3 results in a significant, 17% increase in the quantity of deliveries, which directly lead to higher fuel consumption, increased transport costs and CO2 emissions [35].
Aim and Scope of the Research
The aim of the presented research was to analyze the transport work performed during the delivery of large-size pine round wood to the sawmill as well as to determine the size and structure of the transport work. It was assumed that the main factors influencing the volume of transport work is the location of the single wood load (forest district, sub-forest district, stand) that determines the transport distance and the weight of the transported round wood. It was also assumed that the number of transports from individual forest districts had a significant impact on the total transport work performed on the deliveries of roundwood to the sawmill, and it may constitute the basis for optimizing transport work.
The research was related to transport work analyzes depending on the period of their realization and the distance from the State Forest District. The data of the location and related deliveries on public and forest roads were analyzed.
2. Material and Methods
The transport work in ton-kilometers was defined as the multiplication of the kilometers traveled on forest and public roads with the load and the weight of the cargo for each route and the total value for all analyzed transports. For each, State Forest Districts took into account the number of deliveries, the average weight of a load and the transport distance (minimum, average and maximum). The distance with the load was determined on the basis of the delivery note and the weight of the load from weighing the vehicles.
Large-size wood is wood with a thin end diameter of 14 cm (excluding bark), calculated in single pieces. In terms of quality and size, large-size wood is divided into four classes—A, B, C, D—and into two sub-classes—general purpose wood and special purpose wood. The large-size general purpose wood is comparable to the assortment defined as sawmill wood. Medium-size wood is wood with a minimum diameter of 5 cm and more (excluding bark), with a thick end diameter of up to 24 cm, calculated in single pieces, in pieces as groups and in stakes [36,37].
Relevant analyzes were carried out for the supply of pine sawlogs in the period from 1 April 2016 to 29 March 2017, to a sawmill in northern Poland. The transport was carried out by external companies acting on behalf of the plant. The delivery date, from the recipient’s documents (sawmill) and the delivery note issued by the State Forest, allowed for the analysis for each month.
Each truck was weighed as it entered and exited the sawmill. The weight of the load was determined on the basis of weighing the truck with sawlogs and after unloading (tare) in the plant.
The place of harvesting the wood is specified on the delivery note by the State Forest, by providing the unique forest address from the information system of the State Forests (SILP).
Kilometers driven on forest and public roads with round wood were based on information from the driver when accepting the delivery. Having accurate location (from the delivery note) it was possible to verify (control) authenticity of the information and eliminate incorrect data provided by the driver. Data on the average fuel consumption in liters per 100 km for individual delivery were obtained from truck drivers. On this basis, the average combustion in L km−1 was calculated for one course (delivery) and for one cubic meter of transported sawlogs (total combustion for the course divided by the volume of transported wood in L·m−3).
The results were analyzed statistically using the STATISTICA 12 package. The Kruskal–Wallis test was used to determine the significance of the differences. Additionally, a multiple comparison test of mean rank (Dunn’s test) was performed. Analyzes were performed at the significance level of 0.05.
3. Results
In the analyzed period 280,380 m3 of pine sawlogs was transported to the plant, with 9797 deliveries of wood from 54 forest districts. The analysis covered 1509 (13.97%) of randomly selected timber transports carried out over a period of twelve months from 40 forest districts, where a load per truck was obtained from one place, single stand. In the analyzed 1509 transports, 44,336 m3 of round wood was delivered to the sawmill.
3.1. Characteristic of the State Forest Districts
The characteristics of Forest Districts: average distances from the sawmill, load weight and number of deliveries presented in Table 1. Most of the analyzed 129 sawlogs transports to the sawmill were carried out from the Korpele Forest District, with average distance of 34.3 km. Mileage range with load from 25 to 57 km. In the analyzed deliveries, 30.1% (454 courses) were carried out from the forest districts: Wielbark, Nidzica, Szczytno, Jedwabno, Korpele, Przasnysz and Parciaki. They are located closest to the plant, in 50 km radius (average transport distance).
In the first years of operation of the plant, the source of wood supply was all forest districts in north-eastern Poland. Too much diversification of suppliers required the involvement of a significant number of transport vehicles (companies). As the sawmill developed, the pine sawlogs purchasing area was significant reduced, resulting in an average transport distance 70 km on public road.
The reduction of the purchasing radius resulted in a smaller demand for the number of trucks, and consequently reduced the number of transport companies cooperating with the plant. The cooperation was based on the principle of assigning one transport company to one State Forest Districts. It significantly improved the quality of provided transport services, execution of delivery schedules, information flow and cost reduction, and increased control throughout the wood supply chain.
3.2. Characteristics Sawlogs Deliveries and the Weight of the Load
The realization of the analyzed deliveries to the sawmill was associated with the total load deliveries (on public and forest roads) at the level of 113,728 km. The average distance of deliveries with cargo was 75.4 km and was characterized by high variability SD = 39.1 (Table 1 and Table 2) in the range from 3.0 km to 274.5 km (Table 2).
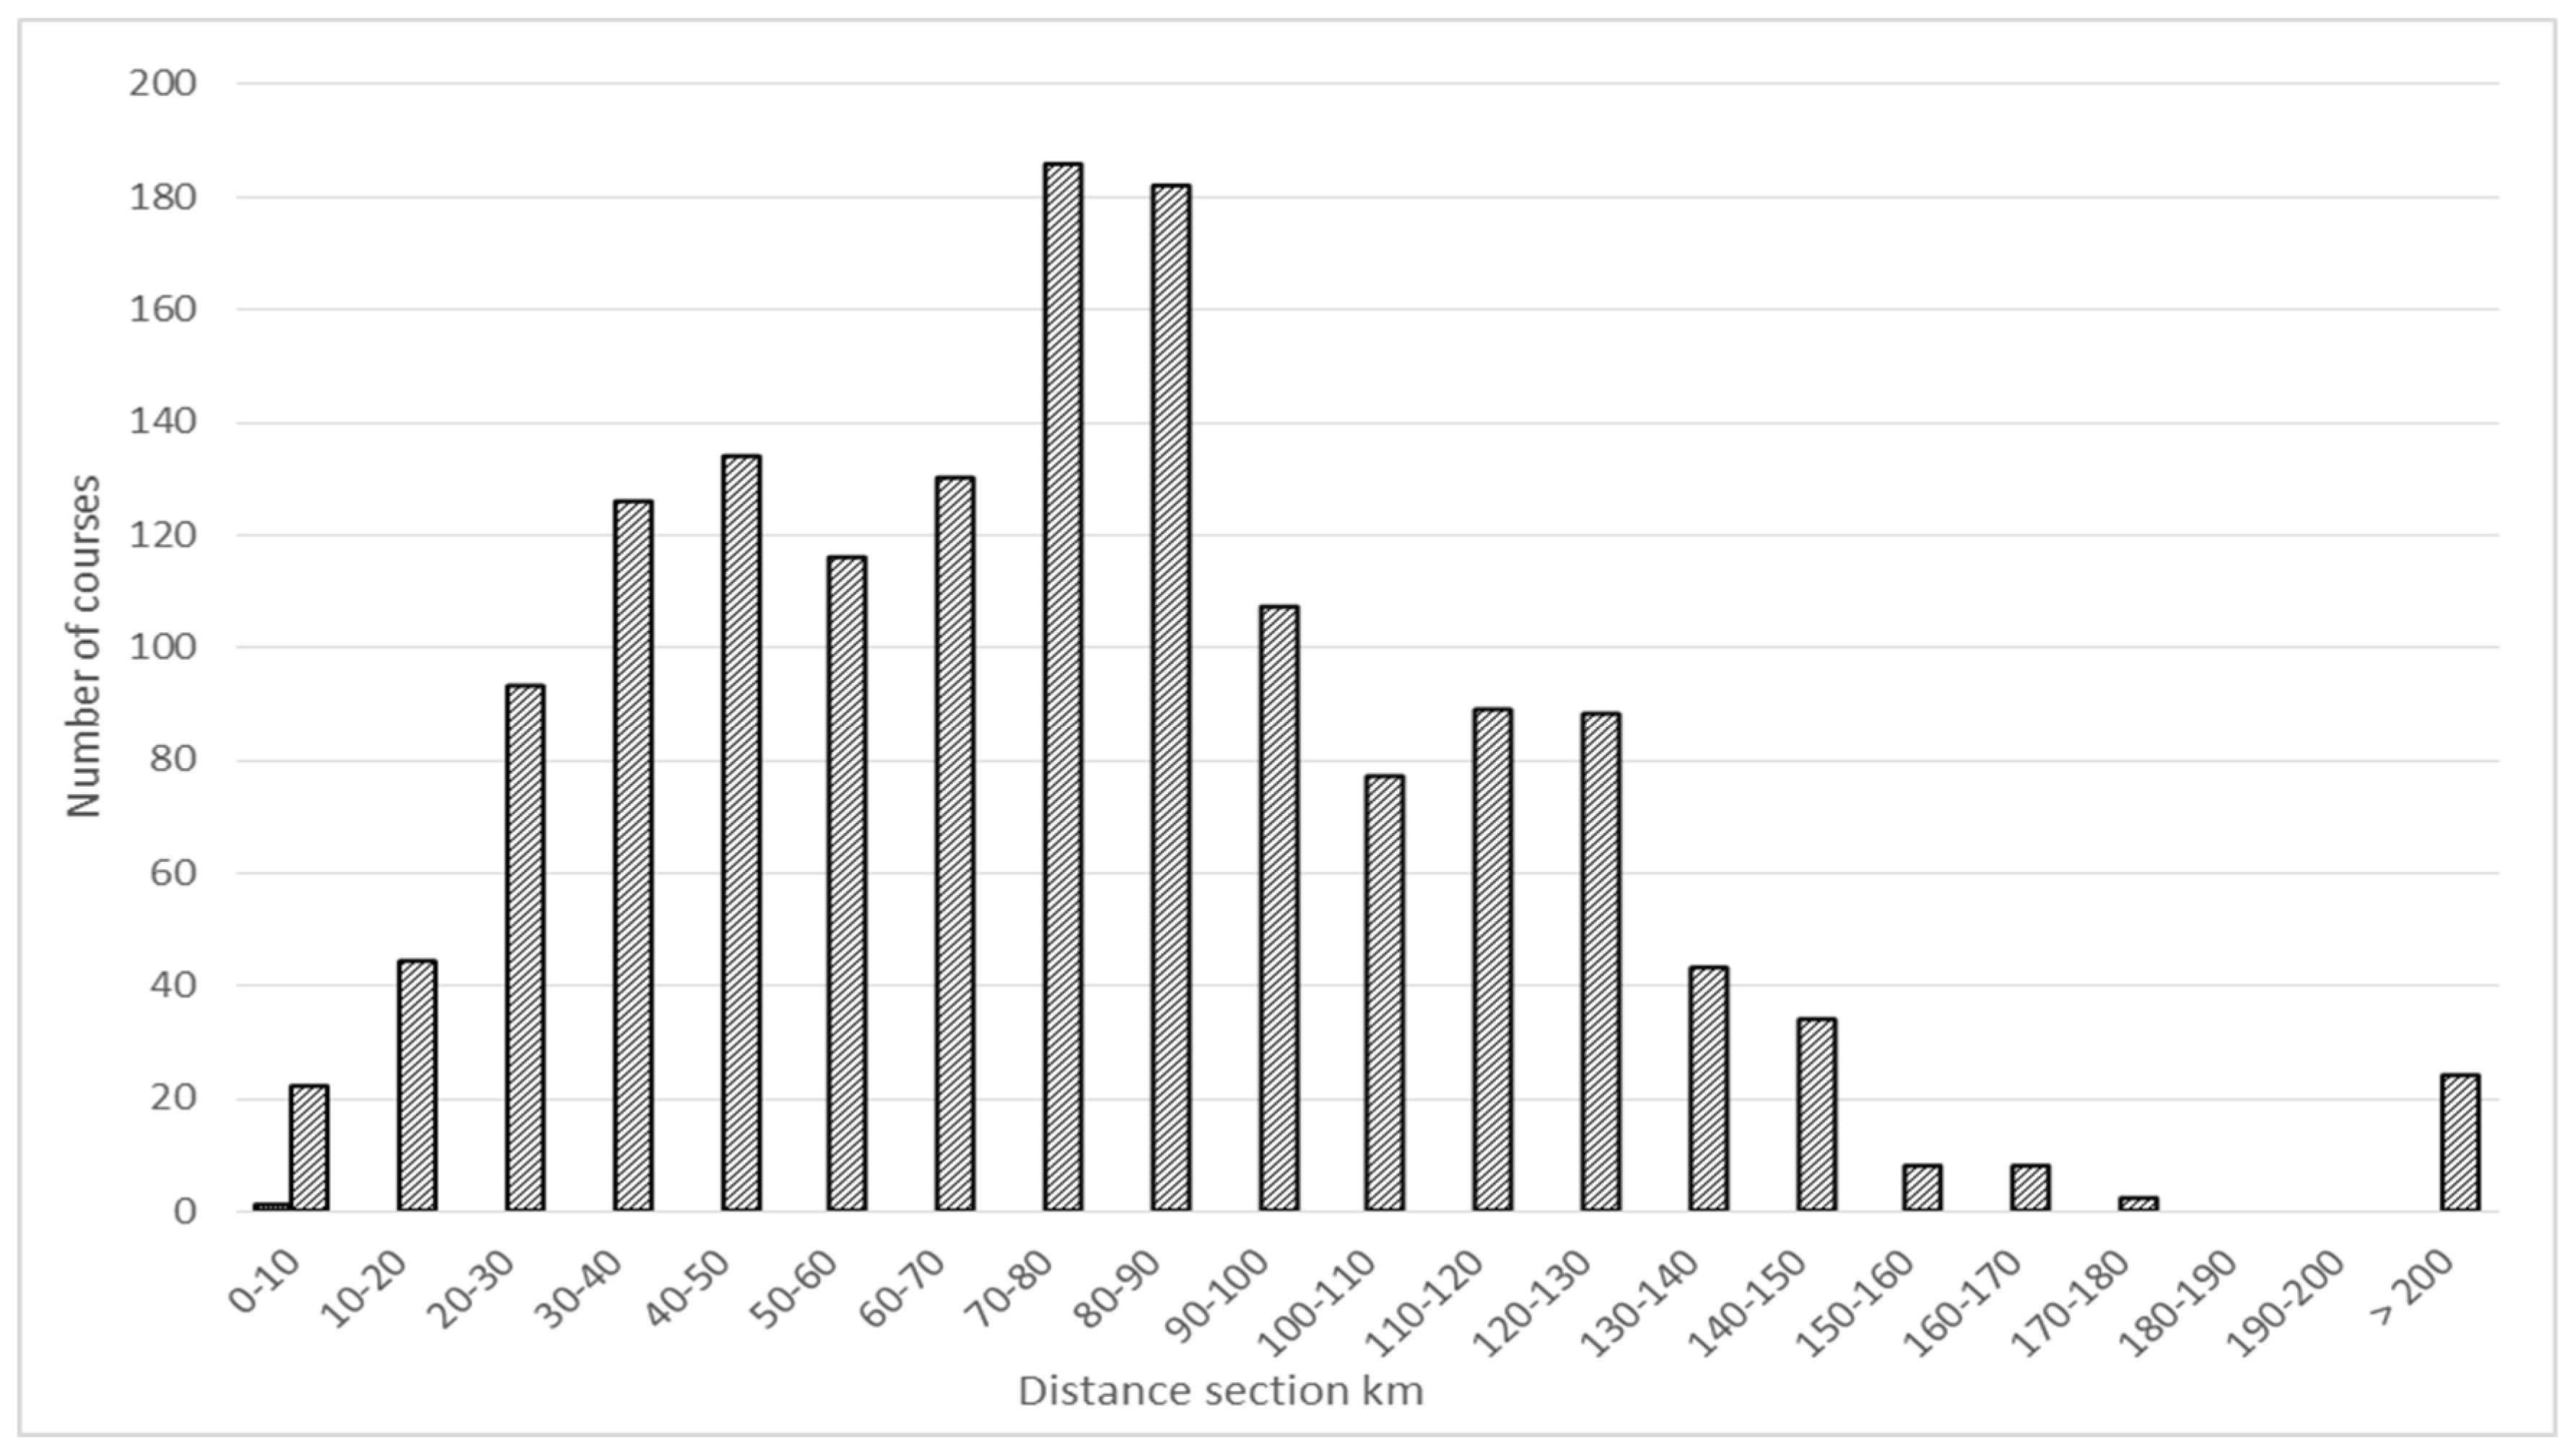
The greatest number of deliveries (on a public and a forest road) was recorded in the range of 70 ÷ 80 km-186 and 80 ÷ 90 km-182 transports. In 24 cases, timber was transported over a distance of more than 200 km. Most deliveries were made within 100 km from the plant, 75.35% of transports being within this radius (Figure 1).
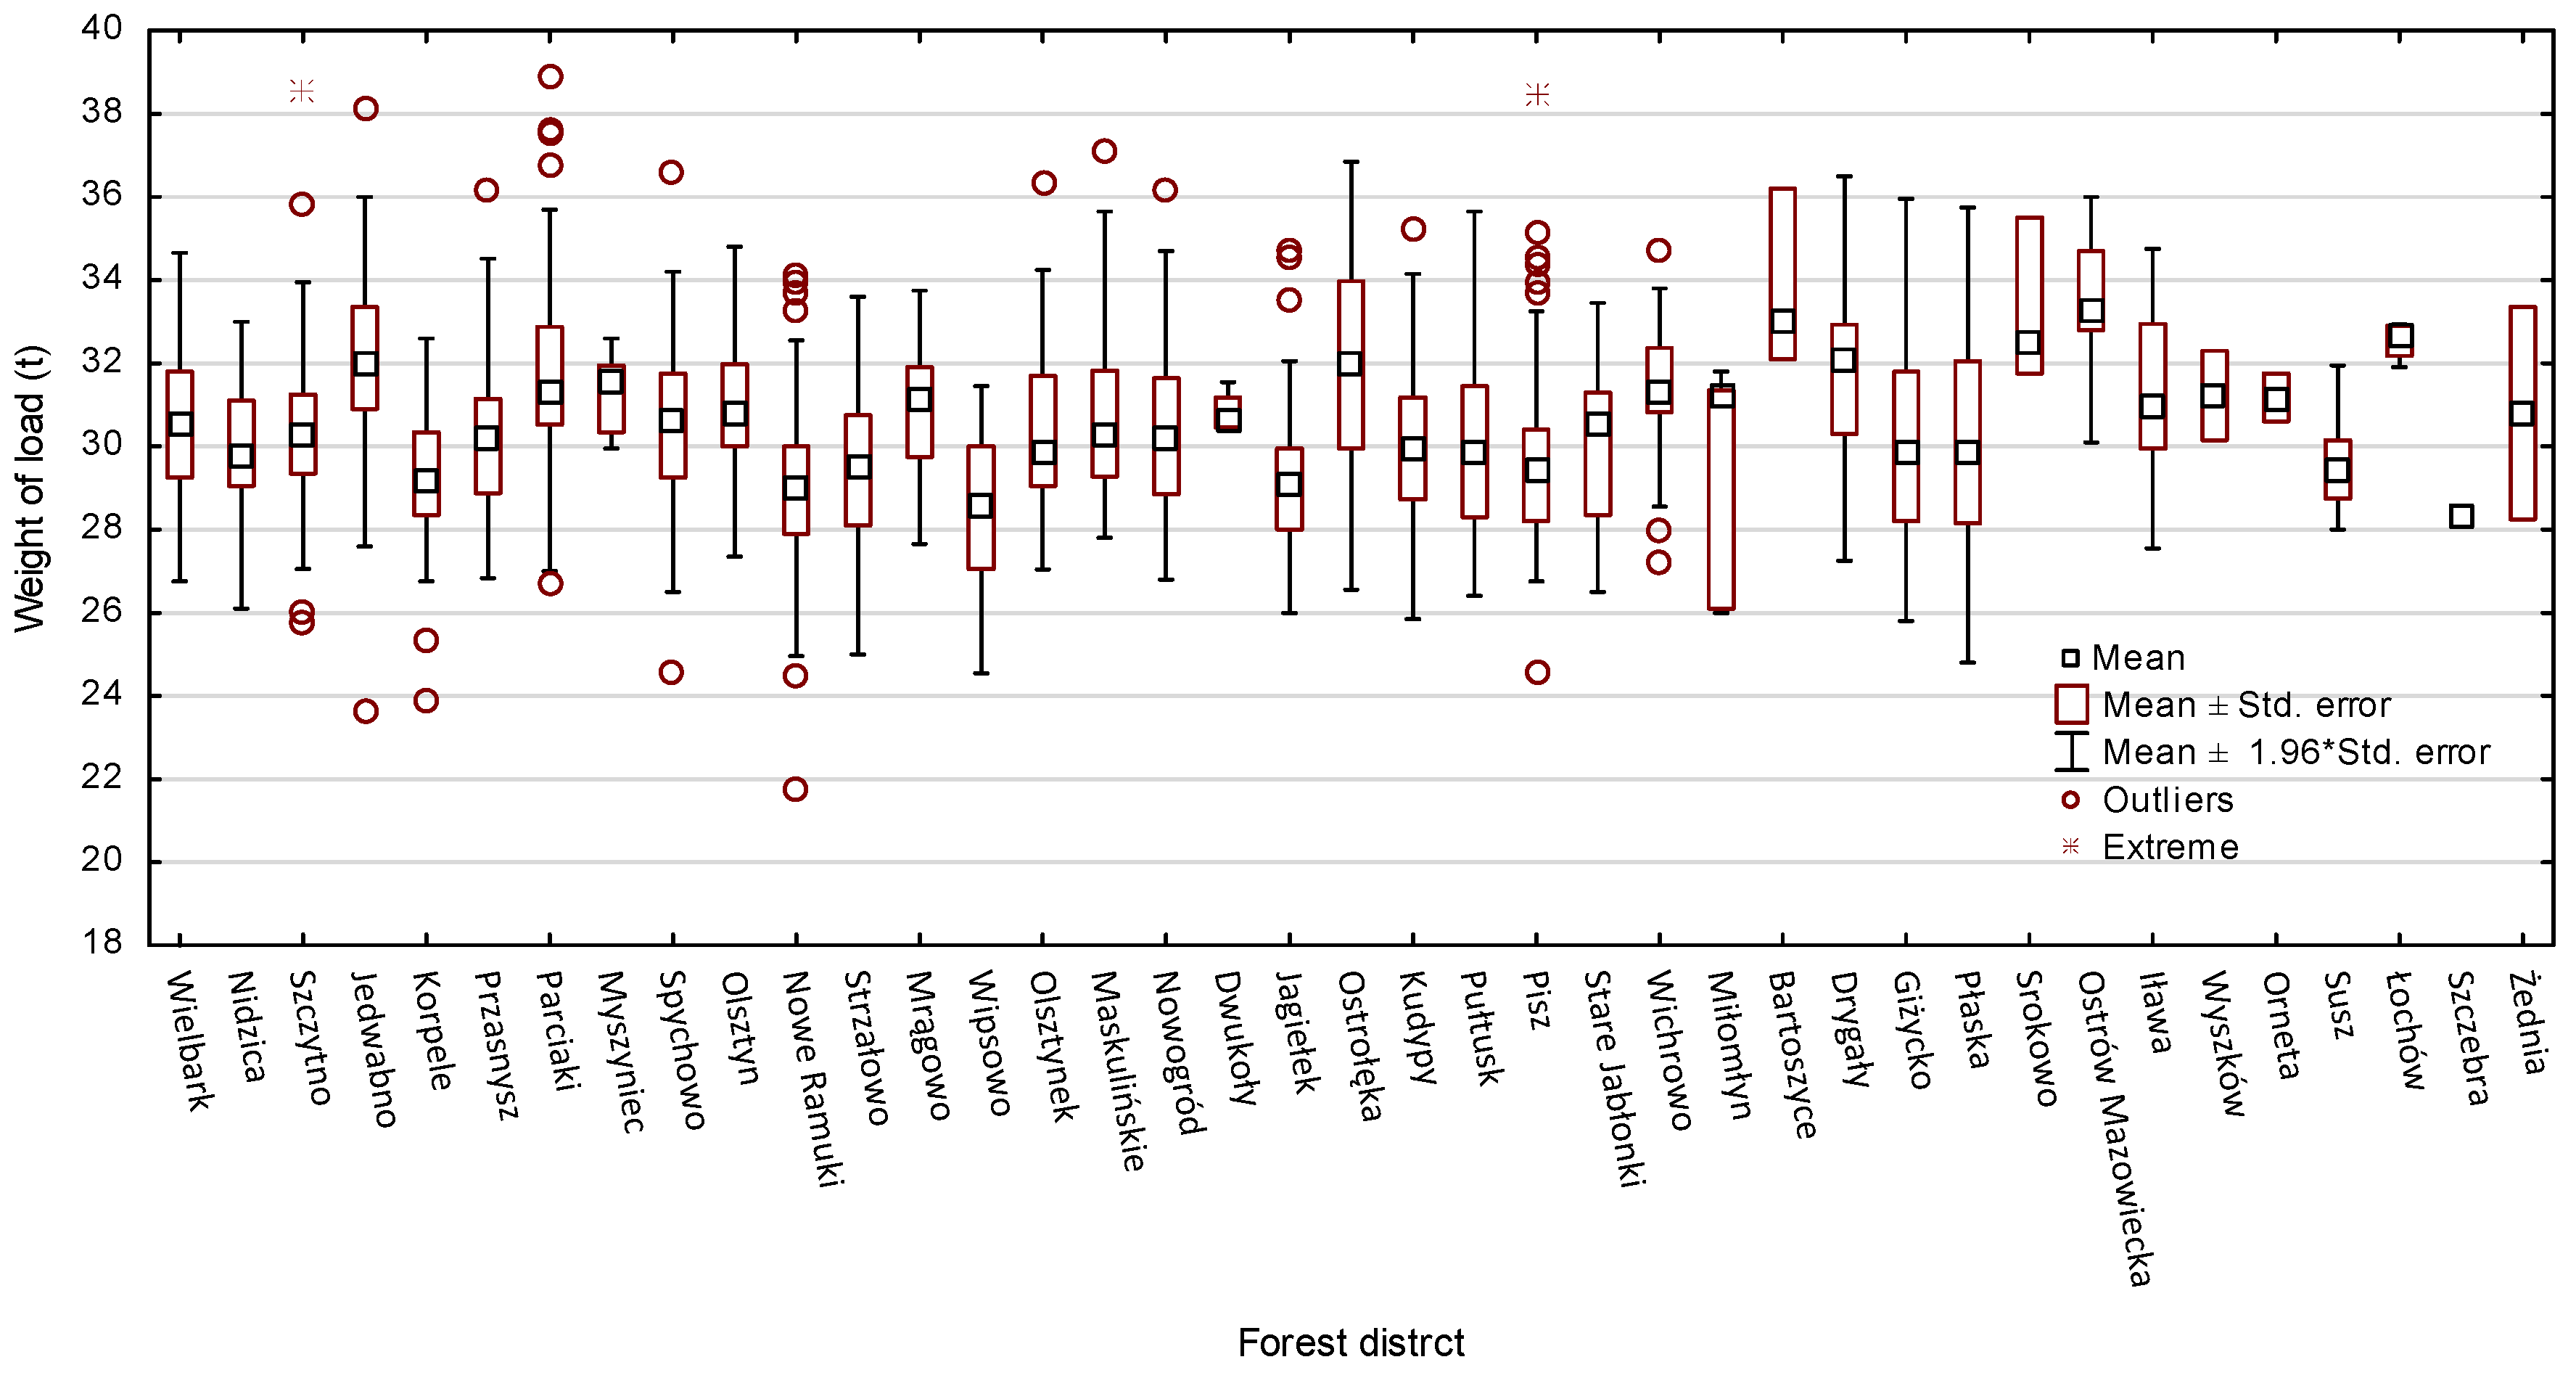
The average load weight for each delivery was 30.32 t and very similar between forest districts (SD = 2.20 and median 30.20), although the Kruskal–Wallis test showed statistically significant differences. Detailed analysis using the multiple mean rank comparison test (Dunn’s test) showed that the masses of individual wood loads in transports from 18 forest districts did not differ from each other (Figure 2).
3.3. Fuel Consumption in Sawlogs Deliveries
The roundwood to the sawmill was most often delivered by Man, Scania, Volvo and Mercedes trucks with a motor power from 410 to 620 HP and a capacity of 12.0 ÷ 16.3 L. Drivers reported fuel consumption in the range from 38.0 to 87.0 L 100 km−1. Calculation of fuel consumption per kilometer and summary calculations for each sawlogs delivery were made. Transport distance with load was used for all calculations. Having also registered the volume of transported wood (m3), the fuel consumption index for the transport of 1 m3 of wood was calculated. Average fuel consumption was at the level of 0.561 L km−1 with small differences in results, SD = 0.055 (Table 3). For the individual deliveries of wood to the sawmill, fuel consumption from 4.80 L to 225.94 L was recorded with an average of 77.11 L. The calculated fuel consumption index for 1 m3 transport was on average 2.62 L·m−3 with the result range from 0.16 to 7.63 L·m−3 (Table 3).
3.4. Transport Work
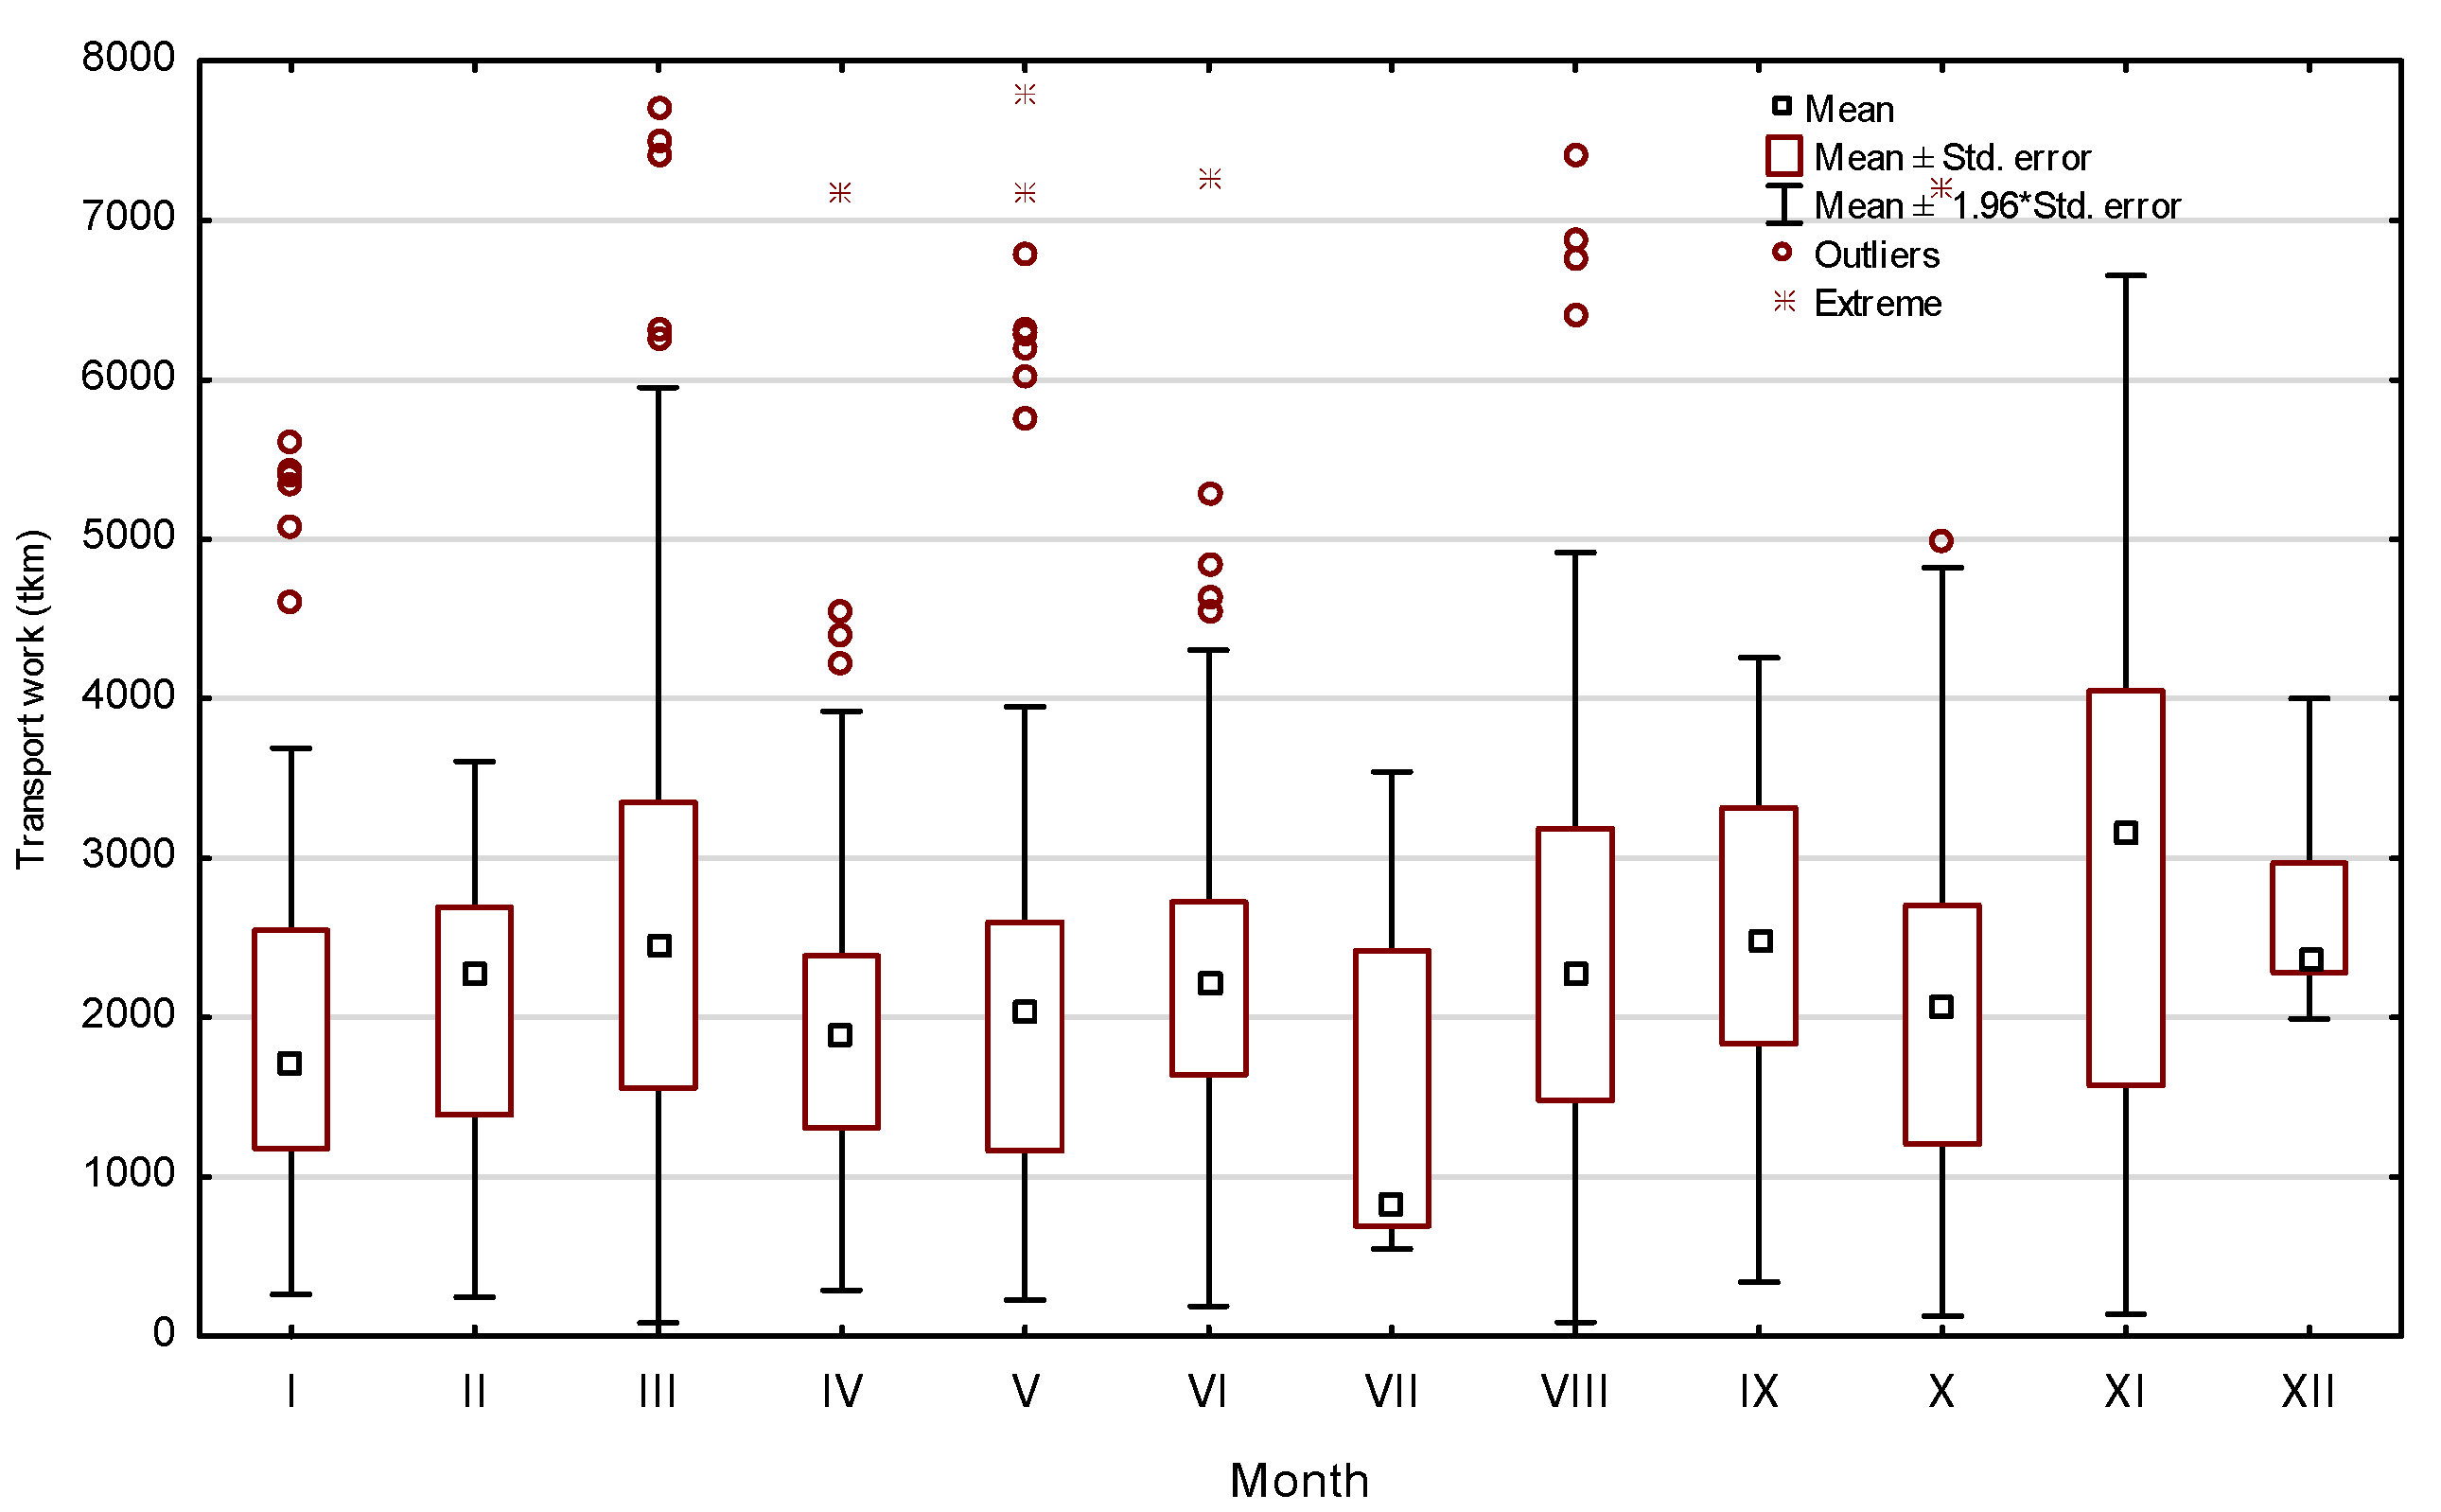
The total transport work for the 1509 deliveries was 3,447,486 ton-kilometers (tkm). The average transport performance of one course amounted to 2286 tkm and was characterized by a high variability of SD = 1207. The minimum value of transport work was recorded at the level of 83 tkm, and the maximum as much as 7803 tkm. The median of the analyzed deliveries was 2220 tkm, while the first quartile Q1 = 1358 and the third quartile Q3 = 2997 (Table 2). Transport work for a single course is on a comparable level in all months, but the analysis using the Kruskal–Wallis test showed statistically significant differences (p = 0.0000). The comparison of the transport work for the trips carried out in individual months with the Dunn test shows statistically significant differences only when the results are compared in the months of XI to I; III; IV, VI and X as well as III from I, IV and X and the last different pair are IV from VIII, as shown in Figure 3. Statistical analyzes did not include trips in July and December due to insufficient sample. It was caused by planned breaks in the plant related to maintenance period and suspension of sawlogs deliveries.
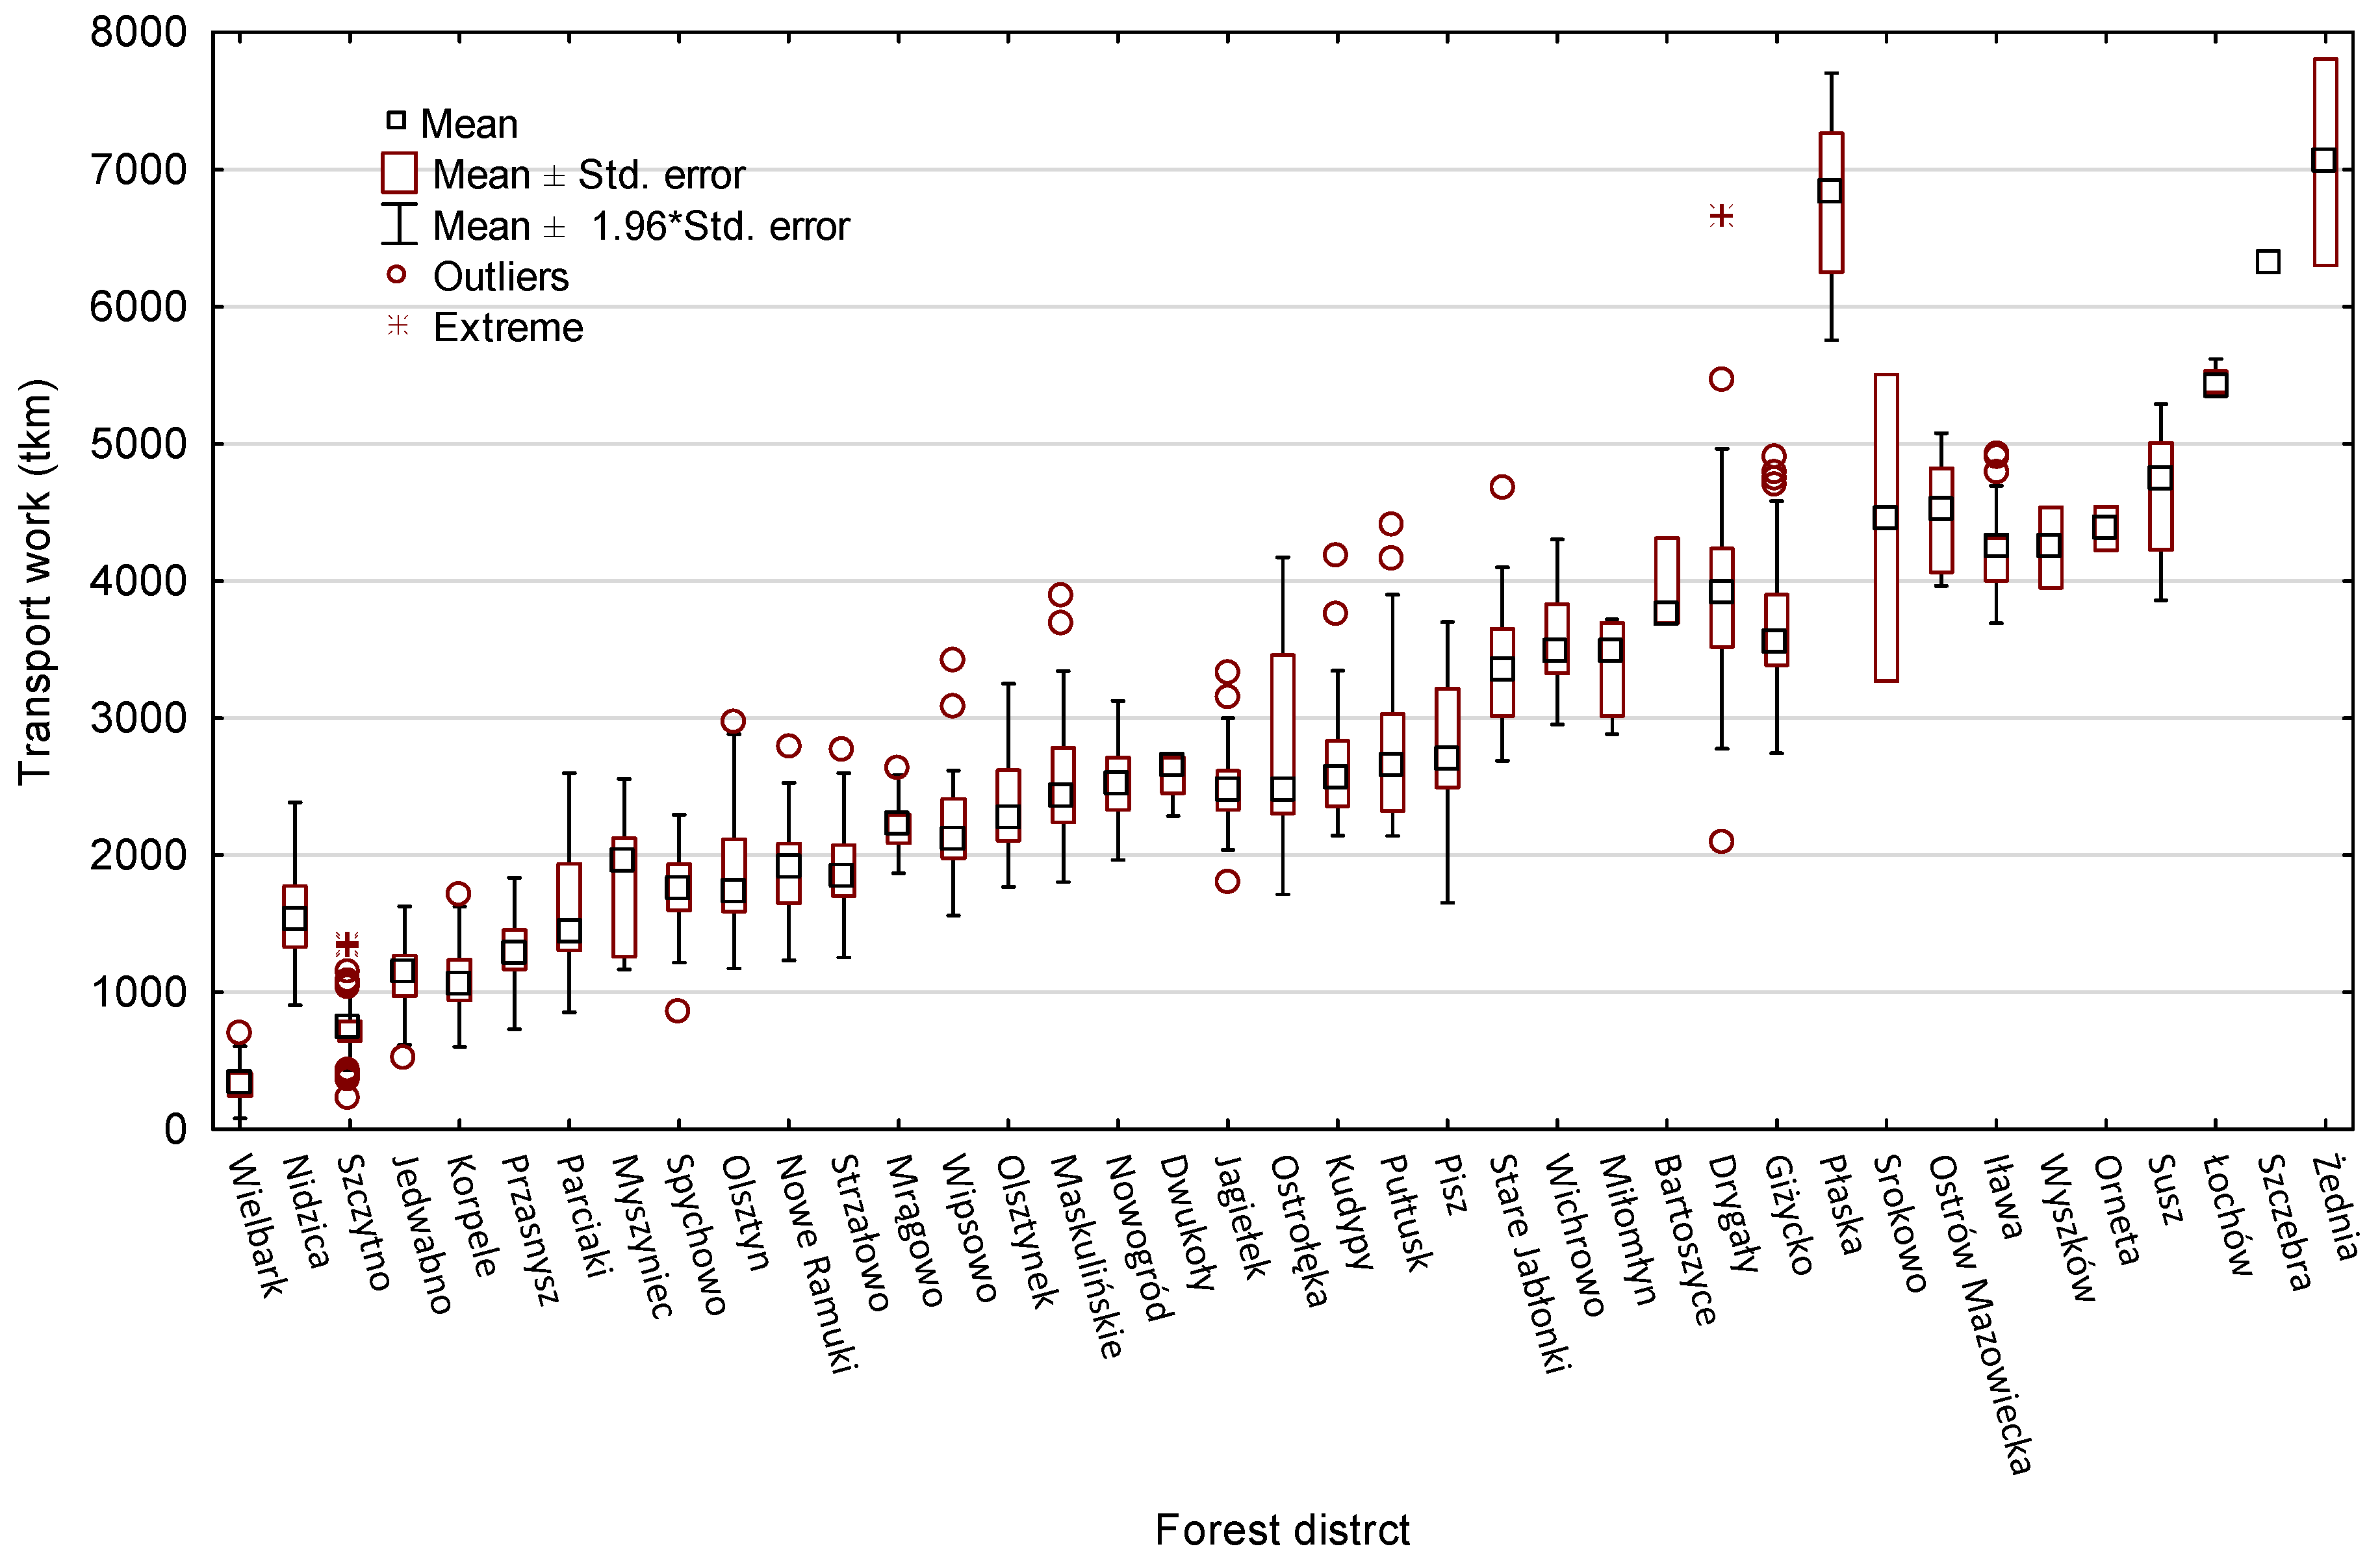
The analysis of transport work for a single course according to forest districts showed very large differences (Kruskal-Wallis test p = 0.0000), as shown in Figure 4. With very similar cargo volumes (m3) and cargo weight (kg), which was shown in previous analyzes and in Table 1, the transport distance has a significant effect on the transport work performed with the transport of timber.
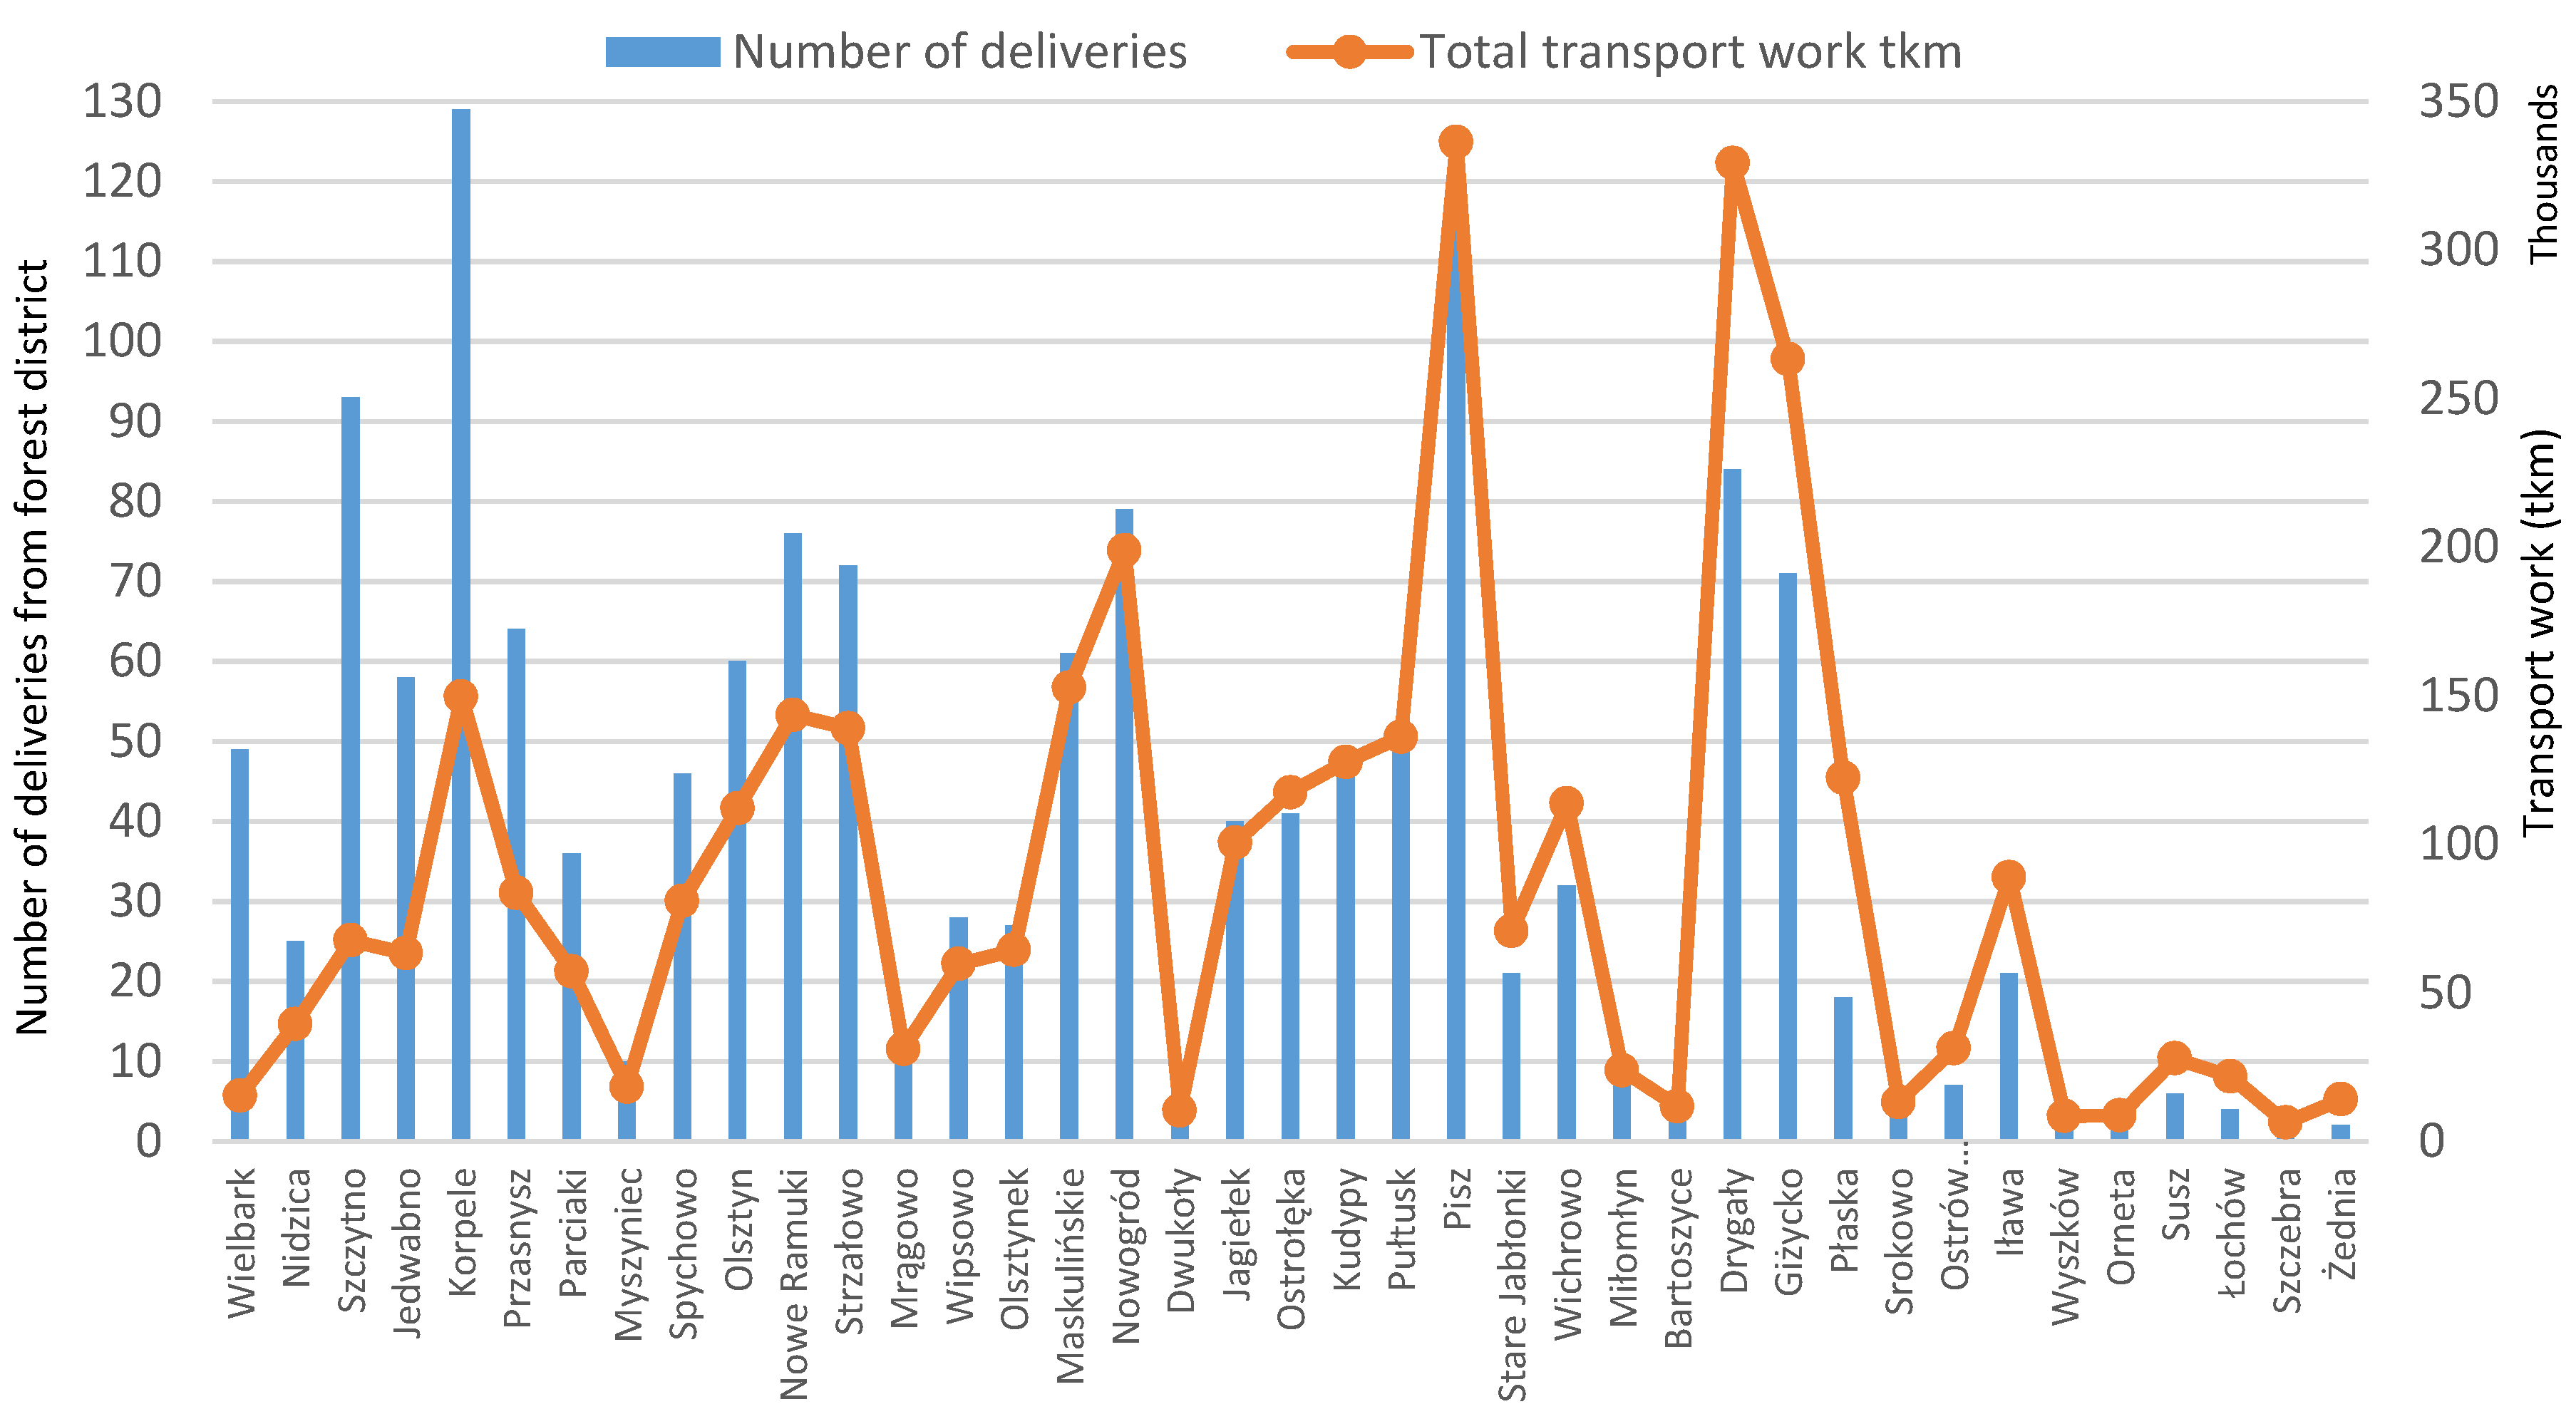
The total transport work performed for the deliveries of wood from each forest districts depends on the distance from the sawmill and the number of deliveries made. The results presented in Figure 5 clearly show that the supply of pine sawlogs in the nearest forest districts requires much less transport work, for example in the Korpele Forest District. Purchases of round wood in remote forest districts, even with a smaller number of deliveries, are characterized by a high amount of transport work, as in the case of the Drygały or Giżycko Forest Districts. Purchase of wood in seven forest districts (Wielbark-Parciaki) up to 50 km from the sawmill (Table 1) accounts for 30.1% of the analyzed deliveries (1509), resulting in only transport work at the level of 476,104 tkm, which is only 13.8% of the total transport work of all deliveries.
4. Discussion
By making theoretical optimization by doubling the number of deliveries, made only from the closest 14 Forest Districts, with an average distance from 8.2 km to 74.0 km (in the range of min = 3.0 km to max = 105 km, Table 1), it is possible to reduce the generated transport work. Delivering the same amount of wood (at the level of 44,340 m3) would require transport work at the level of 2,103,819 tkm, which is 39% less than in the analyzed case. By increasing the number of deliveries from the nearest forest districts threefold with an average transport distance of 8.2–57.1 km (with a range of 3.0–81.0 km), it would be possible to reduce the transport work to the level of 1,694,279 tkm, thus 51% less than in the analyzed case. At the same time, the delivery of the same wood quantity would require cooperation with only the nine closest forest districts. The sale offer of pine sawlogs by State Forest in the analyzed area is on much higher level then analyze sawmill capacity. Theoretically, this situation allows to reduce sawmill purchase circle to maximum 50 km. Harvesting and sales offer of large-size roundwood in seven forest districts (from Wielbark to Parciaki, Table 1) within 50 km from the sawmill is at the average annual level of 43,000 m3 per State Forest District. The sales offer from 30,000 m3 (Parciaki) up to 67,000 m3 (Jedwabno) depends on the forest structure and is connected with 10 years Forest Management Plan. Within 50 km from the sawmill, the annual sales potential of large-size wood in seven State Forest Districts is 303,000 m3 of wood per year. This is more than the annual demand of the analyzed sawmill. Unfortunately, the wood sales rules in Poland limits this solution. The sale of roundwood is made through an electronic restricted tender, where the State Forest sets and establishes rules for evaluating the submitted offers [38]. The presented optimization could take place in a situation of lifting the current restrictions on wood purchase. In a situation where all roundwood planned for sale by State Forest would be sold through online auctions without any restrictions, it would be possible to purchase enough quantity of sawlogs through a sawmill in the nearest State Forest Districts. On the other hand, such a solution would also have a negative impact on the possibility of selling wood by forest districts located further away from the sawmill, in the areas where there are no other significant buyers.
Based on the analyzes, the average fuel consumption was on the level 0.56 L·km−1. Austrian studies show higher values at the level of 0.77 L·km−1 [39], which may result from a different type of assortment, road condition and different topography. With the average transport distance from the forest to the sawmill at the level of 75.4 km, with an average load volume of 29.34 m3 [40], the amount of fuel needed to transport 1 m3 of pine sawlogs in the conducted research is 1.44 L·m−3. These results are consistent with other studies, which show the value of 0.73 L·m−3 at a transport distance of 31.4 km [41]. A reliable indicator for analyses and comparisons of variable loads (volume and mass) can be the mass of 1 m3 of wood in the load, which amounted to 1033.87 kg·m−3, with similar results in the population at SD = 57.87, and a median of 1031.61 kg·m−3 [40]. Fuel consumption per 1 m3 of wood is primarily determined by the transport distance and the size of the load [42].
Rijkswaterstaat [43] presents calculations (estimation) that, with a reduction in transport distance of approximately 20 million kilometers per year, CO2 emissions decrease by 0.016 Mt per year (per 1 km reduction of 0.0008 t). Assuming the estimates presented by Rijkswaterstaat [43], the reduction of the analyzed 113,728 km of deliveries by 39% (44,354 km) and 51% (58,000 km) in the first and the second analyzed delivery variant, respectively, allows to estimate the reduction of CO2 emissions at the level of 35.5 t and 46.4 t. However, in order to fully assess the environmental impact of transport, estimation methods should be used for specific route sections, given that the amount of pollutant emissions is strongly influenced by speed, load and gradient index [44].
The calculations were presented for 1509 transports (14%) of all completed 9797 deliveries to the sawmill, so the total reduction in transport work, mainly kilometers traveled, and thus the reduction of CO2 emissions may be much higher.
5. Conclusions
Most of the deliveries of pine sawlogs to the sawmill, 180 transports, were related to the deliveries from distance of 70 ÷ 80 and 80 ÷ 90 km. 30.1% of deliveries to the sawmill (454 courses) were made from distances of up to 50 km (average transport distance).
With very similar loads of round wood, the transport distance has a significant impact on transport work, which does not depend on the delivery date.
It is possible to optimized (reduce) the round wood deliveries, and thus transport work, as a result of a change in the structure of sawlogs sourcing by the sawmill. The annual potential of the roundwood sold in the closest State Forest Districts is higher than the sawmill capacity, but the current Wood Sales Rules limit this possibility.
Author Contributions
Conceptualization, G.T. and Ł.T.; methodology, G.T and Ł.T.; formal analysis, G.T. and Ł.T.; investigation, G.T. and Ł.T.; data curation, G.T. and Ł.T; writing—original draft preparation, G.T. and Ł.T.; writing—review and editing, Ł.T.; visualization, Ł.T.; supervision, G.T. All authors have read and agreed to the published version of the manuscript.
Funding
This research received no external funding.
Conflicts of Interest
The authors declare no conflict of interest.
References
- GUS Forestry 2019. Available online: https://stat.gov.pl/en/topics/statistical-yearbooks/statistical-yearbooks/statistical-yearbook-of-forestry-2019,12,2.html (accessed on 2 December 2020).
- Wnorowska, M. Raport Forestor Tartacznictwo. Sawmilling Forestor Raport. Przemysł Drzewny. Res. Dev. 2019, 4, 15–35. Available online: https://forestor.przemysldrzewny.eu/przemysl-drzewny-nr-4-2019/?v=9b7d173b068d (accessed on 20 March 2020). (In Polish).
- Sieniawski, W. Waloryzacja Dostaw Drewna do Wybranych Segmentów Przemysłu Drzewnego. Valorization of Wood Supply to Selected Segments of Timber Industry. Ph.D. Thesis, WULS-SGGW, Warsaw, Poland, June 2012. (In Polish). [Google Scholar]
- Cooper, M.C.; Lambert, D.M.; Pagh, J.D. Supply Chain Management: More Than a New Name for Logistics. Int. J. Logist. Manag. 1997, 8, 1–14. [Google Scholar] [CrossRef]
- Wailgum, T. Supply Chain Management Definition and Solutions, CIO—Business Technology Leadrship. 2008. Available online: http://www.cio.com/article/40940/Supply_Chain_Management_Definition_and_Solutions (accessed on 25 March 2020).
- Hirsch, P. Minimizing Empty Truck Loads in Round Timber Transport with Tabu Search Strategies. Int. J. Inf. Syst. Supply Chain Manag. 2011, 4, 15–41. [Google Scholar] [CrossRef] [Green Version]
- Shaffer, R.M.; Stuart, W.B. A checklist for efficient log trucking. Va. Coop. Ext. 2005, 420-094, 1–5. Available online: http://hdl.handle.net/10919/54904 (accessed on 15 August 2020).
- Greulich, F. Transportation networks in forest harvesting: Early development of the theory. In Proceedings of the International Seminar on New Roles of Plantation Forestry Requiring Appropriate Tending and Harvesting Operations, Tokyo, Japan, 29 September–5 October 2002; Available online: http://faculty.washington.edu/greulich/Documents/IUFRO2002Paper.pdf (accessed on 25 January 2020).
- McDonald, T.P.; Haridass, K.; Valenzuela, J. Mileage savings from optimization of coordinated trucking. In Proceedings of the 2010 COFE: 33rd Annual Meeting of the Council on Forest Engineering, Auburn, Alabama, 6–9 June 2010; Available online: https://cofe.org/pdfs/COFE_2010.pdf (accessed on 25 August 2020).
- Klocek, A. Optymalizacja przewozu drewna z miejsca jego załadunku do miejsca rozładunku. Optimizing the transport of timber from the place of its loading to the place of unloading. Przemysł Drzewny. Res. Dev. 2016, 4, 68–74. (In Polish) [Google Scholar]
- Löfroth, C.; Svenson, G.; Rådström, L. Testing of revolutionary round wood haulage rig in Sweden. In Raport 12/2010; Norwegian Forest and Landscape Institute: Honne, Norway, 2010; pp. 47–48. Available online: https://nibio.brage.unit.no/nibio-xmlui/bitstream/handle/11250/2469357/SoL-Rapport-2010-12.pdf?sequence=2&isAllowed=y (accessed on 10 February 2020).
- Frisk, M.; Göthe-Lundgren, M.; Jörnsten, K.; Rönnqvist, M. Cost allocation in collaborative forest transportation. Eur. J. Oper. Res. 2010, 205, 448–458. [Google Scholar] [CrossRef] [Green Version]
- Palander, T.; Väätäinen, J. Impacts of interenterprise collaboration and backhauling on wood procurement in Finland. Scand. J. For. Res. 2005, 20, 177–183. [Google Scholar] [CrossRef]
- Hirsch, P.; Gronalt, M. The timber transport order smoothing problem as part of the three-stage planning approach for round timber transport. J. Appl. Oper. Res. 2013, 5, 70–81. [Google Scholar]
- Sieniawski, W.; Porter, B. Zrównoważony łańcuch dostaw drewna na przykładzie wybranego zakładu. Sustainable Wood Supply Chain based on the example of a chosen sawmill. Studia i Materiały CEPL w Rogowie 2012, 14, 254–264. Available online: http://cepl.sggw.pl/sim/pdf/sim32_pdf/sim32_Sieniawski_Porter.pdf (accessed on 20 October 2020). (In Polish).
- Haridass, K.; Valenzuela, J.; Yucekaya, A.D.; McDonald, T. Scheduling a log transport system using simulated annealing. Inf. Sci. 2014, 264, 302–316. [Google Scholar] [CrossRef]
- Kłapeć, B.; Tracz, W.; Janeczko, K. Optimization of the transportation of wood purchased in the State Forests units. Sylwan 2017, 161, 842–850. [Google Scholar] [CrossRef]
- Gerasimov, Y.; Sokolov, A.; Syunev, V. Optimization of industrial and fuel wood supply chain associated with cut-to-length harvesting. Syst. Methods Technol. 2011, 11, 118–124. [Google Scholar]
- Gerasimov, Y.; Sokolov, A.; Karjalainen, T. GIS-Based Decision-Support Program for Planning and Analyzing Short-Wood Transport in Russia. Croat. J. For. Eng. 2008, 29, 163–175. [Google Scholar]
- Tymendorf, Ł.; Trzciński, G. Duration of stages of delivery of large−sized Scots pine wood to the sawmill. Sylwan 2020, 164, 549–559. [Google Scholar] [CrossRef]
- Tymendorf, Ł.; Trzciński, G. Driving on forest and public roads in deliveries of large−size Scots pine wood to sawmill. Sylwan 2020, 164, 651–662. [Google Scholar] [CrossRef]
- Czyżyk, K.; Porter, B. Geografia dostaw drewna do wybranego zakładu. Geography of wood supplies to the selected factory. Technika Rolnicza Ogrodnicza Leśna 2014, 3/2014, 2–5. (In Polish) [Google Scholar]
- Sieniawski, W.; Trzciński, G. Analysis of large-size and medium-size wood supply. In Raport 12/2010; Norwegian Forest and Landscape Institute: Honne, Norway, 2010; pp. 56–57. Available online: https://nibio.brage.unit.no/nibio-xmlui/bitstream/handle/11250/2469357/SoL-Rapport-2010-12.pdf?sequence=2&isAllowed=y (accessed on 28 November 2020).
- Liimatainen, H.; Pöllänen, M.; Nykänen, L. Impacts of increasing maximum truck weight—case Finland. Eur. Transp. Res. Rev. 2020, 12, 14. [Google Scholar] [CrossRef] [Green Version]
- Väätäinen, K.; Laitila, J.; Anttila, P.; Kilpeläinen, A.; Asikainen, A. The influence of gross vehicle weight (GVW) and transport distance on timber trucking performance indicators—Discrete event simulation case study in Central Finland. Int. J. For. Eng. 2020, 31, 156–170. [Google Scholar] [CrossRef]
- Palander, T.; Kärhä, K. Potential traffic levels after increasing the maximum vehicle weight in environmentally efficient transportation system: The Case of Finland. J. Sustain. Dev. Energy Water Environ. Syst. 2017, 5, 417–429. [Google Scholar] [CrossRef]
- Lukason, O.; Ukrainski, K.; Varblane, U. Economic benefit of maximum truck weight regulation change for Estonian forest sektor. Veokite täismassi regulatsiooni muutmise majanduslikud mõjud eesti metsatööstuse sektorile. Est. Discuss. Econ. Policy 2011, 19. [Google Scholar] [CrossRef]
- Trzciński, G.; Tymendorf, Ł. Timber deliveries after introduction of the normative calculators of wood density to determine the load weight. Sylwan 2017, 161, 451–459. [Google Scholar] [CrossRef]
- McKinnon, A.C. The Economic and Environmental Benefits of Increasing Maximum Truck Weight: The British Experience. Transp. Res. Part Transp. Environ. 2005, 10, 77–95. [Google Scholar] [CrossRef]
- Knight, I.; Newton, W.; McKinnon, A.; Palmer, A.; Barlow, T.; McCrae, I.; Dodd, M.; Couper, G.; Davies, H.; Daly, A.; et al. Longer and/or Longer and Heavier Goods Vehicles (LHVs)—A Study of the Likely Effects if Permitted in the UK: Final Report. 2008. Available online: https://www.nomegatrucks.eu/deu/service/download/trl-study.pdf (accessed on 10 February 2020).
- Rodrigues, V.S.; Piecyk, M.; Mason, R.; Boenders, T. The longer and heavier vehicle debate: A review of empirical evidence from Germany. Transp. Res. Part D Transp. Environ. 2015, 40, 114–131. [Google Scholar] [CrossRef]
- Pålsson, H.; Hiselius, L.W.; Wandel, S.; Khan, J.; Adell, E. Longer and heavier road freight vehicles in Sweden. Int. J. Phys. Distrib. Logist. Manag. 2017, 47, 603–622. [Google Scholar] [CrossRef]
- Kolisoja, P.; Kalliainen, A.; Haakana, V.; Information, R. Effect of Tire Configuration on the Performance of a Low-Volume Road Exposed to Heavy Axle Loads. Transp. Res. Rec. J. Transp. Res. Board 2015, 2474, 166–173. [Google Scholar] [CrossRef]
- Liimatainen, H.; Nykänen, L. Impacts of Increasing Maximum Truck Weight—Case Finland; Transport Research Centre Verne, Tampere University of Technology: Tampere, Finland, 2017; Available online: http://www.tut.fi/verne/aineisto/LiimatainenNyk%C3%A4nen.pdf (accessed on 10 January 2018).
- Mydlarz, K.; Wieruszewski, M. Problems of Sustainable Transport of Large-Sized Roundwood. Sustainability 2020, 12, 2038. [Google Scholar] [CrossRef] [Green Version]
- PN-93/D-02002. Round wood. In Classification, Terminology and Symbols; Polish Standardization Committee: Warsaw, Poland, 2002; p. 4. (In Polish)
- Zarządzenie nr 51 Dyrektora Generalnego Lasów Państwowych z dnia 30.09.2019 r. Regulation No. 51 of the General Director of the State Forests of 30.09.2019; General Directorate of the State Forests: Warsaw, Poland, 2019. Available online: http://drewno.zilp.lasy.gov.pl/drewno/Normy/1._podzia_terminologia_i_symbole_-_ujednolicono_wg_zarz_54-2020.pdf (accessed on 20 October 2020). (In Polish)
- Decyzja 160 Dyrektora Generalnego LP z 12 listopada 2019 w sprawie kryteriów, parametrów i sposobu wartościowania ofert zakupu oraz regulaminów sprzedaży w Portalu Leśno-Drzewnym i aplikacji internetowej e-drewno. Decision 160 of the Director General of the State Forests of November 12, 2019 on the Criteria, Parameters and Method of Evaluating Purchase Offers As Well As Sales Regulations in the Forest-Wood Portal and the E-Timber Web Application. Available online: http://drewno.zilp.lasy.gov.pl/drewno/decyzja_nr_160_dglp_z_12.11.2019_r._w_sprawie_kryteriow_param_i_sposobu_wart._ofert_zakupu_oraz_regulaminow_sprzedazy_w_pld_-_e-drewno.pdf (accessed on 20 October 2020). (In Polish)
- Holzleitner, F.; Kanzian, C.; Stampfer, K. Analyzing time and fuel consumption in road transport of round wood with an onboard fleet manager. Eur. J. For. Res. 2010, 130, 293–301. [Google Scholar] [CrossRef]
- Tymendorf, Ł.; Trzciński, G. Multi-Factorial Load Analysis of Pine Sawlogs in Transport to Sawmill. Forests 2020, 11, 366. [Google Scholar] [CrossRef] [Green Version]
- Lijewski, P.; Merkisz, J.; Fuć, P.; Ziółkowski, A.; Rymaniak, Ł.; Kusiak, W. Fuel consumption and exhaust emissions in the process of mechanized timber extraction and transport. Eur. J. For. Res. 2017, 136, 153–160. [Google Scholar] [CrossRef] [Green Version]
- Klvac, R.; Kolařík, J.; Volná, M.; Drápela, K. Fuel Consumption in Timber Haulage. Croat. J. For. Eng. 2013, 34, 229–240. [Google Scholar]
- Rijkswaterstaat. Longer and Heavier Vehicles in Practice. Economic, Logistical and Social Effects. 2011. Available online: http://www.modularsystem.eu/download/facts_and_figures/3839282_longer_and_heavier_vehicles_in_prakt.pdf. (accessed on 10 February 2020).
- Osorio-Tejada, J.L.; Llera-Sastresa, E.; Hashim, A.H. Well-to-Wheels Approach for the Environmental Impact Assessment of Road Freight Services. Sustainability 2018, 10, 4487. [Google Scholar] [CrossRef] [Green Version]
Figure 1.
Number of deliveries in 10 km sections with load.

Figure 2.
Weight of deliveries from individual forest districts (forest districts in the order of distance from the sawmill).
Figure 2.
Weight of deliveries from individual forest districts (forest districts in the order of distance from the sawmill).

Figure 3.
Characteristics of transport work for individual deliveries depending on the delivery month.
Figure 3.
Characteristics of transport work for individual deliveries depending on the delivery month.

Figure 4.
Characteristics of the transport work of individual deliveries from forest districts according to the transport distance.
Figure 4.
Characteristics of the transport work of individual deliveries from forest districts according to the transport distance.

Figure 5.
The completed transport work for the deliveries of timber from individual forest districts and the number of deliveries (forest districts in the order of distance from the sawmill).
Figure 5.
The completed transport work for the deliveries of timber from individual forest districts and the number of deliveries (forest districts in the order of distance from the sawmill).


Table 1.
Summary of the number of deliveries, average load weight and transport distance on a public road from forest districts to a sawmill according to the average distance.
Table 1.
Summary of the number of deliveries, average load weight and transport distance on a public road from forest districts to a sawmill according to the average distance.
| State Forest District | Number of Deliveries | Average Load Weight (t) | Deliveries with Cargo on a Public Road (km) | |||
|---|---|---|---|---|---|---|
| Average | SD | Minimum | Maximum | |||
| Wielbark | 49 | 30.61 | 8.2 | 4.6 | 3 | 23 |
| Nidzica | 25 | 29.87 | 19.1 | 11.4 | 24 | 70 |
| Szczytno | 93 | 30.38 | 20.7 | 5.5 | 7 | 38 |
| Jedwabno | 58 | 32.00 | 29.6 | 11.4 | 7 | 47 |
| Korpele | 129 | 29.28 | 34.3 | 7.1 | 25 | 57 |
| Przasnysz | 64 | 30.37 | 41.5 | 7.6 | 26 | 64 |
| Parciaki | 36 | 31.81 | 48.5 | 12.4 | 30 | 81 |
| Myszyniec | 10 | 31.25 | 54.5 | 14.2 | 36 | 76 |
| Spychowo | 46 | 30.60 | 57.1 | 7.8 | 28 | 68 |
| Olsztyn | 60 | 30.85 | 57.3 | 11.7 | 37 | 90 |
| Nowe Ramuki | 76 | 29.02 | 61.9 | 10.5 | 40 | 91 |
| Strzałowo | 72 | 29.35 | 61.9 | 9.4 | 40 | 84 |
| Mrągowo | 14 | 30.87 | 66.4 | 6.8 | 58 | 84 |
| Wipsowo | 28 | 28.44 | 74.0 | 12.3 | 48 | 105 |
| Olsztynek | 27 | 30.52 | 75.8 | 9.6 | 64 | 99 |
| Maskulińskie | 61 | 30.67 | 79.4 | 11.2 | 60 | 120 |
| Nowogród | 79 | 30.23 | 79.7 | 7.1 | 64 | 98 |
| Dwukoły | 4 | 38.81 | 81.9 | 4.6 | 75 | 84 |
| Jagiełek | 40 | 29.29 | 82.5 | 8.5 | 63 | 112 |
| Ostrołęka | 41 | 31.89 | 85.9 | 20.9 | 58 | 132 |
| Kudypy | 48 | 29.85 | 86.0 | 9.9 | 74 | 123 |
| Pułtusk | 49 | 30.12 | 90.8 | 15.8 | 75 | 136 |
| Pisz | 119 | 29.64 | 91.3 | 13.5 | 57 | 116 |
| Stare Jabłonki | 21 | 29.96 | 106.6 | 11.2 | 96 | 138 |
| Wichrowo | 32 | 31.36 | 109.8 | 8.5 | 90 | 127 |
| Miłomłyn | 7 | 29.75 | 111.0 | 4.1 | 106 | 116 |
| Bartoszyce | 3 | 37.78 | 114.7 | 15.5 | 99 | 130 |
| Drygały | 84 | 31.79 | 114.8 | 14.5 | 60 | 160 |
| Giżycko | 71 | 30.18 | 120.9 | 10.9 | 95 | 150 |
| Płaska | 18 | 30.30 | 121.1 | 9.3 | 205 | 238 |
| Srokowo | 3 | 33.25 | 126.0 | 29.5 | 93 | 150 |
| Ostrów Mazowiecka | 7 | 33.38 | 132.6 | 10.1 | 118 | 145 |
| Iława | 21 | 31.22 | 134.3 | 10.4 | 114 | 160 |
| Wyszków | 2 | 31.15 | 135.0 | 7.1 | 130 | 140 |
| Orneta | 2 | 31.68 | 138.0 | 4.2 | 135 | 141 |
| Susz | 6 | 29.60 | 155.5 | 15.9 | 127 | 167 |
| Łochów | 4 | 32.53 | 166.3 | 2.5 | 165 | 170 |
| Szczebra | 1 | 28.30 | 215.0 | - | 215 | 215 |
| Żednia | 2 | 30.80 | 225.0 | 7.1 | 220 | 238 |
Table 2.
Characteristics of analyzed parameters in wood transportation to sawmill.
| Measure | Mean | SD | Min | Max | Q1 | Median | Q3 |
|---|---|---|---|---|---|---|---|
| Mass of load (t) | 30.32 | 2.20 | 21.75 | 38.91 | 28.80 | 30.20 | 31.75 |
| Total driving with load (km) | 75.4 | 39.1 | 3.0 | 274.5 | 45.2 | 74.0 | 98.0 |
| Transport work (tkm) | 2282 | 1207 | 83 | 7803 | 1358 | 2220 | 2997 |
Notes: SD. standard deviation; Q1. first quartile; Q3. third quartile.
Table 3.
Fuel consumption characteristics for sawlogs delivered to a sawmill based on transport distance with load.
Table 3.
Fuel consumption characteristics for sawlogs delivered to a sawmill based on transport distance with load.
| Measure | Mean | SD | Min | Max | Q1 | Median | Q3 |
|---|---|---|---|---|---|---|---|
| Fuel consumption (L·km−1) | 0.561 | 0.055 | 0.380 | 0.870 | 0.530 | 0.570 | 0.598 |
| Fuel consumption per 1 m3 of delivered wood (L·m−3) | 2.628 | 1.286 | 0.16 | 7.630 | 1.600 | 2.568 | 3.406 |
| Fuel consumption per delivery (L) | 77.116 | 38.099 | 4.800 | 125.940 | 46.170 | 76.160 | 99.456 |
Notes: SD. standard deviation; Q1. first quartile; Q3. third quartile.
Publisher’s Note: MDPI stays neutral with regard to jurisdictional claims in published maps and institutional affiliations. |
© 2020 by the authors. Licensee MDPI, Basel, Switzerland. This article is an open access article distributed under the terms and conditions of the Creative Commons Attribution (CC BY) license (http://creativecommons.org/licenses/by/4.0/).
Share and Cite
MDPI and ACS Style
Trzciński, G.; Tymendorf, Ł. Transport Work for the Supply of Pine Sawlogs to the Sawmill. Forests 2020, 11, 1340. https://0-doi-org.brum.beds.ac.uk/10.3390/f11121340
AMA Style
Trzciński G, Tymendorf Ł. Transport Work for the Supply of Pine Sawlogs to the Sawmill. Forests. 2020; 11(12):1340. https://0-doi-org.brum.beds.ac.uk/10.3390/f11121340
Chicago/Turabian StyleTrzciński, Grzegorz, and Łukasz Tymendorf. 2020. "Transport Work for the Supply of Pine Sawlogs to the Sawmill" Forests 11, no. 12: 1340. https://0-doi-org.brum.beds.ac.uk/10.3390/f11121340
Note that from the first issue of 2016, this journal uses article numbers instead of page numbers. See further details here.