Article

Half-Sib Lines of Pedunculate Oak (Quercus robur L.) Respond Differently to Drought Through Biometrical, Anatomical and Physiological Traits

1
Faculty of Agriculture, University of Novi Sad, 21000 Novi Sad, Serbia
2
Department of Agriculture, Food, Environment and Forestry, University of Florence, 50145 Florence, Italy
3
Institute of Lowland Forestry and Environment, University of Novi Sad, 21000 Novi Sad, Serbia
4
Institute of Economic Sciences, University of Belgrade, 11000 Belgrade, Serbia
*
Author to whom correspondence should be addressed.
Submission received: 7 January 2020 / Revised: 25 January 2020 / Accepted: 28 January 2020 / Published: 30 January 2020
(This article belongs to the Special Issue Tree Responses to Drought)

Abstract

:
Quercus robur L. is one of the most valued tree species of deciduous temperate forests. However, in the last decade, serious oak declines and loss of adaptation plasticity have been reported throughout Europe as a consequence of drought. Therefore, the aim of the present study was to define the adaptation potential of five Q. robur half-sib lines from the UNESCO Biosphere Reserve Mura-Drava-Danube to drought, using physiological, anatomical and biometrical traits. Half-sib lines that exhibited drought tolerance had particular suites of trait expression regarding biometrical traits (seedling height, root length, root to shoot ratio of dry mass and specific leaf area), leaf stomatal traits (stomatal density per mm2, stomata guard cell length and width, stomatal aperture length and width) and leaf structural traits (adaxial epidermis thickness, palisade parenchyma thickness, spongy parenchyma thickness, lamina thickness). All of the observed parameters of chlorophyll a fluorescence were shown to be good indicators of short-term and severe drought. For the selection of drought-tolerant half-sib lines, all studied chlorophyll a fluorescence parameters associated with the heat dissipation of light energy (coefficient of non-photochemical quenching, quantum yield of regulated energy dissipation, Stern-Volmer type non-photochemical fluorescence quenching) and one parameter related to photochemical dissipation of light energy (effective quantum yield (efficiency) of PS II photochemistry) were proven to be suitable. On the other hand, the coefficient of photochemical quenching, coefficient of photochemical fluorescence quenching assuming interconnected photosystem II antennae and electron transport rate were not suitable for distinguishing the different responses of the studied half-sib lines under drought. The importance of results of the present study is in the selection of drought-tolerant Q. robur half-sib lines for future reforestation programs, particularly in protected areas with sensitive forest management and restricted activities for mitigation of the adverse effects of climate changes.

1. Introduction

Drought has been recognised as a major abiotic stress, limiting the geographical distribution, growth, and productivity of plants [1,2]. As a consequence of reduced rainfall, along with the increase in air temperature allows predicting frequent, severe and long-lasting drought periods for the future, especially in southern Europe [3,4,5]. The adverse effect of drought in forest ecosystems has been noted throughout Europe [6,7,8,9], causing economic and ecologic losses, reducing genetic and phenotypic diversity [10].
Q. robur is widely distributed in European deciduous temperate forests [11]. As a consequence of its high timber quality, pedunculate oak forests are among the most valued in Europe [12]. The distribution of this species is characterised by fertile and moist soil conditions; therefore, its drought tolerance in the predicted forthcoming conditions will become essential [11]. Indeed, oak decline has been recognised as a pressing issue in South-Eastern Europe even in the present days, showing an increasing trend in the last three centuries [13,14,15]. As a consequence of disturbed conditions with declining levels of groundwater in South-East European forests, a reduced plasticity of Q. robur adaptation to drought was observed presuming even greater rates of mortality in the future [16].
Drought was evidenced to induce both short- and long-term changes in plants [17]. With regards to short-term responses to drought (i.e., acclimation) chlorophyll a fluorescence has been shown to be a rapid and reliable indicator of drought stress [18,19]. Stern-Volmer type non-photochemical fluorescence quenching (NPQ) was observed to firstly respond in such conditions, as a photoprotective mechanism to cope against the stressor [20]. On the other hand, long-term responses, taking even several months, are observable in the adaptation of leaf structural traits and plants biometry. However, understanding the responses of trees to drought and predicting its effects, namely tree dieback [21], are the main challenges for the sustainability of forest ecosystems [22]. Moreover, the ability of pedunculate oak to overcome such unfavourable conditions should be the most important objective in future forestation and reforestation programs [23]. Although several studies defined the responses of pedunculate oak to drought [24,25,26], information regarding long-term changes in anatomy under drought conditions is lacking. Moreover, this study of the seedling stage is of key importance because it was recognised to be the most critical phase during the plant’s life cycle, due to the high vulnerability of seedlings to various abiotic and biotic stress factors [27,28], in comparison to adult trees. Likewise, progeny tests are used for evaluation of mother trees genetic value, as well as for the studying of trees populations, provenances and families adaptation potential to diverse stress elicitors in the juvenile development stage.
The present study was addressed to define the short- and long-term adaptation of Q. robur to naturally occurring drought. The study hypothesis is based on the direct effect of drought on the kinetics of enzymes involved in carbon fixation, the sensitivity to drought results in the effective photochemical quantum yield of photosystem II (Y(II)) and the related functions [29]. We hypothesised that the observed half-sib lines respond differently to drought through changes in physiology, anatomy and biometry, where differences, for instance, in the sensitivity of photosystem II (PSII), define drought-avoiding strategy in limiting carbon assimilation in drought-susceptive seed sources. The main goal of the present study was to select Q. robur half-sib line with high adaptation potential to drought for future reforestation programs.

2. Materials and Methods

2.1. Plant Material and Experimental Set-up

For the present study, in the autumn of 2017, a total of 750 acorns were collected below the canopy of five phenotypically dominant pedunculate oak (Quercus robur L.) mother trees, whose crowns were located within the upper canopy (150 acorns for each mother tree), originating from the native population situated in the UNESCO Biosphere Reserve Mura-Drava-Danube (N 45°91’, E 18°88’). Dominant mother trees were selected according to the protocol developed within the DANUBE Interreg project: “Resilient riparian forests as ecological corridors in the Mura-Drava-Danube Biosphere Reserve (REFOCuS)” (Supplementary Materials Table S1), for the growth rate diameter at the breast height, total height and crown height, as well as based on visually assessed properties such as bole straightness and branch characteristics (Supplementary Materials Table S2). The distance between sampled trees was at least 100 m. Before sowing (1 November 2017), the collected acorns had been soaked in tap water for 24 h in order to assess their viability and eliminate the damaged and unhealthy acorns.
The field trial was established at the nursery of Experimental Estate of the Institute of Lowland Forestry and Environment (N 45°20’, E 19°51’; 84 m a.s.l., Serbia). At the trial site, the soil type was undeveloped alluvial soil (fluvisol) with sandy loam form, containing sand (63.5%) and silt + clay fractions (34.8%), and the colloid clay component ranged between 5.5% to 9.7% [30]. The collected acorns were arranged in a complete block design, with three replications (150 seeds were sown per each half-sib line, 50 seeds per a single replication). The sowing was performed manually at a depth of 2 cm and spacing of 30 × 30 cm, in order to ensure optimal space for plants’ growth during the first year. The established field trial was subjected to outdoor environmental conditions without any additional artificial irrigation or fertilisation.
In the present study, 24 parameters were analysed, which can be roughly classified into biometrical, leaf anatomical and physiological traits (Table 1.)

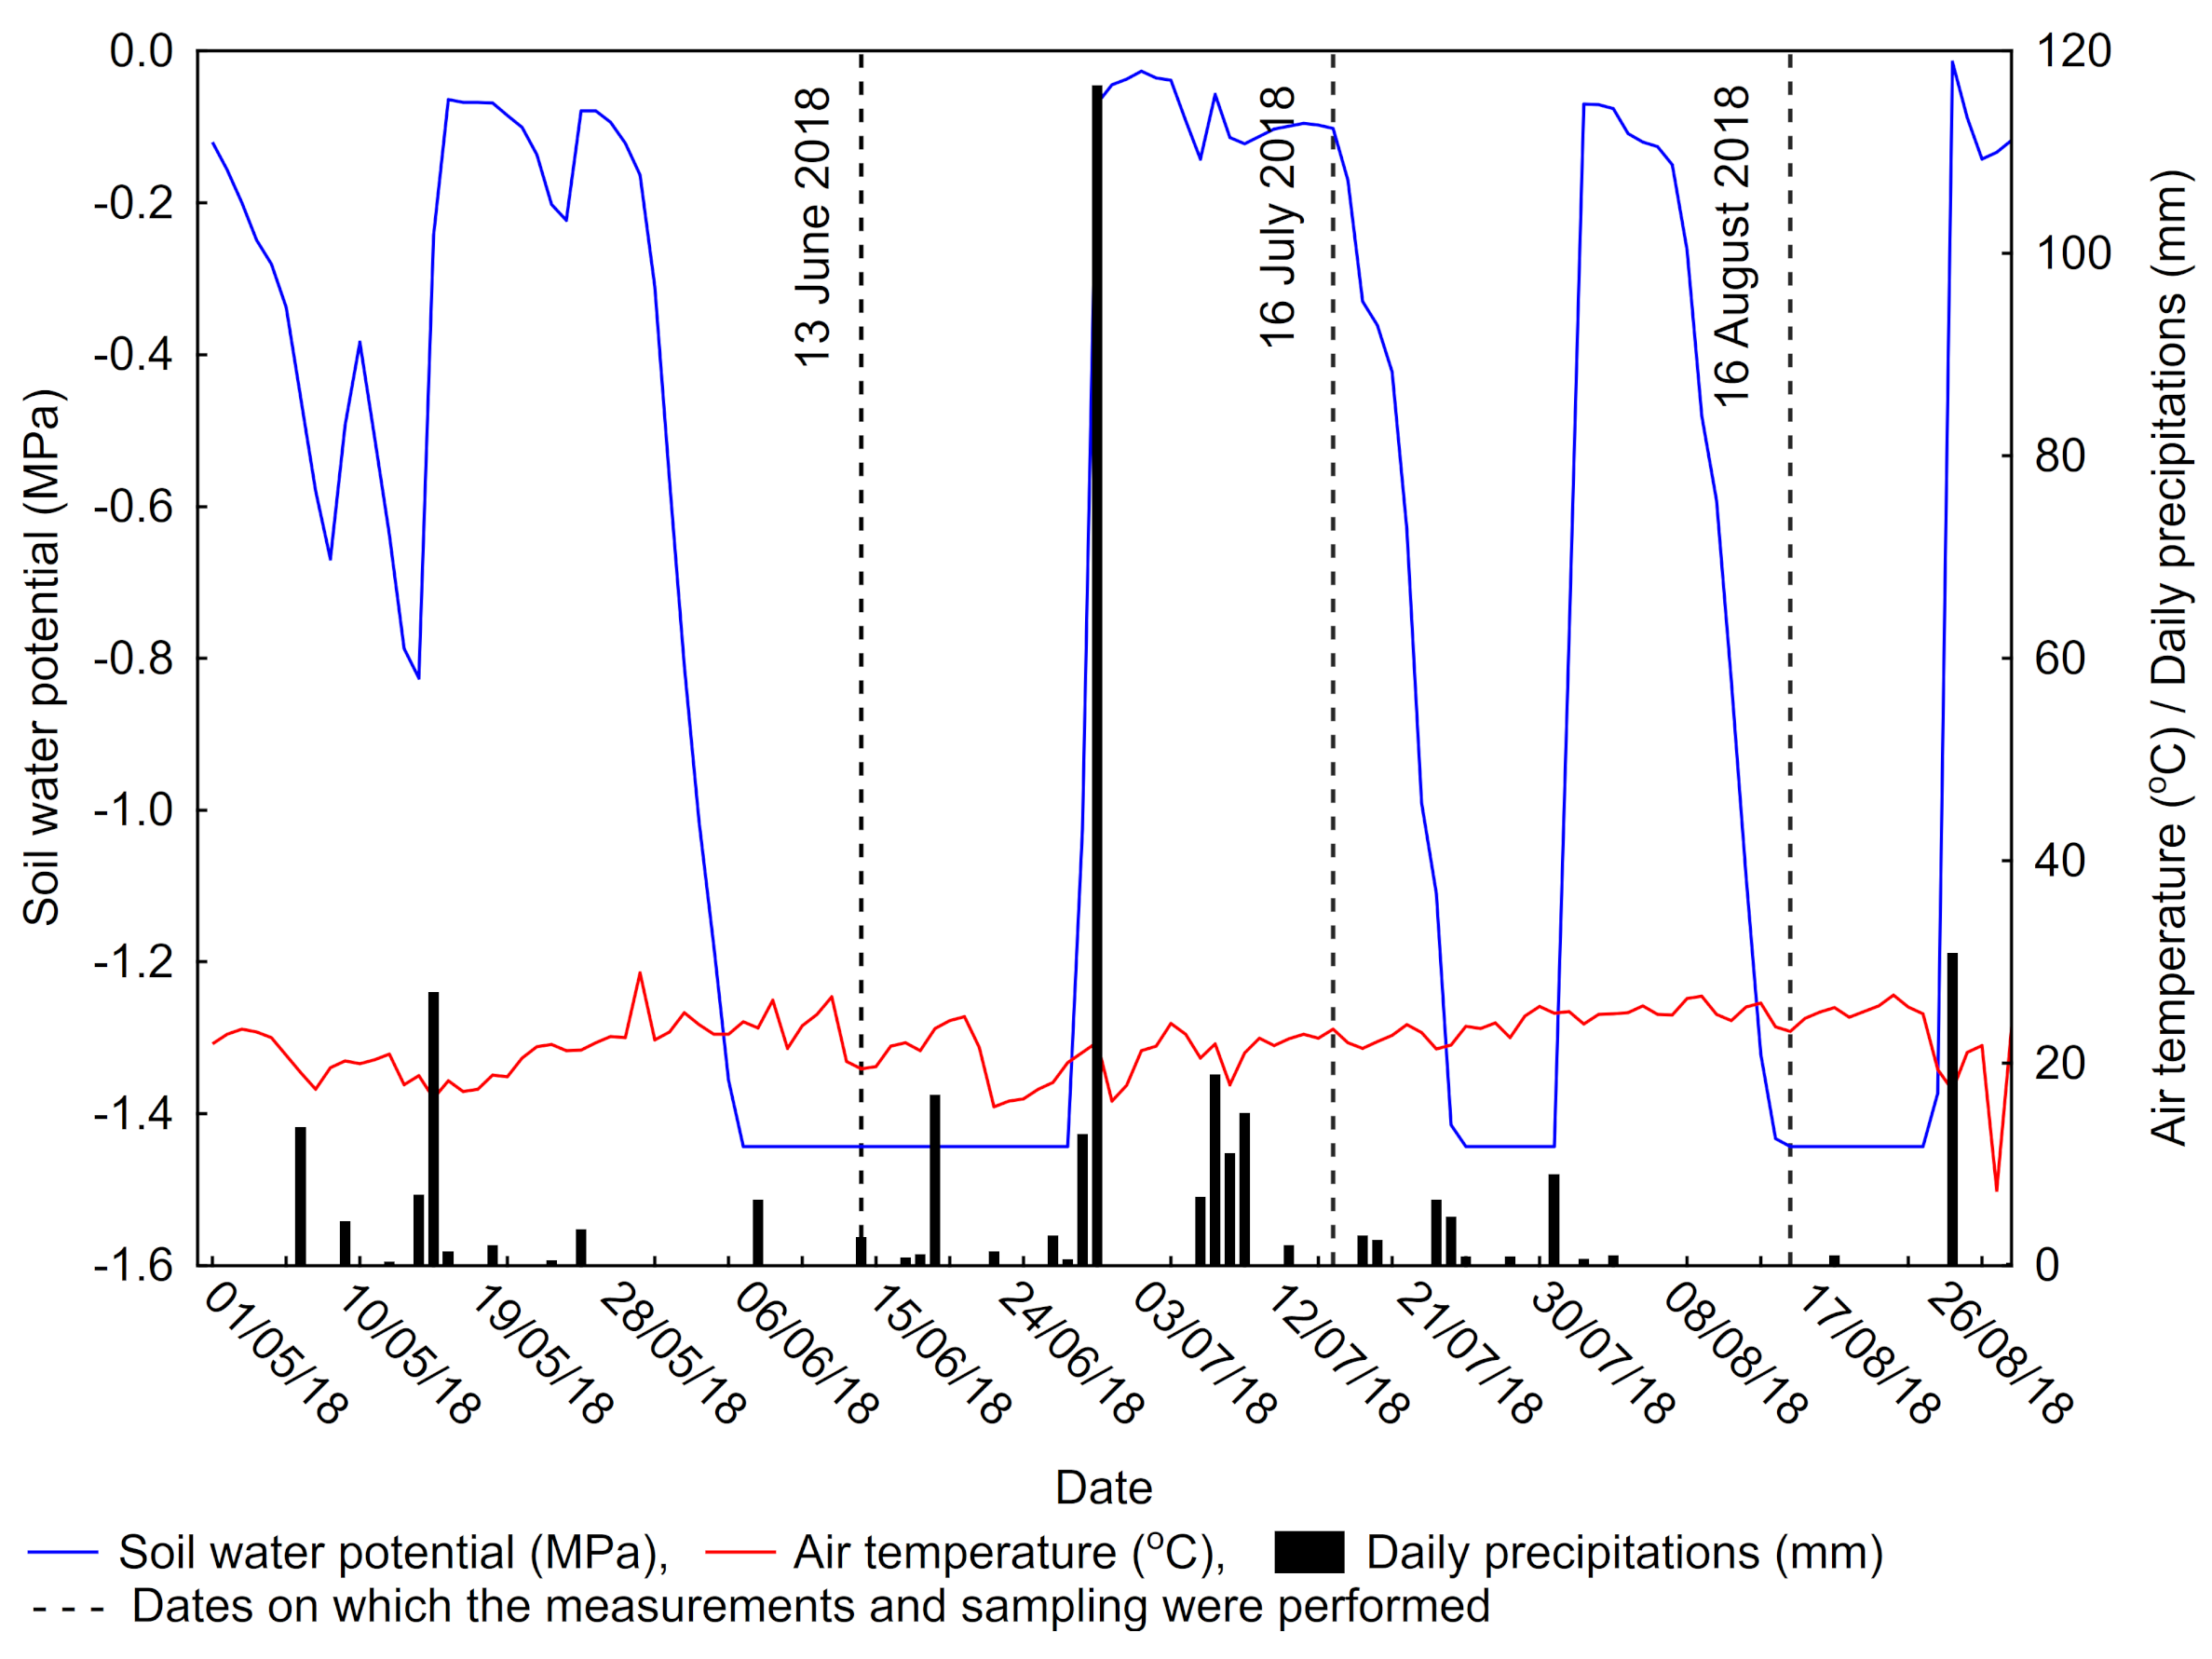
2.2. Meteorological Data

Air temperature (°C) and precipitation (mm) were monitored in the vegetation period of 2018 (from 1 May to 31 August) at the meteorological station “Rimski Šančevi” (N 45°20’, E 19°51’, altitude 84 m a.s.l.). Monitoring of the soil water regime at the trial plot was carried out in the vegetation period (from 1 May to 31 August) by measuring the water potential (MPa) automatically every 30 min at a depth of 30 cm by calibrated gypsum blocs Delmhorst Inc. (Towaco, NJ, USA) [31].
According to the obtained data during the growing season of 2018, three severe drought periods were characterised by low precipitation, soil water potentials of −1.5 MPa and air temperatures around 30 °C: the first starting in May and lasting for twenty-nine days (from 28 May 2018 till 25 June 2018), the second in July lasting for ten days (from 21 July 2018 till 30 July 2018) and a third in August lasting for sixteen days (from 9 August 2018 till 25 August 2018) (Figure 1).

2.3. Plant Biometric Characterisation

At the end of the experiment period (16 August 2018), nine seedlings of each half-sib line (three seedlings per three replication) were harvested and separated into plant components for determination of the following morphological traits: seedling height (SH) (cm), root collar diameter (RCD) (mm), root length (cm), root to shoot ratio of dry mass (R:S) and specific leaf area (SLA) (mm2 mg−1). Seedling height was measured using a standard metric ruler, while the root collar diameter was determined with an electronic digital caliper (Womax, Germany). Determination of seedling root length was performed by using “ImageJ’’ software for image analysis. The ratio of root to shoot dry mass was obtained after the seedlings were dried in a Memert oven UNB 400 (Schwabach, Germany) at 70 °C for 72 h to constant mass [32]. For assessment of leaf area, three leaves per nine seedlings of each half-sib line were measured with ADC Bisocientific AM 300-002 (Hoddestone, England) leaf area meter, while the specific leaf area was determined by dividing the leaf area by the dry leaf mass.

2.4. Leaf Anatomical Traits Measurements

Leaf anatomical measurements were performed on nine fully expanded leaves per each half-sib line (three seedlings per three replication) collected at the end of the experimental period, on a sunny and windless day, between 9:00 a.m. to 11:00 a.m. by applying the collodion method. A thick layer of transparent nail polish was applied on the central part of the leaf adaxial surface, along its main leaf vein [33]. After approximately 20 min, the applied nail polish was dried and peeled off from the leaf by an adhesive tape and placed on the microscope slide. In addition, the following stomatal traits were analysed using an Olympus BX 53F microscope (Tokyo, Japan): stomatal density per mm2 (SD), stomata guard cell length (LA, μm) and width (WB, μm), and stomatal aperture length (La, μm) and width (Wb, μm). For the assessment of SD, counting of stomata was done by the freeware software tpsDIG2 (Version 2.0., New York, NY, USA). Stomata guard cell and aperture size were determined by QuickPhoto Camera software (Version 3.2., Prague, Czech Republic) by measuring five stomata per five randomly chosen visual areas.
Afterwards, the same portions of leaves were used for preparing fresh sections by Cryostat MEV (SLEE medical GmbH, Mainz, Germany) [34]. Prior to preparing leaf cross sections, leaves were stored in plastic tubes containing 80 mL of 70% ethanol for tissue preservation. Leaf sections from the middle of leaf area were obtained at a chamber temperature of −25 °C and cutting intervals of 40 μm. After the sections were made and placed on a microscope slide, one drop of preservation liquid containing ethanol 70% and glycerin (1:1) was added and covered with a cover glass. Leaf sections were analysed afterwards by an Olympus BX 53F microscope using QuickPhoto Camera 3.2. software to assess the following anatomical traits: adaxial epidermis thickness (UE, μm), palisade parenchyma thickness (PT, μm), spongy parenchyma thickness (ST, μm), abaxial epidermis thickness (LE, μm), lamina thickness (LT, μm), main vein diameter (MVT, μm), sclerenchyma thickness (ScT, μm).

2.5. Chlorophyll a Fluorescence Measurements

The chlorophyll a fluorescence measurement was performed on 13 June 2018, when the soil water potential (SWP) reached −1.5 MPa (SWP) level of severe drought according to Liu et al. [35], and on 16 July 2018, with an SWP of −0.1 MPa, characterised as a wet period.
The pulse amplitude modulated fluorescence measurements were recorded with a PAM-2500 portable chlorophyll fluorometer (Walz, Germany) on a timescale between 9:00 and 11:00 a.m. on fully developed and disease-free leaves of nine seedlings (three seedlings per three replication) per five half-sib lines. In order to determine the photosynthetic activity of PS II, the rapid light curve (RLC) function was used with nine increasing actinic light steps ranging from 0 to 2443 μmol (photon) m−2 s−1 (0, 144, 274, 477, 788, 1163, 1389, 2018 and 2443, respectively). The illumination lasted 10 s with intervals of 0.8 s of saturating flash from a white halogen lamp of ∼3000 μmol m−2 s−1 [31]. At each actinic light level, minimum fluorescence of light adapted (Fo’) and dark adapted (Fo) leaf, maximum fluorescence of light adapted (Fm’) and dark adapted (Fm) leaf, as well as momentary fluorescence yield (F) were recorded. Furthermore, the following relevant fluorescence parameters: Effective quantum yield (efficiency) of PS II photochemistry (Y(II)), quantum yield of regulated energy dissipation (Y(NPQ)), Stern-Volmer type non-photochemical fluorescence quenching (NPQ), coefficient of non-photochemical quenching (qN), coefficient of photochemical quenching (qP), coefficient of photochemical fluorescence quenching assuming interconnected PS II antennae (qL) and electron transport rate (ETR) were calculated by the following equations:
  • Y(II) = (Fm’ − F)/Fm’ [36]
  • Y(NPQ) = F/Fm’ [37]
  • NPQ = (Fm/Fm’) − 1 [38]
  • qN = 1− ((Fm − Fo’)/(Fm − Fo)) [39] as formulated by van Kooten & Snel [40]
  • qP = (Fm’ − F)/(Fm’ − Fo’) [39] as formulated by van Kooten & Snel [40]
  • qL = qP × (Fo’/F) [41]
  • ETR = PAR × 0.84× 0.5× Y(II) [42]

2.6. Statistical Analyses

Statistical analyses of chlorophyll a fluorescence, biometrical and anatomical traits were performed using Statistica (Version 13, Tulsa, OK, USA) [43] for Windows. For chlorophyll a fluorescence parameters, the two-way repeated measures ANOVA was performed to detect differences among the half-sib lines under wet and drought conditions for different dependent variables. A two-way repeated measures ANOVA compares the values in the different parameter across both of the variables, as well as examining the interaction between them. Before approaching the ANOVA, the assumptions of sphericity were tested for each parameter. Mauchly’s test indicates that the assumption of sphericity had been violated, for all effects in all seven measured parameters; therefore, degrees of freedom were corrected using Greenhouse-Geisser estimates of sphericity (Supplementary Materials Table S3). Furthermore, the rapid light curves of chlorophyll a fluorescence parameters were shown in a graph constructed using the logarithmic function of the software Statistica (Version 13, Tulsa, OK, USA) [43]. As for biometrical and anatomical traits, for each dependent variable, Shapiro–Wilk’s was performed to analyse normality of distribution [44]. To assess the differences between the half-sib lines, one-way ANOVA was applied, followed by Dunkan’s multiple range test. For better visualisation of these data, the above-mentioned traits were shown in the form of a boxplot diagram created in Statistica (Version 13, Tulsa, OK, USA) [43].

3. Results

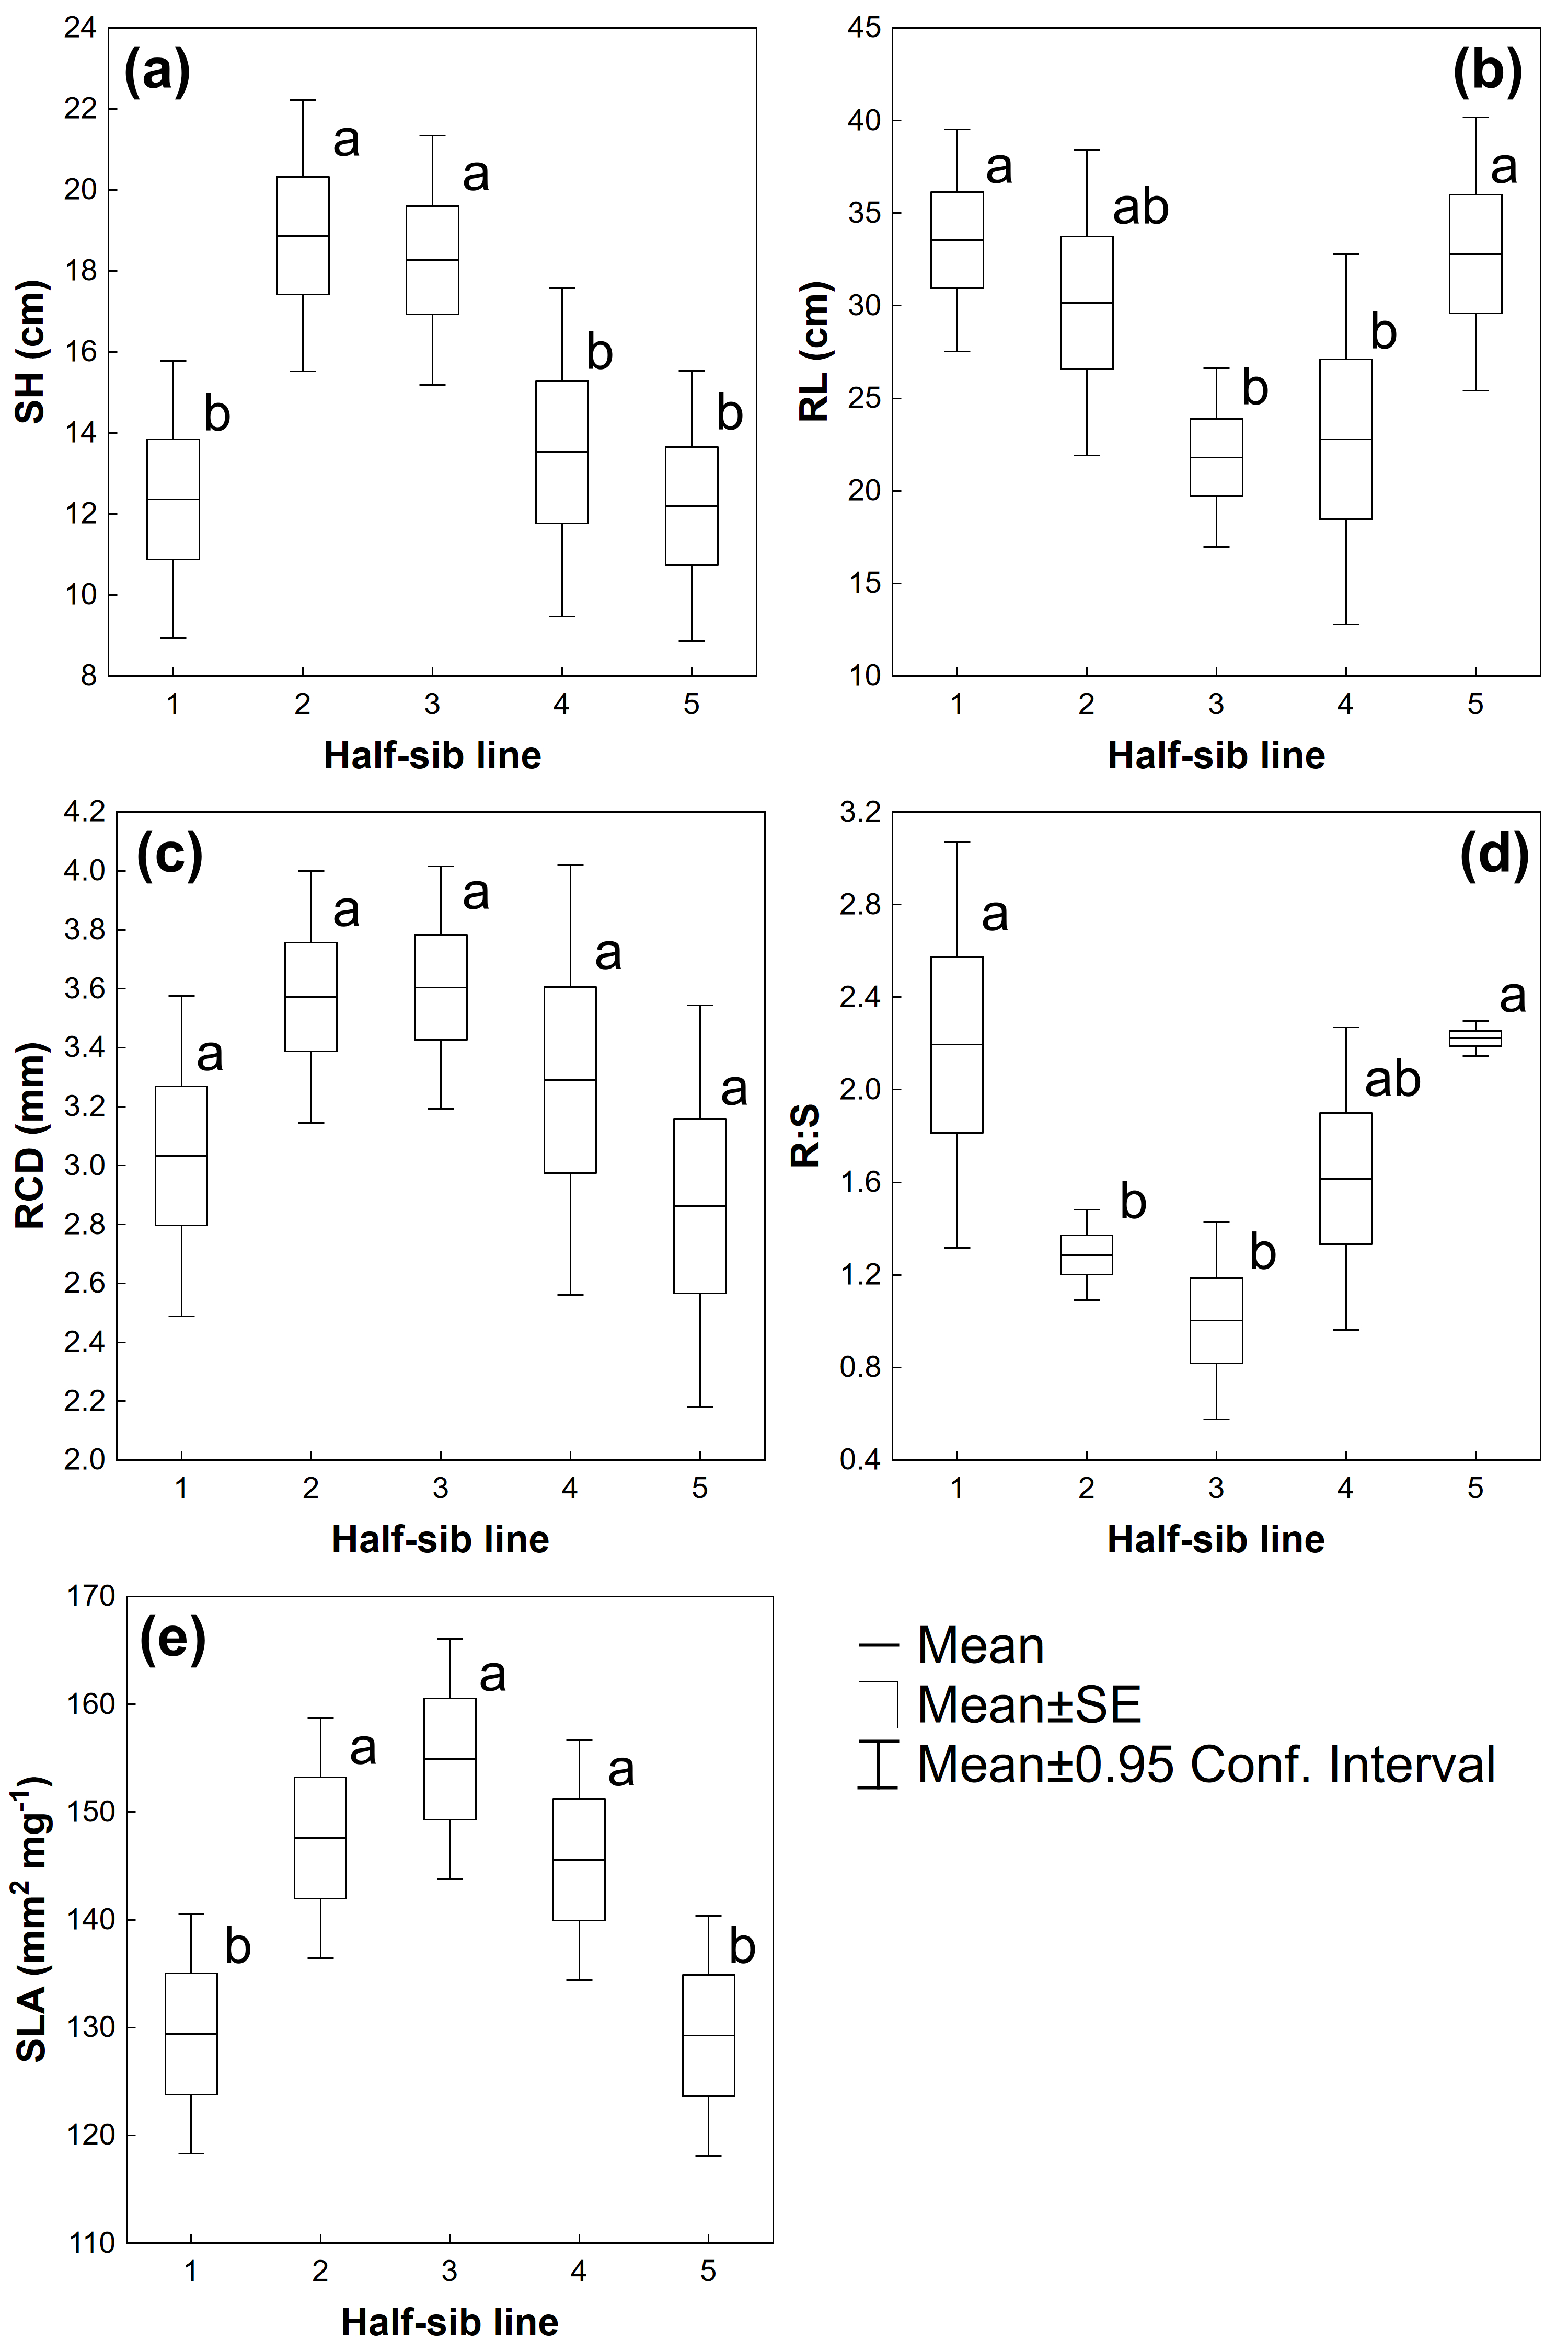
3.1. Biometrical Traits
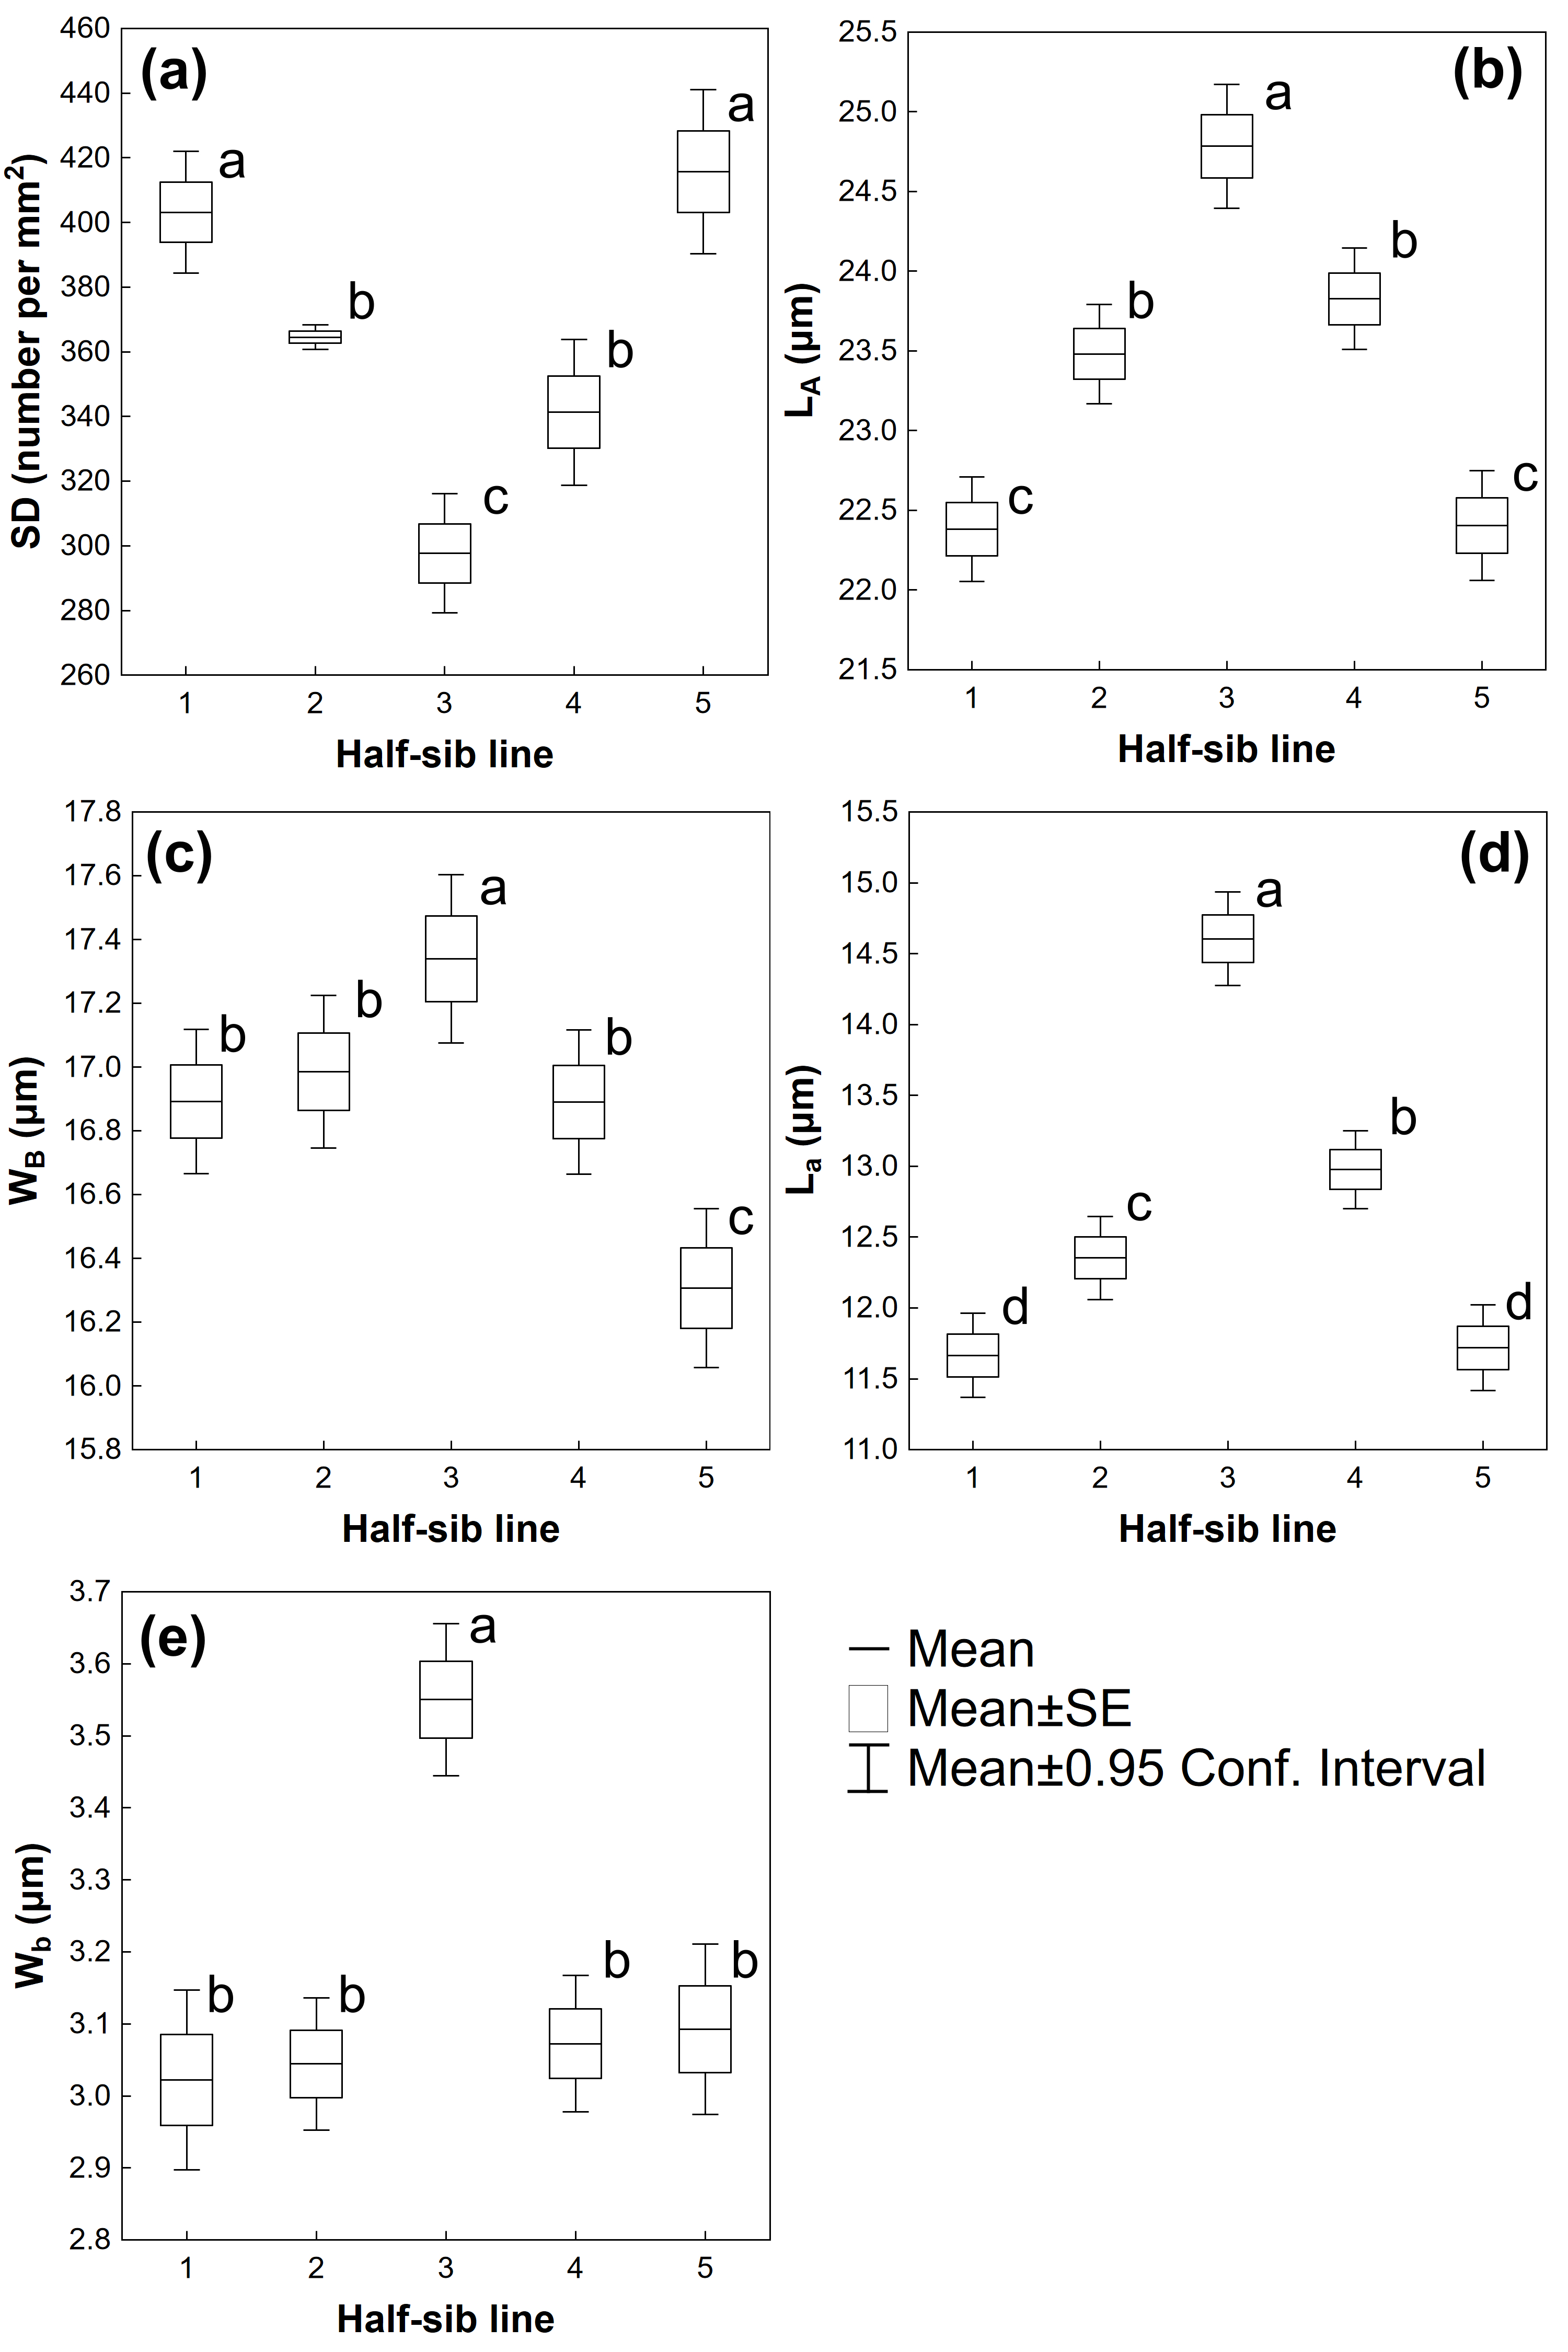
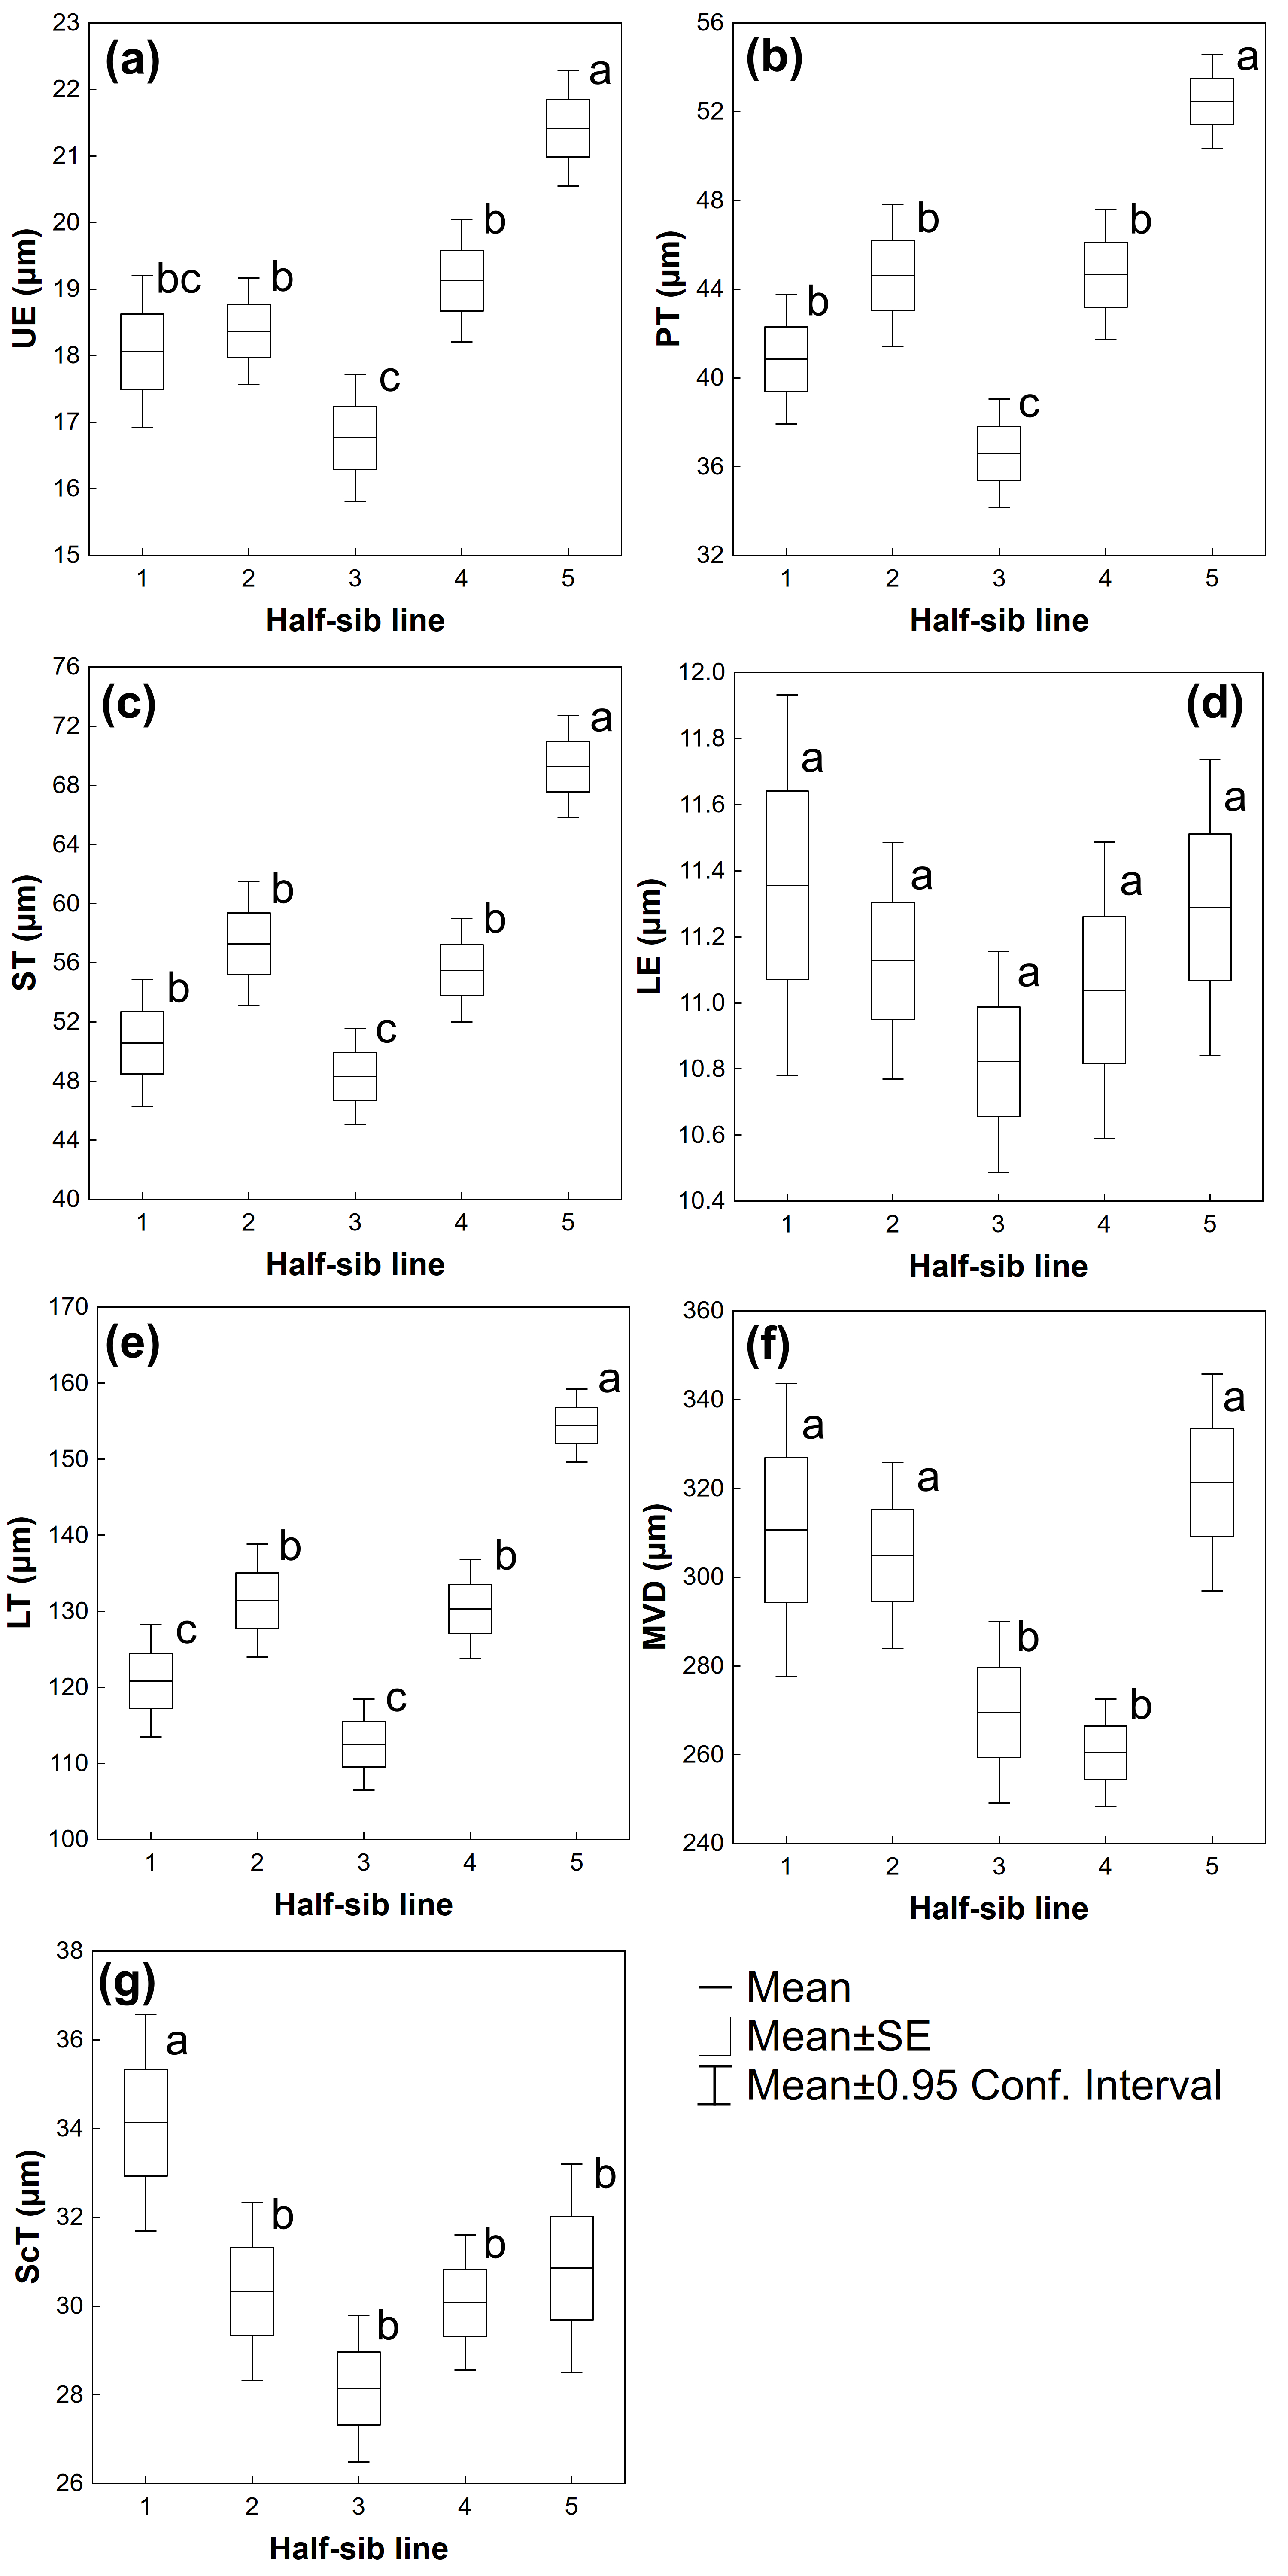
The one-way ANOVA showed statistically significant differences between the studied half-sib lines for all observed biometrical traits, except for RCD (Table 2). Half-sib lines 2 and 3 (18.87 ± 4.36 cm and 18.27 ± 4.00 cm) exhibited significantly higher values of SH (F = 4.7145, p ≤ 0.01) in comparison to half-sib lines 1, 4 and 5 (12.37 ± 4.45, 13.53 ± 5.28 and 12.20 ± 4.34 cm, respectively) (Figure 2a). RL parameter, on the other hand, showed an opposite ranking, with the highest values in half-sib lines 1 and 5 (33.53 ± 7.80 and 32.80 ± 9.60 cm) belonging to the same homogenous group. Furthermore, half-sib line 2 (30.15 ± 10.73 cm) was ranked in the intermediate group, whereas half-sib lines 3 and 4 (21.80 ± 6.29 cm and 22.79 ± 12.99 cm) formed the significantly lowest group (F = 2.9197, p ≤ 0.05) (Figure 2b). A similar trend was observed for R:S parameters, with half-sib lines 1 and 5 (2.19 ± 1.14 and 2.22 ± 0.10) having the highest values (F = 5.4992, p ≤ 0.01) and belonging to the same homogenous group, half-sib line 4 having the intermediate values (1.16 ± 0.85), while half-sib lines 2 and 3 (1.29 ± 0.25 and 1.00 ± 0.55) were grouped in the same, significantly lower group (Figure 2d). Concerning the SLA, half-sib lines 2, 3 and 4 (148.06 ± 19.80, 154.94 ± 19.81 and 145.55 ± 31.97 mm2 mg−1) had significantly higher values (F = 4.1857, p ≤ 0.01) in comparison to half-sib lines 1 and 5 (128.20 ± 37.77 and 129.24 ± 32.43 mm2 mg−1) (Figure 2e).

3.2. Leaf Traits

The present study evidenced statistically significant differences between the five half-sib lines for all observed stomatal traits (Table 3). In the case of SD, half-sib lines were formed in four homogenous groups, with half-sib lines 1 and 5 (403.18 ± 62.73, 415.67 ± 84.55 mm2) creating the first group. Furthermore, half-sib lines 2 and 4 (364.19 ± 12.54, 341.29 ± 74.85 mm2) had statistically lower values (F = 24.905, p ≤ 0.001) and formed the second group, whilst half-sib line 3 had the lowest value (297.67 ± 61.26 mm2) and, consequently, ranked in the third homogenous group (Figure 3a). The values of LA were the highest in half-sib line 3 (24.78 ± 2.95 μm), statistically lower (F = 34.836, p ≤ 0.001) in half-sib lines 2 and 4 (23.48 ± 2.37 and 23.83 ± 2.42 μm), and the lowest in half-sib lines 1 and 5 (22.38 ± 2.50 and 22.40 ± 2.62 μm) (Figure 3b). Similarly, half-sib line 3 (17.34 ± 2.01 μm) had the highest value of WB, half-sib line 1, 2 and 4 (16.89 ± 1.72, 16.99 ± 1.82, 16.89 ± 1.72 μm) significantly lower (F = 9.1665, p ≤ 0.001), while half-sib line 5 (16.31 ± 1.90 μm) exhibited the lowest value of the above-mentioned parameter (Figure 3c). In the case of La, a reverse ranking to SD was observed with half-sib line 3 (14.60 ± 2.51 μm) having the highest value, whereas half-sib lines 2 and 4 (12.35 ± 2.23 and 12.98 ± 2.09 μm) had statistically lower values (F = 63.292, p ≤ 0.001) and grouped separately. Furthermore, half-sib lines 1 and 5 (11.66 ± 2.26 and 11.72 ± 2.29 μm) had the lowest values, creating the third homogenous group (Figure 3d). Concerning the Wb parameter, half-sib line 3 (3.55 ± 0.80 μm) had the highest values, while the rest of the studied half-sib lines, 1, 2, 4 and 5 (3.02 ± 0.95, 3.04 ± 0.70, 3.07 ± 0.72 and 3.09 ± 0.90 μm) exhibited significantly lower values (F = 16.463, p ≤ 0.001) and constituted the second homogenous group (Figure 3e).
Statistically significant differences between the studied half-sib lines were detected for UE, PT, ST, LT and MVD (Table 4). In the case of UE, half-sib line 5 exhibited the highest value (21.42 ± 2.89 μm), while half-sib line 2 and 4 (18.37 ± 2.66 and 19.13 ± 3.07 μm) had significantly lower values (F = 13.988, p ≤ 0.001), forming the second homogenous group (Figure 4a). Half-sib line 3 (16.77 ± 3.19 μm) formed the third homogenous group and half-sib line 1 (18.06 ± 3.56 μm) was ranked as intermediate between the second and the third homogenous groups. Concerning the PT, half-sib line 5 had the highest values (52.45 ± 7.02 μm), half-sib lines 1, 2 and 4 (40.84 ± 9.14, 44.63 ± 10.66 and 44.65 ± 9.79 μm) were significantly lower (F = 18.681, p ≤ 0.001), while half-sib line 3 (36.60 ± 8.17 μm) had the lowest value of the mentioned parameter (Figure 4b). The same ranking was observed for ST, with the highest value in half-sib line 5 (62.26 ± 11.53 μm), and the statistically lowest in half-sib line 3 (48.30 ± 10.83 μm). Half-sib line 5 had the highest value of LT (154.42 ± 16.03 μm), as well, while half-sib line 2 and 4 (131.41 ± 24.64 and 130.31 ± 21.63 μm) was significantly lower (F = 24.500, p ≤ 0.001). Moreover, half-sib line 1 and 3 showed the lowest value of the mentioned parameter (120.84 ± 23.03 and 112.49 ± 19.88 μm), forming the third homogenous group (Figure 4c). Half-sib lines 1, 2 and 5, with the highest values of MVD (310.61 ± 101.88, 304.85 ± 69.83 and 321.34 ± 81.24 μm), were ranked in the first homogenous group, while half-sib lines 3 and 4 (269.51 ± 67.24 and 260.41 ± 40.42 μm), with significantly lower values (F = 5.7836, p ≤ 0.001) constituted the second group (Figure 4f). Furthermore, half-sib line 1 exhibited the highest value of ScT (31.13 ± 7.42 μm), while the rest of the studied half-sib lines, 2, 3, 4 and 5 (30.28 ± 6.58, 28.14 ± 5.51, 30.08 ± 5.08 and 30.86 ± 7.82 μm), had significantly lower values (F = 4.4786, p ≤ 0.01), forming the second homogenous group (Figure 4g).

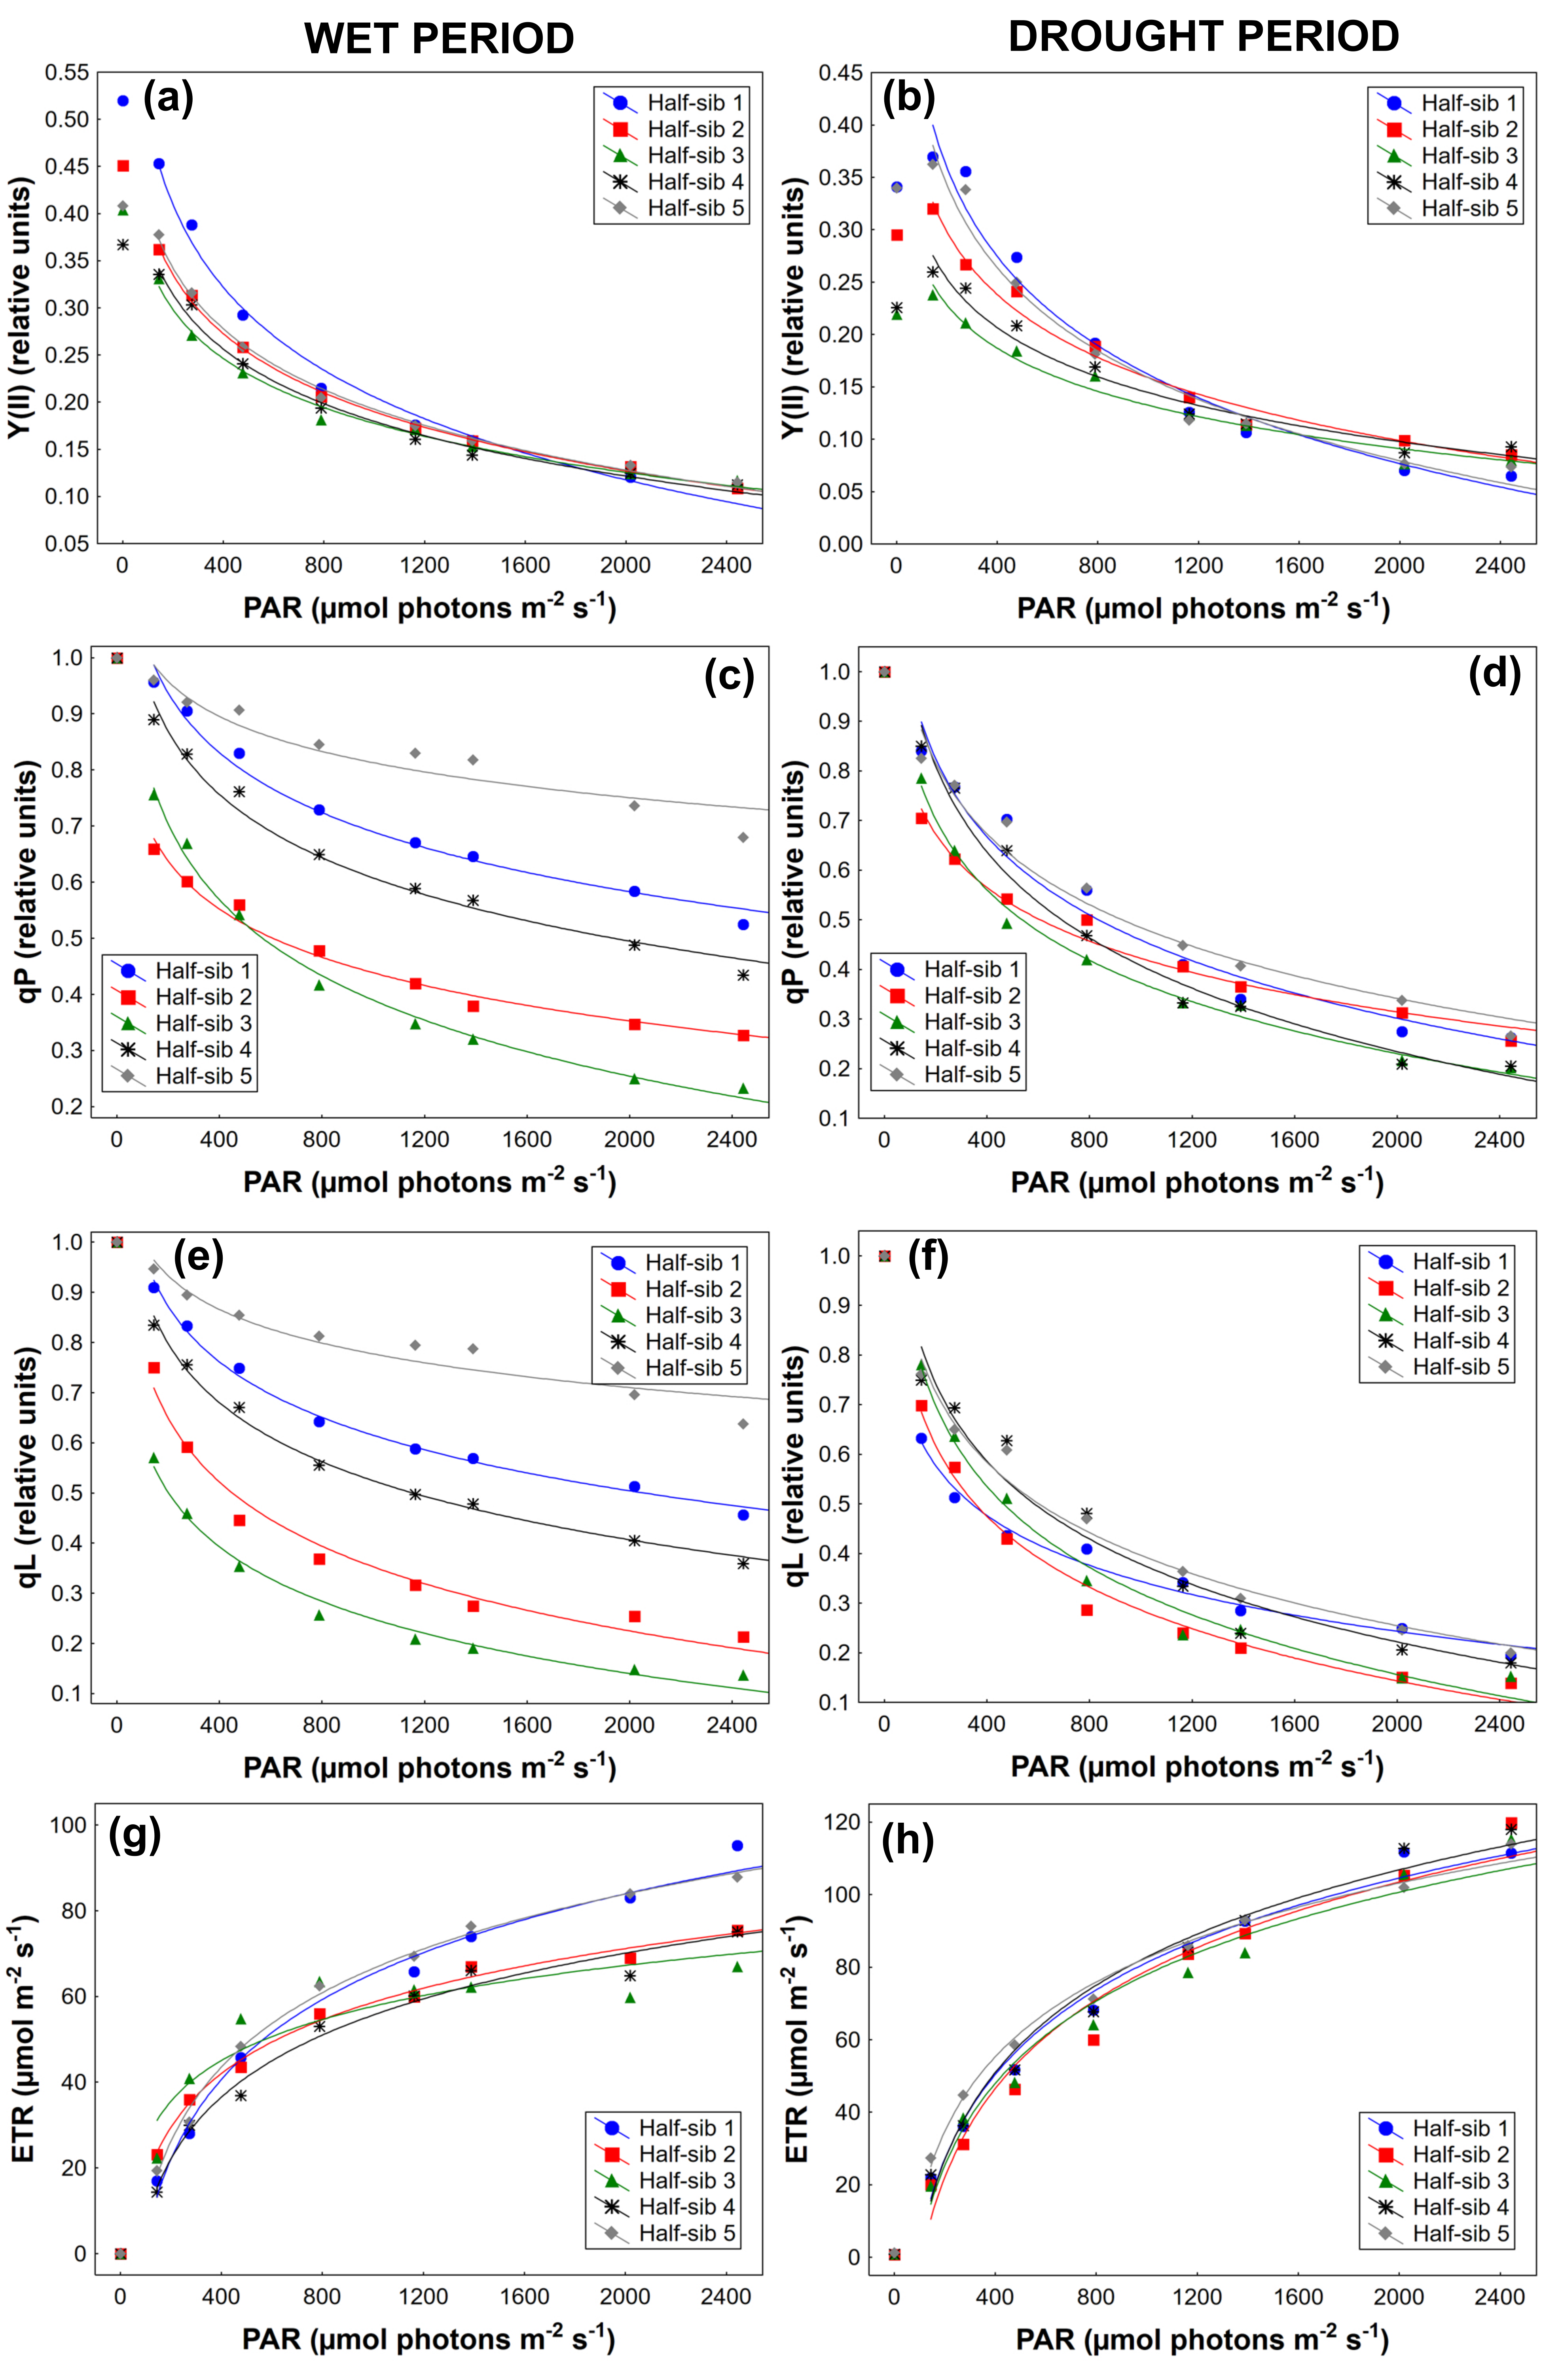
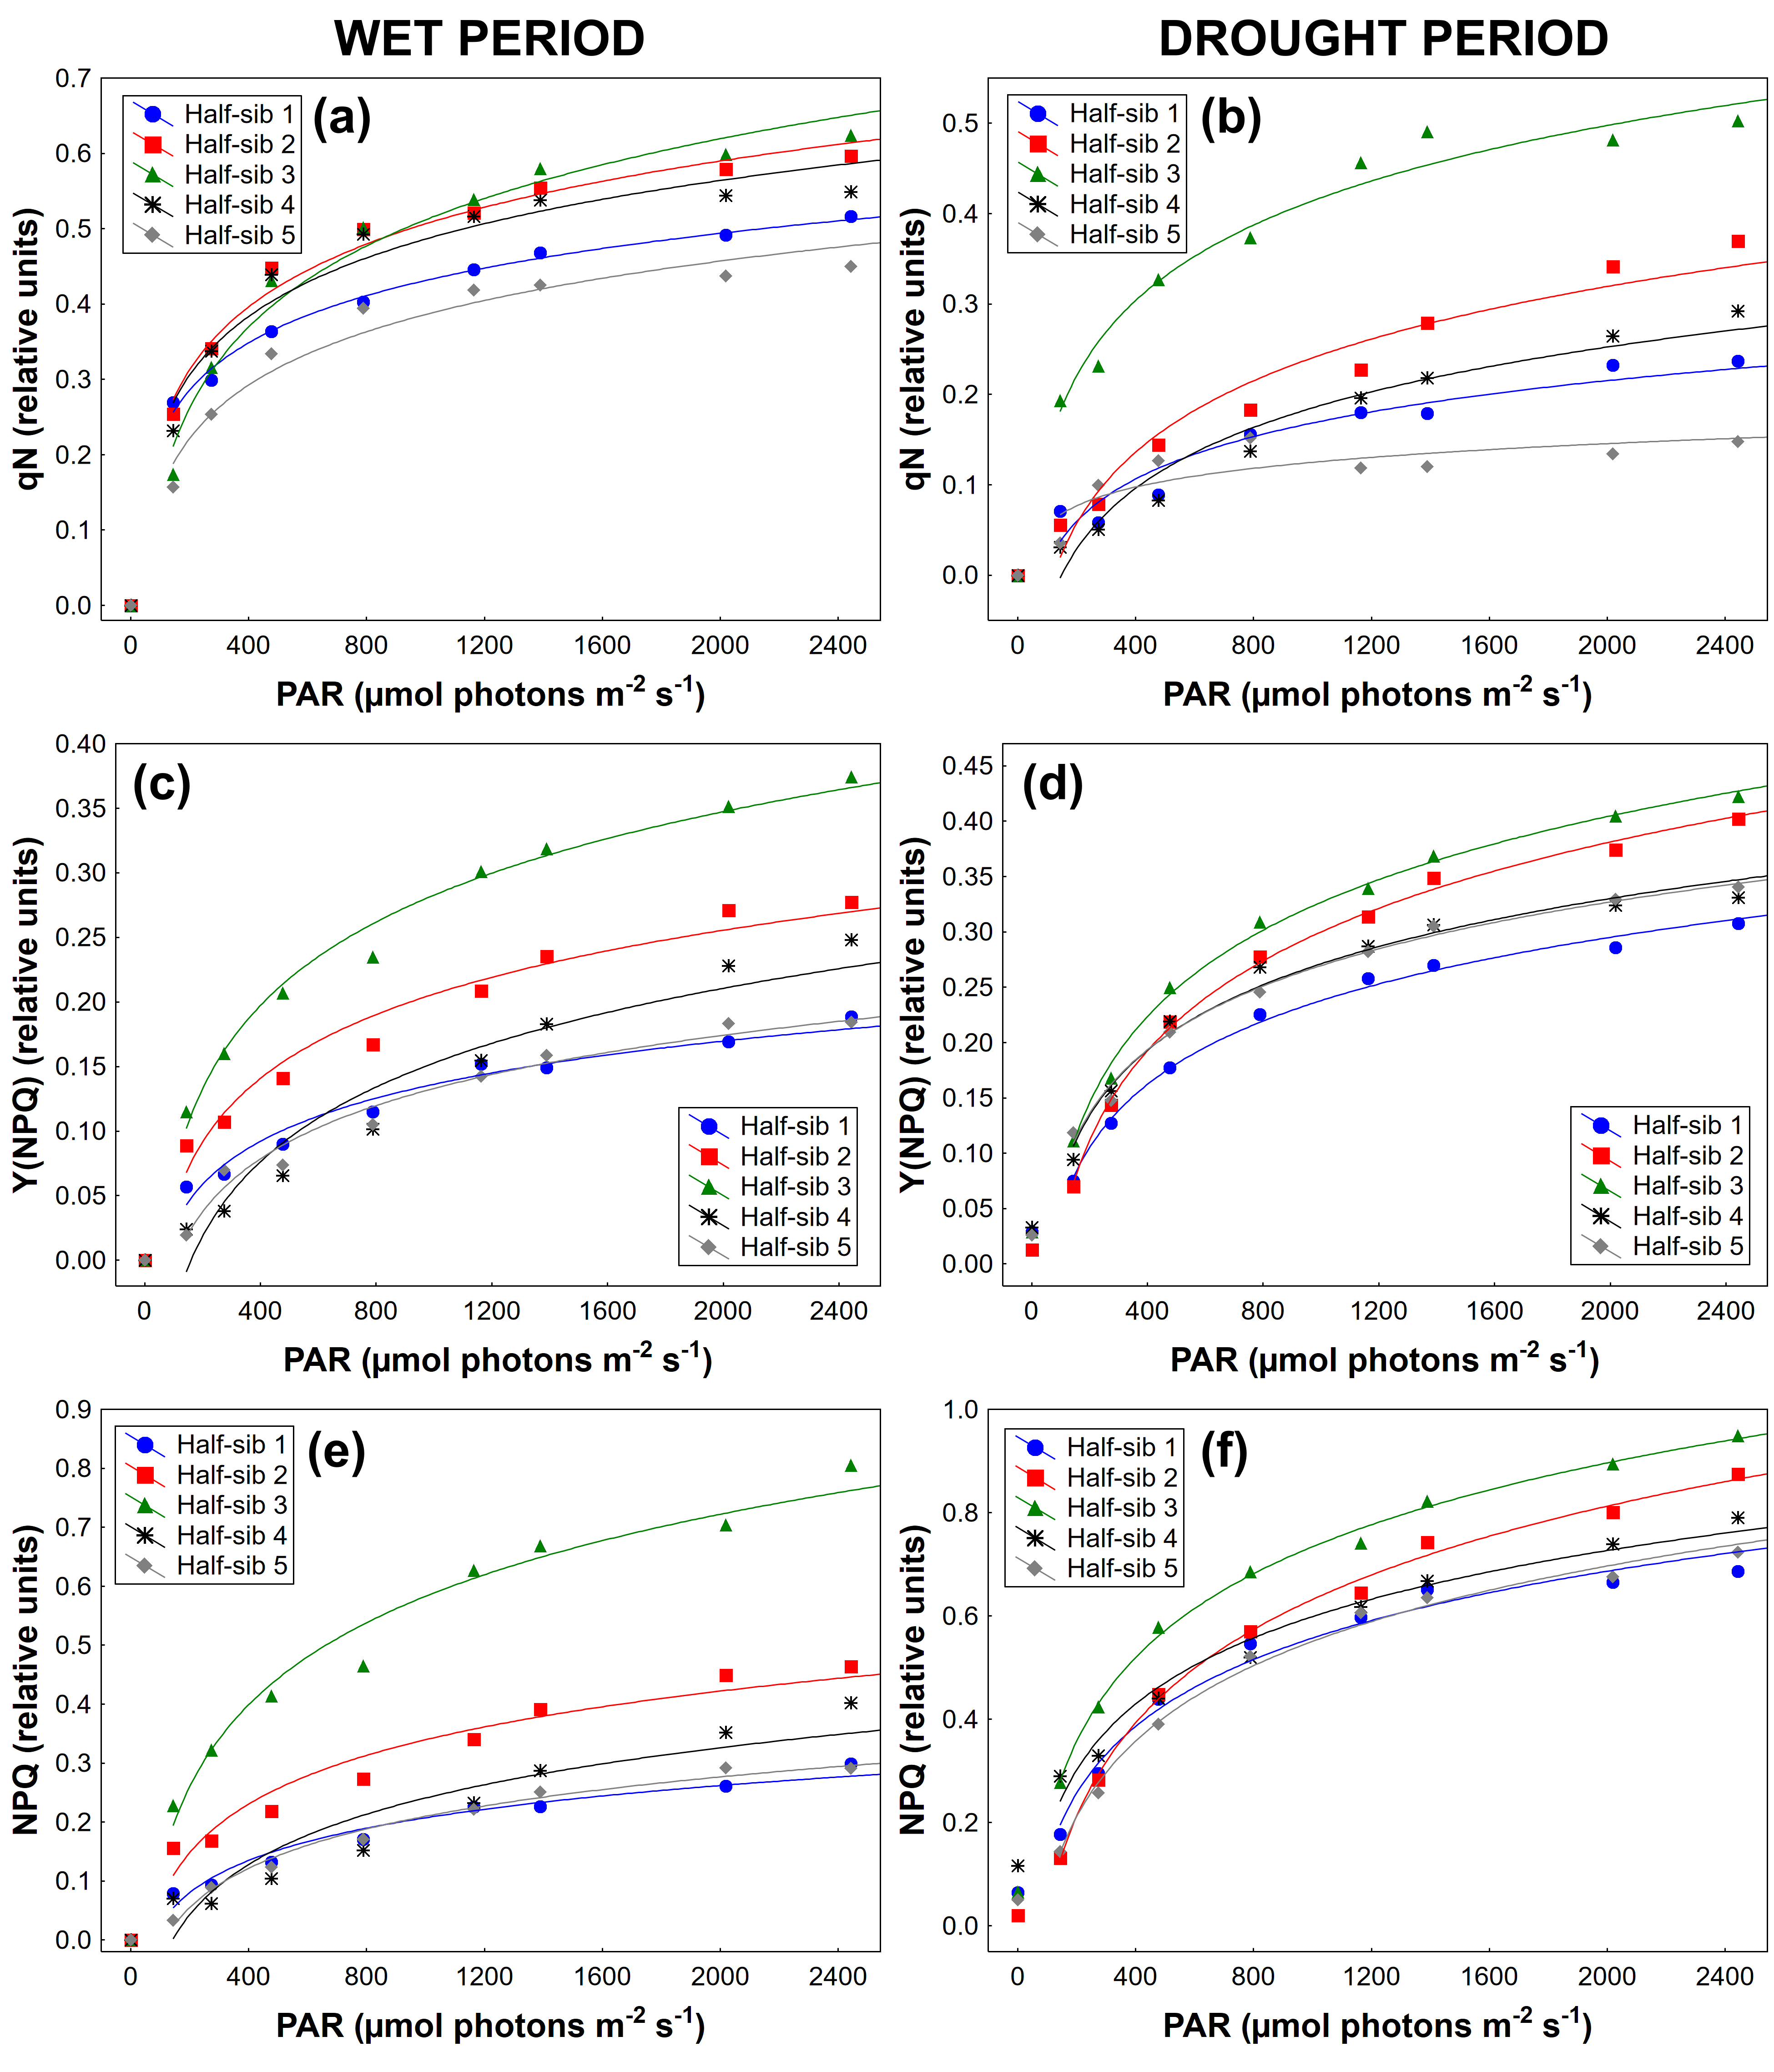
3.3. Chlorophyll a Fluorescence

The two-way repeated measures ANOVA revealed the significant main effect of the measured period (wet and drought) and half-sib lines, as well as the interaction effect on all of the observed parameters of chlorophyll a fluorescence parameters, except for parameter ETR, where only the main effect of the measured period was found (Table 5).
The parameters related to photochemical dissipation of light energy (i.e., Y(II), qP, qL) were reduced in drought conditions in all half-sib lines of Q. robur (Figure 5a–f). Whereas, parameters associated with the heat dissipation of light energy, namely qN, Y(NPQ) and NPQ, showed an overall increasing trend (Figure 6a–f).
Observing the half-sib lines during drought, Y(II) exhibited the highest value in half-sib line 1 until 788 μmol (photon) m−2 s−1, after which it showed the opposite rank. On the other hand, the lowest values of the above-mentioned parameter were detected in half-sib line 3 until 788 μmol (photon) m−2 s−1, as well during the observed drought period (Figure 5b). In the case of Y(NPQ), NPQ and qN, a quite similar shape of RLC was observed, having the highest values in half-sib line 3, and the simultaneous lowest values in half-sib line 1 and line 5 (Figure 6b,d,f).

4. Discussion

4.1. Plant Biometry

As the consequence of severe drought, a series of failures in reforestation programs were reported [45,46] throughout South-Eastern Europe. Therefore, the selection of drought-tolerant Q. robur half-sib lines for future reforestation programs is of key importance in order to maintain the resilience of oaks’ forests. Furthermore, the task of providing suitable reforestation material becomes even more urgent and essential, as climate change is predicted to negatively affect the distribution of Q. robur [47]. In that sense, phenotypic plasticity was recognised as the key capacity of plants to cope with the variability in environmental factors, which can contribute to a reduction of deleterious effects of the environment while increasing the growth and reproduction [48]. However, several studies implied that it might be neutral or even maladaptive in poor environments or if it is costly [49,50].
The observed Q. robur half-sib lines showed high sensitivity to drought through changes of biometrical parameters (SH, RL, R:S, SLA), suggesting the presence of significant adaptation responses (Figure 2a,b,d,e). In terms of SH, statistically significant reductions of 32.3%, 25.9% and 33.2% were observed in half-sib line 1, 4 and 5 in comparison to half-sib line 3. Showing the highest increase in RL (46.3% and 49.5%), half-sib line 1 and 5 were assumed to have the highest adaptation potential among the studied half-sib line. The reduction of SH occurred as the consequence of a shift of the carbon allocation from the shoot towards the roots in drought conditions, which in many studies was followed by the increase in RL [47,51,52]. Although our study highlighted statistically significant effects of drought on RL, its absence was evidenced in the case of RCD. In accordance to our results, Deligöz and Bayar [26] observed the same negligible differences of the mentioned parameter in well-watered, moderate and severe drought-stressed pedunculate oak seedlings. Furthermore, Wu et al. [53] demonstrated that only severe and long-lasting drought caused a statistically significant reduction in RCD of Q. variabilis seedlings. Therefore, it might be assumed that RCD is a rather less suitable biometrical parameter for the detection of adaptation potential in terms of short-lasting drought periods.
The highest adaptation potential to drought was observed in half-sib line 5 and line 1, and drought vulnerability of half-sib line 2 and 3 through root to shoot ratio biomass partitioning, as well. In accordance to our finding, drought was evidenced to affect R:S biomass partitioning [54,55], allowing the assessment of plants avoidance potential [56]. Indeed, the low water supply increases the R:S ratio in plants [57,58,59], namely as the sensitivity response of the shoot and root system to endogenous ABA or likely a result of a greater osmotic adjustment of roots [60]. Furthermore, its increase is closely related to a higher proportion of dry matter in the roots, as well as with a higher soluble sugar transfer from the shoot to its root system [61].
Observing SLA, the most expressed adaptation was detected in half-sib line 1 and 5, which maintained low values of this trait, to act against constrained water availability with smaller and thicker leaves by reducing water loss [62,63]. Under drought, the reduction of the above-mentioned parameter was observed to be an important adaptation mechanism of temperate species, as demonstrated for Quercus petrea [64] and Fagus sylvatica [65].

4.2. Leaf Traits

SD, together with the size of stomata, play a crucial role in the regulation of the physiological process of the leaf gas exchange between the plants’ leaf and its surrounding atmosphere [66]. In the present study, half-sib line 1 and line 5 exhibited the highest SD coupled with small sized LA, WB, La and Wb. The increase in SD and a decrease in stomata size are shown to respond faster to environmental changes, such as drought, contributing to less water loss and a higher survival rate under the forthcoming climate change [67,68]. Highly sensitive to even a slight change of environment, i.e., mild to moderate drought, stomata movement, the closure and opening, regulates the water vapour and CO2 between internal plant tissues and the surrounding atmosphere [69]. In such conditions, resulting from the imbalanced water status in plants along with the synthesis of abscisic acid, stomata guard cells become flaccid, leading to the overall closure of stomata [70]. Stomata closing was evidenced to cause a further chain of reactions reflected in the plants’ physiological and morphological responses. In that term, a decrease in photosynthesis [71], reduction and disturbance of photosynthetic pigments was detected, which leads to an overall reduction of plant biomass and productivity [72]. On the other hand, long-term and severe droughts were found to induce rather non-stomatal inhibition of photosynthesis in oak, ash and beech [73,74] attributed to the reduced mesophyll conductance, photochemical or enzymatic limitations [75]. In the case of the present study, values of UE, PT, ST and LT were high in half-sib line 5, coupled with high MVD and low ScT values (Figure 4), indicating drought resistance through leaf adaptation [76,77,78]. On the other hand, half-sib line 3 was shown to be the most suspectable to drought, as it exhibited the statistically significant lowest values of UE, PT, ST, LT. Leaf anatomical traits resulted as a good tool to select drought tolerance due to the low susceptibility to changes of habitat characteristics [79], such as in cases of selection of olive cultivars [76], Eucalyptus clones [80], various shrubs [81] and even various tree species [82]. However, our results found an absence of statistically significant differences for LE between the studied half-sib lines, suggesting that this trait was not efficient to define the drought adaptions (as observed by Stojnić et al. [34] in Fagus sylvatica provenances).
In order to cope with drought conditions, plants adopt morphological adaptation strategies by altering anatomical structure [83,84]. These processes are surely involved in physiological mechanisms to prevent water loss in the process of transpiration, such as stomata closure [85,86]. Further investigations, by combining structural adaptation and physiological responses to environmental constraints allow assessing the induction of overall reduction of plant biomass and productivity [72], such as in maintaining the plants’ vitality and functioning during conditions of water shortage.

4.3. Chlorophyll a Fluorescence

The reduction of parameters associated with the photochemical dissipation of light energy coupled with the increase in ones related to the heat dissipation during drought suggested that half-sib lines 1, 4 and 5 obtained their capacity to regulate dissipation of light energy, despite this stressful environmental condition. This phenomenon might be related to the xanthophyll’s cycle that gives off the excess electrons, produced by the increase in light intensity in the chloroplasts [87].
Our results revealed high values of NPQ, demonstrating drought effects on chlorophyll fluorescence. The increase in NPQ as a response to drought is one of the most important short-term and reversible mechanisms of higher plants to cope with the disturbances and irregularities of their habitat [88,89]. Similar results were obtained by other authors for the drought period as well [90,91,92]. Namely, the underlying process of this mechanism starts with a closure of stomata under low water conditions in order to limit the CO2 availability in the chloroplast, to reduce the net photosynthesis and the ratio of CO2 and O2.
The combined effects of Fm’ and NPQ, such as the decrease in Fm’ and the increase in NPQ, reflect the energy dissipation through the xanthophyll cycle in order to maintain levels of photosynthesis and provide an estimation of stress condition of plants [93]. Responses of Q. robur seedlings coupling NPQ with qL and qP in drought conditions, by increasing NPQ and decreasing qP, might be the result of unchanged reaction centre density in combination with a strong reduction in photosynthetic capacity [94]. Moreover, a decrease in qP induced by drought in beech seedlings explained a reduction in the rate of consumption of reluctance and ATP [95].
Half-sib lines 1 and line 5 showed tolerance to potential light-induced damages, showing high values of Y(II), qP, ETR and a simultaneously low value of NPQ (as also observed by Gu et al. [96]). Regarding ETR, it decreased under drought in all half-sib lines at different PAR, highlighting a high efficiency for changeover of photon-electron combined with low qN, which resulted in lower losses of energy. The reduction of the energy losses is a highly relevant response that allows to guarantee and improve plant production [97]. Furthermore, our results identified high susceptibility to drought of half-sib line 3. All studied chlorophyll a fluorescence parameters associated with the heat dissipation of light energy (qN, Y(NPQ), NPQ) and one parameter related to the photochemical dissipation of light energy (Y(II)) resulted in a useful tool for the selection of drought-tolerant half-sib lines of oak from South-Eastern Europe in field trials that can be used in breeding programs for the assessment of plant responses to the environment [94,98,99,100].

5. Conclusions

Adaptation mechanisms to drought, detectable through biometrical traits, leaf anatomy and chlorophyll fluorescence, highlighted tolerant and susceptible behaviour in five different Q. robur L. half-sib lines grown in a field trial. In detail, half-sib line 5 was assessed as potentially tolerant and half-sib line 3 as susceptible to drought induced stress.
Furthermore, the present study noted high detrimental values of biometrical traits (SH, RL, R:S and SLA), leaf stomatal traits (SD, LA, WB, La, Wb) and leaf structural traits (UE, PT, ST, LT, MVD) in detection of drought tolerance in sib lines of Q. robur. Whereas, chlorophyll a fluorescence parameters were effective in detection of short-term and severe drought. However, qP, qL and ETR were less suited for the detection of differences between the five half-sib lines in drought conditions. The leaf anatomy and chlorophyll fluorescence under drought demonstrate that leaf traits greatly influence the sensitivity of photosynthetic processes, i.e., primary photochemical processes of PSII for plants. Therefore, the importance of the selection of Q. robur half-sib lines for future reforestation programs, as well as in the protected areas, is high where forests are subjected to special forest managements and particularly sensitive to predicted forthcoming climate conditions. Further studies should be conducted in order to estimate the effect of recovery on Q. robur genotypes after a naturally occurring drought period. Facing the impacts of drought on forested ecosystems, the resilience of forest stands remains the key to environmental protection.

Supplementary Materials

The following are available online at https://0-www-mdpi-com.brum.beds.ac.uk/1999-4907/11/2/153/s1, Table S1: Harmonised protocol for evaluation of plus trees of keystone riparian tree species in the field (Oak, Ash, Alder, Poplar, Elm) developed within the DANUBE Interreg project: “Resilient riparian forests as ecological corridors in the Mura-Drava-Danube Biosphere Reserve (REFOCuS), Table S2: Biometric data and coordinates of the chosen mother trees, Table S3: Descriptive Statistics, Mauchly’s Test of Sphericity, Tests of Within- and Between- Subjects Effects and Estimated Marginal Means of chlorophyll a fluorescence parameters.

Author Contributions

S.O. and S.S. conceived the ideas and designed the experiment. E.V. performed the measurement of chlorophyll a fluorescence, E.V. and L.K. collected the samples of leaves for anatomical analysis and measured the biometrical traits of seedlings. M.K., S.S. and E.V. conducted the statistical analysis. E.V. and C.C. wrote the first version of the manuscript, while all of the authors contributed critically to the drafts and gave the final approval for publication. All authors have read and agreed to the published version of the manuscript.

Acknowledgments

This paper was written as a part of the project “Biosensing Technologies and Global System for Long-Term Research and Integrated Management of Ecosystems” (III43002) financed by the Ministry of Education, Science and Technological Development of the Republic of Serbia within the framework of integrated and interdisciplinary research. Furthermore, the present study was supported by Collegium Talentum 2019 scholarship for Hungarian talents beyond the border. The authors would like to express their gratitude to Vastag Tamás and Szabó Éva for providing help during measurements of chlorophyll a fluorescence.

Conflicts of Interest

The authors declare no conflict of interest.

References

  1. Zhu, J.K. Abiotic stress signaling and responses in plants. Cell 2016, 167, 313–324. [Google Scholar] [CrossRef] [Green Version]
  2. Fahad, S.; Bajwa, A.A.; Nazir, U.; Anjum, S.A.; Farooq, A.; Zohaib, A.; Sadia, S.; Nasim, W.; Adkins, S.; Saud, S.; et al. Crop production under drought and heat stress: Plant responses and management options. Front Plant Sci. 2017, 8, 1–16. [Google Scholar] [CrossRef] [Green Version]
  3. Lehner, F.; Deser, C.; Sanderson, B.M. Future risk of record-breaking summer temperatures and its mitigation. Clim. Chang. 2018, 146, 363–375. [Google Scholar] [CrossRef] [Green Version]
  4. Lobell, D.B.; Schlenker, W.; Costa-Roberts, J. Climate trends and global crop production since 1980. Science 2011, 333, 616–620. [Google Scholar] [CrossRef] [Green Version]
  5. Lindner, M.; Fitzgerald, J.B.; Zimmermann, N.E.; Reyer, C.; Delzon, S.; van der Maaten, E.; Schelhaas, M.J.; Lasch, P.; Eggers, J.; van der Maaten-Theunissen, M.; et al. Climate change and European forests: What do we know, what are the uncertainties, and what are the implications for forest management? J. Environ. Manag. 2014, 146, 69–83. [Google Scholar] [CrossRef] [PubMed] [Green Version]
  6. Allen, C.D.; Macalady, A.K.; Chenchouni, H.; Bachelet, D.; McDowell, N.; Vennetier, M.; Kitzberger, T.; Rigling, A.; Breshears, D.D.; Hogg, E.H.; et al. A global overview of drought and heat-induced tree mortality reveals emerging climate change risks for forests. For. Ecol. Manag. 2010, 259, 660–684. [Google Scholar] [CrossRef] [Green Version]
  7. Martínez-Vilalta, J.; Lloret, F.; Breshears, D.D. Drought-induced forest decline: Causes, scope and implications. Biol. Lett. 2011, 8, 689–691. [Google Scholar] [CrossRef] [PubMed]
  8. Ivetić, V.; Aleksić, J.M. Response of rare and endangered species Picea omorika to climate change: The need for speed. Reforesta 2016, 1, 81–89. [Google Scholar] [CrossRef] [Green Version]
  9. Živanović, S. Impact of drought in Serbia on fire vulnerability of forests. Int. J. Bioautomat. 2017, 21, 217–226. [Google Scholar]
  10. Clark, J.S.; Iverson, L.; Woodall, C.W.; Allen, C.D.; Bell, D.M.; Bragg, D.C.; D’Amato, A.; Davis, F.W.; Hersh, M.H.; Ibanez, I.; et al. The impacts of increasing drought on forest dynamics, structure, and biodiversity in the United States. Global Chang. Biol. 2016, 22, 2329–2352. [Google Scholar] [CrossRef] [Green Version]
  11. Čehulić, I.; Sever, K.; Katičić Bogdan, I.; Jazbec, A.; Škvorc, Ž.; Bogdan, S. Drought impact on leaf phenology and spring frost susceptibility in a Quercus robur L. provenance trial. Forests 2019, 10, 50. [Google Scholar] [CrossRef] [Green Version]
  12. Annighöfer, P.; Beckschäfer, P.; Vor, T.; Ammer, C. Regeneration patterns of European oak species (Quercus petraea (Matt.) Liebl., Quercus robur L.) in dependence of environment and neighborhood. PLoS ONE 2015, 10, e0134935. [Google Scholar]
  13. Thomas, F.M.; Gausling, T. Morphological and physiological responses of oak seedlings (Quercus petraea and Q. robur) to moderate drought. Ann. For. Sci. 2000, 57, 325–333. [Google Scholar] [CrossRef] [Green Version]
  14. Thomas, F.M. Recent advances in cause-effect research on oak decline in Europe. CAB Rev. Perspect. Agricul. Vet. Sci. Nutr. Nat. Res. 2008, 3, 1–12. [Google Scholar] [CrossRef]
  15. Drekić, M.; Poljaković-Pajnik, L.; Orlović, S.; Kovačević, B.; Vasić, V.; Pilipović, A. Results of multiannual monitoring of tree crown condition. Poplar 2014, 193/194, 23–35. [Google Scholar]
  16. Mikac, S.; Žmegač, A.; Trlin, D.; Paulić, V.; Oršanić, M.; Anić, I. Drought-induced shift in tree response to climate in floodplain forests of Southeastern Europe. Sci. Rep. 2018, 8, 16495. [Google Scholar] [CrossRef]
  17. Fotelli, M.N.; Radoglou, K.M.; Constantinidou, H.I.A. Water stress responses of seedlings of four Mediterranean oak species. Tree Physiol. 2000, 20, 1065–1075. [Google Scholar] [CrossRef] [Green Version]
  18. Guo, Y.; Yu, H.; Kong, D.; Yan, F.; Liu, D.; Zhang, Y. Effects of gradual soil drought stress on the growth, biomass partitioning, and chlorophyll fluorescence of Prunus mongolica seedlings. Turk. J. Biol. 2015, 39, 532–539. [Google Scholar] [CrossRef] [Green Version]
  19. Li, J.; Cang, Z.; Jiao, F.; Bai, X.; Zhang, D.; Zhai, R. Influence of drought stress on photosynthetic characteristics and protective enzymes of potato at seedling stage. J. Saudi. Soc. Agric. Sci. 2017, 16, 82–88. [Google Scholar] [CrossRef] [Green Version]
  20. Kramer, D.M.; Evans, J.R. The importance of energy balance in improving photosynthetic productivity. Plant Physiol. 2011, 155, 70–78. [Google Scholar] [CrossRef] [Green Version]
  21. Stojnić, S.; Trudić, B.; Galović, V.; Šimunovački, Đ.; Đorđević, B.; Rađević, V.; Orlović, S. Conservation of pedunculate oak (Quercus robur L.): Genetic resources at the territory of public enterprise ’Vojvodinašume’. Poplar 2014, 193/194, 47–71. [Google Scholar]
  22. Gentilesca, T.; Camarero, J.J.; Colangelo, M.; Nole, A.; Ripullone, F. Drought-induced oak decline in the western Mediterranean region: An overview on current evidences, mechanisms and management options to improve forest resilience. iForest 2017, 10, 796–806. [Google Scholar] [CrossRef] [Green Version]
  23. Arend, M.; Kuster, T.; Günthardt-Goerg, M.S.; Dobbertin, M. Provenance-specific growth responses to drought and air warming in three European oak species (Quercus robur, Q. petraea and Q. pubescens). Tree Physiol. 2011, 31, 287–297. [Google Scholar] [CrossRef] [PubMed] [Green Version]
  24. Bojović, M.; Nikolić, N.; Borišev, M.; Pajević, S.; Horák, R.; Pavlović, L.; Vaštag, E. The effect of drought stress and recovery on pedunculate oak populations grown in semi-controlled conditions. Poplar 2017, 199, 194–207. [Google Scholar]
  25. Vander Mijnsbrugge, K.; Turcsán, A.; Maes, J.; Duchêne, N.; Meeus, S.; Van der Aa, B.; Steppe, K.; Steenackers, M. Taxon-Independent and Taxon-Dependent Responses to Drought in Seedlings from Quercus robur L., Q. petraea (Matt.) Liebl. and Their Morphological Intermediates. Forests 2017, 8, 407. [Google Scholar] [CrossRef] [Green Version]
  26. Deligöz, A.; Bayar, E. Drought stress responses of seedlings of two oak species (Quercus cerris and Quercus robur). Turk. J. Agric. 2018, 42, 114–123. [Google Scholar] [CrossRef]
  27. Aydinşakir, K.; Büyüktaş, D.; Nazmi, D.İ.N.Ç.; Karaca, C. Impact of salinity stress on growing, seedling development and water consumption of peanut (Arachis hypogaea cv. NC-7). Akdeniz Üniversitesi Ziraat Fakültesi Dergisi 2015, 28. [Google Scholar]
  28. Fenner, M.K.; Thompson, K. The Ecology of Seeds; Cambridge University Press: Cambridge, UK; New York, NY, USA, 2005; p. 260. [Google Scholar]
  29. DeEll, J.R.; Toivonen, P.M.A. Practical Applications of Chlorophyll Fluorescence in Plant Biology; Kluwer Academic Publishers: Dordrecht, The Netherlands, 2003; p. 132. [Google Scholar]
  30. Krstić, J.; Orlović, S.; Galić, Z.; Pilipović, A.; Stojnić, S. Seasonal changes in leaf gas exchange parameters in Platanus acerifolia Willd. and Acer pseudoplatanus L. seedlings on undeveloped alluvial soil (fluvisol). Forestry 2014, 1–2, 163–178. [Google Scholar]
  31. Pšidová, E.; Živčák, M.; Stojnić, S.; Orlović, S.; Gömöry, D.; Kučerová, J.; Ditmarováa, L.; Střelcovád, K.; Brestič, M.; Kalaji, H.M. Altitude of origin influences the responses of PSII photochemistry to heat waves in European beech (Fagus sylvatica L.). Environ. Exp. Bot. 2018, 152, 97–106. [Google Scholar] [CrossRef]
  32. Bai, T.; Li, C.; Li, C.; Liang, D.; Ma, F. Contrasting hypoxia tolerance and adaptation in Malus species is linked to differences in stomatal behavior and photosynthesis. Physiol. Plant. 2013, 147, 514–523. [Google Scholar] [CrossRef]
  33. Batos, B.; Vilotić, D.; Orlović, S.; Miljković, D. Inter and intra-population variation of leaf stomatal traits of Quercus robur L. in northern Serbia. Arch. Biol. Sci. 2010, 62, 1125–1136. [Google Scholar] [CrossRef]
  34. Stojnić, S.; Orlović, S.; Miljković, D.; Galić, Z.; Kebert, M.; von Wuehlisch, G. Provenance plasticity of European beech leaf traits under differing environmental conditions at two Serbian common garden sites. Eur. J. For. Res. 2015, 134, 1109–1125. [Google Scholar] [CrossRef]
  35. Liu, C.; Liu, Y.; Guo, K.; Fan, D.; Li, G.; Zheng, Y.; Yu, L.; Yang, R. Effect of drought on pigments, osmotic adjustment and antioxidant enzymes in six woody plant species in karst habitats of southwestern China. Environ. Exp. Bot. 2011, 71, 174–183. [Google Scholar] [CrossRef]
  36. Genty, B.; Briantais, J.M.; Baker, N.R. The relationship between the quantum yield of photosynthetic electron transport and quenching of chlorophyll fluorescence. Biochim. Biophys. Acta 1989, 990, 87–92. [Google Scholar] [CrossRef]
  37. Genty, B.; Harbinson, J.; Cailly, A.L.; Rizza, F. Fate of Excitation at PS II in Leaves: The Non-Photochemical Side. In Proceedings of the Third BBSRC Robert Hill Symposium on Photosynthesis, Sheffield, UK, 31 March–3 April 1996. [Google Scholar]
  38. Bilger, W.; Björkman, O. Role of the xanthophyll cycle in photoprotection elucidated by measurements of light-induced absorbance changes, fluorescence and photosynthesis in leaves of Hedera canariensis. Photosynth. Res. 1990, 25, 173–185. [Google Scholar] [CrossRef]
  39. Schreiber, U.; Schliwa, U.; Bilger, W. Continuous recording of photochemical and non-photochemical chlorophyll fluorescence quenching with a new type of modulation fluorometer. Photosynth. Res. 1986, 10, 51–62. [Google Scholar] [CrossRef]
  40. van Kooten, O.; Snel, J. The use of chlorophyll fluorescence nomenclature in plant stress physiology. Photosynth. Res. 1990, 25, 147–150. [Google Scholar] [CrossRef]
  41. Kramer, D.M.; Johnson, G.; Kiirats, O.; Edwards, G.E. New flux parameters for the determination of QA redox state and excitation fluxes. Photosynth. Res. 2004, 79, 209–218. [Google Scholar] [CrossRef]
  42. Xu, F.; Guo, W.; Wang, R.; Xu, W.; Du, N.; Wang, Y. Leaf movement and photosynthetic plasticity of black locust (Robinia pseudoacacia) alleviate stress under different light and water conditions. Acta Physiol. Plant. 2009, 31, 553–563. [Google Scholar] [CrossRef]
  43. TIBCO Software Inc. Statistica (Data Analysis Software System), Version 13; TIBCO Software Inc.: Palo Alto, CA, USA, 2017. [Google Scholar]
  44. Sánchez-Gómez, D.; Robson, T.M.; Gascó, A.; Gil-Pelegrín, E.; Aranda, I. Differences in the leaf functional traits of six beech (Fagus sylvatica L.) populations are reflected in their response to water limitation. Environ. Exp. Bot. 2013, 87, 110–119. [Google Scholar] [CrossRef] [Green Version]
  45. Stojanović, D.B.; Levanič, T.; Matović, B.; Orlović, S. Growth decrease and mortality of oak floodplain forests as a response to change of water regime and climate. Eur. J. For. Res. 2015, 134, 555–567. [Google Scholar] [CrossRef]
  46. Čater, M.; Batič, F. Groundwater and light conditions as factors in the survival of pedunculate oak (Quercus robur L.) seedlings. Eur. J. For. Res. 2006, 125, 419–426. [Google Scholar] [CrossRef]
  47. Stojanović, D.B.; Matović, B.; Orlović, S.; Kržič, A.; Trudić, B.; Galić, Z.; Stojnić, S.; Pekeč, S. Future of the main important forest tree species in Serbia from the climate change perspective. SEEFOR 2014, 5, 117–124. [Google Scholar] [CrossRef] [Green Version]
  48. Gratani, L. Plant phenotypic plasticity in response to environmental factors. Adv. Botany 2014. [Google Scholar] [CrossRef] [Green Version]
  49. Weinig, C. Plasticity versus canalization: Population differences in the timing of shade-avoidance responses. Evolution 2000, 54, 441–451. [Google Scholar] [CrossRef]
  50. Steinger, T.; Roy, B.A.; Stanton, M.L. Evolution in stressful environments II: Adaptive value and costs of plasticity in response to low light in Sinapis arvensis. J. Evol. Biol. 2003, 16, 313–323. [Google Scholar] [CrossRef] [Green Version]
  51. Zida, D.; Tigabu, M.; Sawadogo, L.; Odén, P.C. Initial seedling morphological characteristics and field performance of two Sudanian savanna species in relation to nursery production period and watering regimes. For. Ecol. Manag. 2008, 255, 2151–2162. [Google Scholar] [CrossRef]
  52. Montagnoli, A.; Terzaghi, M.; Di Iorio, A.; Scippa, G.S.; Chiatante, D. Fine-root morphological and growth traits in a Turkey oak stand in relation to seasonal changes in soil moisture in the southern Apennines, Italy. Ecol. Res. 2012, 27, 725–733. [Google Scholar] [CrossRef] [Green Version]
  53. Wu, M.; Zhang, W.H.; Ma, C.; Zhou, J.Y. Changes in morphological, physiological, and biochemical responses to different levels of drought stress in Chinese cork oak (Quercus variabilis Bl.) seedlings. Russ. J. Plant Physiol. 2013, 60, 681–692. [Google Scholar] [CrossRef]
  54. Zhang, X.; Zang, R.; Li, C. Population differences in physiological and morphological adaptations of Populus davidiana seedlings in response to progressive drought stress. Plant Sci. 2004, 166, 791–797. [Google Scholar] [CrossRef]
  55. Montagnoli, A.; Terzaghi, M.; Baesso, B.; Santamaria, R.; Scippa, S.G.; Chiatante, D. Drought and fire stress influence seedling competition in oak forests: Fine-root dynamics as indicator of adaptation strategies to climate change. Reforesta 2016, 1, 86–105. [Google Scholar] [CrossRef] [Green Version]
  56. Riaz, A.; Younis, A.; Taj, A.R.; Karim, A.; Tariq, U.; Munir, S.; Riaz, S. Effect of drought stress on growth and flowering of marigold (Tagetes erecta L.). Pak. J. Bot. 2013, 45, 123–131. [Google Scholar]
  57. Poulos, H.M.; Goodale, U.M.; Berlyn, G.P. Drought response of two Mexican oak species, Quercus laceyi and Q. sideroxyla (Fagaceae), in relation to elevational position. Am. J. Bot. 2007, 94, 809–818. [Google Scholar] [CrossRef] [PubMed] [Green Version]
  58. Vasques, A.; Chirino, E.; Vilagrosa, A.; Vallejo, V.R.; Keizer, J.J. The role of seed provenance in the early development of Arbutus unedo seedlings under contrasting watering conditions. Environ. Exp. Bot. 2013, 96, 11–19. [Google Scholar] [CrossRef]
  59. Brunner, I.; Herzog, C.; Dawes, M.A.; Arend, M.; Sperisen, C. How tree roots respond to drought. Front Plant Sci. 2015, 6, 547. [Google Scholar] [CrossRef] [Green Version]
  60. Samarah, N.; Mullen, R.; Cianzio, S. Size distribution and mineral nutrients of soybean seeds in response to drought stress. J. Plant Nutr. 2007, 27, 815–835. [Google Scholar] [CrossRef]
  61. Xu, W.; Cui, K.H.; Xu, A.H.; Nie, L.X.; Huang, J.L.; Peng, S.B. Drought stress condition increases root to shoot ratio via alteration of carbohydrate partitioning and enzymatic activity in rice seedlings. Acta Physiol. Plant. 2015, 37, 9. [Google Scholar] [CrossRef]
  62. Liu, M.; Wang, Z.; Li, S.; Lü, X.; Wang, X.; Han, X. Changes in specific leaf area of dominant plants in temperate grasslands along a 2500-km transect in northern. China Sci. Rep. 2017, 7, 10780. [Google Scholar]
  63. Kurz Besson, C.; Lobo-do-Vale, R.; Rodrigues, M.L.; Almeida, P.; Herd, A.; Grant, P.M.; Soares, D.T.; Schmidt, M.; Otieno, D.; Keenan, T.F.; et al. Cork oak physiological responses to manipulated water availability in a Mediterranean woodland. Agric. For. Meteorol. 2014, 184, 230–242. [Google Scholar] [CrossRef]
  64. Bruschi, P. Geographical variation in morphology of Quercus petraea (Matt.) Liebl. as related to drought stress. Plant Biosyst. 2010, 144, 298–307. [Google Scholar] [CrossRef]
  65. Liu, J.F.; Arend, M.; Yang, W.J.; Schaub, M.; Ni, Y.Y.; Gessler, A.; Jiang, Z.-P.; Rigling, A.; Li, M.H. Effects of drought on leaf carbon source and growth of European beech are modulated by soil type. Sci. Rep. 2017, 7, 42462. [Google Scholar] [CrossRef] [PubMed] [Green Version]
  66. Holland, N.; Richardson, A.D. Stomatal length correlates with elevation of growth in four temperate species. J. Sustain. For. 2009, 28, 63–73. [Google Scholar] [CrossRef]
  67. Drake, P.L.; Froend, R.H.; Franks, P.J. Smaller, faster stomata: Scaling of stomatal size, rate of response, and stomatal conductance. J. Exp. Bot. 2013, 64, 495–505. [Google Scholar] [CrossRef] [PubMed] [Green Version]
  68. Lawson, T.; Blatt, M.R. Stomatal size, speed, and responsiveness impact on photosynthesis and water use efficiency. Plant Physiol. 2014, 164, 1556–1570. [Google Scholar] [CrossRef] [Green Version]
  69. Daszkowska-Golec, A.; Szarejko, I. Open or close the gate–stomata action under the control of phytohormones in drought stress conditions. Front Plant Sci. 2013, 4, 138. [Google Scholar] [CrossRef] [Green Version]
  70. Kim, T.H.; Böhmer, M.; Hu, H.; Nishimura, N.; Schroeder, J.I. Guard cell signal transduction network: Advances in understanding abscisic acid, CO2, and Ca2+ signaling. Annu. Rev. Plant Biol. 2010, 61, 561–591. [Google Scholar] [CrossRef] [Green Version]
  71. Flexas, J.; Medrano, H. Drought-inhibition of photosynthesis in C3 plants: Stomatal and non-stomatal limitations revisited. Ann. Bot. 2002, 89, 183–189. [Google Scholar] [CrossRef] [Green Version]
  72. Martin-StPaul, N.; Delzon, S.; Cochard, H. Plant resistance to drought depends on timely stomatal closure. Ecol. Lett. 2017, 20, 1437–1447. [Google Scholar] [CrossRef]
  73. Grassi, G.; Magnani, F. Stomatal, mesophyll conductance and biochemical limitations to photosynthesis as affected by drought and leaf ontogeny in ash and oak trees. Plant. Cell Environ. 2005, 28, 834–849. [Google Scholar]
  74. Gallé, A.; Haldimann, P.; Feller, U. Photosynthetic performance and water relations in young pubescent oak (Quercus pubescens) trees during drought stress and recovery. New Phytol. 2007, 174, 799–810. [Google Scholar] [CrossRef]
  75. Varone, L.; Ribas-Carbo, M.; Cardona, C.; Gallé, A.; Medrano, H.; Gratani, L.; Flexas, J. Stomatal and non-stomatal limitations to photosynthesis in seedlings and saplings of Mediterranean species pre-conditioned and aged in nurseries: Different response to water stress. Environ. Exp. Bot. 2012, 75, 235–247. [Google Scholar] [CrossRef]
  76. Ennajeh, M.; Vadel, A.M.; Cochard, H.; Khemira, H. Comparative impacts of water stress on the leaf anatomy of a drought-resistant and a drought-sensitive olive cultivar. J. Hortic. Sci. Biotech. 2010, 85, 289–294. [Google Scholar] [CrossRef]
  77. Sankar, B.; Karthishwaran, K.; Somasundaram, R. Leaf anatomical changes in peanut plants in relation to drought stress with or without paclobutrazol and ABA. J. Phytol. 2013, 5, 25–29. [Google Scholar]
  78. Alves-Silva, E.; Santos, J.C.; Cornelissen, T.G. How many leaves are enough? The influence of sample size on estimates of plant developmental instability and leaf asymmetry. Ecol. Indic. 2018, 89, 912–924. [Google Scholar] [CrossRef]
  79. Olsen, J.T.; Caudle, K.L.; Johnson, L.C.; Baer, S.G.; Maricle, B.R. Environmental and genetic variationin leaf anatomy among populations of Andropogon gerardii (Poaceae) along a precipitation gradient. Am. J. Bot. 2013, 100, 1957–1968. [Google Scholar] [CrossRef] [Green Version]
  80. Otto, M.S.G.; Francisco, J.G.; Gonsalez, B.T.; de Almeida Calvo, L.; de Mattos, E.M.; de Almeida, M.; de Andrade Moral, R.; Demétrio, C.G.B.; Stape, J.L.; de Oliveira, R.F. Changes in γ-aminobutyric acid concentration, gas exchange, and leaf anatomy in Eucalyptus clones under drought stress and rewatering. Acta Physiol. Plant. 2017, 39, 208. [Google Scholar] [CrossRef]
  81. Pan, X.; Qiu, Q.; Li, J.; Wang, J.; He, Q.; Su, Y.; Ma, J. Drought resistance evaluation based on leaf anatomical structures of 25 shrubs on the Tibetan Plateau. J. South China Agric. Univ. 2015, 36, 61–68. [Google Scholar]
  82. Valladares, F.; Chico, J.; Aranda, I.; Balaguer, L.; Dizengremel, P.; Manrique, E.; Dreyer, E. The greater seedling high-light tolerance of Quercus robur over Fagus sylvatica is linked to a greater physiological plasticity. Trees 2002, 16, 395–403. [Google Scholar] [CrossRef]
  83. Wang, X.; Arora, R.; Horner, H.T.; Krebs, S.L. Structural adaptations in overwintering leaves of thermonastic and non-thermonastic Rhododendron species. J. Am. Soc. Hortic. Sci. 2008, 133, 768–776. [Google Scholar] [CrossRef] [Green Version]
  84. Kulyaa, C.; Siangliwb, J.L.; Toojindab, T.; Lontoma, W.; Pattanagula, W.; Sriyota, N.; Sanitchon, J.; Theerakulpisuta, P. Variation in leaf anatomical characteristics in chromosomal segment substitution lines of KDML105 carrying drought tolerant QTL segments. ScienceAsia 2018, 44, 197–211. [Google Scholar] [CrossRef] [Green Version]
  85. Chaves, M.M.; Pereira, J.S.; Maroco, J.; Rodrigues, M.L.; Ricardo, C.P.P.; Osorio, M.L.; Carvalho, I.; Faria, T.; Pinheiro, C. How plants cope with water stress in the field? Photosynthesis and growth. Ann. Bot. 2002, 89, 907–916. [Google Scholar] [CrossRef] [Green Version]
  86. Silva, E.C.; Nogueira, R.J.; Vale, F.H.; Araújo, F.P.D.; Pimenta, M.A. Stomatal changes induced by intermittent drought in four umbu tree genotypes. Braz. J. Plant Physiol. 2009, 21, 33–42. [Google Scholar] [CrossRef] [Green Version]
  87. de Sousa, C.A.F.; de Paiva, D.S.; Casari, R.A.D.C.N.; de Oliveira, N.G.; Molinari, H.B.C.; Kobayashi, A.K.; Magalhães, P.C.; Gomide, R.L.; Souza, M.T. A procedure for maize genotypes discrimination to drought by chlorophyll fluorescence imaging rapid light curves. Plant Methods 2017, 13, 61. [Google Scholar] [CrossRef] [PubMed] [Green Version]
  88. Nath, K.; Jajoo, A.; Poudyal, R.S.; Timilsina, R.; Park, Y.S.; Aro, E.M.; Nam, H.G.; Lee, C.H. Towards a critical understanding of the photosystem II repair mechanism and its regulation during stress conditions. FEBS Lett. 2013, 587, 3372–3381. [Google Scholar] [CrossRef] [PubMed] [Green Version]
  89. Cendrero-Mateo, M.P.; Moran, M.S.; Papuga, S.A.; Thorp, K.R.; Alonso, L.; Moreno, J.; Ponce-Campos, G.; Wang, G. Plant chlorophyll fluorescence: Active and passive measurements at canopy and leaf scales with different nitrogen treatments. J. Exp. Bot. 2015, 67, 275–286. [Google Scholar] [CrossRef] [PubMed] [Green Version]
  90. Naumann, J.C.; Young, D.R.; Anderson, J.E. Linking leaf chlorophyll fluorescence properties to physiological responses for detection of salt and drought stress in coastal plant species. Physiol. Plant. 2007, 131, 422–433. [Google Scholar] [CrossRef] [PubMed]
  91. Isoda, A. Effects of water stress on leaf temperature and chlorophyll fluorescence parameters in cotton and peanut. Plant Prod. Sci. 2010, 13, 269–278. [Google Scholar]
  92. Jamnická, G.; Ditmarová, Ľ.; Kurjak, D.; Kmeť, J.; Pšidová, E.; Macková, M.; Gömöry, D.; Střelcová, K. The soil hydrogel improved photosynthetic performance of beech seedlings treated under drought. Plant Soil Environ. 2013, 10, 446–451. [Google Scholar] [CrossRef] [Green Version]
  93. Jahns, P.; Holzwarth, A.R. The role of the xanthophyll cycle and of lutein in photoprotection of photosystem II. Biochim. Biophys. Acta 2012, 1817, 182–193. [Google Scholar] [CrossRef] [Green Version]
  94. Koller, S.; Holland, V.; Brüggemann, W. Effects of drought stress on the evergreen Quercus ilex L., the deciduous Q. robur L. and their hybrid Q.× turneri Willd. Photosynthica 2013, 51, 574–582. [Google Scholar] [CrossRef]
  95. Cocozza, C.; De Miguel, M.; Pšidová, E.; Marino, S.; Maiuro, L.; Alvino, A.; Tognetti, R. Variation in ecophysiological traits and drought tolerance of beech (Fagus sylvatica L.) seedlings from different populations. Front Plant Sci. 2016, 7, 886. [Google Scholar] [CrossRef] [PubMed] [Green Version]
  96. Gu, J.; Zhou, Z.; Li, Z.; Chen, Y.; Wang, Z.; Zhang, H.; Yang, J. Photosynthetic properties and potentials for improvement of photosynthesis in pale green leaf rice under high light conditions. Front Plant Sci. 2017, 8, 1082. [Google Scholar] [CrossRef] [PubMed] [Green Version]
  97. Yin, X.; Struik, P.C. Constraints to the potential efficiency of converting solar radiation into phytoenergy in annual crops: From leaf biochemistry to canopy physiology and crop ecology. J. Exp. Bot. 2015, 66, 6535–6549. [Google Scholar] [CrossRef] [PubMed] [Green Version]
  98. Kalaji, M.H.; Pietkiewicz, S. Some physiological indices to be exploited as a crucial tool in plant breeding. Plant Breed. Seeds Sci. 2004, 49, 19–39. [Google Scholar]
  99. Baker, N.R.; Rosenqvist, E. Applications of chlorophyll fluorescence can improve crop production strategies: An examination of future possibilities. J. Exp. Bot. 2014, 55, 1607–1621. [Google Scholar] [CrossRef] [PubMed] [Green Version]
  100. Zlatev, Z. Drought-induced changes in chlorophyll fluorescence of young wheat plants. Biotechnol. Biotechnol. Equip. 2009, 23, 438–441. [Google Scholar] [CrossRef] [Green Version]
Figure 1. Meteorological data during the period from 1st of May to 31st of August 2018. Dates: 13 June 2018—measurement of the chlorophyll a fluorescence in severe drought period; 16 July 2018—measurement of the chlorophyll a fluorescence in wet period; 16 August 2018—sampling for plant biometric characterisation and leaf anatomical traits measurement.
Forests 11 00153 g001
Figure 2. Biometrical traits of Quercus robur L. half-sib lines. (a) Seedling height (SH, cm), (b) root length (RL, cm), (c) root collar diameter (RCD, mm), (d) root to shoot ratio of dry mass (R:S), (e) specific leaf area (SLA, mm2 mg−1). Values are means ± standard errors (n = 9; statistically significant differences among half-sib lines are reported for SH, RL, R:S and SLA) (Dunkan’s multiple range test; p ≤ 0.05).
Forests 11 00153 g002
Figure 3. Leaf stomata traits of Q. robur L. half-sib lines. (a) Stomatal density per mm2 (SD, mm2), (b) stomata guard cell length (LA, μm), (c) stomata guard cell width (WB, μm), (d) stomatal aperture length (La, μm), (e) stomatal aperture width (Wb, μm) Values are means ± standard errors (n = 9; differences of each parameter (SD, LA, WB, La, Wb) among half-sib lines are reported (Dunkan’s multiple range test; p ≤ 0.05).
Forests 11 00153 g003
Figure 4. Leaf anatomical traits: of Q. robur L. half-sib lines. (a) Adaxial epidermis thickness (UE, µm), (b) palisade parenchyma thickness (PT, µm), (c) spongy parenchyma thickness (ST, µm), (d) abaxial epidermis thickness (LE, µm), (e) lamina thickness (LT, µm), (f) main vein diameter (MVD, µm), (g) sclerenchyma thickness (ScT, µm). Values are means ± standard errors (n = 9; differences of UE, PT, ST, LT, MVD parameters among half-sib lines are reported (Dunkan’s multiple range test; p ≤ 0.05).
Forests 11 00153 g004
Figure 5. Chlorophyll a fluorescence parameters generated by rapid light curve’s (RLCs) as a function of photosynthetically active radiation (PAR, µmol photons m−2 s−1) applied to leaves of five Q. robur half-sib lines during wet and drought periods. (a,b) Effective quantum yield (efficiency) of PS II photochemistry (Y(II), relative units), (c,d) coefficient of photochemical quenching (qP, relative units), (e,f) coefficient of photochemical fluorescence quenching assuming interconnected PS II antennae (qL, relative units), (g,h) electron transport rate (ETR, μmol m−2 s−1).
Forests 11 00153 g005
Figure 6. Chlorophyll a fluorescence parameters generated by RLC’s as a function of photosynthetically active radiation (PAR, µmol photons m−2 s−1) applied to leaves of five Q. robur half-sib lines during wet and drought periods. (a,b) Coefficient of non-photochemical quenching (qN, relative units), (c,d) quantum yield of regulated energy dissipation (Y(NPQ), relative units), (e,f) Stern-Volmer type non-photochemical fluorescence quenching (NPQ, relative units).
Forests 11 00153 g006
Table 1. List of the studied parameters.
TraitsAcronymUnit
Biometrical
Seedling heightSHcm
Root lengthRL cm
Root collar diameterRCDmm
Root to shoot ratio of dry massR:S /
Specific leaf areaSLAmm2 mg−1
Leaf anatomical
Stomatal densitySDnumber per mm2
Stomatal guard cell lengthLA μm
Stomatal guard cell widthWB μm
Stomatal aperture lengthLaμm
Stomatal aperture widthWbμm
Adaxial epidermis thicknessUEμm
Palisade parenchyma thicknessPTμm
Spongy parenchyma thicknessSTμm
Abaxial epidermis thicknessLEμm
Lamina thicknessLTμm
Main vein diameterMVDμm
Sclerenchyma thicknessScTμm
Physiological
Effective quantum yield (efficiency) of PS II photochemistryY(II)relative units
Coefficient of photochemical quenching qPrelative units
Coefficient of photochemical fluorescence quenching assuming interconnected PS II antennaeqLrelative units
Electron transport rateETRμmol m−2 s−1
Coefficient of non-photochemical quenchingqNrelative units
Quantum yield of regulated energy dissipationY(NPQ)relative units
Stern-Volmer type non-photochemical fluorescence quenchingNPQrelative units
Table 2. Results of the analysis of variance for measured biometrical parameters of the studied Quercus robur half-sib lines.
Source of VariationSHRLRCDR:SSLA
Half-sib linesF(4,40) = 4.7145
p ≤ 0.01
F(4,40) = 2.9197
p ≤ 0.05
F(4,40) = 1.7240
p = 0.1644
F(4,40) = 5.4992
p ≤ 0.01
F(4,130) = 4.1857
p ≤ 0.01
Table 3. Results of the analysis of variance for measured stomatal traits of the studied Q. robur half-sib lines.
Source of VariationSDLAWBLaWb
Half-sib
lines
F(4,220) = 24.905
p ≤ 0.001
F(4,1120) = 34.836
p ≤ 0.001
F(4,1120) = 9.1665
p ≤ 0.01
F(4,1120) = 63.292
p ≤ 0.001
F(4,1120) = 16.463
p ≤ 0.001
Table 4. Results of the analysis of variance for measured leaf anatomical traits of the studied Q. robur half-sib lines.
Source of VariationUEPTSTLELTMVDScT
Half-sib
lines
F(4,215) = 13.988
p ≤ 0.001
F(4,215) = 18.681
p ≤ 0.001
F(4,215) = 19.542
p ≤ 0.001
F(4,215) = 0.95489
p = 0.433
F(4,215) = 24.500
p ≤ 0.001
F(4,213) = 5.7836
p ≤ 0.001
F(4,212) = 4.4786
p ≤ 0.01
Table 5. Results of a two-way ANOVA in which the effect of Period, Half-sib lines, and their interaction (Period × Half-sib line) on the observed chlorophyll a fluorescence parameters are shown.
Source of VariationqNY(II)qPY(NPQ)qLNPQETR
Period (P)F(1,44) = 54.558
p < 0.01
F(1,44) = 92.453
p < 0.01
F(1,44) = 50.512
p < 0.01
F(1,44) = 21.862
p < 0.01
F(1,44) = 28.264
p < 0.01
F(1,44) = 43.319
p < 0.01
F(1,44) = 65.399
p < 0.01
Half-sib lines (H)F(3,122)=12.497
p < 0.01
F(3,120) = 6.666
p < 0.01
F(3,124) = 26.197
p < 0.01
F(2,104) = 36.358
p < 0.01
F(3,129) = 34.354
p < 0.01
F(3,115) = 25.838
p < 0.01
F(2,103) = 2.081
p > 0.05
P × HF(3,140) = 3.277
p < 0.05
F(2,101) = 6.257
p < 0.05
F(4,156) = 15.049
p < 0.01
F(2,104) = 12.647
p < 0.01
F(3,134) = 17.650
p < 0.01
F(2,96) = 6.715
p < 0.05
F(3,133) = 1.799
p < 0.05

