1. Introduction
Low temperature (LT) is one of the most important abiotic stress factors affecting plant survival and growth, and it is also the main factor that determines the geographical distribution and growth season of plants [
1]. Cold resistance is a complex feature and can be a major influence on plant survival [
2]. During their life cycles, most terrestrial plants that are grown in temperate or cold regions are affected by LT, which usually is defined as cold stress (above 0 °C) or freezing stress (below 0 °C) [
3]. Freezing stress usually leads to the formation of intracellular ice crystals, as well as mechanical dehydration, which will cause an increase of intracellular salt concentration, irreversible damage to plant cells and metabolic defects [
4,
5]. Therefore, frost-resistant plants are assumed to have specific cellular structures and intracellular components that are able to withstand the mechanical and osmotic stresses caused by freezing.
Plants display physiological changes under cold stress [
6]. Previous studies have shown that cold treatment on LT-sensitive plants accelerates their electrolyte flow and increases permeability of cellular membranes, leading to serious membrane damage and “membrane leakage” phenomena [
7]. The intracellular concentration of ions and organic substances can be used to measure electrolyte leakage (EL) levels [
8,
9]; EL levels and the semi-lethal temperature (LT
50) caused by freezing stress have been widely used for the diagnosis of cold resistance [
10,
11,
12]. Plant photosynthesis is sensitive to temperature. The most obvious changes in response to cold stress occur in photosynthetic components, pigment complexes, photosynthetic rates and chloroplast structures [
13,
14]. Chlorophyll is a photosynthetic pigment used as an index of leaf photosynthetic capacity [
15,
16,
17]. Freezing stress reduces plant metabolism and affects the biosynthesis of photosynthetic pigments, significantly decreasing chlorophyll content [
18] as well as photosynthetic capacity. Chlorophyll fluorescence provides information on energy capture and electron transport in photosynthesis, and it also reflects the intrinsic characteristics of the photosynthetic systems [
19], so it is widely used to study the effects of stress factors on plant photosynthesis [
20,
21]. Maximum quantum yield of photosystem II (PSII) (
Fv/
Fm), which reflects maximum PSII efficiency and is regarded as an indicator of plant PSII damage [
22,
23,
24], reduces under cold stress and is commonly used to evaluate each photosynthetic capacity under various environmental stresses. Plants also display cellular changes under cold stress [
12]. Chloroplasts are the most sensitive plant organelles and display the earliest visible damages in plant cell under stress [
25]. Irreversible hypothermia damage first occurs on the plasma membrane [
26] and destroys its structure [
27]. Ultrastructural changes are generally similar among species at LT, including swelling deformation of chloroplasts and mitochondria, expansion of thylakoids, reduction in size and quantity of starch grains in the chloroplasts and so forth [
28].
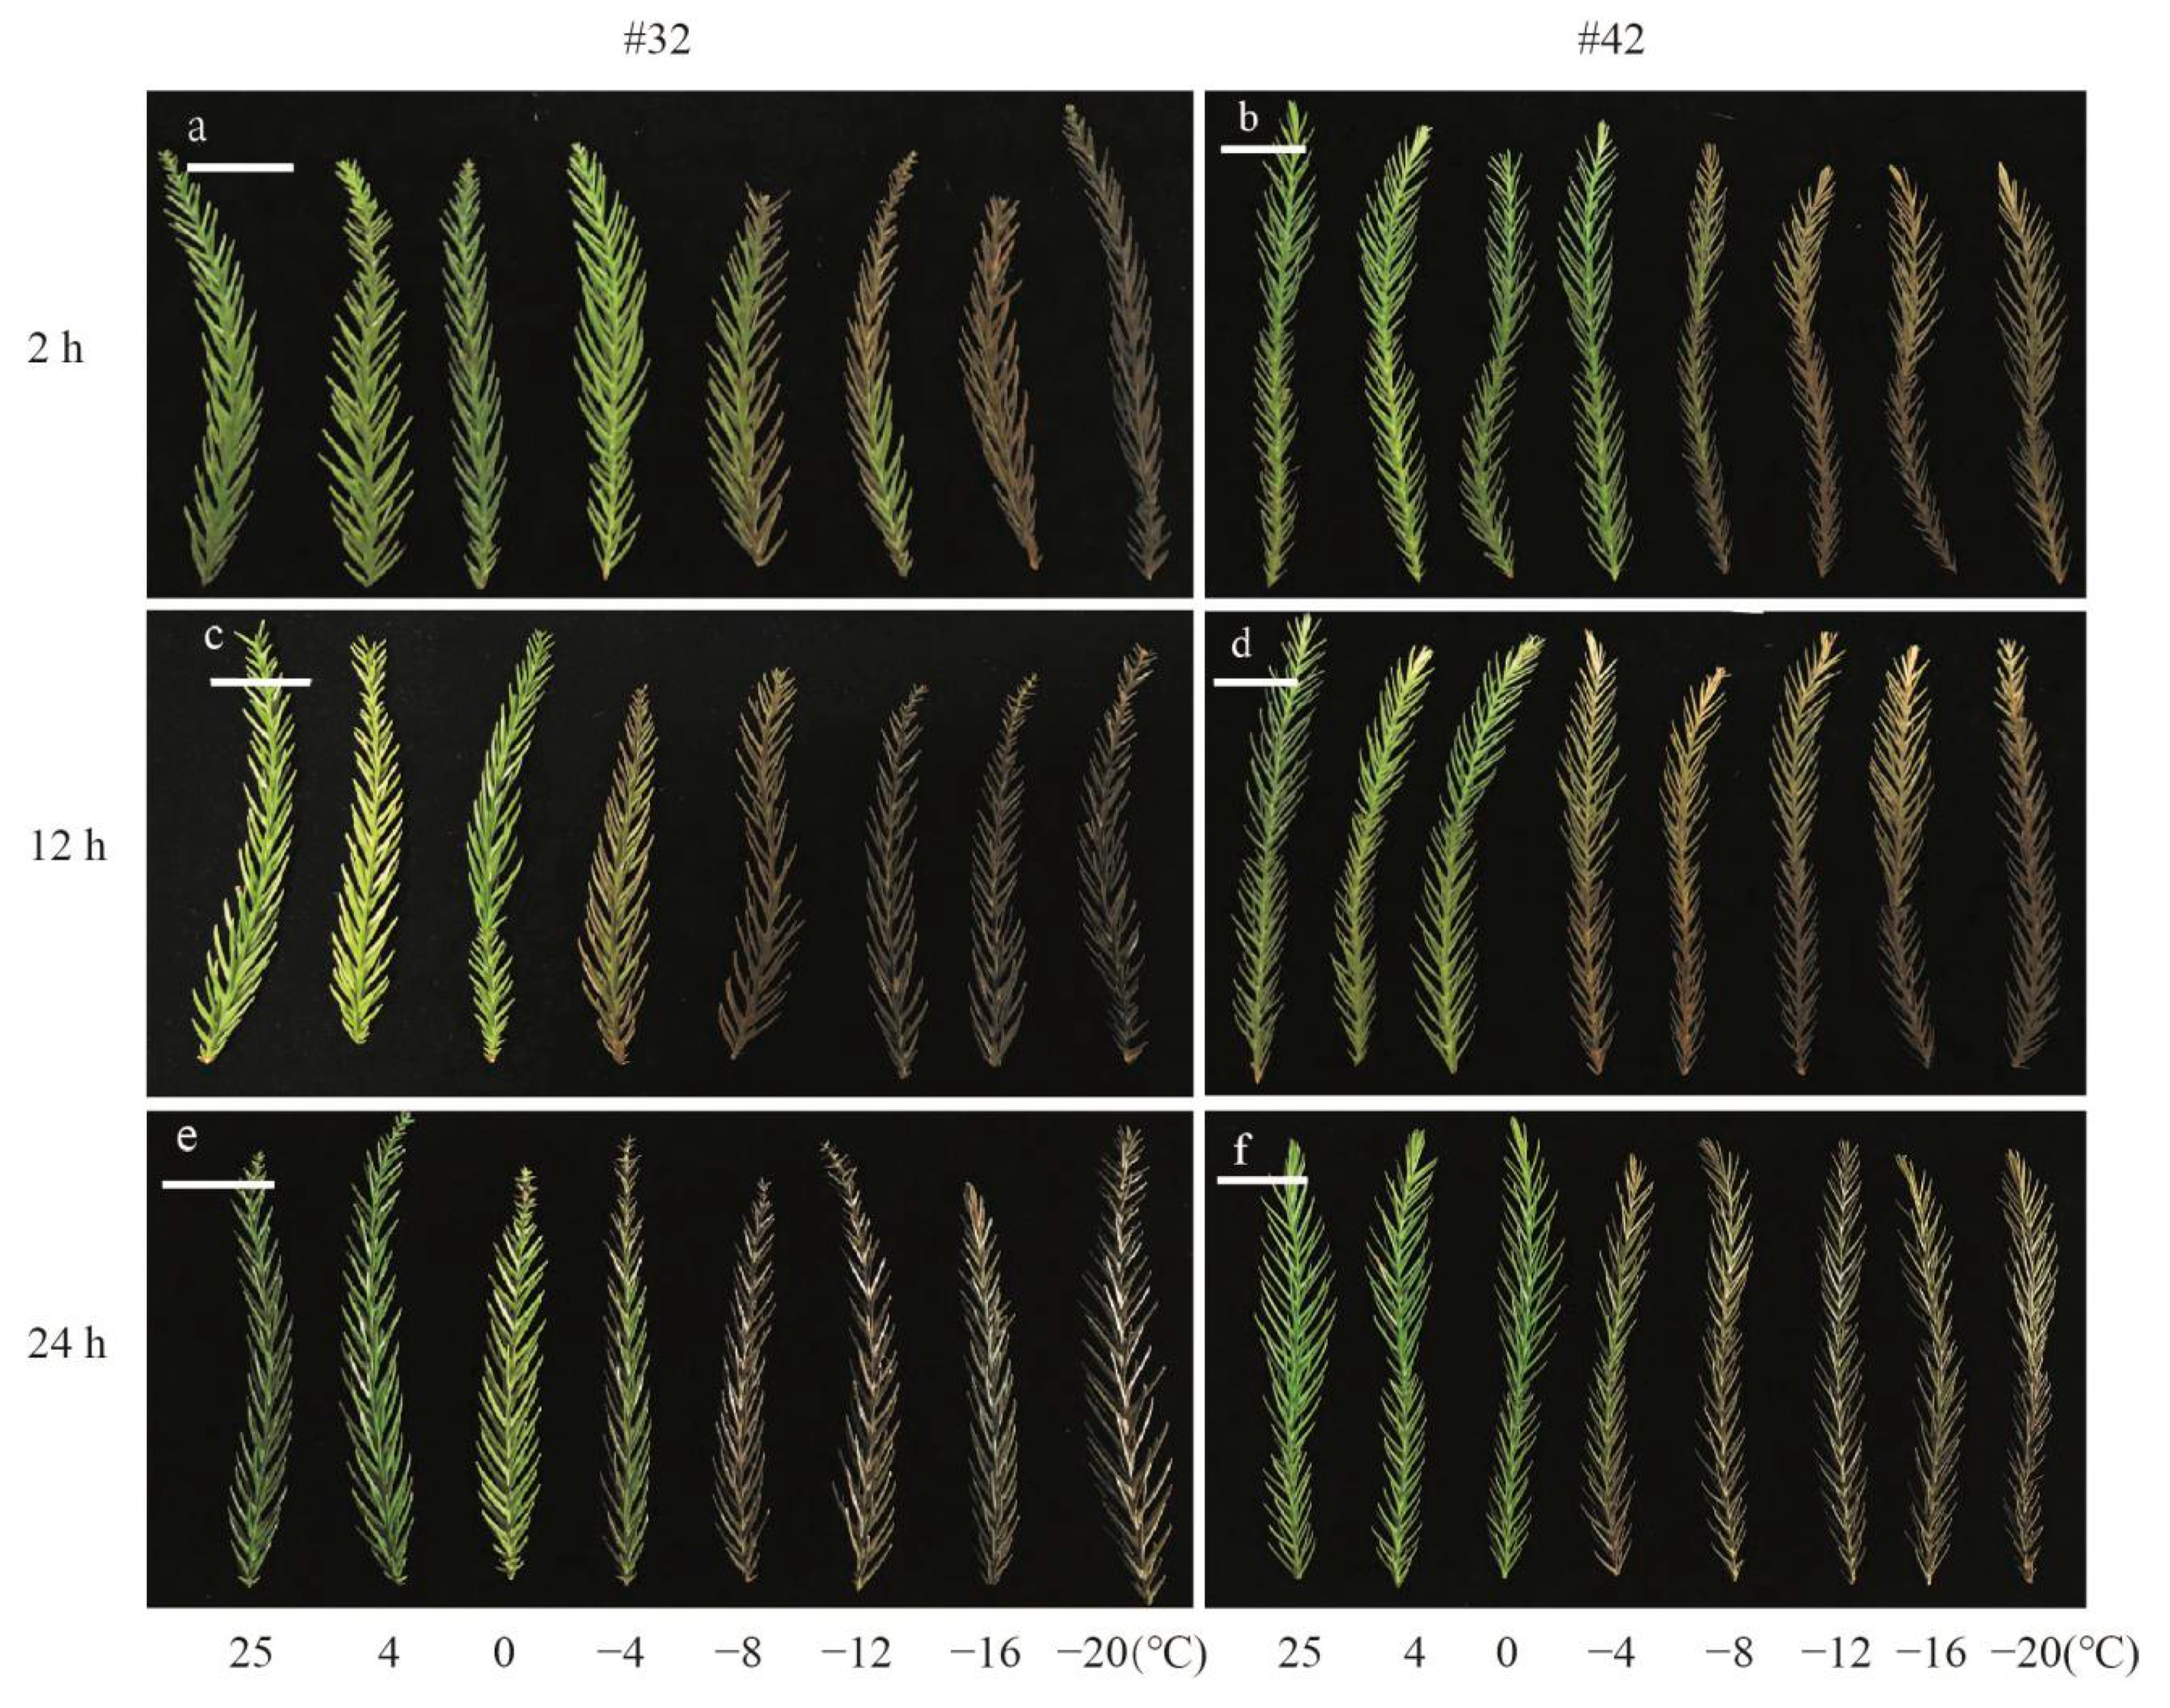
Cryptomeria fortunei Hooibrenk is an evergreen conifer species of
Taxodiaceae. It is an endemic species to southern China and is widely distributed from the south of the Yangtze River (Zhejiang, Fujian, etc.) to the provinces of Guangdong, Guangxi, Yunnan, Guizhou, Sichuan and so forth. It is an important plant species in wood production, carbon storage and ecological restoration [
29]. To date, research on
C. fortunei has mainly focused on forest cultivation [
30] and analysis of its chemical composition [
31]. Needle discoloration is the most prominent sign of freezing injury [
32], and it affects plant growth [
33]. The greater the area and darker the color of leaf browning, the greater the degree of frost damage and the weaker the cold resistance [
34]. In Nanjing, needles of
C. fortunei seedlings will turn yellow and reddish brown in winter. Some of them will return to green in springtime if under mild low-temperature stress (LTS) (other brown needles shed); otherwise, under severe LT, needles will turn browner and shed more, and even the whole plant may die. Although
C. fortunei can cope with moderate LT [
35], not much is known about how it adapts to cold stress. To gain insight into whether and how
C. fortunei resists cold stress, we preselected the strongest and weakest cold-resistant clones among 10 tested clones. Then we analyzed the changes of needle phenotype, chlorophyll fluorescence parameters, chlorophyll content and ultrastructure of these two clones under LT conditions. Our work provides a basis for molecular breeding of cold-resistant
C. fortunei.
4. Discussion
Increased tolerance to biotic and abiotic stresses in plants is necessary to increase productivity under conditions with LT, high salinity, limited water supply and so forth [
51]. In this study, the physiological responses to cold stress were studied to identify key elements that may be responsible for LT tolerance in
C. fortunei.
Plant cell membranes play a crucial role in maintaining a stable intracellular environment [
52]. Under LTS, the integrity of the cell membrane is destroyed, causing leakage of intracellular soluble substances and an increase in EL. There is a positive correlation between the rate of lipid peroxidation and EL [
53]: the greater the LTS, the greater the relative permeability of plasma membrane and EL. In this study, the EL of
C. fortunei clones showed a typical rising S-curve in response to decreasing temperatures, with a slow increase in EL between 4 and 0 °C, similar to the results obtained using
Salix eriocephala [
37]. During initial or mild injury (sublethal dose) and adverse stress of
C. fortunei, there was a stage in which EL occurred with a slight decrease or no significant change at 0 °C, compared to 4 °C, because of the self-protection mechanism of plants. During the frosting process (from 0 to −8 °C) EL was found to increase sharply, which is consistent with previous reports on
Forsythia × intermedia (‘Lynwood Gold’ forsythia) cultivars [
54]. It might be because at this temperature, the biofilm system is seriously damaged, and its permeability is sharply increased, resulting in a large amount of extravasation of electrolytes [
55]. As the temperature was further reduced, we found that EL did not change significantly, which was consistent with research on cherry rootstocks [
56]. It is possible that most cell damage had reached the saturation state and caused irreversible damage. Reports in tea leaves [
57] and evergreen alpine shrubs [
58] showed that the LT
50 (at LT) can reflect cold resistance accurately: the lower the value, the stronger the cold resistance of plants. Therefore, according to the LT
50 value, we designated #32 as having the highest cold resistance and #42 as having the lowest cold resistance.
Our results show that needle shapes and colors changed significantly in response to cold stress, and they were extremely significantly negative (
p < 0.01) related to cold resistance (temperature) of
C. fortunei (
Appendix A,
Table A1). This was similar to results obtained from previous studies on
Fagus sylvatica (European beech) [
59], in which leaves did not remain freshly green as a result of freezing stress. We found that, with a further decrease of LT (≥−12 °C) and the prolongation of LT treatment, the chlorophyll contents of our two
C. fortunei clones reduced by varying degrees. This was similar to studies performed on
Eupatorium adenophorum (crofton weed) [
60], rice [
61] and
Dactylis glomerata (orchardgrass) [
62], supporting that, under freezing stress, chlorophyll content decreases as temperature decreases. We also found that within a certain temperature range (from 25 to −12 °C), the changes of needle color were related to chlorophyll content (
Appendix A,
Table A2). It may be that free radicals cause damage to the plant chloroplasts’ membrane [
63] and inhibit the synthesis of light-harvesting complexes in chloroplast lamellae as well as protochlorophyllide oxidoreductase [
64], leading to a blockade in chlorophyll synthesis. On the other hand, LT can enhance chlorophyll degradation and further reduce the chlorophyll content [
65,
66], resulting in a high degree of plant needle tissue necrosis. Interestingly, we found that chlorophyll content showed a resurgence at −16 and/or −20 °C. We think this may be caused by needle wilting and excessive water loss, resulting in a high content of chlorophyll per gram of fresh weight, and might be due to a too low temperature, causing the needle to freeze quickly and leaving no time for the chemical reaction. In general, the LT change mechanism of the chlorophyll content is more complex [
67].
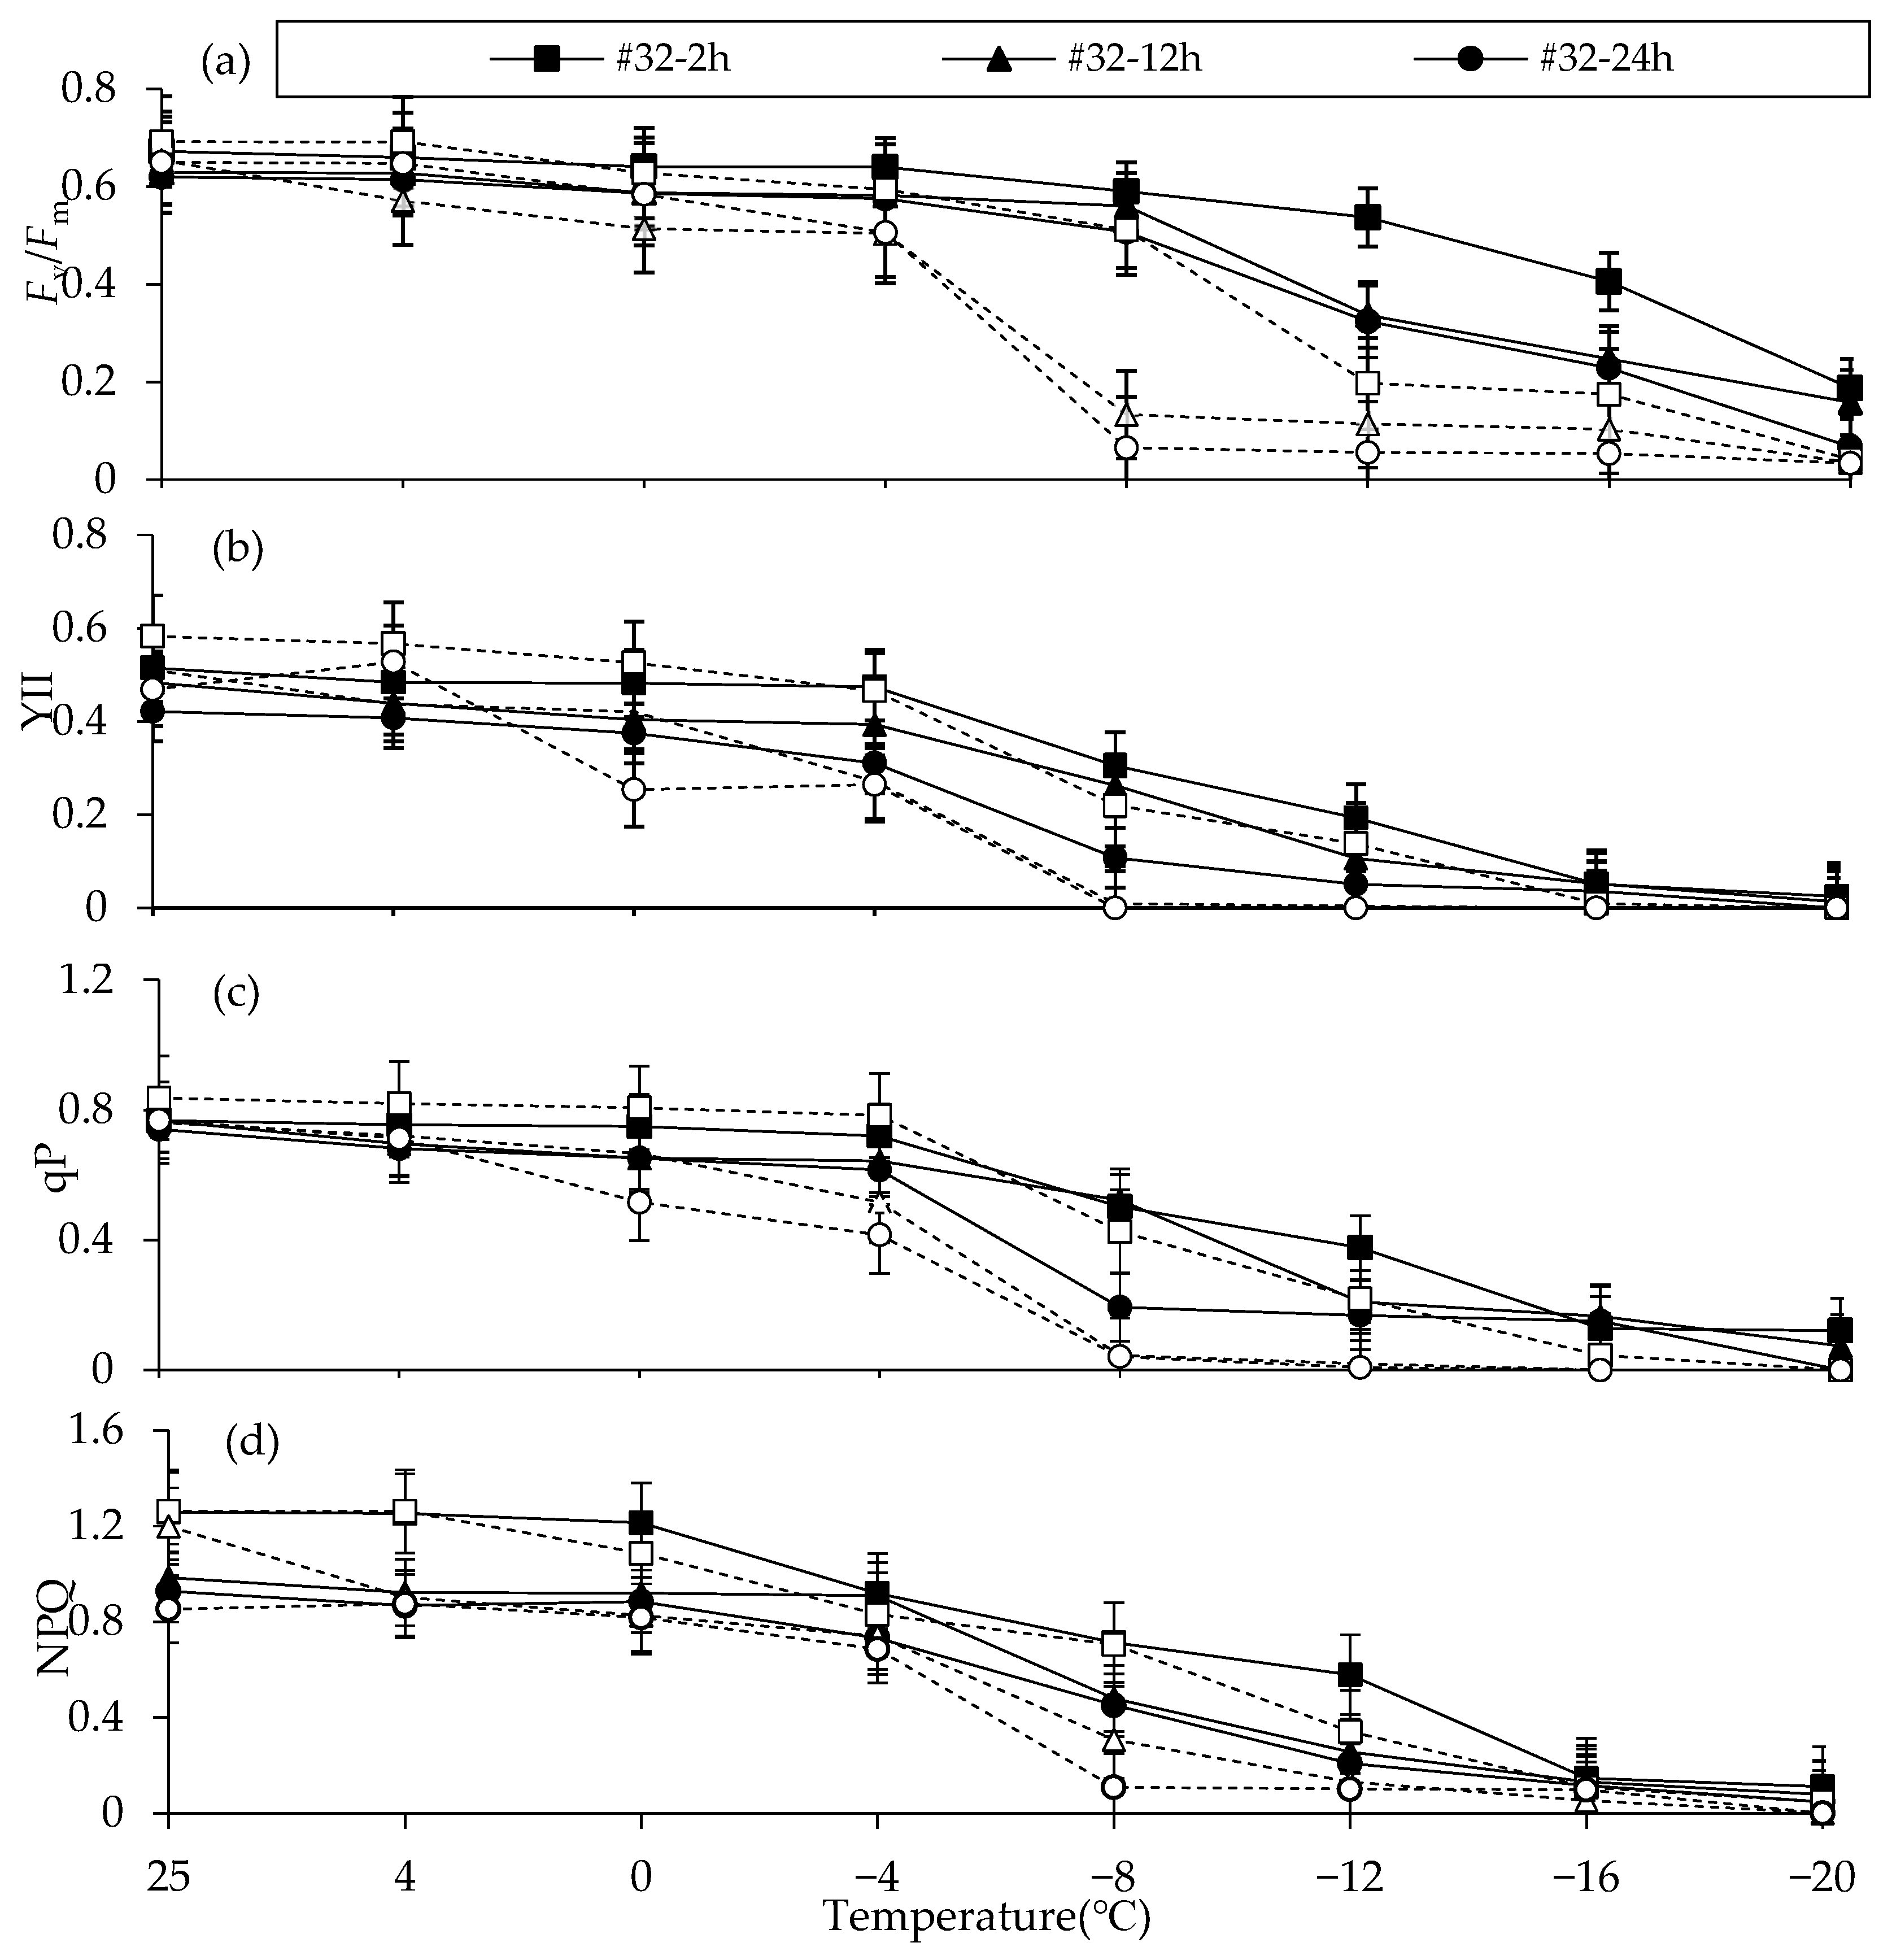
We found that
Fv/
Fm continuously decreased as stress increased. This agrees with much of the research reported in
Eupatorium adenophorum, sunflower and apricot fruit, which states that LTS can cause damage to the PSII reaction center in plants, resulting in a continuous decline in
Fv/
Fm [
60,
68,
69]. A series of fluorescence parameters, such as yield, qP and NPQ, related to PSII electron transfer ability also decreased in the leaves of
C. fortunei under LTS. This shows that LT not only causes changes to the structure of the light harvesting antenna and reaction center, but it also reduces the chemical conversion efficiency of PSII [
70] and inhibits the electron transfer of PSII. We speculated that the basic reason may be that LT causes the changes to the structure or conformation of the reaction center, light harvesting antenna, electron transfer body and other proteins on the thylakoid membrane, and finally causes the omnidirectional damage and suppression of the PSII reaction center [
20]. Fluorescence parameters were closely correlated to the cold resistance of
C. fortunei (
Appendix A,
Table A1). The change of
Fv/
Fm is widely used and relatively clear, making it a suitable indicator of cold tolerance. At the same time, combined with the temperature when
Fv/
Fm > 0.5, we speculated that #32 can tolerate −12 °C for 2 h or −8 °C for a long time (12, 24 h). In contrast, 42# can tolerate −8 °C for 2 h or −4 °C for a long time. We also think the tolerable temperature may be close to LT
50. Future experiments could include different seasons for a more accurate and detailed record of cold resistance. At the same time, different tissues of
C. fortunei clones can be sampled to study whether physiological changes might differ across organs.
We found that with increasing cold stress, the cross-section area of chloroplasts decreased first, then increased. Chloroplast enlargement appears to occur in both cold-resistant plants such as
Arabidopsis thaliana (thale cress) and cold-sensitive plants such as mung bean [
71]. Chloroplasts are believed to be the most sensitive organelles [
72]. An osmotic imbalance between stroma and cytoplasm may be the cause of chloroplast swelling [
28,
73]. Slight swelling of the chloroplasts may reduce the activity of starch degradation enzymes and soluble sugar content, thereby reducing the amount of photosynthetic product in the chloroplast as well as the matrix water potential [
28]. At LT
50 or lower, the chloroplast further expands, resulting in the loss of its intact structure and disorganization of its outer membrane, resulting in an increase in its area. Our study showed that LTS caused plasmolysis as well as numerous invaginations of the plasma membrane, vacuolation of plastids and mitochondria, condensation of chromatin in the nucleus, multiple vacuoles and an increase in their inclusion in
C. fortunei needles. Similar alterations in cellular ultrastructure have been observed by cold stress in leaves of
Camellia sinensis (tea) [
74],
Arabidopsis thaliana [
75], winter wheat cv. Volodarka [
76], as well as one-year-old young grape plants (
Vitis vinifera) [
77]. Ultrastructural cold damage to plant cells is significantly similar to the ultrastructural changes in the programmed death process, and the physiological response of plant cells exposed to LT (above-freezing temperatures) also resembles that seen in putative programmed cell death [
28]. The reasons for mitochondrial damage might be that mitochondria accumulate a large amount of reactive oxygen species, which could damage mitochondrial cristae, decreasing the mitochondrial energy production rate and the metabolism of mesophyll cells, leaf tissue or the whole plant [
78]. The phenomena of multiple vacuoles and their increased inclusion may be related to vacuole-clearing, senescent organelles and cells under LT conditions. Alternatively, it may be a general plant stress response. The nucleus is the regulatory center of physiological and biochemical processes for cells, and damage to the nucleus results in cells being unable to maintain their normal metabolic processes, ultimately leading to cell death [
79]. We did find that the majority of cell organellar structures of #32 and #42 remained clear and complete at −4 °C, so we think the needles of both clones were not damaged irreparably and can tolerate −4 °C for 24 h. Whereas, the cellular ultrastructure changed obviously at −8 °C, and for #32, chloroplasts were swollen, the nucleus was slightly blurred and vacuole inclusions increased (the structures were complete), while those structures (most mesophyll cells, cellular structure, nucleus, cell wall, vacuole membrane, chloroplast) of #42 were damaged seriously or even destroyed. Therefore, we speculated that #32 was able to endure at −8 °C for 24 h, while #42 can tolerate −4 °C for 24 h, and we think the tolerable temperature may be also close to LT
50. In addition, metabolic disruptions induced by environmental factors are manifested in the ultrastructure of cell organelles, and cellular components have varied tolerance to LT [
80]. Similarly, under LTS, damage inflicted on the same types of organelles was different between cells, which ensured that cells can maintain normal physiological function for a period of time under external stress, and it may be beneficial to the survival of
C. fortunei at moderate levels of LTS. At temperatures lower than the LT
50, the specific effects of different LT with small gradients (such as 1 °C, 2 °C) on the ultrastructural changes of plants need further study.

 ,
, 


