Article

Biomass Allocation into Woody Parts and Foliage in Young Common Aspen (Populus tremula L.)—Trees and a Stand-Level Study in the Western Carpathians

by
Bohdan Konôpka
1,2,
Jozef Pajtík
1,
Vladimír Šebeň
1,*,
Peter Surový
2 and
Katarína Merganičová
2,3
1
Forest Research Institute, National Forest Centre, T.G. Masaryka 22, SK-960 01 Zvolen, Slovakia
2
Faculty of Forestry and Wood Sciences, Czech University of Life Sciences Prague, Kamýcká 129, CZ-165 000 Prague, Czech Republic
3
Forestry Faculty, Technical University Zvolen, T.G. Masaryka 24, SK-960 01 Zvolen, Slovakia
*
Author to whom correspondence should be addressed.
Submission received: 19 February 2020 / Revised: 15 April 2020 / Accepted: 16 April 2020 / Published: 20 April 2020

Abstract

:
Our research of common aspen (Populus tremula L.) focused on the forested mountainous area in central Slovakia. Forest stands (specifically 27 plots from 9 sites) with ages between 2 and 15 years were included in measurements and sampling. Whole tree biomass of aspen individuals was destructively sampled, separated into tree components (leaves, branches, stem, and roots), and then dried and weighed. Subsamples of fresh leaves from three crown parts (upper, middle, and lower) were scanned, dried, and weighed. Allometric biomass models with stem base diameter as an independent variable were derived for individual tree components. Basic foliage traits, i.e., leaf mass, leaf area, and specific leaf area, were modelled with regard to tree size and leaf position within the crown. Moreover, biomass stock of the woody parts and foliage as well as the leaf area index were modelled using mean stand diameter as an independent variable. Foliage traits changed with both tree size and crown part. Biomass models showed that foliage contribution to total tree biomass decreased with tree size. The total foliage area of a tree increased with tree size, reaching its maximum value of about 12 m2 for a tree with a diameter of 120 mm. Leaf area index increased with mean stand diameter, reaching a maximum value of 13.5 m2 m−2. Since no data for biomass allocation for common aspen had been available at either the tree or stand levels, our findings might serve for both theoretical (e.g., modelling of growth processes) and practical (forestry and agro-forestry stakeholders) purposes.

1. Introduction

Knowledge on the patterns of biomass partitioning of a variety of species is of high importance for carbon reporting [1], tree physiology, plant ecology, and process-based modelling [2], and has also applications for forestry management [3]. Although generalised biomass models can be used to estimate biomass stock in forests stands [4], locally fitted models are recommended by the IPCC to minimise the bias of estimations [5]. In addition, young stands are characterised by fast changes in biomass allocation in individual tree compartments, due to which biomass equations developed for older stands are not appropriate [6,7,8].
Considering a range of forest tree species, a lot of works focused on biomass allocation and foliage traits with regard to a number of different factors, e.g., competition in a stand [9,10]. Few authors [11,12,13] used the ratio between foliage dry mass and total dry plant biomass (leaf mass ratio; LMR) or between foliage area and total plant dry biomass (leaf area ratio; LAR) to link them to ecological and production processes. Similarly, specific leaf area (ratio between leaf area and dry leaf mass; SLA) has often been studied in plant ecology as one of the adaptation strategy indicators [14]. Canopy leaf area of forests serves as a dominant physical control over primary production, transpiration, energy exchange, and other physiological attributes related to a variety of ecosystem processes; hence, it is a substantial element of ecological studies [15]. Here, the leaf area index (LAI, defined as the amount of leaf area in the canopy per unit ground area) is the main parameter of the canopy [16]. None of these indicators has been studied in common aspen either at the tree or the stand level.
Common aspen, or also named Eurasian aspen (Populus tremula L.), is one of the most widely distributed tree species around the world [17]. It is a light-demanding broadleaved softwood tree species that is native to boreal zones as well as to cooler parts, such as the temperate zones of Europe and Asia [18]. It is one of the so-called pioneer species that occupy post-disturbance areas after windbreaks, fire events, or clear cutting [17,19]. Although in forest stands dominated by other species it is usually scattered, it can create homogeneous stands at post-disturbance areas [20].
The aspen grows very fast, especially during the first 15–20 years, i.e., in the period when crown competition increases [20]. Even though the commercial importance of aspen is limited, the species is often considered as a relevant part of forest ecosystems due to its fundamental importance for other plant and animal species [21,22]. This species creates conditions for existence of a variety of herbivorous, saprophytic invertebrates, fungi and lichens, birds, etc. [20]. It is one of the most attractive tree species for forage for large herbivores [23]. Hence, its presence increases the carrying capacity of red deer hunting grounds and can ensure the biological protection of other economically important tree species [24].
Moreover, the species is considered to be soil ameliorating since its foliage litter contains high concentrations of calcium, potassium, and magnesium [19]. It is also an important species for regulating the microclimate and for enhancing the structural and biological diversity of open agricultural landscapes in the temperate zone of Europe [22,25].
The share of aspen in Slovak forests is small, since from the point of its contribution to the wood stock and forest area it was ranked 18th and 16th, respectively, out of all tree species (approximately 50) recorded in the national forestry inventory [26]. According to the data from the last National Forest Inventory of Slovakia, aspen was recorded at 8% of the inventory plots [26]. Although it occurred at elevations from 200 to 1300 m a.s.l., aspen was most frequent at elevations between 450 and 550 m a.s.l. [10]. Despite its good ecological values, it is not an important tree species for any biotopes of European and national significance, nor is it a main tree species of any biotope. In Slovakia and Czechia, aspen (similarly to many other softwood broadleaved tree species) occur more frequently in stands growing on former agricultural land than on forest lands [27].
Since common aspen is fast growing and tolerant to extreme or nutrient-poor ecological conditions, it might be a prospective species to produce biomass for energetic purposes or for pulp and paper production [28]. Common aspen and its hybrids (especially P. tremula × P. tremuloides) are frequently planted in Nordic and Baltic countries [29,30,31] and used for pulp production. The increasing demand of woody biomass by the energy sector as well as by the forest industry will increase the need for alternative wood sources. Applying “short rotation forestry” based on fast-growing tree species, including those from the Populus genus, is a promising alternative [32]. While a number of papers have focused on the biomass of a variety of tree species, nearly no information on the biomass characteristics for common aspen is available and absolutely no works studied its biomass allocation patterns or component traits in terms of ecological conditions or biological aspects. Our review of the European literature focusing on common aspen indicated neglected interest in this species.
Therefore, the main aim of our paper was to quantify total tree biomass and its allocation to components in common aspen at both the tree and stand levels. A further aim of the paper was to quantify foliage traits (especially SLA) and stand canopy status (LAI) with respect to tree or stand size, specifically stem base diameter.

2. Material and Methods

2.1. Site and Stand Description

Our research focused on the forested mountainous area of central Slovakia belonging to the Western Carpathians. In general, the forest composition of the Western Carpathians, which is a part of the Carpathian Mountain Range, changes with altitude. At the lowest altitudes, oaks (mainly Quercus robur L. and Q. petraeae (Matt.) Liebl.) dominate, while at the middle altitudes European beech (Fagus sylvatica) is the dominant species. At higher altitudes (over approx. 900 m a.s.l.), coniferous species such as Norway spruce (Picea abies (L.) H. Karst.), Silver fir (Abies alba Mill.), Scots pine (Pinus sylvetris L.), and European larch (Larix decidua Mill.) prevail.
A preliminary selection of forest stands containing common aspen was conducted using a database of Programs of Forest Management by Stand Units in Slovakia (available on: 
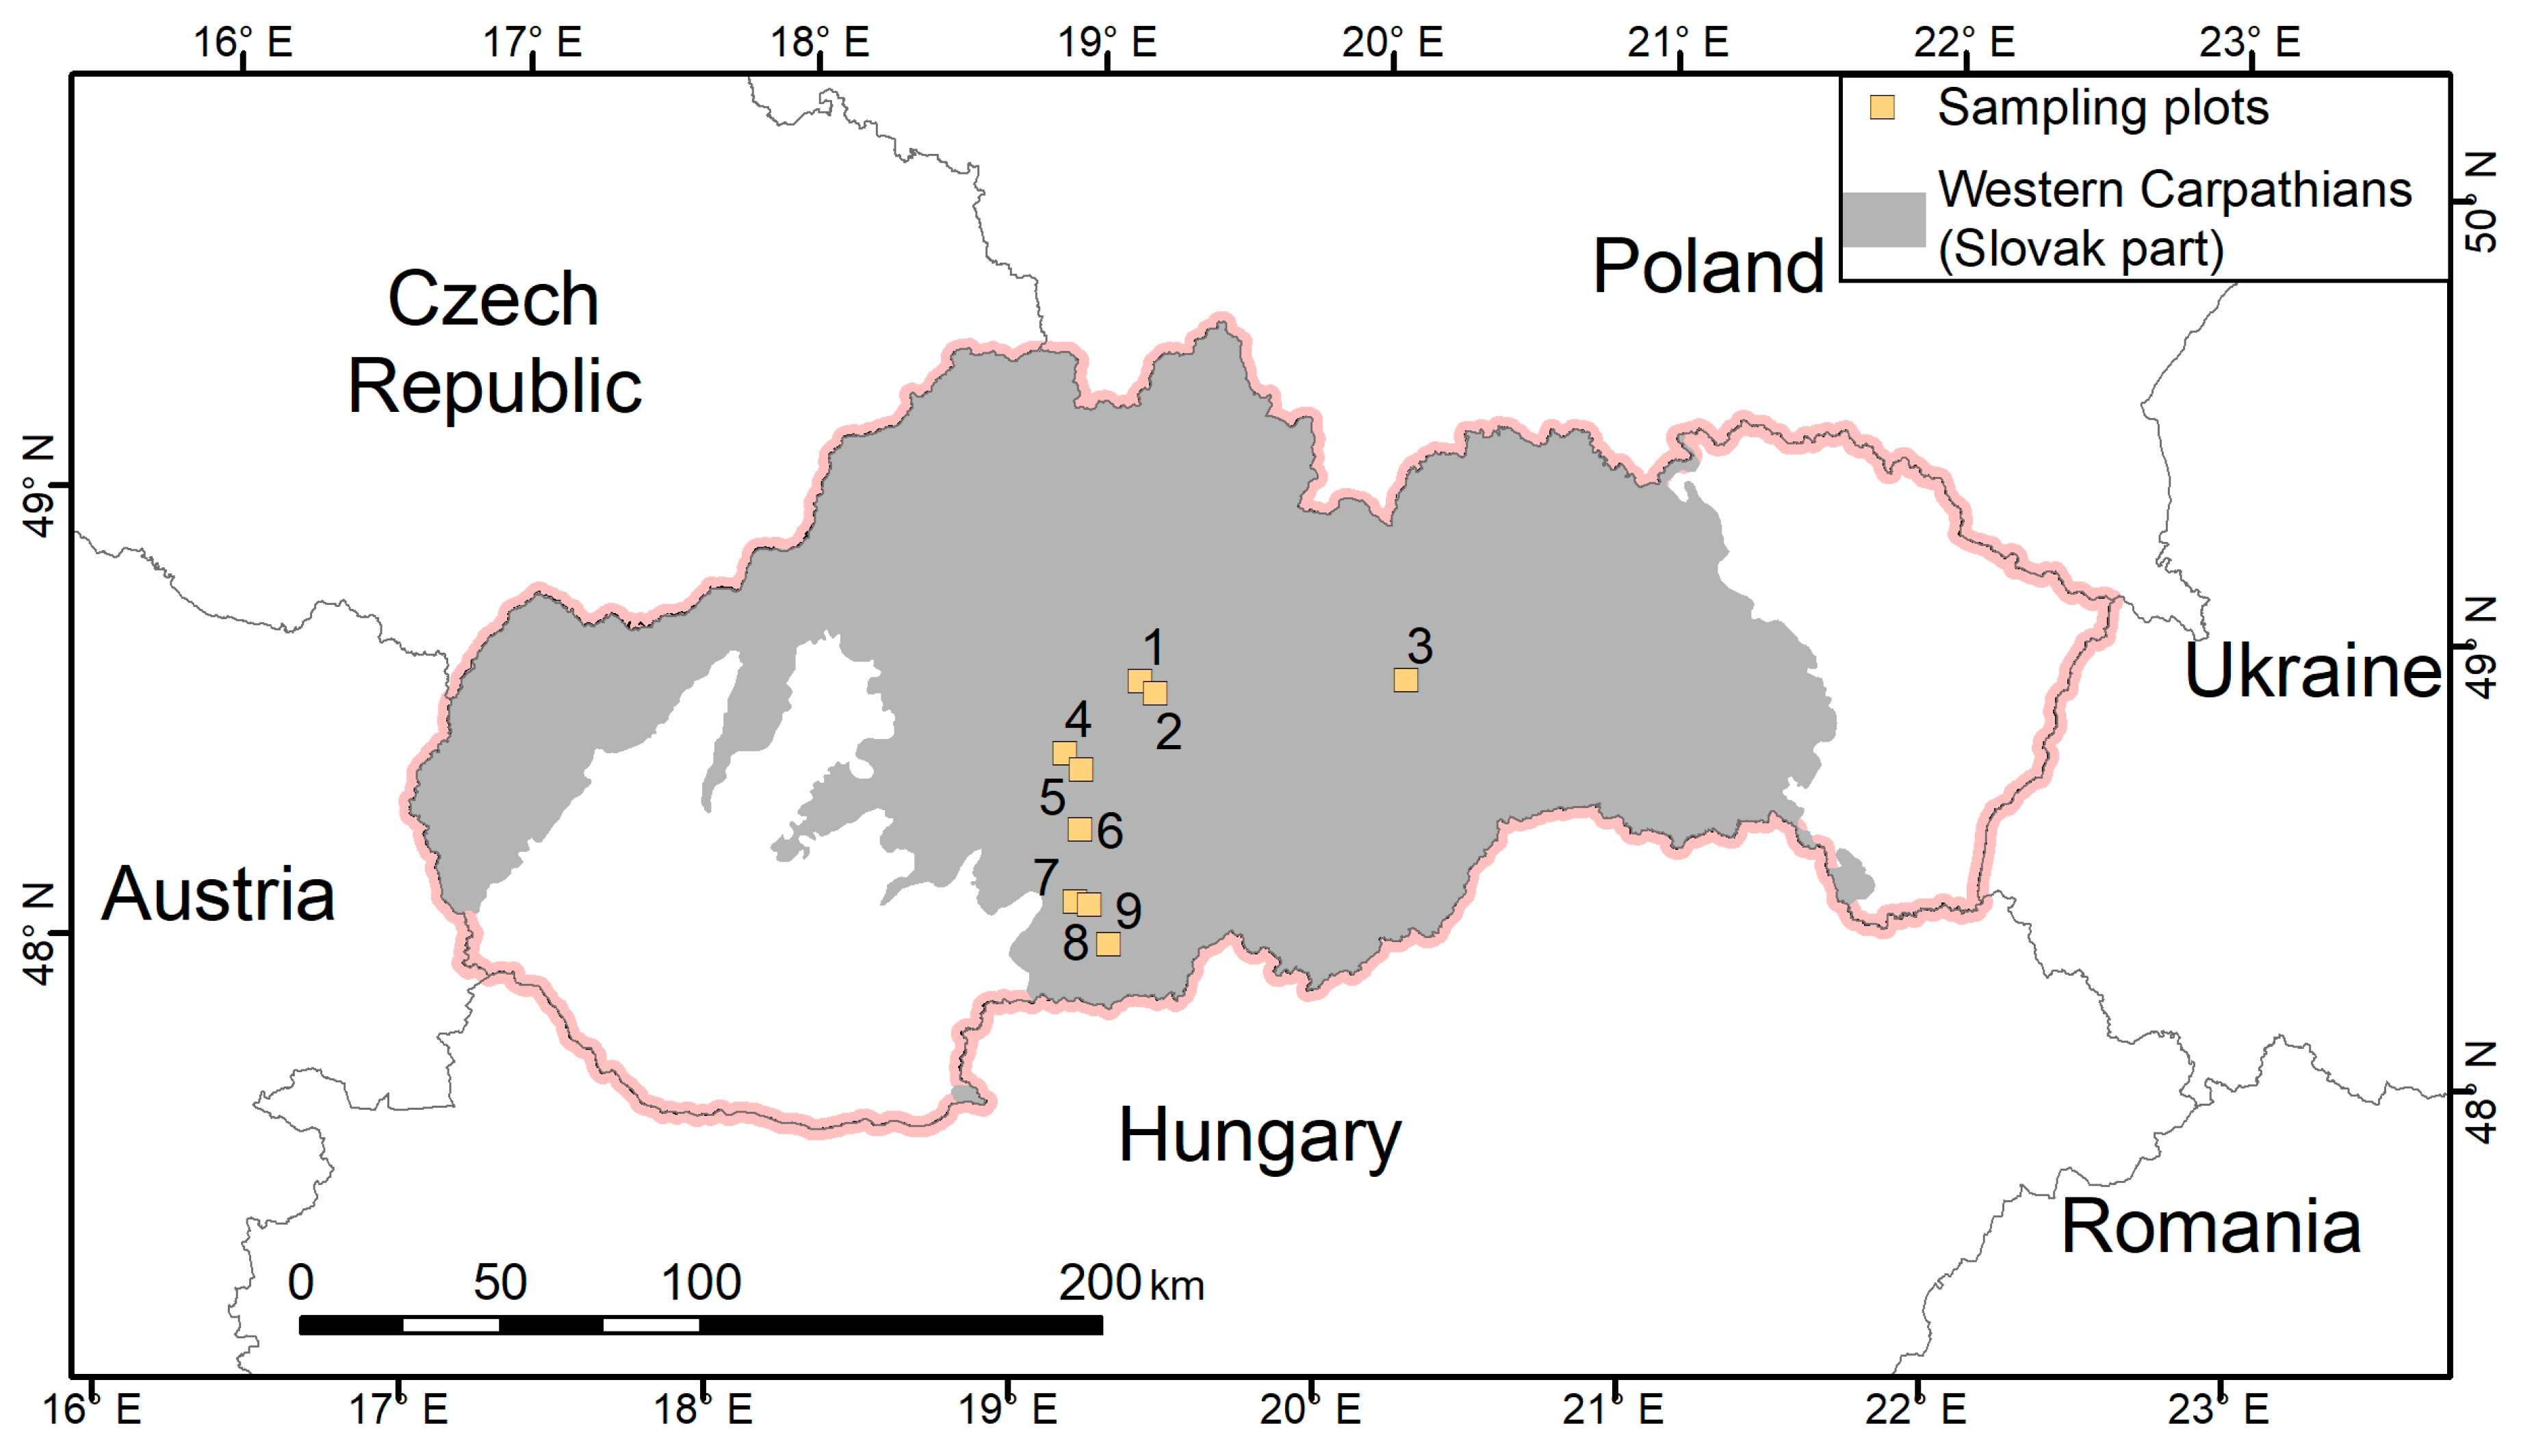
http://gis.nlcsk.org/lgis/) based on specific information on tree species composition and stand age. The main criteria for forest selection were (1) the share of the target tree species, i.e., aspen, had to be equal to or greater than 90%, and (2) a stand age of maximum 20 years. Afterwards, we examined preselected forest stands in the field, where we checked the origin and the actual contribution of aspen to tree species composition in stands. The final selection of nine forest stands (Figure 1) was performed considering exclusively natural regeneration and nearly a 100% share of aspen. The youngest selected stand was 2 years old and the oldest stand was 15 years old. All stands were dense with no large gaps in the forest canopy.
The altitudinal range of the selected stands was between 335 m and 610 m a.s.l. (Table 1, i.e., they occurred in the forest vegetation zone with natural prevalence of oak and beech). In the selected region and altitudes, annual mean temperatures are between 5.0 °C and 8.5 °C, annual precipitation totals fluctuate between 600 and 900 mm, and the growing season usually lasts from 130 to 175 days. Soils are represented by Cambisols, Luvisols, and Rendzina (Table 1).

2.2. Field and Laboratory Works

Field measurements and tree samplings were performed in the second half of the growing season of 2018. In each selected stand, three circular plots were established with a distance between the plots of at least 10 m. The radius of the plots varied between 1.5 m and 3.0 m, as it depended on stand density and was chosen to cover at least 30 trees. Diameters at stem base (hereinafter as d0) and tree heights were measured for all trees at the plots. In total, 27 circular plots and 971 trees were measured. Mean tree and stand characteristics for the nine forest stands are presented in Table 2. Plot-level data were used for subsequent calculations at a stand level using input data recorded at the tree level (destructive tree sampling).
Afterwards, 20 aspen trees were selected from each stand (altogether 180 individuals based on stratified random sampling) to cover all bio-sociological classes (i.e., dominant, co-dominant, sub-dominant, and suppressed). The root system of each tree was excavated to include all roots with a diameter of at least 1 mm. In addition, 5 leaves were sampled from the lower, middle, and upper thirds of the tree crowns, i.e., 15 leaves were sampled from each tree. Leaf subsamples were packed in paper envelopes identified with plot and tree codes, and the position of the leaves in the crown.
Excavated trees were cross-cut at a stem base to separate the belowground (root system) and aboveground parts. Subsequently, branches with foliage were cut off from the main stem. Stem length (tree height) and diameter d0 were measured. Each tree component, i.e., root system, stems, and branches with foliage, were packed in paper bags identified with plot and tree codes. All samples were transported to the laboratory. Subsamples of leaves were scanned and their one-side leaf surface area (LA hereinafter) was calculated using the Easy Leaf Area software [33]. Each leaf was oven-dried (under 95 °C for 24 h) and weighed with a precision of 0.001 g. Individual leaf mass and area were used for the calculation of SLA at a specific crown part (upper, middle, and lower).
Leaves were manually trimmed back from the branches. Consequently, roots, stems, branches, and foliage were stored in a warm (about 28 °C), dry, and well-ventilated room. After several weeks, individual tree components were placed in the oven and dried under a temperature of 95 °C for a determined period; specifically, foliage for 48 h and woody parts (i.e., roots, stems, and branches) for 72 h to obtain dry matter. After drying, all components were weighed with a precision of 0.1 g.

2.3. Calculations and Modelling

From the data we derived models that quantified the biomass in the foliage and woody parts of aspen trees, as well as other variables representing leaf growth (LA, SLA, LAI, LAR, LMR). Models were derived for several levels:
-
The level of individual leaves (leaf mass wf, LA and SLA)
-
The tree level (foliage mass wf, mass of woody parts wwp, LA, LAR, LMR)
-
The stand level (foliage mass wf, mass of woody parts wwp, LAI).
An allometric function with two regression coefficients (b1 and b2),
Y = b 1 d 0 b 2 ,
was used to describe the relationship of the particular dependent variable (represented by Y) to the d0 stem base diameter. In the models for the leaf and tree levels, the tree stem base diameter d0 was used, while in the stand level models a mean stand diameter at the stem base d0g was used. The frequently used diameter at breast height was not applicable in our analyses, because some of the selected trees did not reach a height of 1.3 m. Almost all constructed equations were derived in a basic power form. The equations of foliage and wood biomass were derived as linearised logarithmic allometric equations that were subsequently transformed back to the exponential form. This approach was applied to ensure a methodological link to previous works that quantified the biomass of components in young trees [34]. The shape of the allometric function after the logarithmic transformation and its back transformation is
Y = e ( b 1 + b 2 · ln d 0 ) · λ
where λ is a correction factor.
A logarithmic version of the equation is frequently used to exclude heteroscedasticity of residues, which is always present in the calculation of biomass components. Using a logarithmic equation enables the estimation of parameters with linear regressions, which fulfils the assumption of constant variance of residues. Although in the last years non-linear regression methods have been developing, the opinions on these two methodological approaches differ between papers, e.g., [35,36,37].
Models at a level of individual leaves were derived for leaves at different crown parts (upper, middle, and lower) using measured data of d0 (mm), wf (g), and LA. SLA was calculated using the following formula
S L A = L A w f
Since only d0 diameter and wf and wwp mass were measured for a tree, leaf area LA of the whole tree had to be calculated otherwise. In our work we derived a new model from the measured foliage mass of a particular tree and a tree LA calculated as an arithmetical average from the LA values of nine leaves taken from three crown parts of the particular tree using the equation
L A = w f i = 1 n ( L A i w f i ) n
where:
  • LA—leaf area of a tree (cm2);
  • LAi—leaf area of ith sampled leaf (cm2);
  • wf—mass of all tree leaves (g);
  • w f i —mass of ith sampled leaf (g);
  • n—number of leaves sampled from one tree (i.e., 15).
For the models at a stand level, mean stand diameter d0g (mm) was calculated as a quadratic mean of all tree diameters using the formula
d 0 g = i = 1 n d i 2 n
Leaf area index LAI was calculated as the LAI under the assumed full canopy coverage (LAI100%) using the relationship
L A I 100 % = 100 i = 1 n L A i S c
where:
  • LAi—leaf area of ith tree at a plot (m2 m−2);
  • S—plot area in m2;
  • C—crown canopy coverage at a plot in %;
  • n—number of trees at a plot.
Similarly, variables in other models (volume of woody parts, and foliage volume) were also converted to 100% crown canopy.
Finally, a generalised linear mixed model (GLMM) was created to evaluate the combined influence of d0 and position of the leaves in the crown on leaf traits. The model has the following form:
y = α + β × ln(d0) + γ1 × M + γ2 × U
where:
  • y—a dependent variable, namely leaf mass, leaf area, or specific leaf area;
  • d0—diameter at stem base;
  • M—a dummy variable that represents the middle crown part, i.e., if the leaf was taken from the middle part, the value is 1, otherwise it is 0;
  • U—a dummy variable that represents the upper crown part;
  • α, β, γ1 and γ2—the regression coefficients of the model.
All statistical analyses were performed in Statistica 10.0 and R software version 3.5.1 [38].

3. Results

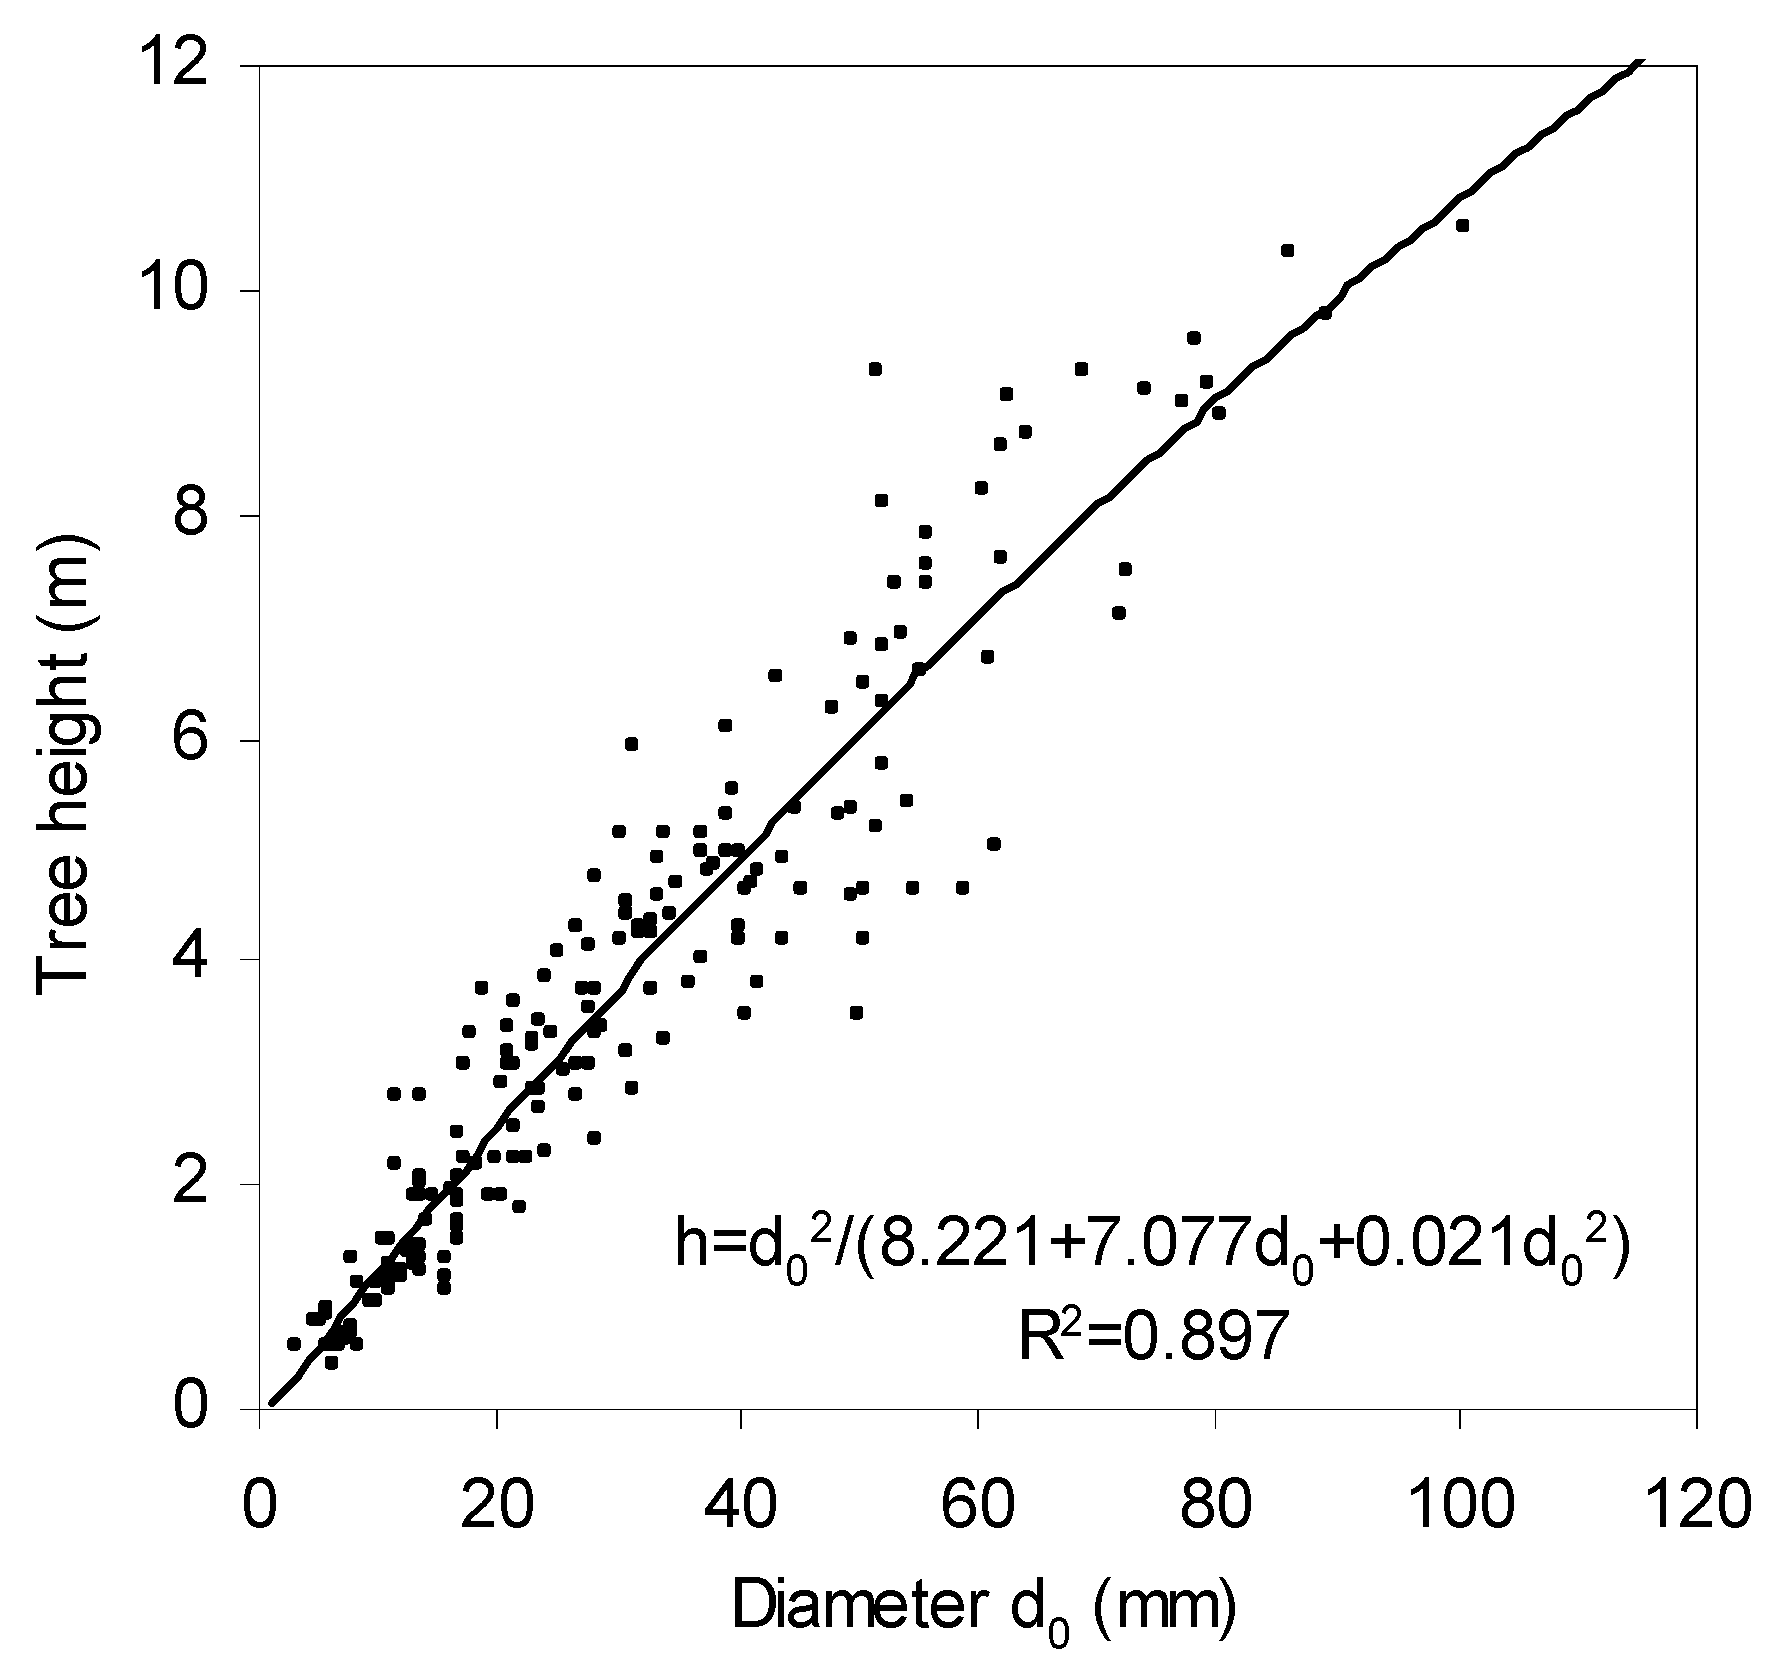
Heights and stem base diameters of the sampled trees varied between 0.4 m and 10.5 m and from 3.3 mm to 100.9 mm, respectively (Figure 2; Table 3). The relationship between d0 diameter and tree height was best described by a fractional power relationship, specifically, h = d 0 2 8.221 + 7.077 d 0 + 0.021 d 0 2 , which explained almost 90% of the variability. This relationship may help users who prefer using tree height as an independent variable in biomass models, to convert our models that are based on d0 diameter.
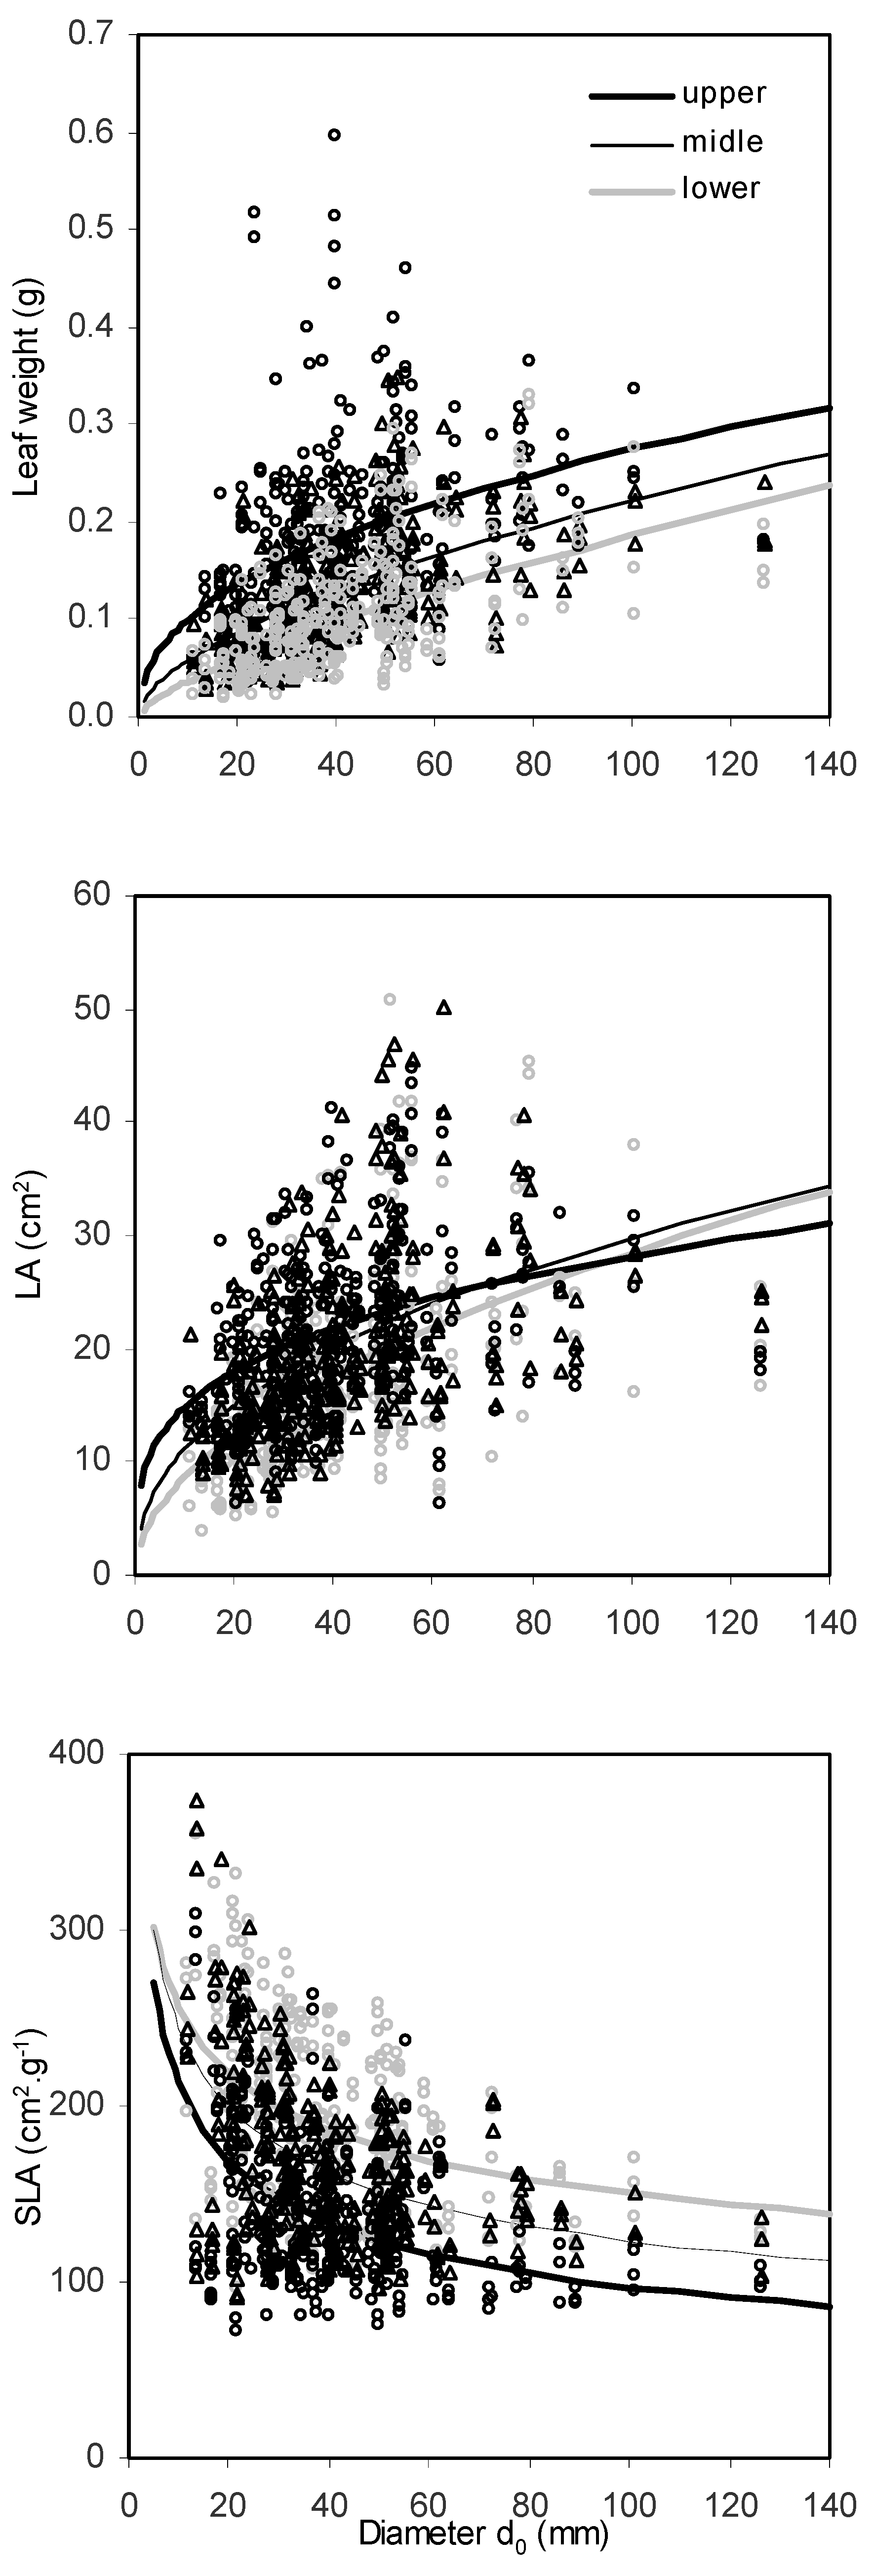
The values of the measured leaves revealed high variation in all the assessed leaf characteristics, i.e., leaf mass (from 0.019 to 0.513 g), leaf area (between 3.79 and 50.81 cm2) as well as SLA (71.33 to 374.24 cm2 g−1; Table 4). Leaf mass of individual leaves differed along the vertical crown profile, with the heaviest leaves in the upper crown part and the lightest ones in the bottom part of the crown (Figure 3a). At the same time, leaf area increased with tree size as represented by d0 diameter (Figure 3b), although differences between the crown parts were less evident than in leaf mass. The influence of leaf position in the crown and tree size on SLA was very evident (Figure 3c). The largest SLA values were found for small trees and lower crown parts. Moreover, differences in SLA between the crown parts increased with tree size.
Our mixed models (Table 5) also revealed a significant influence of the crown part from which the leaves were sampled. The models confirmed that both leaf mass and leaf area increase from the bottom to the top of the crown, i.e., leaves in the upper crown part have larger values of area and mass than in the middle part, which has larger and heavier leaves than the lower part. In the case of specific leaf area, we found an opposite order, i.e., lower > middle > upper, which means that the specific leaf area of the bottom leaves is greater than the SLA of the middle and upper ones (leaves on the top of the crown can be considered as those with minimum SLA, given the diameter at the base is equal for the samples).
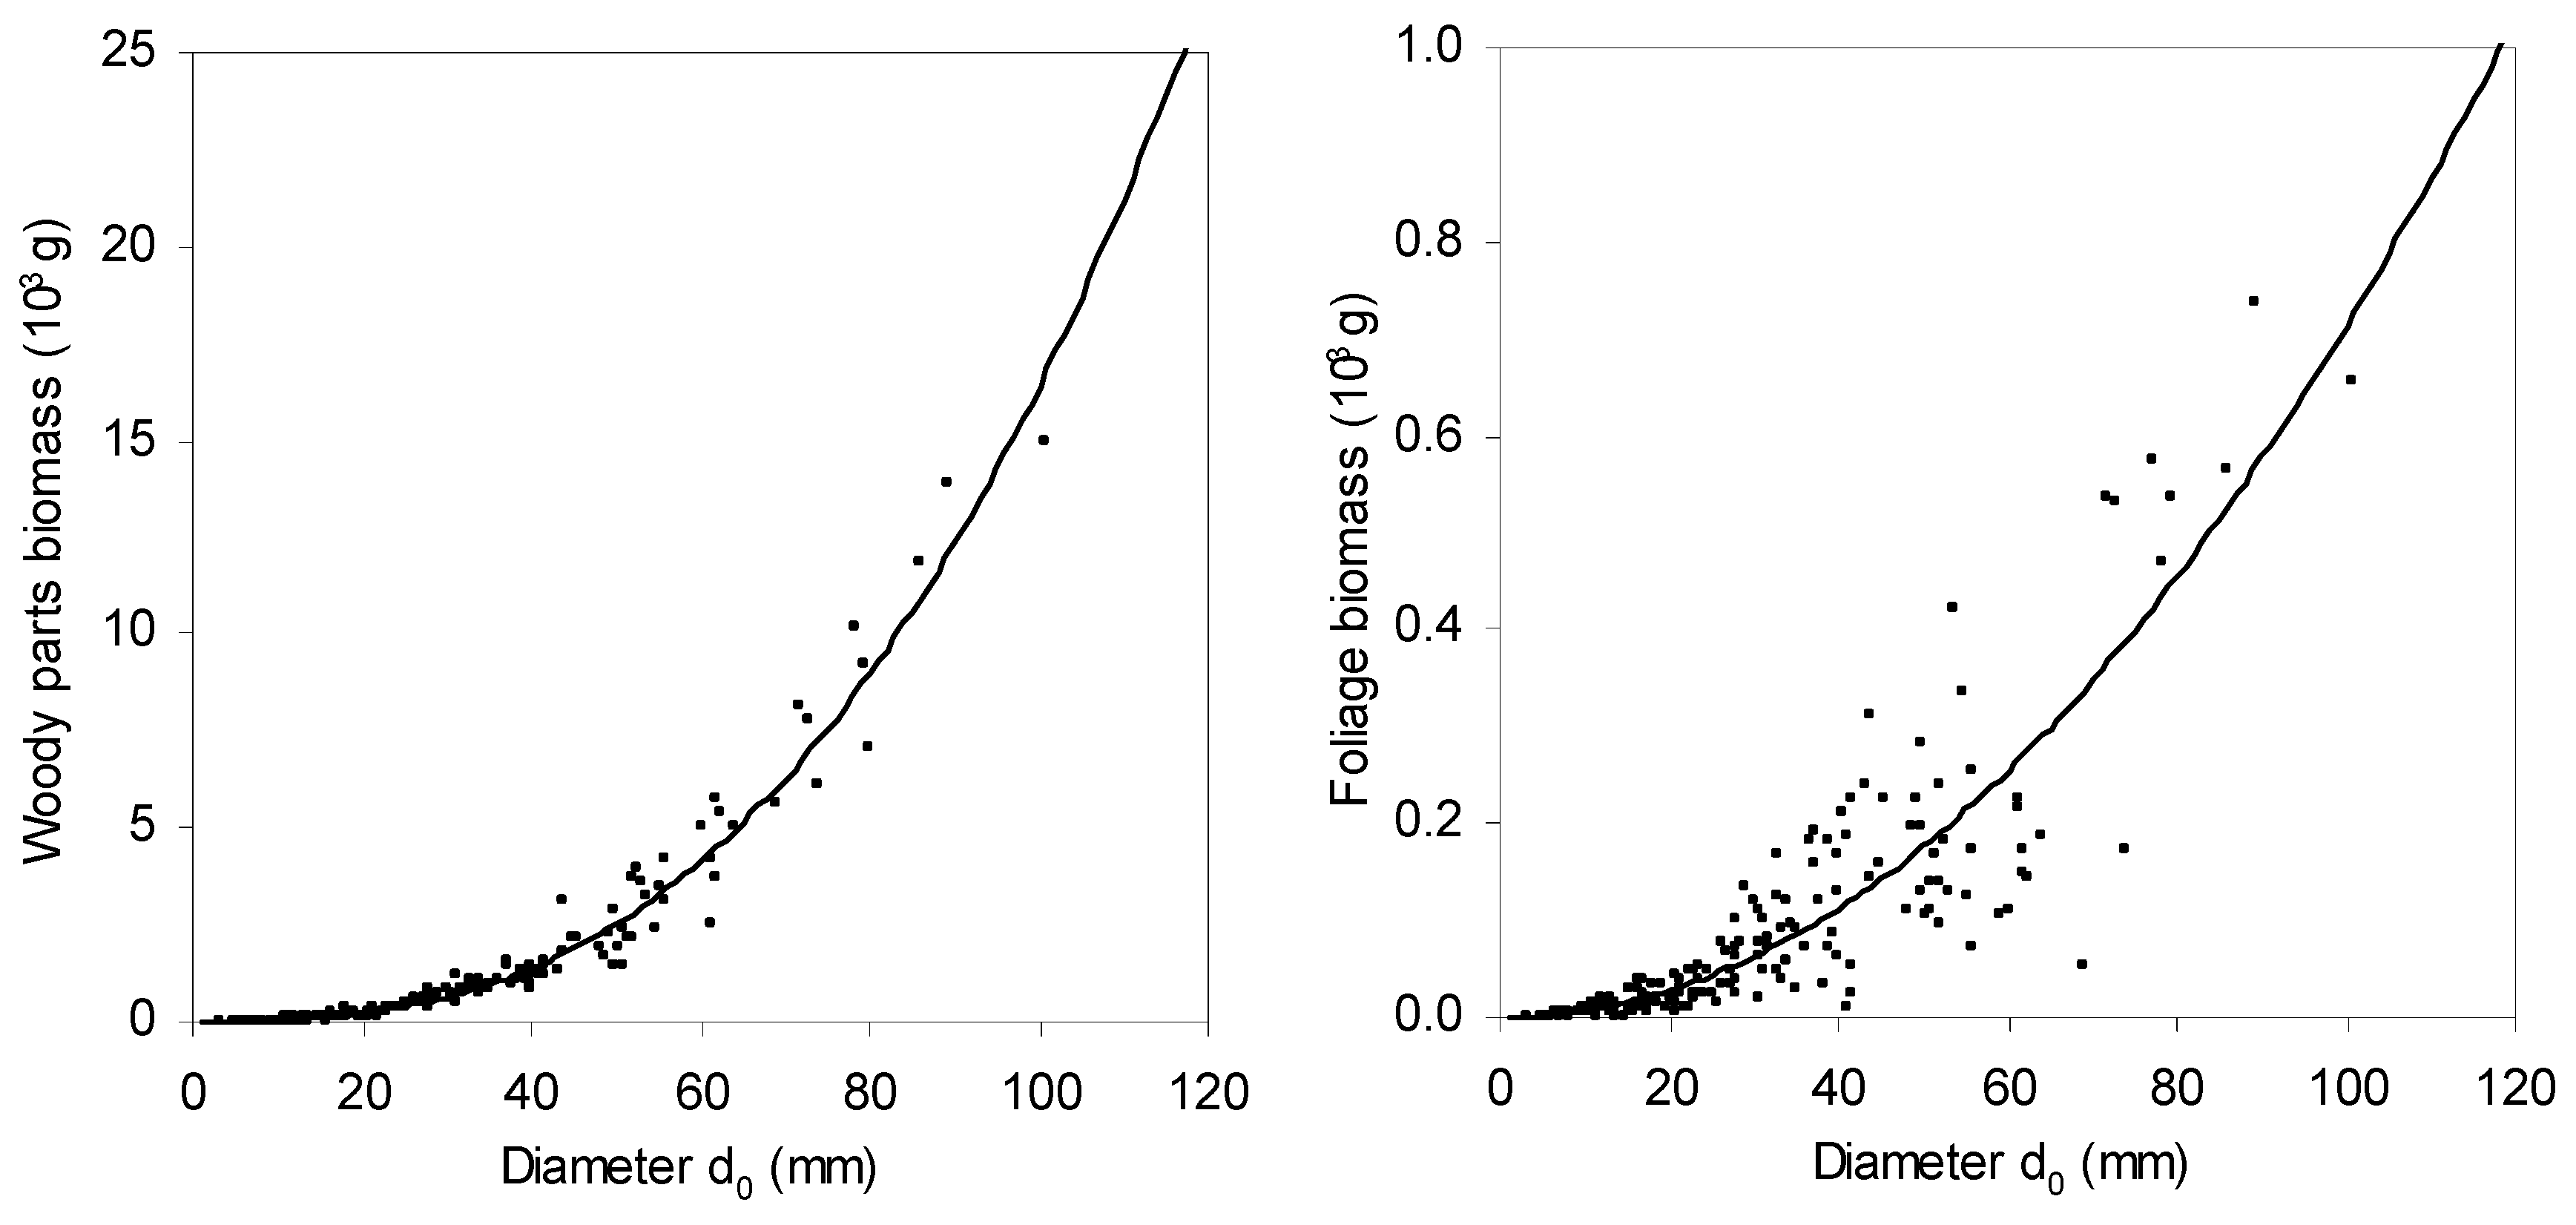
Allometric biomass models for individual tree components as well as for whole-tree biomass showed their close dependences on d0 diameter (in all cases p < 0.001; see Table 6). Fitted values showed that while aspen trees with a diameter of 50 mm had about 2.5 kg of woody biomass and 0.2 kg of foliage biomass, individuals with a diameter of 100 mm had 16.4 kg of biomass in woody parts and 0.7 kg in foliage (Figure 4). This means that biomass in woody parts increased with tree size faster (in the 
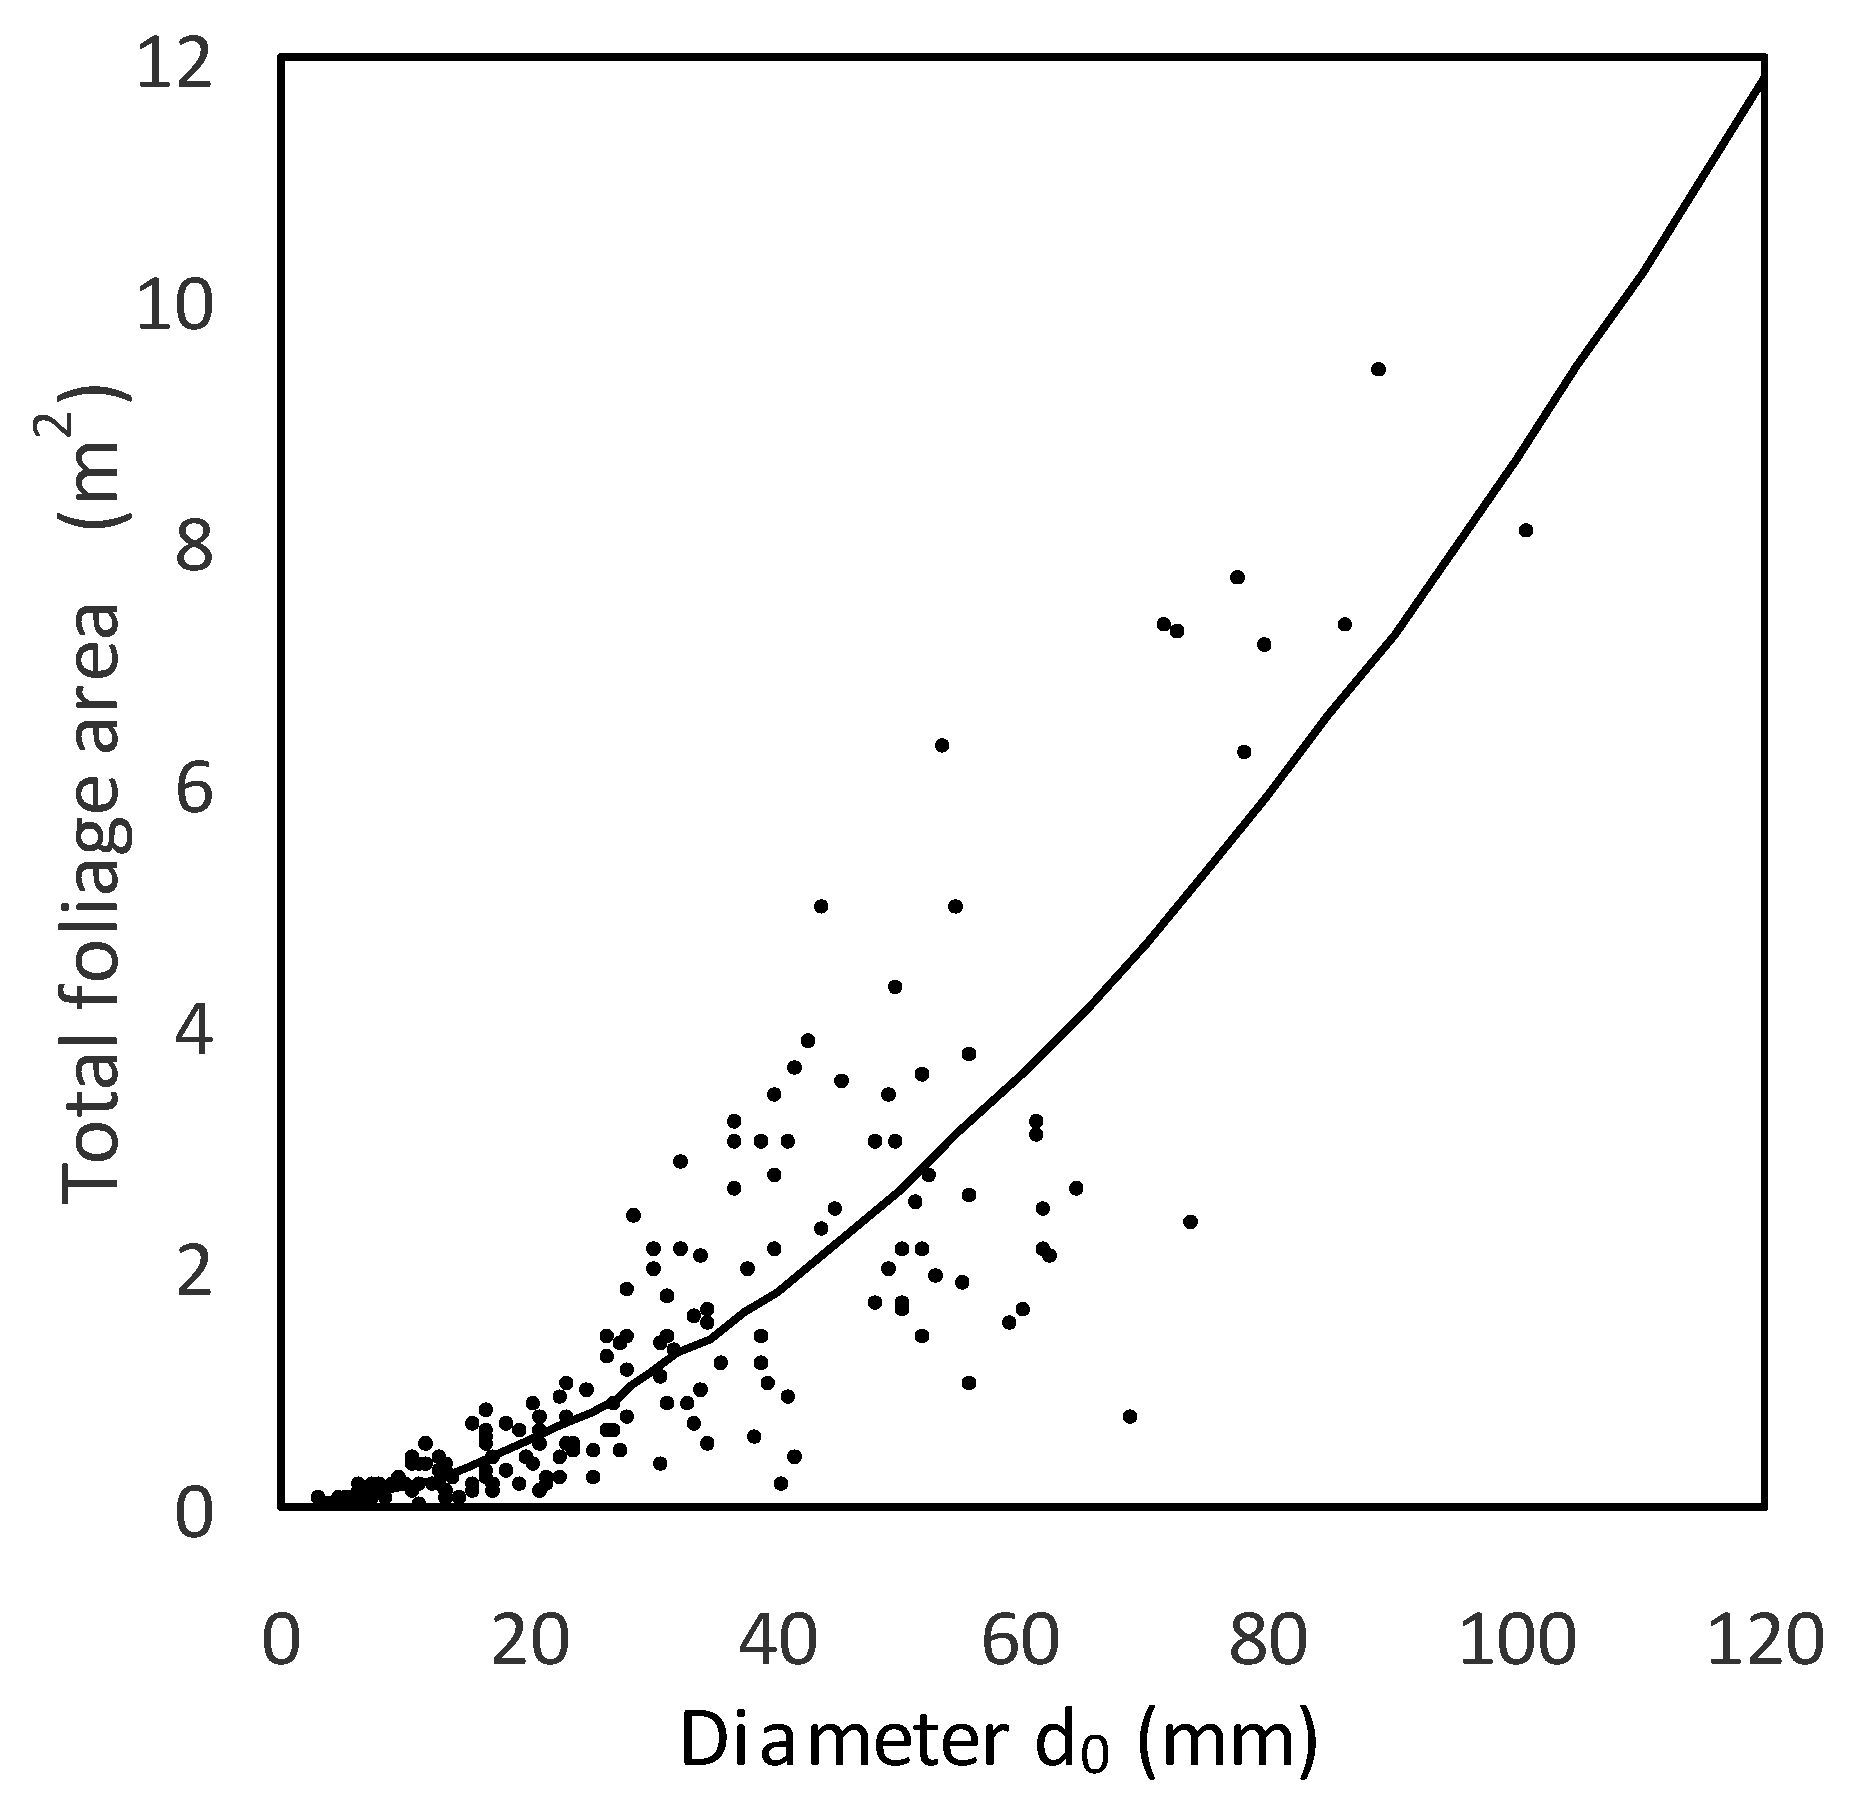
d0 interval 50–100 mm as much as 6.6 times) than in foliage (in the diameter interval 50–100 mm only by 3.5 times). If foliage area at a tree level is considered, increase in the d0 interval from 50 mm to 100 mm was from 2.6 m2 to 8.7 m2 (tripled value; 
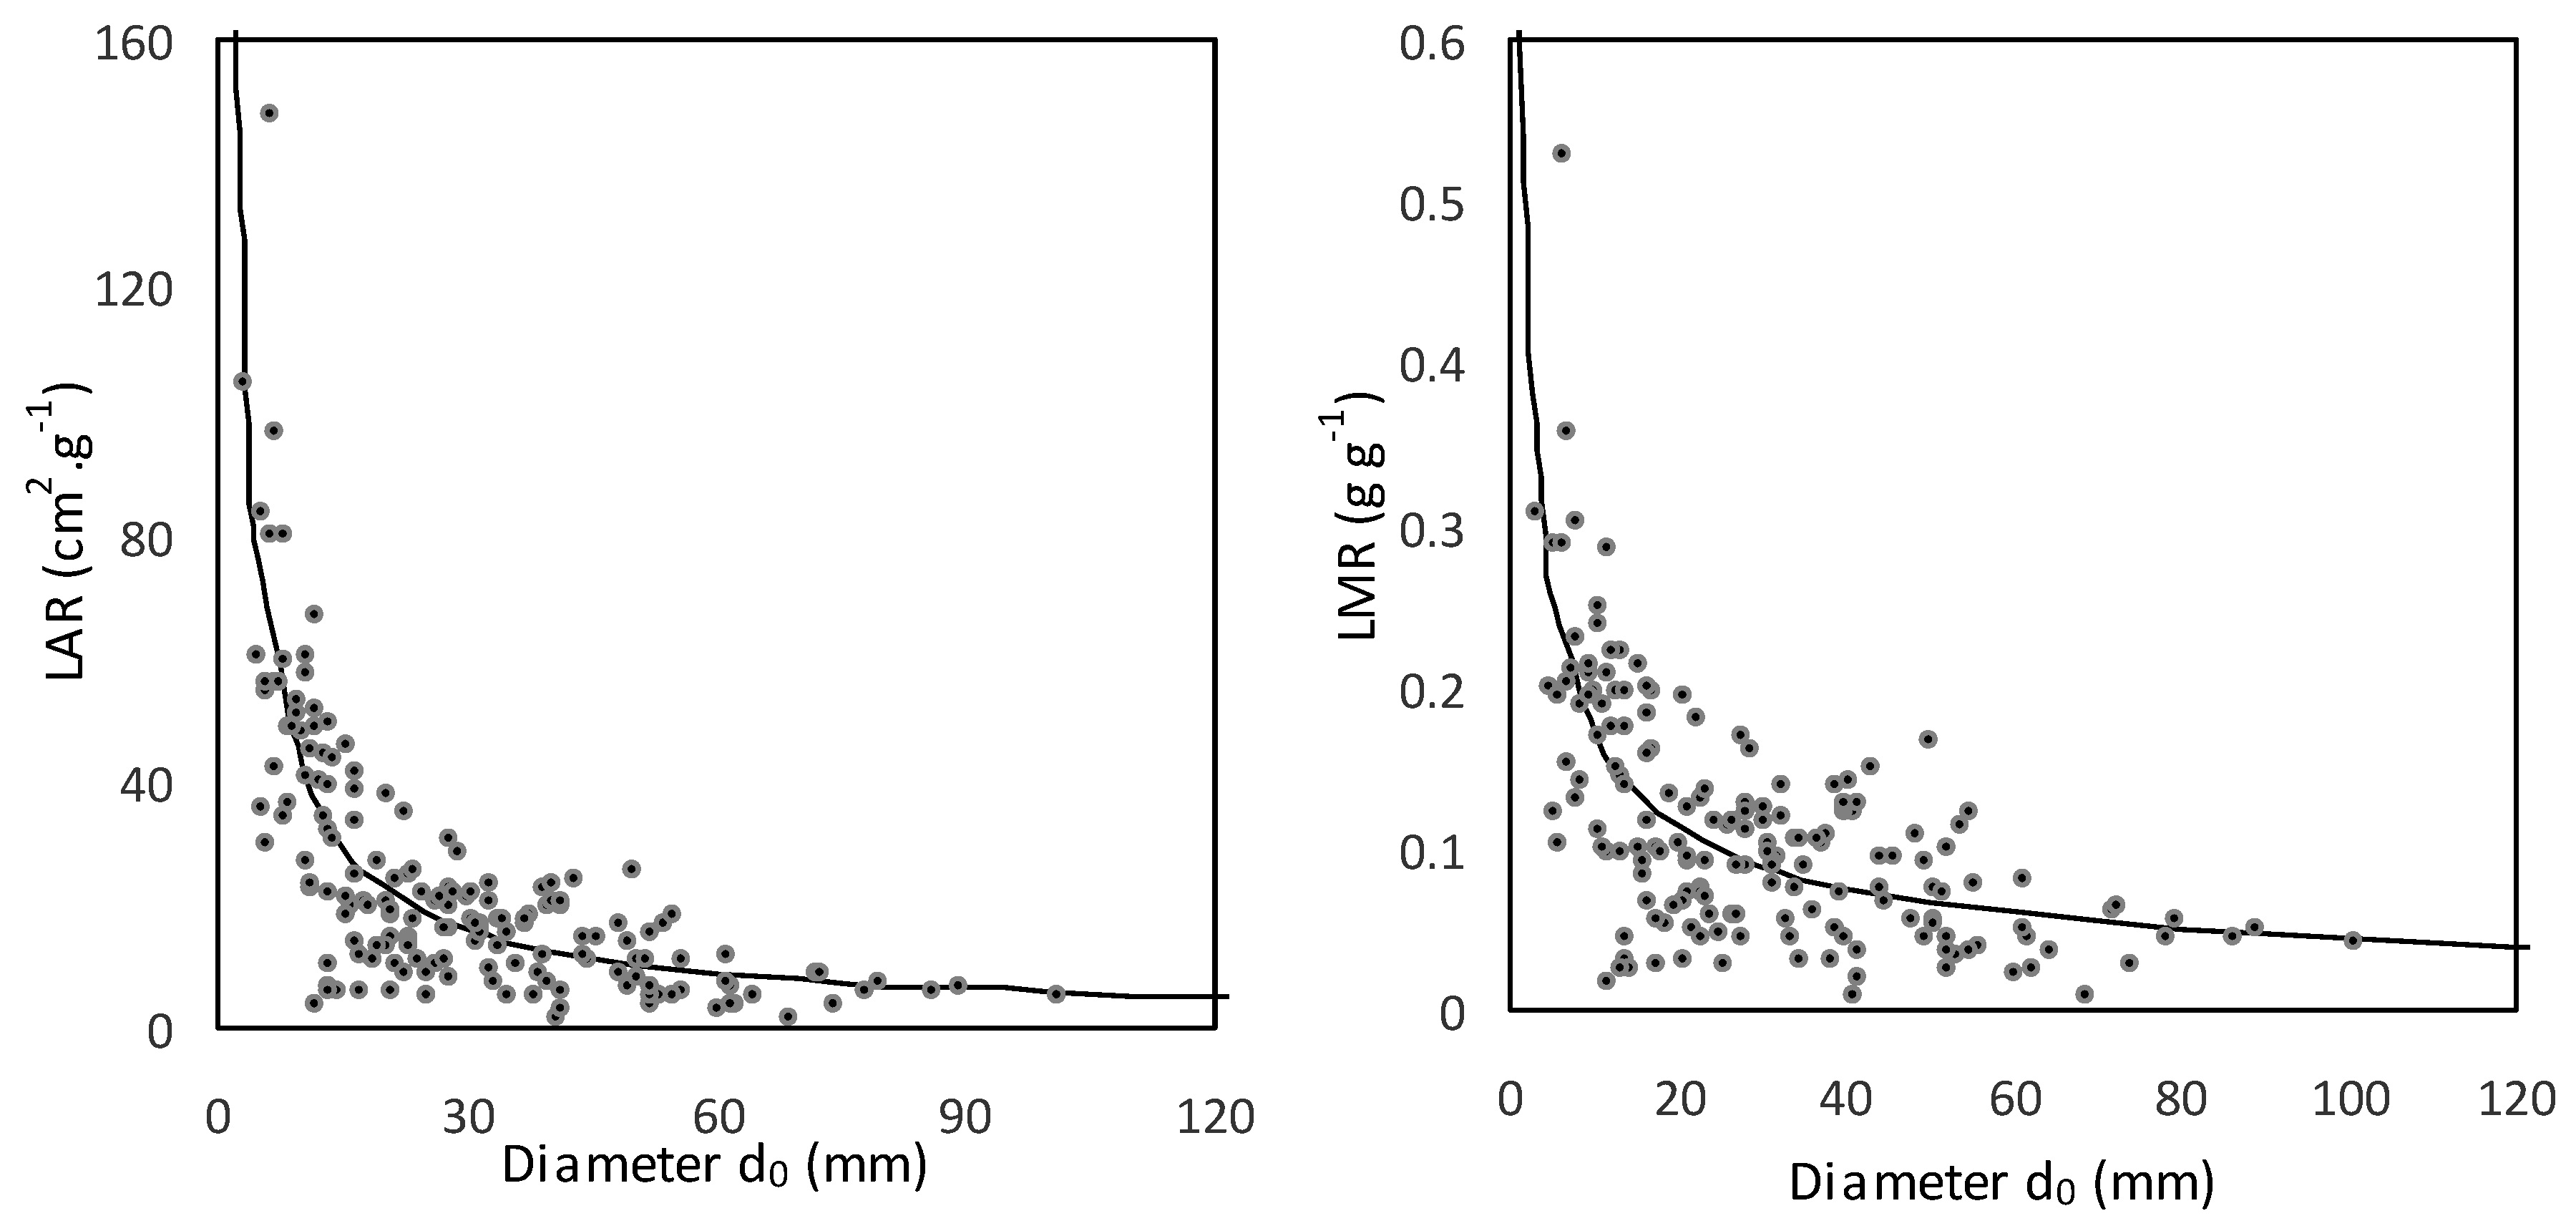
Figure 5). As for LAR and LMR, both indicators decreased with tree size (Figure 6; Table 7). This fast decrease was typical in very small trees (with d0 below approximately 20 mm); then the trend became milder.
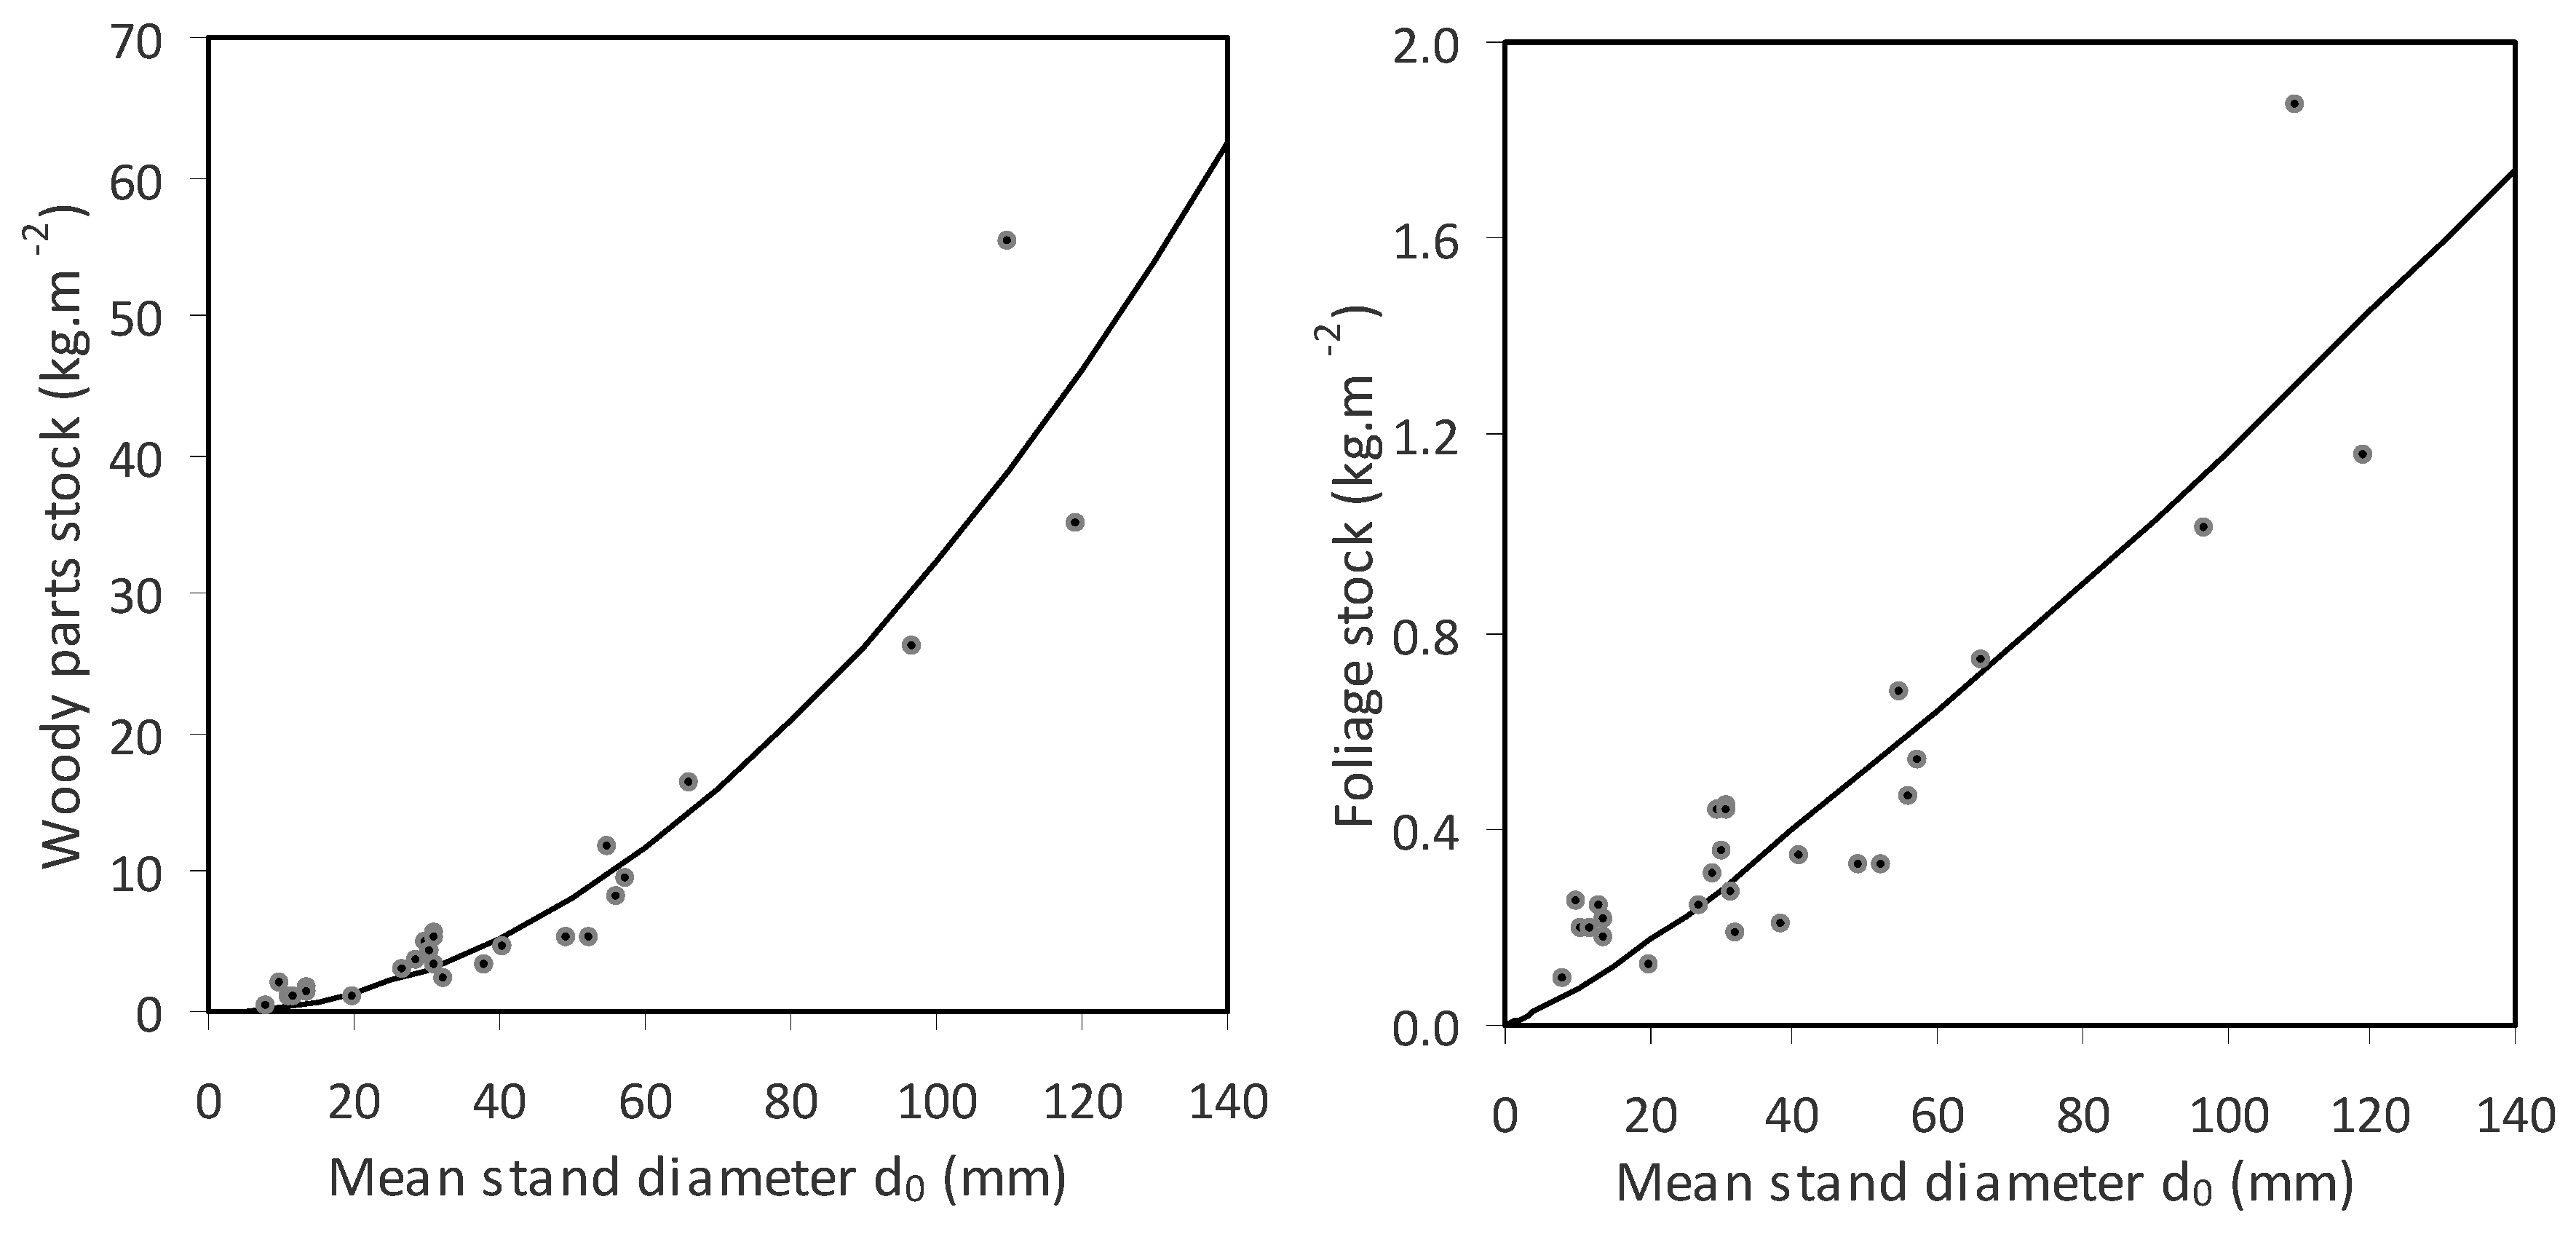
Finally, quantities of woody parts and foliage were estimated at the stand level. The fitted curves (Figure 7 and Table 8) showed that the increase in stand biomass in woody parts with an increasing d0 was greater than the increase in foliage biomass. For instance, while an aspen stand with a mean diameter d0 of 50 mm had about 8 kg of biomass in woody parts per m2, a stand with a d0 of 100 mm contained about 32 kg of woody biomass per m2. This represents a fourfold increase. On the other hand, the difference between the aspen stands with mean diameters d0 of 50 mm and 100 mm was only doubled (0.5 kg m−2 versus 1.2 kg m
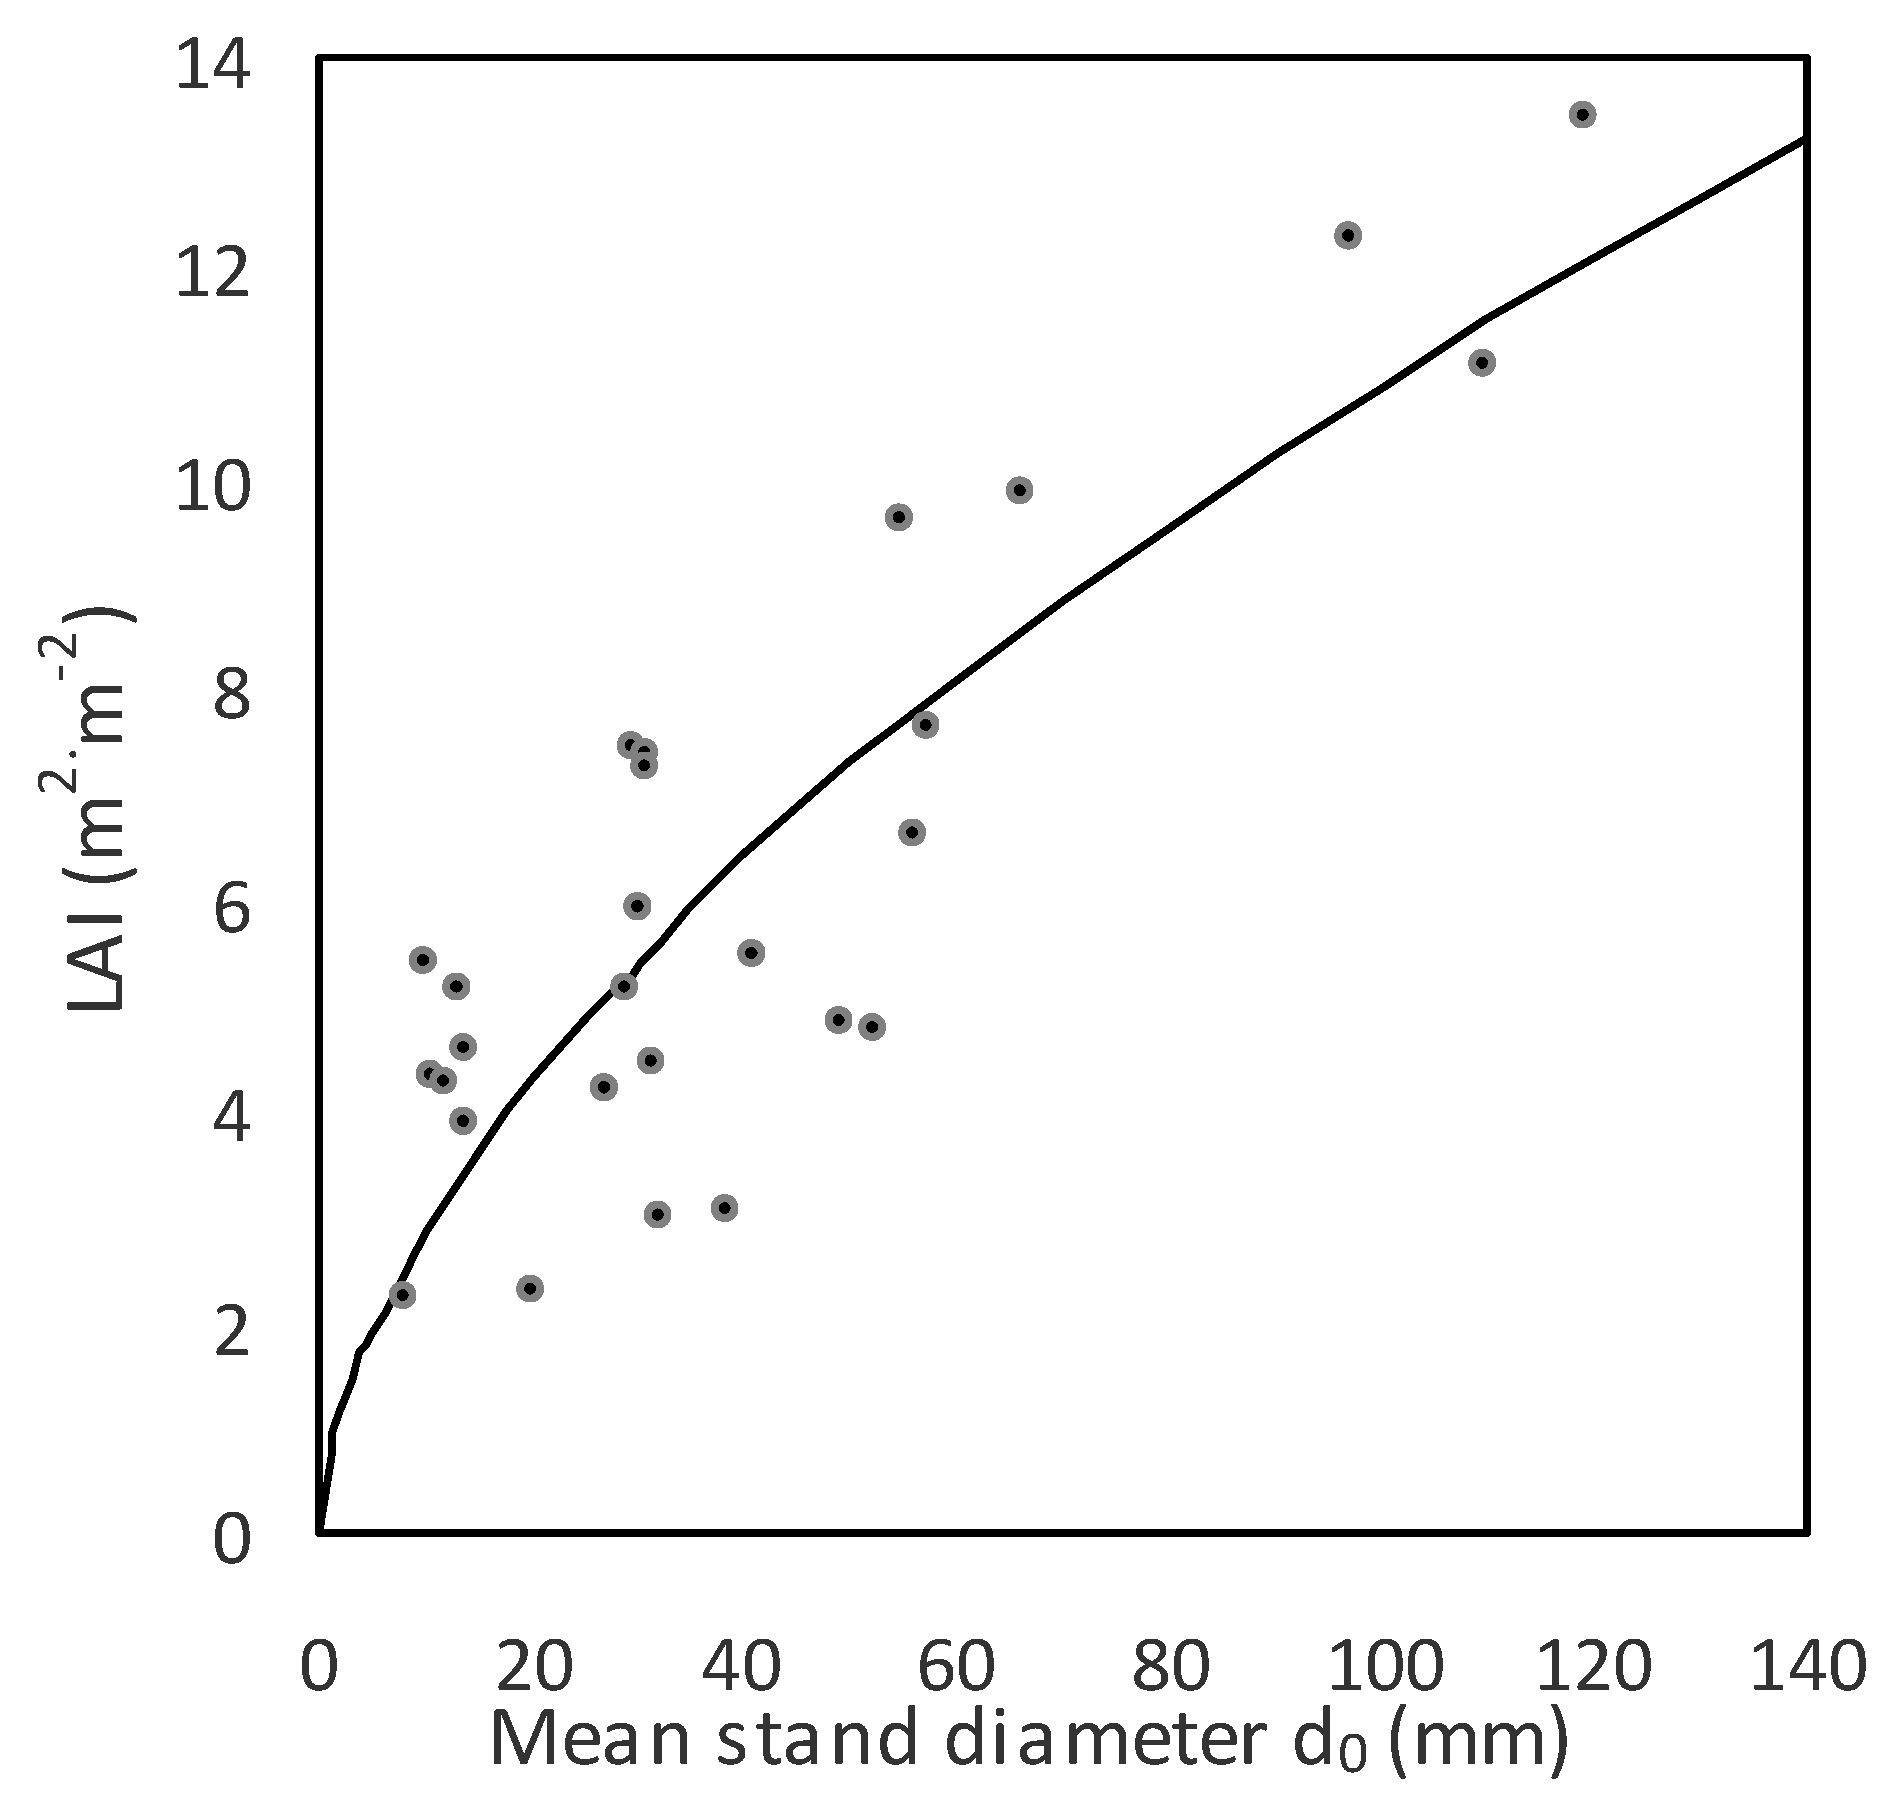
−2). Values of LAI increased with d0 first fast, and then more slowly (Figure 8, Table 8). For instance, while a stand with d0 equal to 50 mm had an LAI of 7.3 m2 m−2, the LAI of a stand with a d0 of 100 mm was 10.9 m2 m−2. The greatest value of LAI equal to 13.5 was found in the aspen forest with a mean stand diameter d0 of 120 mm.

4. Discussion

4.1. Foliage- and Tree-Level Traits

Foliage traits are important characteristics that specify the rate of absorbing photosynthetically active radiation used in photosynthesis (leaf surface area), the metabolic costs of leaf construction (leaf mass), and the efficiency with which the leaf captures light relative to the biomass invested in the plant biomass (leaf mass ratio) or leaf (specific leaf area). Their values obtained from field measurements are required not only for the assessment of the trade-off between ecosystem mass and energy balance, but also for accurate parametrisation and predictions of forest growth by process-based models [39]. Increasing mass and area of single leaves with tree size was typical for young common aspen trees, while the opposite situation was found for SLA. Besides tree size, the position of the leaves along the vertical crown profile appeared to be important for foliage properties, more clearly for leaf mass and SLA than leaf area.
Our study indicated that while smaller trees had larger (as for area) leaves in the upper crown part and smallest in the lower crown part, the situation in bigger trees was reversed. Larger leaves in the upper crown part were also found for European beech trees with a d0 diameter below 60 mm [40]. Similarly, [41] showed that shade leaves in young beech stands had prevailingly lower leaf areas than sunlit leaves. A reverse situation was recorded in old beech stands [42,43]. The increase of SLA from the top to the bottom of the crown was demonstrated also in other works [40,42,44,45]. It seems that SLA is a better indicator of foliage plasticity to environmental factors, especially light conditions [42,46], than the area of an individual leaf.
Our results showed that the SLA of common aspen leaves fluctuated between approx. 100 and 300 cm2 g−1. Other published values of SLA for common aspen varied from 39 to 182 cm2 g−1 [4], i.e., they were lower than most of our values (Figure 3c) although they represented stands of similar ages (from 5 to 24 years). The results from European beech stands showed SLA values similar to our results, ranging from 80 to 480 cm2 g−1 [41,42,44,47,48].
The values of LMR for small aspen trees were high and sharply decreased with tree size. The LMR of aspen trees with a d0 diameter of about 20 mm was below 0.1, while the LMR of trees with a d0 of 80 mm reached a value of only about 0.05. Our previous study [49] for Fagus sylvatica and Quercus petraea showed that the LMR of trees with a d0 between 20 and 80 mm decreased from 0.2 to 0.1 and from 0.15 to 0.10, respectively. These values indicate that in the investigated diameter interval, the contribution of foliage to total biomass of Fagus sylvatica and Quercus petraea was double the foliage contribution in aspen. This suggests a high growth efficiency of common aspen in tree biomass production [50].
Our height–diameter model for young common aspen trees showed a steep, almost a linear increase in tree height with increasing d0 (Figure 2). Since we have previously constructed height–diameter models for other tree species [51], we were able to analyse inter-specific differences. We compared aspen versus seven other broadleaved tree species, i.e., Fagus sylvatica, Carpinus betulus, Quercus petraea, Acer pseudoplatanus, Fraxinus excelsior, Salix caprea, and Sorbus aucuparia. The comparison showed that aspen trees were higher than the trees of other species with the same d0 diameter. For instance, while aspen with a d0 equal to 80 mm was approximately 9 m tall, the height of Acer pseudoplatanus was only 8 m, Carpinus betulus was 7 m, and all other species were less than 7 m tall. This indicates that in comparison with other species young aspen trees invest more carbohydrates into height increment than into radial stem increment. From the point of inter-specific competition for light, that might be its advantage in young mixed stands. In this context, for instance, [31] pointed out the very high competitive ability of aspen, especially on fertile soils with fresh moisture conditions.
The calculated mean woody biomass value of the investigated common aspen trees was lower than the published values from young hybrid aspen stands (see e.g., [31,52,53]) or other poplar cultivars [54] of similar ages, while the range of our values was usually greater than in other studies. This was expected since our trees originated from natural regeneration, while the other studies dealt with trees from plantations established for biomass production.

4.2. Stand Level Traits

Mean woody stand biomass stock of young common aspen at our plots was 8.20 ± 12.30 kg/m2. The value does not significantly differ from other published values, e.g., [31] reported an average value of aboveground woody biomass for his hybrid aspen stands equal to 13.5 ± 5.3 kg/m2. Similar to tree biomass, the variability in stand biomass between plots was large (Figure 7). A wide range of aboveground stand biomass values was also reported in other studies, e.g., the aboveground biomass of hybrid aspen stands in Sweden ranged from 1.43 to 21.9 kg/m2 [31,55], or young common aspen stands aged below 20 years included in the Eurasian database [56,57] were characterised by aboveground biomass values ranging from 1.6 to 10.99 kg/m2. Faster biomass accumulation has been documented at fertile sites with good soil conditions [30].
Stand biomass stock of woody tree parts in young common aspen forests exponentially increased with increasing stand dimensions (mean stand diameter d0), while foliage biomass stock increased almost linearly (Figure 7). Hence, the ratio between woody part biomass and foliage biomass in an aspen forest with a mean stand stem base diameter of 50 mm was approximately 20, the same ratio was almost 30 if the mean stand diameter was 100 mm. These changes with stand development reflect not only the physiological (increasing growth efficiency) but also production–ecological aspects of forests, especially their carbon sequestration potential. Woody parts represent long-term carbon cycling components, while leaves store carbon only for a short time. Approximately 1/20 of total tree biomass annually falls off on the ground in young aspen forests with a mean stand diameter of 50 mm, while in the stand with a diameter of 100 mm it is only 1/30 (here we obviously neglected tree mortality as a source of carbon transfer from biomass to necromass). Foliage litter was estimated to be about 0.5 kg per m2 and 1.1 kg per m2 in stands with a d0 mean diameters of 50 mm and 100 mm, respectively. A similar decrease in foliage contribution to total tree biomass has been recorded in beech [58] or birch stands [1].
The LAI of our aspen stands fluctuated between 2 m2 m−2 and 14 m2 m−2. The maximum estimated value of nearly 14 m2 m−2 is greater than the values published in most of the other papers covering a variety of forest tree species (often European beech) [46,47,59,60,61,62,63]. The prevailing part of the other papers presented LAI values up to 10 m2 m−2. In fact, the results of most papers originated from older growth stages than in our case. The few papers that showed LAI values near 14 m2 m−2 [64,65,66,67] originated from young growth stages. This might suggest that forest stands reach their maximum LAI in the young stages and after that the values decrease with stand development, which has already been documented for Norway spruce [65]. Our results bring new findings about biomass allocation and foliage traits of common aspen at both the tree and stand levels. Since this kind of study has been missing for common aspen, our results might not be compared or synthesized with other knowledge. To obtain biomass information about less abundant and/or currently commercially unimportant species, foresters often use equations adopted from the already published sources, or those developed for other species. However, such an approach may cause a significant bias in the obtained estimates, since growing conditions and tree properties vary across the regions and country-specific models also differ from each other [67]. Comparison of different models for birch showed that non-local models may overestimate total aboveground biomass of thin trees with a diameter at breast height below 4 cm [68]. Moreover, equations derived 20 years before or more may no longer be valid due to the recent changes in environmental conditions [69]. Hence, model updates are required even for thoroughly studied commercial species.

5. Conclusions

This study brings novel findings for a very productive tree species with modest ecological demands, but competitive to other plant species (both weeds and trees). Therefore, it might be planted on sites which are not attractive and/or suitable for traditionally important commercial tree species (e.g., European beech and Norway spruce). Moreover, the species could be very useful especially for energy production. A rapid increase in bioenergy demands has been predicted for most future scenarios, considering especially ecological (e.g., global carbon balance) and technological issues [70]. Biomass of short-living tree species may significantly contribute to bioenergy production and carbon sequestration [71]. Therefore, we believe that our results might be significant for both theoretical (e.g., biomass production and partitioning modelling) and practical (forestry and agro-forestry stakeholders) purposes.

Author Contributions

Conceptualization, B.K.; data curation, J.P. and V.Š.; funding acquisition, B.K.; investigation, B.K., J.P. and V.Š.; methodology, B.K. and P.S.; visualisation, J.P. and V.Š; supervision, B.K.; writing—original draft, B.K., J.P., V.Š., P.S. and K.M.; writing—review and editing, B.K. and K.M. All authors have read and agreed to the published version of the manuscript.

Funding

This research was funded by grant “EVA4.0”, No. CZ.02.1.01/0.0/0.0/16_019/0000803 financed by OP RDE, also by the projects APVV-0584-12 and APVV-18-0086 from the Slovak Research and Development Agency as well as by the project “Research and innovation for supporting competitiveness of the Slovak forestry sector” (SLOV-LES) financed by the Ministry of Land Management and Rural Development of the Slovak Republic.

Conflicts of Interest

The authors declare no conflict of interest.

References

  1. Jagodzinski, A.M.; Dyderski, M.; Horodecki, P. Tree- and Stand-Level Biomass Estimation in a Larix decidua Mill. Chronosequence. Forests 2018, 9, 587. [Google Scholar] [CrossRef] [Green Version]
  2. Merganičová, K.; Merganič, J.; Lehtonen, A.; Vacchiano, G.; Sever, M.; Augustynczik, A.D.; Grote, R.; Kyselová, I.; Mäkelä, A.; Yousefpour, R.; et al. Forest carbon allocation modeling climate change. Tree Physiol. 2019, 39, 1937–1960. [Google Scholar] [CrossRef] [PubMed]
  3. Mensah, S.; Kaki, R.L.G.; Siefert, T. Patterns of biomass allocation between foliage and woody structure: The effects of tree size and specific functional traits. Ann. For. Res. 2016, 59, 49–60. [Google Scholar] [CrossRef] [Green Version]
  4. Forrester, D.I.; Tachauer, I.H.H.; Annighoefer, P.; Barbeito, I.; Pretzsch, H.; Ruiz-Peinado, R.; Stark, H.; Vacchiano, G.; Zlatanov, T.; Charaborty, T.; et al. Generalized biomass and leaf area allometric equations for European tree species incorporating stand structure, tree age and climate. For. Ecol. Manag. 2017, 396, 160–175. [Google Scholar] [CrossRef]
  5. Eggleston, S.; Buedia, L.; Miwa, K.; Ngara, T.; Tanabe, K. IPCC Guidelines for National Greenhouse Gas Inventories; Institute for Global Environmental Strategy: Hayama, Japan, 2006. [Google Scholar]
  6. Jagodzinski, A.M.; Zasada, M.; Bronisz, K.; Bronisz, A.; Bijak, S. Biomass conversion and expansion factors for a chronosequence of young naturally regenerated silver birch (Betula pendula Roth) stands growing on post-agricultural sites. For. Ecol. Manag. 2017, 384, 208–220. [Google Scholar] [CrossRef]
  7. Jagodzinski, A.M.; Dyderski, M.; Gesikiewicz, K.; Horodecki, P.; Cysewska, A.; Wierczynska, S.; Maciejczyk, K. How do tree stand parameters affect young Scots pine biomass?—Allometric equations and biomass conversion and expansion factors. For. Ecol. Manag. 2018, 409, 74–83. [Google Scholar] [CrossRef]
  8. Jagodzinski, A.M.; Dyderski, M.K.; Gęsikiewicz, K.; Horodecki, P. Effects of stand features on aboveground biomass and biomass conversion and expansion factors based on a Pinus sylvestris L. chronosequence in Western Poland. Eur. J. For. Res. 2019, 138, 673–683. [Google Scholar] [CrossRef] [Green Version]
  9. Hommel, R.; Siegwolf, R.T.W.; Zavadlav, S.; Arend, M.; Schaub, M.; Galiano, L.; Haeni, M.; Kayler, Z.; Gessler, A. Impact of interspecific competition and drought on the allocation of new assimilates in trees. Plant Biol. 2016, 18, 785–796. [Google Scholar] [CrossRef]
  10. Yang, X.Z.; Zhang, W.H.; He, Q.Y. Effects of intraspecific competition on growth, architecture and biomass allocation of Quercus liaotungensis. J. Plant Interact. 2019, 14, 284–294. [Google Scholar] [CrossRef] [Green Version]
  11. Pickup, M.; Westoby, M.; Basden, A. Dry mass costs of deploying leaf area in relation to leaf size. Funct. Ecol. 2005, 19, 88–97. [Google Scholar] [CrossRef]
  12. Shipley, B. Net assimilation rate, specific leaf area and leaf mass ratio: Which is most closely correlated with relative growth rate? A meta-analysis. Funct. Ecol. 2006, 20, 565–574. [Google Scholar] [CrossRef]
  13. Milla, R.; Reich, P.B.; Niinemets, U.; Castro-Diez, P. Environmental and developmental controls on specific leaf area are little modified by leaf allometry. Funct. Ecol. 2008, 22, 565–576. [Google Scholar] [CrossRef]
  14. Tomlinson, K.W.; Poorter, L.; Sterck, F.J. Leaf adaptations of ever-green and deciduous trees of semi-arid and humid savannas on three continents. J. Ecol. 2013, 101, 430–440. [Google Scholar] [CrossRef]
  15. Savoy, P.; MacKay, D.S. Modeling the seasonal dynamics of leaf area index based on environmental constraints to canopy development. Agric. For. Meteorol. 2015, 200, 46–56. [Google Scholar] [CrossRef]
  16. Asaadi, A.; Arora, V.K.; Melton, J.R.; Bartlett, P. An improved parameterization of leaf area index (LAI) seasonality in the Canadian Land Surface Scheme (CLASS) and Canadian Terrestrial Ecosystem Model (CTEM) modelling framework. Biogeosciences 2018, 15, 6885–6907. [Google Scholar] [CrossRef] [Green Version]
  17. Worrell, R. European aspen (Populus tremula L.): A review with particular reference to Scotland, I. Distribution, ecology and genetic variation. Forestry 1995, 68, 93–105. [Google Scholar] [CrossRef]
  18. Pagan, J.; Randuška, D. Atlas drevín 1. (Pôvodné dreviny); Obzor: Bratislava, Slovakia, 1987; 360p. [Google Scholar]
  19. Kacálek, D.; Mauer, O.; Podrázský, V.; Slodičák, M.; Holušová, K.; Špulák, O.; Souček, J.; Jurásek, A.; Leugner, J.; Dušek, D. Soil Improving and Stabilizing Functions of Forest Trees; Lesnická práce Ltd.: Prague, Czech Republic, 2017; 300p. [Google Scholar]
  20. San-Miguel-Ayanz, J.; de Rigo, D.; Caudullo, G.; Durrant, T.H.; Mauri, A. European Atlas of Forest Tree Species; Publication Office of European Union: Luxembourg, 2016; 200p. [Google Scholar]
  21. Myking, T.; Bohler, F.; Austrheim, G.; Solberg, E.J. Life history strategies of aspen (Populus tremula L.) and browsing effects: A literature review. Forestry 2011, 84, 61–71. [Google Scholar] [CrossRef] [Green Version]
  22. Baum, C.; Eckhardt, K.-U.; Hahn, J.; Weih, M.; Dimitriou, I.; Leinweber, P. Impact of poplar on soil organic matter quality and microbial communities in arable soils. Plant Soil Environ. 2013, 59, 95–100. [Google Scholar] [CrossRef] [Green Version]
  23. Bergström, R.; Hjeljord, O. Moose and vegetation interactions in northwestern Europe and Poland. Swed. Wildl. Res. Suppl. 1987, 1, 213–228. [Google Scholar]
  24. Konôpka, B.; Pajtík, J.; Bošeľa, M.; Šebeň, V.; Shipley, L.A. Modeling forage potential for red deer (Cervus elaphus): A tree level approach. Eur. J. For. Res. 2020. [Google Scholar] [CrossRef]
  25. Tognetti, R.; Cocozza, C.; Marchetti, M. Shaping the multifunctional tree: The use of Salicaceae in environmental restoration. iForest 2013, 6, 37–47. [Google Scholar] [CrossRef]
  26. Šebeň, V. Národná inventarizácia a monitoring lesov Slovenskej republiky 2015–2016. Lesn. Štud. 2017, 65, 255. [Google Scholar]
  27. Šebeň, V.; Kučera, M.; Meragničová, K.; Konôpka, B. The current state of non-forest land in the Czech Republic and Slovakia—Forest cover estimates based on the national inventory data. Cent. Eur. For. J. 2018, 64, 207–222. [Google Scholar]
  28. Výbohová, E.; Kučerová, V. The changes of selected characteristics of cellulose at water prehydrolysis of poplar (Populus tremula L.) wood. Acta Fac. Xylogiae Zvolen 2013, 55, 77–86. [Google Scholar]
  29. MacKenzie, N. Ecology, Conservation and Management of Aspen. A Literature Review; Scottish Native Woods: Aberfeldy, UK, 2010; 41p. [Google Scholar]
  30. Tullus, A.; Rytter, L.; Tullus, T.; Weih, M.; Tullus, H. Short-rotation forestry with hybrid aspen (Populus tremula L. × P. tremuloides Michx.) in Northern Europe. Scand. J. For. Res. 2012, 27, 10–29. [Google Scholar] [CrossRef]
  31. Johansson, T. Biomass production of hybrid aspen growing on former farm land in Sweden. J. For. Res. 2013, 24, 237–246. [Google Scholar] [CrossRef]
  32. Fahlvik, N.; Rytter, L.; Stener, L.G. Production of hybrid aspen on agricultural land during one rotation in southern Sweden. J. For. Res. 2019. [Google Scholar] [CrossRef]
  33. Easlon, H.M.; Bloom, A.J. Easy Leaf Area: Automated digital image analysis for rapid and accurate measurement of leaf area. Appl. Plant Sci. 2014, 2, 1400033. [Google Scholar] [CrossRef]
  34. Pajtík, J.; Konôpka, B.; Lukac, M. Biomass functions and expansion factors in young Norway spruce (Picea abies [L.] Karst) trees. For. Ecol. Manag. 2008, 256, 1096–1103. [Google Scholar] [CrossRef]
  35. Cienciala, E.; Černý, M.; Tatarinov, F.; Apltauer, J.; Exnerová, Z. Biomass function applicable to Scots pine. Trees 2016, 20, 483–495. [Google Scholar] [CrossRef]
  36. Lai, J.; Yang, B.; Lin, D.; Kerkhoff, A.J.; Ma, K. The allometry of coarse root biomass: Long-transformed linear regression or nonlinear regression? PLoS ONE 2013, 8, e77007. [Google Scholar] [CrossRef] [PubMed] [Green Version]
  37. Mascaro, J.; Litton, C.M.; Hughes, R.F.; Uowolo, A.; Schnitzer, S.A. Is logarithmic transformation necessary in allometry? Ten, one-hundred, one-thousand-time yes. Biol. J. Linn. Soc. Lond. 2014, 111, 230–233. [Google Scholar] [CrossRef] [Green Version]
  38. R Development Core Team. R: A Language and Environment for Statistical Computing; R foundation for Statistical Computing: Vienna, Austria, 2012; Available online: http://www.R-project.org/ (accessed on 10 February 2012).
  39. Marshall, J.D.; Monserud, R.A. Foliage height influences specific leaf area of three conifer species. Can. J. For. Res. 2003, 33, 164–170. [Google Scholar] [CrossRef] [Green Version]
  40. Konôpka, B.; Pajtík, J. Similar foliage area but contrasting foliage biomass between young beech and spruce stands. Cent. Eur. For. J. 2014, 60, 205–213. [Google Scholar]
  41. Closa, I.; Irigoyen, J.J.; Goicoechea, N. Microclimatic conditions determined by stem density influence leaf anatomy and leaf physiology of beech (Fagus sylvatica L.) growing within stands that naturally regenerate from clear-cutting. Trees 2010, 24, 1029–1043. [Google Scholar] [CrossRef]
  42. Barna, M. Adaptation of European beech (Fagus sylvatica L.) to different ecological conditions: Leaf size variation. Pol. J. Ecol. 2004, 52, 35–45. [Google Scholar]
  43. Scartazza, A.; Di Baccio, D.; Bertolotto, P.; Gavrichova, O.; Matteucci, G. Investigating the European beech (Fagus sylvatica L.) leaf characteristics along the vertical canopy profile: Leaf structure, photosynthetic capacity, light energy dissipation and photoprotection mechanisms. Tree Physiol. 2016, 36, 1060–1076. [Google Scholar] [CrossRef] [Green Version]
  44. Bartelink, H.H. Allometric relationships for biomass and leaf area of beech (Fagus sylvatica L). Ann. Sci. For. 1997, 54, 39–50. [Google Scholar] [CrossRef] [Green Version]
  45. Petritan, A.M.; von Lupke, B.; Petritan, I.C. Influence of light availability on growth, leaf morphology and plant architecture of beech (Fagus sylvatica L.) maple (Acer psuedoplatanus L.) and ash (Fraxinus excelsior L.) saplings. Eur. J. For. Res. 2009, 128, 61–74. [Google Scholar] [CrossRef] [Green Version]
  46. Meier, I.C.; Leuschner, C. Leaf size and leaf area index in Fagus sylvatica forests: Competing effects of precipitation, temperature, and nitrogen availability. Ecosystems 2008, 11, 655–669. [Google Scholar] [CrossRef] [Green Version]
  47. Bouriaud, O.; Soudani, K.; Bréda, N. Leaf area index from litter collection: Impact of specific leaf area variability within a beech stand. Can. J. Remote Sens. 2003, 29, 371–380. [Google Scholar] [CrossRef] [Green Version]
  48. Leuschner, C.; Voss, S.; Foetzki, A.; Clases, Y. Variation in leaf area index and stand leaf mass of European beech across gradients of soil acidity and precipitation. Plant Ecol. 2006, 186, 247–258. [Google Scholar] [CrossRef]
  49. Pajtík, J.; Konôpka, B.; Lukac, M. Individual biomass factors for beech, oak and pine in Slovakia: A comparative study in young naturally regenerated stands. Trees 2011, 25, 277–288. [Google Scholar] [CrossRef]
  50. Gersonde, R.; O’Hara, K.L. Comparative tree growth efficiency in Sierra Nevada mixed-conifer forests. For. Ecol. Manag. 2005, 219, 95–108. [Google Scholar] [CrossRef]
  51. Pajtík, J.; Konôpka, B.; Šebeň, V. Mathematical Biomass Models for Young Individuals of Forest Tree Species in the Region of the Western Carpathians; National Forest Centre: Zvolen, Slovakia, 2018; 89p. [Google Scholar]
  52. Tullus, A.; Tullus, H.; Soo, T.; Pärn, L. Above-ground biomass characteristics of young hybrid aspen (Populus tremula L. × P. tremuloides Michx.) plantations on former agricultural land in Estonia. Biomass Bioenergy 2009, 33, 1617–1625. [Google Scholar] [CrossRef]
  53. Jansons, A.; Rieksts-Riekstins, J.; Senhofa, S.; Katrevics, J.; Lazdina, D.; Sisenis, L. Above-ground Biomass Equations of Populus Hybrids in Latvia. Balt. For. 2017, 23, 507–514. [Google Scholar]
  54. Niemczyk, M.; Wojda, T.; Kaliszewski, A. Biomass productivity of selected poplar (Populus spp.) cultivars in short rotations in northern Poland. N. Z. J. For. Sci. 2016, 46, 22. [Google Scholar] [CrossRef] [Green Version]
  55. Johansson, T. Biomass equations for determining fractions of European aspen growing on abandoned farmland and some practical implications. Biomass Bioenergy 1999, 17, 471–480. [Google Scholar] [CrossRef]
  56. Usoltsev, V.A. Eurasian Forest Biomass and Primary Production Data; Ural Branch of Russian Academy of Sciences: Yekaterinburg, Russia, 2010; 570p. [Google Scholar]
  57. Usoltsev, V.A. Forest Biomass and Primary Production Database for Eurasia: CD-Version, 2nd ed.; Enlarged and Reharmonized; Ural State Forest Engineering University: Yekaterinburg, Russia, 2013. [Google Scholar]
  58. Šebeň, V.; Konôpka, B.; Pajtík, J. Quantifying carbon in dead and living trees; a case study in young beech and spruce stand over 9 years. Cent. Eur. For. J. 2017, 63, 133–141. [Google Scholar] [CrossRef] [Green Version]
  59. Gond, V.; de Pury, D.G.G.; Veroustraete, F.; Ceulemans, R. Seasonal variation in leaf area index, leaf chlorophyll, and water content: Scaling-up to estimate fPAR and carbon balance in a multilayer, multispecies temperate forest. Tree Physiol. 1999, 19, 673–679. [Google Scholar] [CrossRef] [Green Version]
  60. Gower, S.T.; Kucharik, C.J.; Norman, J.N. Direct and indirect estimation of leaf area index, fAPAR and net primary production of terrestrial ecosystems. Remote Sens. Environ. 1999, 70, 29–51. [Google Scholar] [CrossRef]
  61. Bréda, N.J.J. Ground-based measurements of leaf area index: A review of methods, instruments and current controversies. J. Exp. Bot. 2003, 54, 2403–2417. [Google Scholar] [CrossRef] [PubMed]
  62. Thimonier, A.; Sedivy, I.; Schleppi, P. Estimating leaf area index in different types of mature forest stands in Switzerland: A comparison of methods. Eur. J. For. Res. 2010, 129, 543–562. [Google Scholar] [CrossRef]
  63. Ariza-Carricondo, C.; Di Mauro, F.; De Beck, M.O.; Roland, M.; Gielen, B.; Vitale, D.; Ceulemans, R.; Papale, D. A comparison of different methods for assessing leaf area index in four canopy types. Cent. Eur. For. J. 2019, 65, 67–80. [Google Scholar] [CrossRef] [Green Version]
  64. Tadaki, Y. Studies on the production structure of forest. XVII. Vertical change of specific leaf area in forest canopy. J. Jpn. For. Soc. 1970, 52, 263–268. [Google Scholar]
  65. Pokorný, R.; Stojnič, S. Leaf area index in Norway spruce stands in relation to age and defoliation. Beskydy 2012, 5, 173–180. [Google Scholar] [CrossRef]
  66. Konôpka, B.; Pajtík, J.; Marušák, R.; Bošeľa, M.; Lukac, M. Specific leaf area and leaf area index in developing stands of Fagus sylvatica L. and Picea abies Karst. For. Ecol. Manag. 2016, 364, 52–59. [Google Scholar] [CrossRef]
  67. Neumann, M.; Moreno, A.; Mues, V.; Härkönen, S.; Mura, M.; Bouriaud, O.; Lang, M.; Achten, W.M.J.; Thivolle-Cazat, A.; Bronisz, K.; et al. Comparison of carbon estimation methods for European forests. For. Ecol. Manag. 2016, 361, 397–420. [Google Scholar] [CrossRef]
  68. Bronisz, K.; Strub, M.; Cieszewski, C.; Bijak, S.; Bronisz, A.; Tomusiak, R.; Wojtan, R.; Zasada, M. Empirical equations for estimating aboveground biomass of Betula pendula growing on former farmland in central Poland. Silva Fenn. 2016, 50, 1559. [Google Scholar] [CrossRef] [Green Version]
  69. Lang, M.; Lilleleht, A.; Neumann, M.; Bronisz, K.; Rolim, S.G.; Seedre, M.; Uri, V.; Kiviste, A. Estimation of above-ground biomass in forest stands from regression on their basal area and height. For. Stud. 2016, 64, 70–92. [Google Scholar] [CrossRef] [Green Version]
  70. Lauri, P.; Forsell, N.; Gusti, M.; Korsuo, A.; Havlik, P.; Obersteiner, M. Global Woody Biomass Harvest Volumes and Forest Area Use under Different SSP-RCP Scenarios. J. For. Econ. 2019, 34, 285–309. [Google Scholar] [CrossRef]
  71. Jha, K.K. Biomass production and carbon balance in two hybrid poplar (Populus euramericana) plantations raised with and without agriculture in southern France. J. For. Res. 2018, 29, 1689–1701. [Google Scholar] [CrossRef]
Figure 1. Localization of common aspen stands selected for biomass sampling (namely: 1—Podkonice I, 2—Podkonice II, 3—Telgart, 4—Kasova Lehota, 5—Straze, 6—Dobra Niva, 7—Suchan I, 8—Suchan II, 9—Opava).
Forests 11 00464 g001
Figure 2. Relationship between d0 stem base diameter and tree height derived from the sampled common aspen trees (values of SE were 11.812, 0.693, and 0.009, and the p-values 0.487, < 0.001, and 0.017 for parameters b1, b2, and b3, respectively; MSE = 0.612).
Forests 11 00464 g002
Figure 3. Relationship between d0 stem base diameter and individual leaf mass (upper plate), leaf area (middle plate), or specific leaf area (lower plate) in the sampled common aspen trees with respect to foliage position along the tree crown.
Forests 11 00464 g003
Figure 4. Biomass of woody parts (left plate) and foliage (right plate) in the sampled common aspen trees plotted against the d0 stem base diameter (see also Table 6).
Forests 11 00464 g004
Figure 5. Total tree foliage area of the sampled common aspen trees against the d0 stem base diameter (see also Table 7).
Forests 11 00464 g005
Figure 6. Leaf area ratio (left plate) and leaf mass ratio (right plate) plotted against the d0 stem base diameter of the sampled common aspen trees (see also Table 3).
Forests 11 00464 g006
Figure 7. Stand biomass of woody parts (left plate) and foliage (right plate) in common aspen fully-stocked stands plotted against the d0 mean stand diameter at the stem base (see also Table 8).
Forests 11 00464 g007
Figure 8. Leaf area index of fully-stocked common aspen stands plotted against the d0 mean stand diameter at the stem base (see also Table 8).
Forests 11 00464 g008
Table 1. Site characteristics of the forest stands selected for common aspen sampling and measurements.
Locality Name of LocalityAltitude LongitudeLatitude ExpositionSlope Soil Group
Code(m a.s.l.)(°)(°)(°)(%)
1Podkonice I55048.793219.267222815Rendzina
2Podkonice II54548.793119.267123016Rendzina
3Telgart87048.835920.1711619Cambisol
4Kasova Lehotka61048.620419.0288231121Cambisol
5Straze 33548.586419.089721313Luvisols
6Dobra Niva36548.452219.1003507Cambisol
7Suchan I54048.289719.102235514Luvisols
8Suchan II54048.289619.102335713Luvisols
9Opava52548.199819.223522722Cambisol
Table 2. Stand characteristics of common aspen (mean values and standard deviations were calculated from three circular plots).
Locality CodeName of Locality Mean DiameterS.D.Mean HeightS.D.Mean Canopy S.D.Mean Basal AreaS.D.Mean Number S.D.
d0 (mm) (m) Closure (%) (m2 per are) of Trees (per are)
1Podkonice I30.41.33.290.2477150.3470.125469139
2Podkonice II11.81.91.450.4958160.1330.0171241240
3Telgart26.1162.201.0060170.1140.063380388
4Kasova Lehotka57.97.36.400.509550.6130.24422763
5Straze29.21.84.090.6173310.2890.175432247
6Dobra Niva54.44.35.820.6610000.4930.11721020
7Suchan I30.810.32.990.6483150.1760.05730337
8Suchan II12.71.51.220.215000.1220.014976160
9Opava108.811.29.550.8370331.1090.83912389
Table 3. Descriptive statistics of the sampled common aspen trees.
Tree Parameter (unit)MeanS.D.Min.Max.25th Percentile75th Percentile
Diameter d0 (mm)31.420.03.3100.915.543.1
Height (m)3.812.420.4010.541.874.96
Roots biomass (g)2623761219023310
Stem biomass (g)70012931835230674
Branches biomass (g)2514600277032,813284
Foliage biomass (g)94131173733,878129
Woody parts biomass (g)1397244812,14514,995691391
Whole tree biomass (g)1456253045,80915,651831538
Table 4. Statistical characteristics of leaf traits of the sampled common aspen trees.
Leaf Trait (unit)Crown PartMeanS.D.Min.Max.25th Percentile75th Percentile
Upper0.1710.0790.0290.5130.1140.222
Leaf mass (g)Middle0.1290.0630.0290.3470.0800.168
Lower0.1010.0580.0190.3290.0540.130
Upper21.507.296.3344.6316.3225.50
Leaf area (cm2)Middle19.717.738.2050.2714.1123.84
Lower17.428.103.7950.8111.9821.76
Upper138.8842.6871.33308.17108.16159.40
SLA (cm2 g−1)Middle167.3147.0191.50374.24131.90193.70
Lower190.7849.8597.25355.21152.06227.78
Table 5. Results of the generalised linear mixed models derived for leaf traits based on Equation (7).
Leaf Trait (unit)GLMM ComponentEstimateStandard Errort-Valuep-ValueSignificance
Intercept−0.1950.0167−11.6950.000***
Ln(d0)0.0820.004518.1190.000***
Leaf mass (g)Middle crown part0.0820.00505.6650.000***
Upper crown part0.0790.005015.7970.000***
R2 = 0.625, AIC = −2606
Intercept−12.8631.764−7.2920.000***
Ln(d0)8.3910.47817.5600.000***
Leaf area (cm2)Middle crown part2.3010.5264.3740.000***
Upper crown part4.0200.5294.3740.000***
R2 = 0.725, AIC = 6468
Intercept359.5510.86633.0880.000***
Ln(d0)−46.772.944−15.8890.000***
SLA (cm2 g−1)Middle crown part−23.483.247−7.2330.000***
Upper crown part−52.513.244−16.1830.000***
R2 = 0.654, AIC = 10089
Note: *** significant at 99.9% significance level.
Table 6. Biomass models of individual tree components in common aspen using stem base diameter as an independent variable, showing their regression coefficients (b1, b2), standard errors (SE), p-values (P), coefficients of determination (R2), mean squared errors (MSE), logarithmic transformation bias (λ), and standard deviation (SD) (see Equation (2)).
Biomass of Tree b1S.E.Pb2S.E.PR2MSEλS.D.
Components (g)
Roots (A)−3.3150.130<0.0012.4100.039<0.0010.9540.1451.0780.474
Stem (B)−3.6120.107<0.0012.7950.033<0.0010.9760.0981.0480.323
Branches (C)−5.6830.196<0.0013.0100.060<0.0010.9350.3061.1160.710
Leaves (D)−2.9070.225<0.0012.0200.069<0.0010.8290.4291.1910.634
Woody parts (A+B+C) −2.7600.093<0.0012.699 0.028<0.0010.9820.0711.0360.293
Whole tree (A+B+C+D)−2.3790.092<0.0012.6180.028<0.0010.9810.0701.0360.293
Table 7. Models for calculating tree foliage area, leaf area ratio (LAR), and leaf mass ratio (LMR) in common aspen using stem base diameter as an independent variable, showing their regression coefficients (b1, b2), standard errors (S.E.), p-values (P), coefficients of determination (R2), and mean squared errors (MSE) (see Equation (1)).
Tree Characteristics (unit)b1S.E.Pb2S.E.PR2MSE
Tree foliage area (cm2)0.00310.00120.0101.7230.093<0.0010.7340.834
LAR (cm2 kg−1)308.437.2<0.001−0.8690.051<0.0010.634165.93
LMR (kg kg−1)0.6570.083<0.001−0.5850.048<0.0010.4581.297
Table 8. Models for calculating the biomass of woody parts, foliage, and leaf area index in common aspen stands using stem base diameter as an independent variable, showing their regression coefficients (b1, b2), standard errors (S.E.), p-values (P), coefficients of determination (R2), and mean squared errors (MSE) (see Equation (1)).
Stand Characteristics (unit)b1S.E.Pb2S.E.PR2MSE
Woody parts stock (kg m−2)0.00390.00360.2911.9590.201<0.0010.88218.497
Foliage stock (kg m−2)0.0050.0030.0821.1840.125<0.0010.8100.029
Leaf area index (m2 m−2)0.9290.3050.0050.5220.082<0.0010.6163.160

