Extracellular Soil Enzyme Activities in High-Elevation Mixed Red Spruce Forests in Central Appalachia, U.S.A.


1
Department of Physical and Natural Sciences, The College of Saint Rose, Albany, NY 12203, USA
2
Department of Biology, West Virginia University, Morgantown, WV 26506, USA
*
Author to whom correspondence should be addressed.
Forests 2020, 11(4), 468; https://0-doi-org.brum.beds.ac.uk/10.3390/f11040468
Submission received: 20 March 2020
/
Revised: 16 April 2020
/
Accepted: 17 April 2020
/
Published: 21 April 2020
(This article belongs to the Section Forest Ecophysiology and Biology)
Abstract
:Anthropogenic emissions have impacted terrestrial forest ecosystem processes in North America since the industrial revolution. With the passage of the Clean Air Act in 1970 in the United States, atmospheric inputs of nitrogen (N) and sulfur (S) into forests in the Appalachian Mountains have declined, which have, potentially, mitigated their effects on processes such as decomposition and nutrient cycling. Activities of microbial extracellular soil enzymes (ESEs) mediate many rate-limiting nutrient transformations in forest soils and play important roles in the decomposition of complex organic compounds. Soils in high-elevation red spruce forests are characterized by low pH and high carbon (C):N ratios and, having historically received extremely high levels of N deposition, may exhibit legacy impacts of deposition on nutrient availability and decomposition. We utilized four sites along a modeled gradient of N deposition in central Appalachia to assess contemporary ESEs in bulk soil under Acer rubrum L., Betula alleghaniensis Britt., and Picea rubens Sarg. in May, June, and July 2016. Increasing N deposition led to increases in organic fraction C and N and decreases in phosphorus (P). Sites receiving higher N also exhibited greater mineral fraction C, N, and P. ESEs were highest in organic fractions with acid phosphatases (AP) exhibiting the highest activity. There was little influence of N deposition on organic fraction ESEs, but strong evidence for a positive relationship between N deposition and activities of AP, β-glucosidases (BG), and chitinase (NAG) in mineral fractions. Species effects on ESEs were present with high AP in organic fractions under spruce and high mineral fraction fungal laccase (LAC) under birch. The sampling season demonstrated little effect on ESEs. ESEs were more strongly influenced by plot-level factors, such as tree species diversity and abundance of ectomycorrhizal (ECM) tree species, than temporal or soil factors or nutrient status related to modeled cumulative N deposition across these sites. Decreases in AP, BG, and NAG activities with greater abundance of broadleaf deciduous species and increases in activities with ECM host abundance indicate that microbial communities driven by these plant functional groups are responsible for the differences in ESEs observed in these high-elevation mixed red spruce stands.
1. Introduction
Microbial extracellular soil enzymes (ESEs) serve important ecosystem functions by facilitating the biogeochemical cycling of soil organic matter (SOM) and increasing the concentration of plant-available nutrients in the soil solution [1]. Except for acid phosphatases secreted by plant roots, ESEs are generally synthesized and secreted by microbes, and act as drivers for many of the rate-limiting steps in nutrient transformations for resource-scavenging in ecosystems [2]. Both the plant community structure, through the direct influence on microbial communities and indirect effects on litter quality, and soil disturbance, such as acid deposition and accompanying nutrient inputs, will affect the structure and function of soil microbial communities and the production of ESEs [3].
Plant species influence root-zone microbial communities, which influence nutrient turnover and acquisition by the root [4]. Plant nutrient status is especially influenced by the mycorrhizal associations that significantly enhance phosphorus (P) acquisition [5]. Differences in ectomycorrhizal (ECM) versus arbuscular mycorrhizal (AM) fungal communities selected by trees and the quality of detrital inputs from different hosts will influence the microbial community structure and function related to nutrient scavenging. Therefore, it is important to consider tree species effects on the soil microbial community and tree functional characteristics as important drivers of nutrient cycling in forested ecosystems. For example, high-elevation red spruce forests develop an organic soil horizon consisting of large quantities of nutrient-poor, recalcitrant organic matter. In these ecosystems, microbial ESEs will play important roles in the decomposition of high carbon (C): nitrogen (N) compounds, such as chitin, cellulose, hemicellulose, and lignin [6], and nutrient cycling as a whole.
Nutrient fertilization is another major driver of soil microbial community composition and may promote additional feedbacks by altering the plant communities that influence soil microbial diversity [7]. Although some soil microbial communities exhibit functional resilience despite reductions in microbial diversity [8], ESE profiles often shift as microbial communities change with nutrient enrichment [9,10,11]. While functional redundancy among soil microbes can minimize the impacts of these community changes on ESE profiles, microbial communities experiencing elevated nutrient availability may lack the microbial taxa and genes to produce certain enzymes needed to mediate nutrient transformations. This includes potential implications for decomposition and related processes [12]. Schimel and Bennett (2004) portrayed the depolymerization of organic nitrogen forms in soil organic matter as the rate-limiting step for soil N cycling [13]. There are also indications that ESE responses to N fertilization are closely intertwined with soil P status in acid forest soils. Chronic N fertilization has been shown to suppress hydrolytic enzyme activities in spruce-fir forests, while nutrient acquisition was governed by inorganic P rather than N [14].
Due to the site preferences of red spruce for high elevations within the Appalachian Mountains, USA, these ecosystems have received, and continue to be influenced by, elevated levels of acidic deposition that contain high levels of N and sulfur (S). Despite reductions in acidic inputs due to the Clean Air Act that curbed industrial emissions in the United States, these N inputs may have impacted soils/soil processes in these forest ecosystems. Elucidating patterns of soil enzyme activities and the factors influencing their activities could aid in identifying changes in nutrient cycling and, therefore, potential disruptions to ecosystem processes in high elevation red spruce forests.
The objective of this study was to observe differences in ESE activity profiles from organic and mineral fractions of the bulk soil below the canopies of three of the most abundant tree species in high-elevation Appalachian forests, Acer rubrum L., Betula alleghaniensis Britt., and Picea rubens Sarg., at four sites along a modeled gradient of inorganic N deposition. In this case, we report the activities of acid phosphatase (AP) catalyzing organic P liberation, β-glucosidases (BG) yielding simple C forms from celluloses, chitinolytic N-acetyl-glucosaminidases (NAG) that release N, and fungal laccases (LAC), which are a subset of phenol oxidases that are multicopper oxidases expressed by certain taxonomic groups of fungi. We specifically evaluated the following hypotheses: (1) soils beneath different tree species will have significantly different ESE activities, which correspond to differences in host-specific soil C:N ratios and/or controls on microbial communities, (2) ESE activities will increase with N deposition reflecting shifts in N and P availability, and (3) seasonal differences in ESE activities from May, July, and October will reflect changes in C inputs during the growing season in these soils.
2. Materials and Methods
Four high-elevation red spruce stands were selected based on site elevation (>1100 m), tree species composition (mixed hardwood-red spruce), and position along a gradient of modeled acid deposition, which ranged from 326 to 400 kg N ha−1 over the past 27 years in central Appalachia, as outlined by Crim et al. (2019) [15]. Site selection for modeled acid deposition relied upon data from the National Atmospheric Deposition Program (NADP) from 1985 to 2012. Each site consisted of a single 100-m diameter plot about a center point established in an area with red spruce as the predominant tree species. Three individual trees of A. rubrum, B. alleghaniensis, and P. rubens were selected at each site from the canopy-dominant or co-dominant individuals that were greater than 45-cm diameter at breast height (DBH). Plot tree diversity characteristics are presented in Appendix A. Two soil samples were collected parallel to the slope on opposite sides of each tree midway between the bole and canopy edge and composited. Samples were collected from the same trees once each in May, July, and October using a soil corer with a 2-cm sampling tube to a depth of 15 cm. Samples were carefully separated into organic (O) and mineral (M) fractions and then composited by soil fraction for each individual tree of each species at each site. Following collection, samples were stored in plastic Ziploc® bags and immediately placed on ice. In the lab, samples were sieved using a 2-mm (No. 10) screen and stored at −20 °C [16].
Soil subsamples were dried at 65 °C to calculate soil moisture with subsamples for C, N, and P analysis air-dried and stored in the dark at 4 °C. C and N were measured using a Thermoquest Elemental Analyzer. P was analyzed following Mehlich III extraction by inductively coupled plasma optical emission spectroscopy (ICP-OES). Subsamples for enzyme measurements were thawed and assayed field-moist. Fluorimetric assays were performed for the hydrolytic enzymes acid phosphatase (AP), arylsulfatase (ARS), β-glucosidase (BG), and N-acetyl-glucosaminidase (NAG). Colorimetric assays were completed for the oxidative enzymes polyphenol oxidase (PO) and peroxidase (PER) [1]. The pH of the extracting buffer used in the assays was adjusted to pH 3.5 to approximate the pH of the native soils [17,18]. Enzyme activities were measured for both the organic and mineral fractions of the bulk soil. The reaction of L-3,4-dihydroxyphenylalanine (L-DOPA), the substrate for PER and PO that produces a chromophore as it is oxidized, has a pH optimum approaching 9 [19], which, potentially, results in low measurements given our assay conditions [20]. While colorimetric assays for LAC were consistent with literature values reported in forest soils [20,21,22], PER and PO activities were low or undetectable, which indicated that L-DOPA was ineffective as a substrate given the assay conditions simulating the low pH of the native soil at these sites. These data and data for ARS, which were also low, were not analyzed further.
Measurement of extracellular enzyme activities in soils is a challenge since enzymes can be adsorbed to soil constituents such as clays, humic compounds, and other colloidal entities with locally strong charges that can result in strong physical and/or chemical binding of the enzyme [23]. An additional colorimetric assay for oxidative enzyme activity optimized for low pH samples was performed using 2,2′-azino-bis (3-ethylbenzthiazoline-6-sulfonic acid) (ABTS) as a substrate to measure the activity of fungal laccases (LAC) [24]. This method, which is specialized for soil samples, is 3–40 times more sensitive than alternative protocols for soil assays of laccases and provides an effective proxy for soil oxidative enzyme activity [20,25]. Extinction coefficients for chromophores of ABTS in these soils were generated and tested for temporal stability over the course of the soil incubations using lyophilized mushroom tyrosinase (Sigma-Aldrich product #T3824-25KU) [26], and were similar to literature values for forest soils [16,25].
Soil C, N, and P concentrations were evaluated as functions of N deposition and tree species using regression analyses. ESE activities were log-transformed to meet the assumptions of normality and then evaluated using a nested mixed analysis of variance (ANOVA) model including sample month, total deposition, species, tree within species (repeated measure), and their interactions. Additionally, multiple linear regression was used to evaluate site variable influences, including tree species diversity (Shannon Index), mycorrhizal host type (ECM vs. AM), broadleaf relative importance value (BL RIV), ectomycorrhizal host relative importance value (ECM RIV), soil C:N ratio, N deposition, and soil pH, on ESE activity. Broadleaf RIV and ECM RIV values were calculated as the sum of the relative frequency of BL or ECM species, the relative density (individuals per area) of BL or ECM species, and the relative basal area of BL or ECM species within the plots. Principal component (PC) analysis was used to evaluate the influences of plot-level factors on ESE activities. Exploratory data analysis was performed in SAS JMP Pro 14.0 [27]. Statistical analyses were performed using R core functions in the R statistical environment [28].
3. Results
3.1. Soil C, N, and P Responses to N Deposition
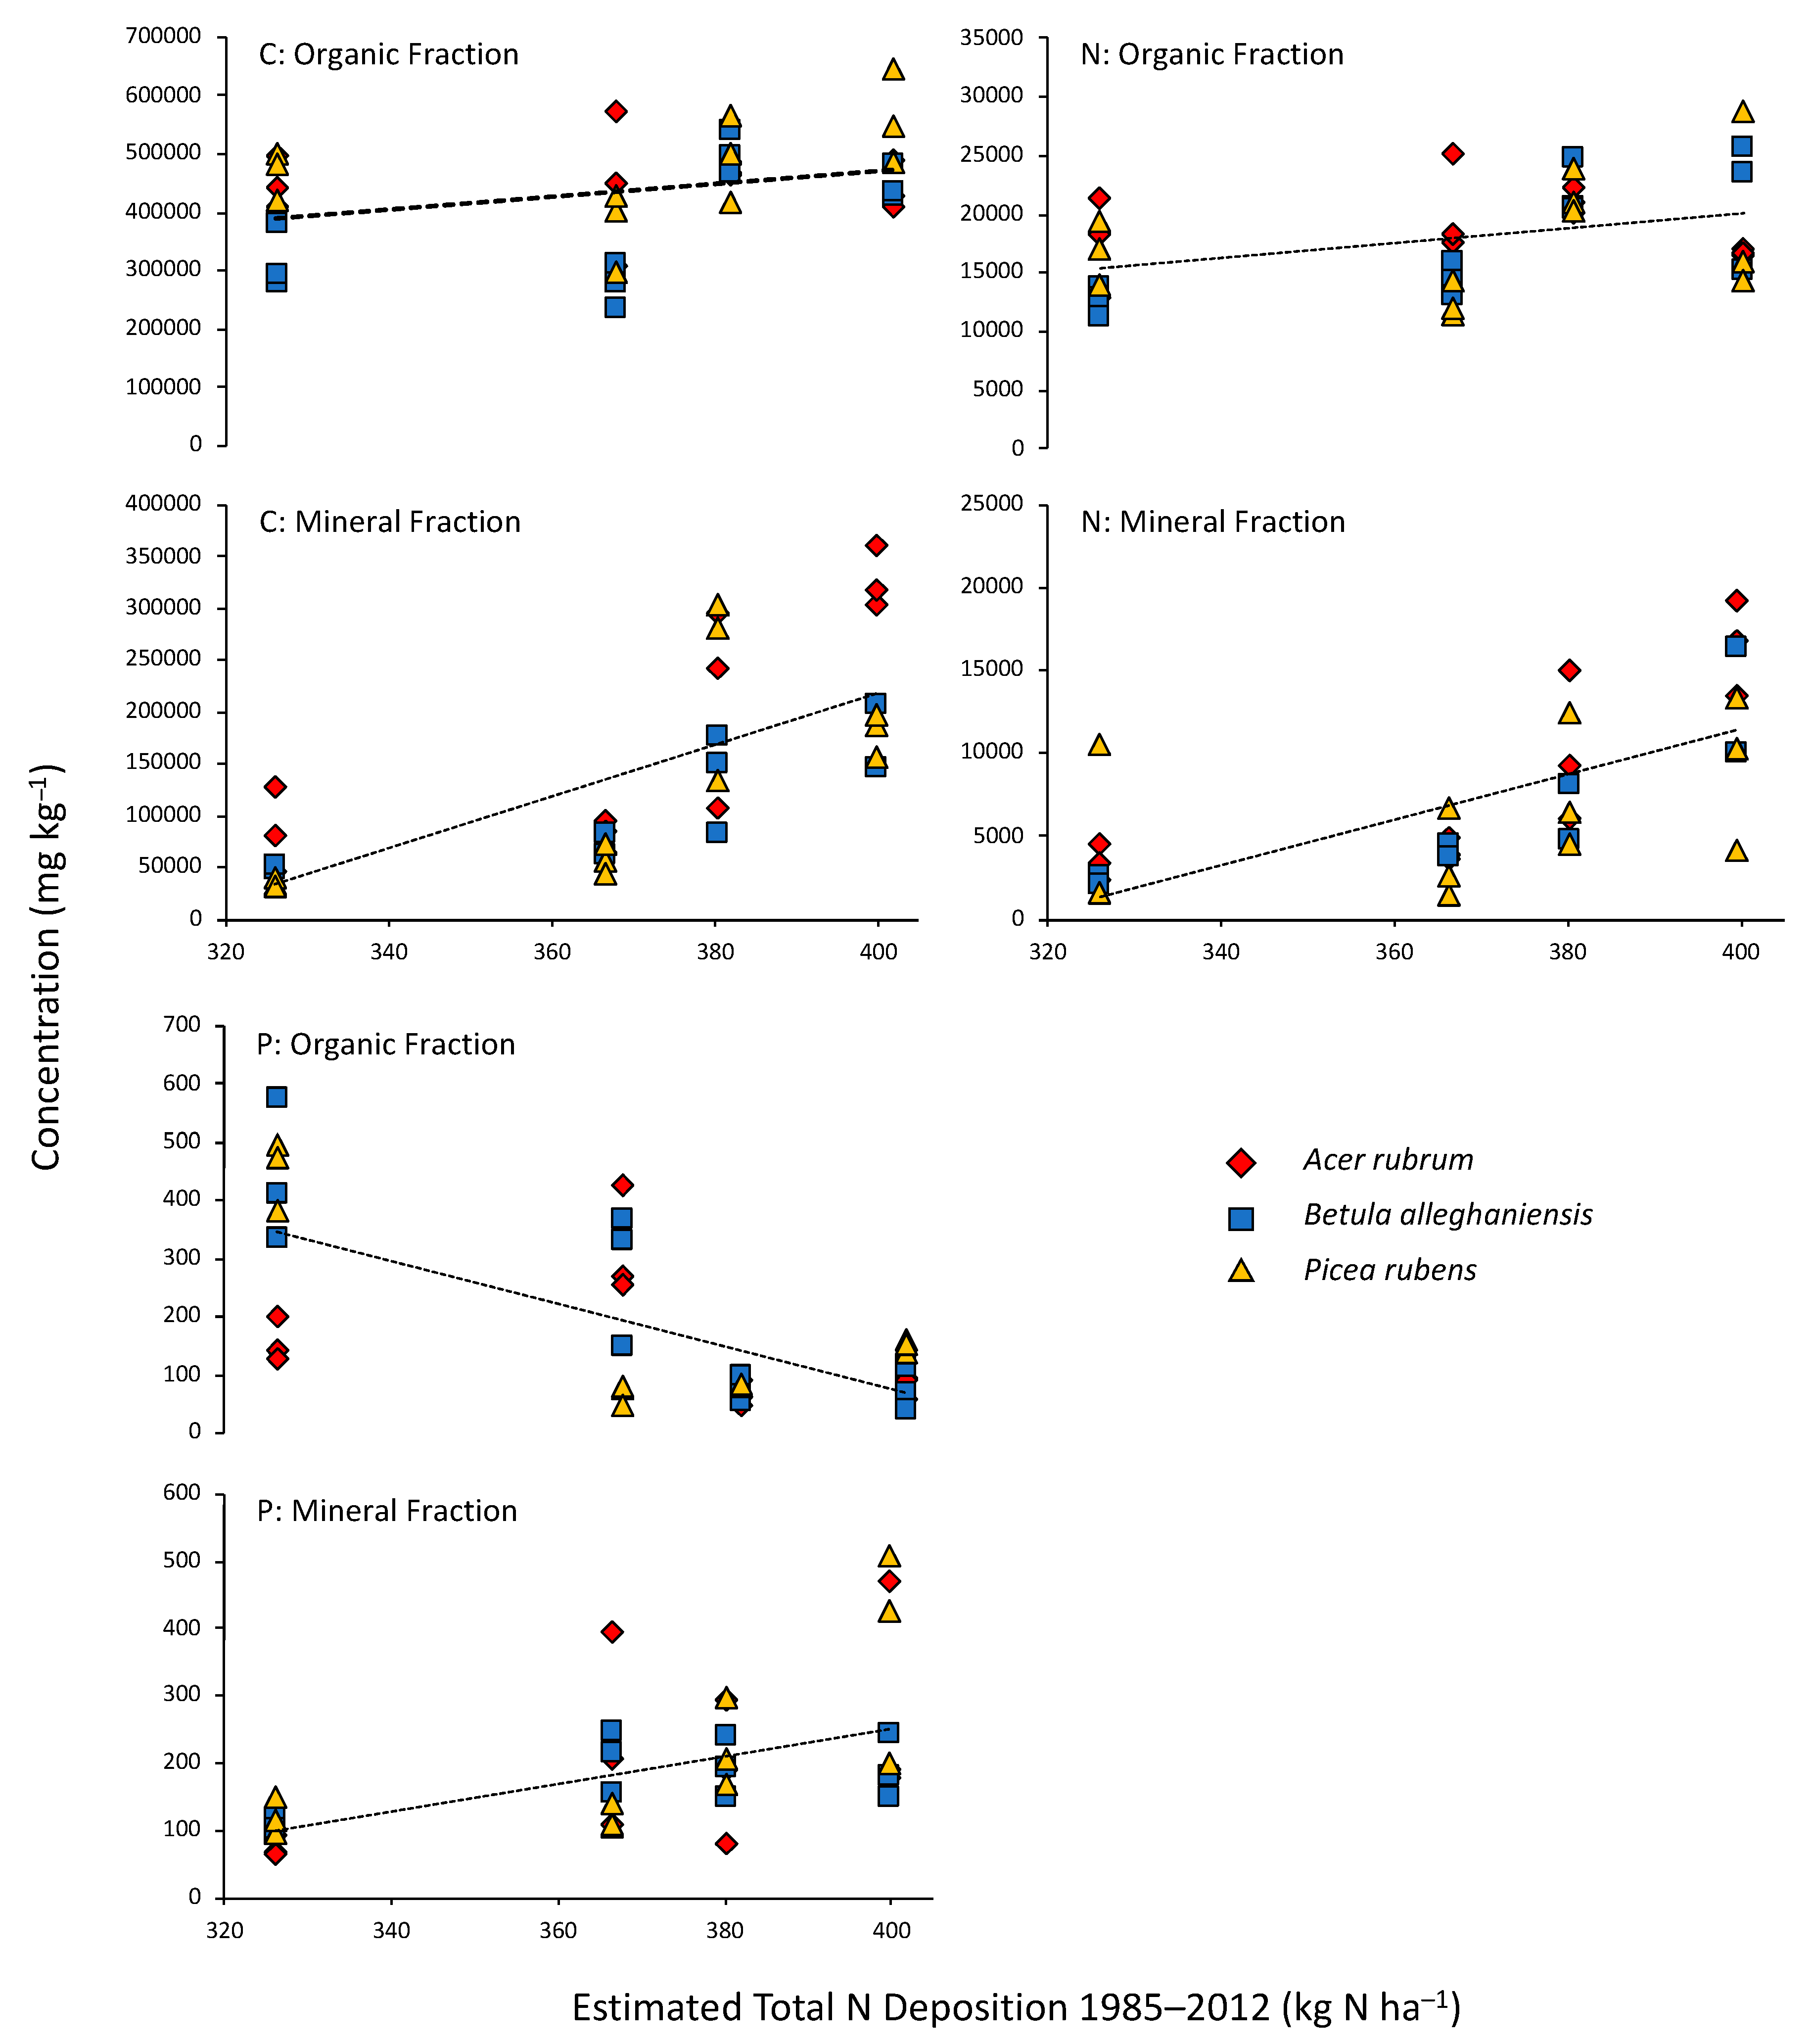
Enhanced N deposition led to increases in organic fraction C and N across the N deposition gradient while organic fraction P declined across the sites (Figure 1). Mineral soil C and N increased more substantially than increases in the organic fraction, whereas P increased in the mineral fraction across the N deposition gradient (Figure 1). There was little evidence of species differentiation in soil C, N, or P concentrations among the sites (Figure 1).
3.2. Soil Fraction and Species Effects on ESE Activities
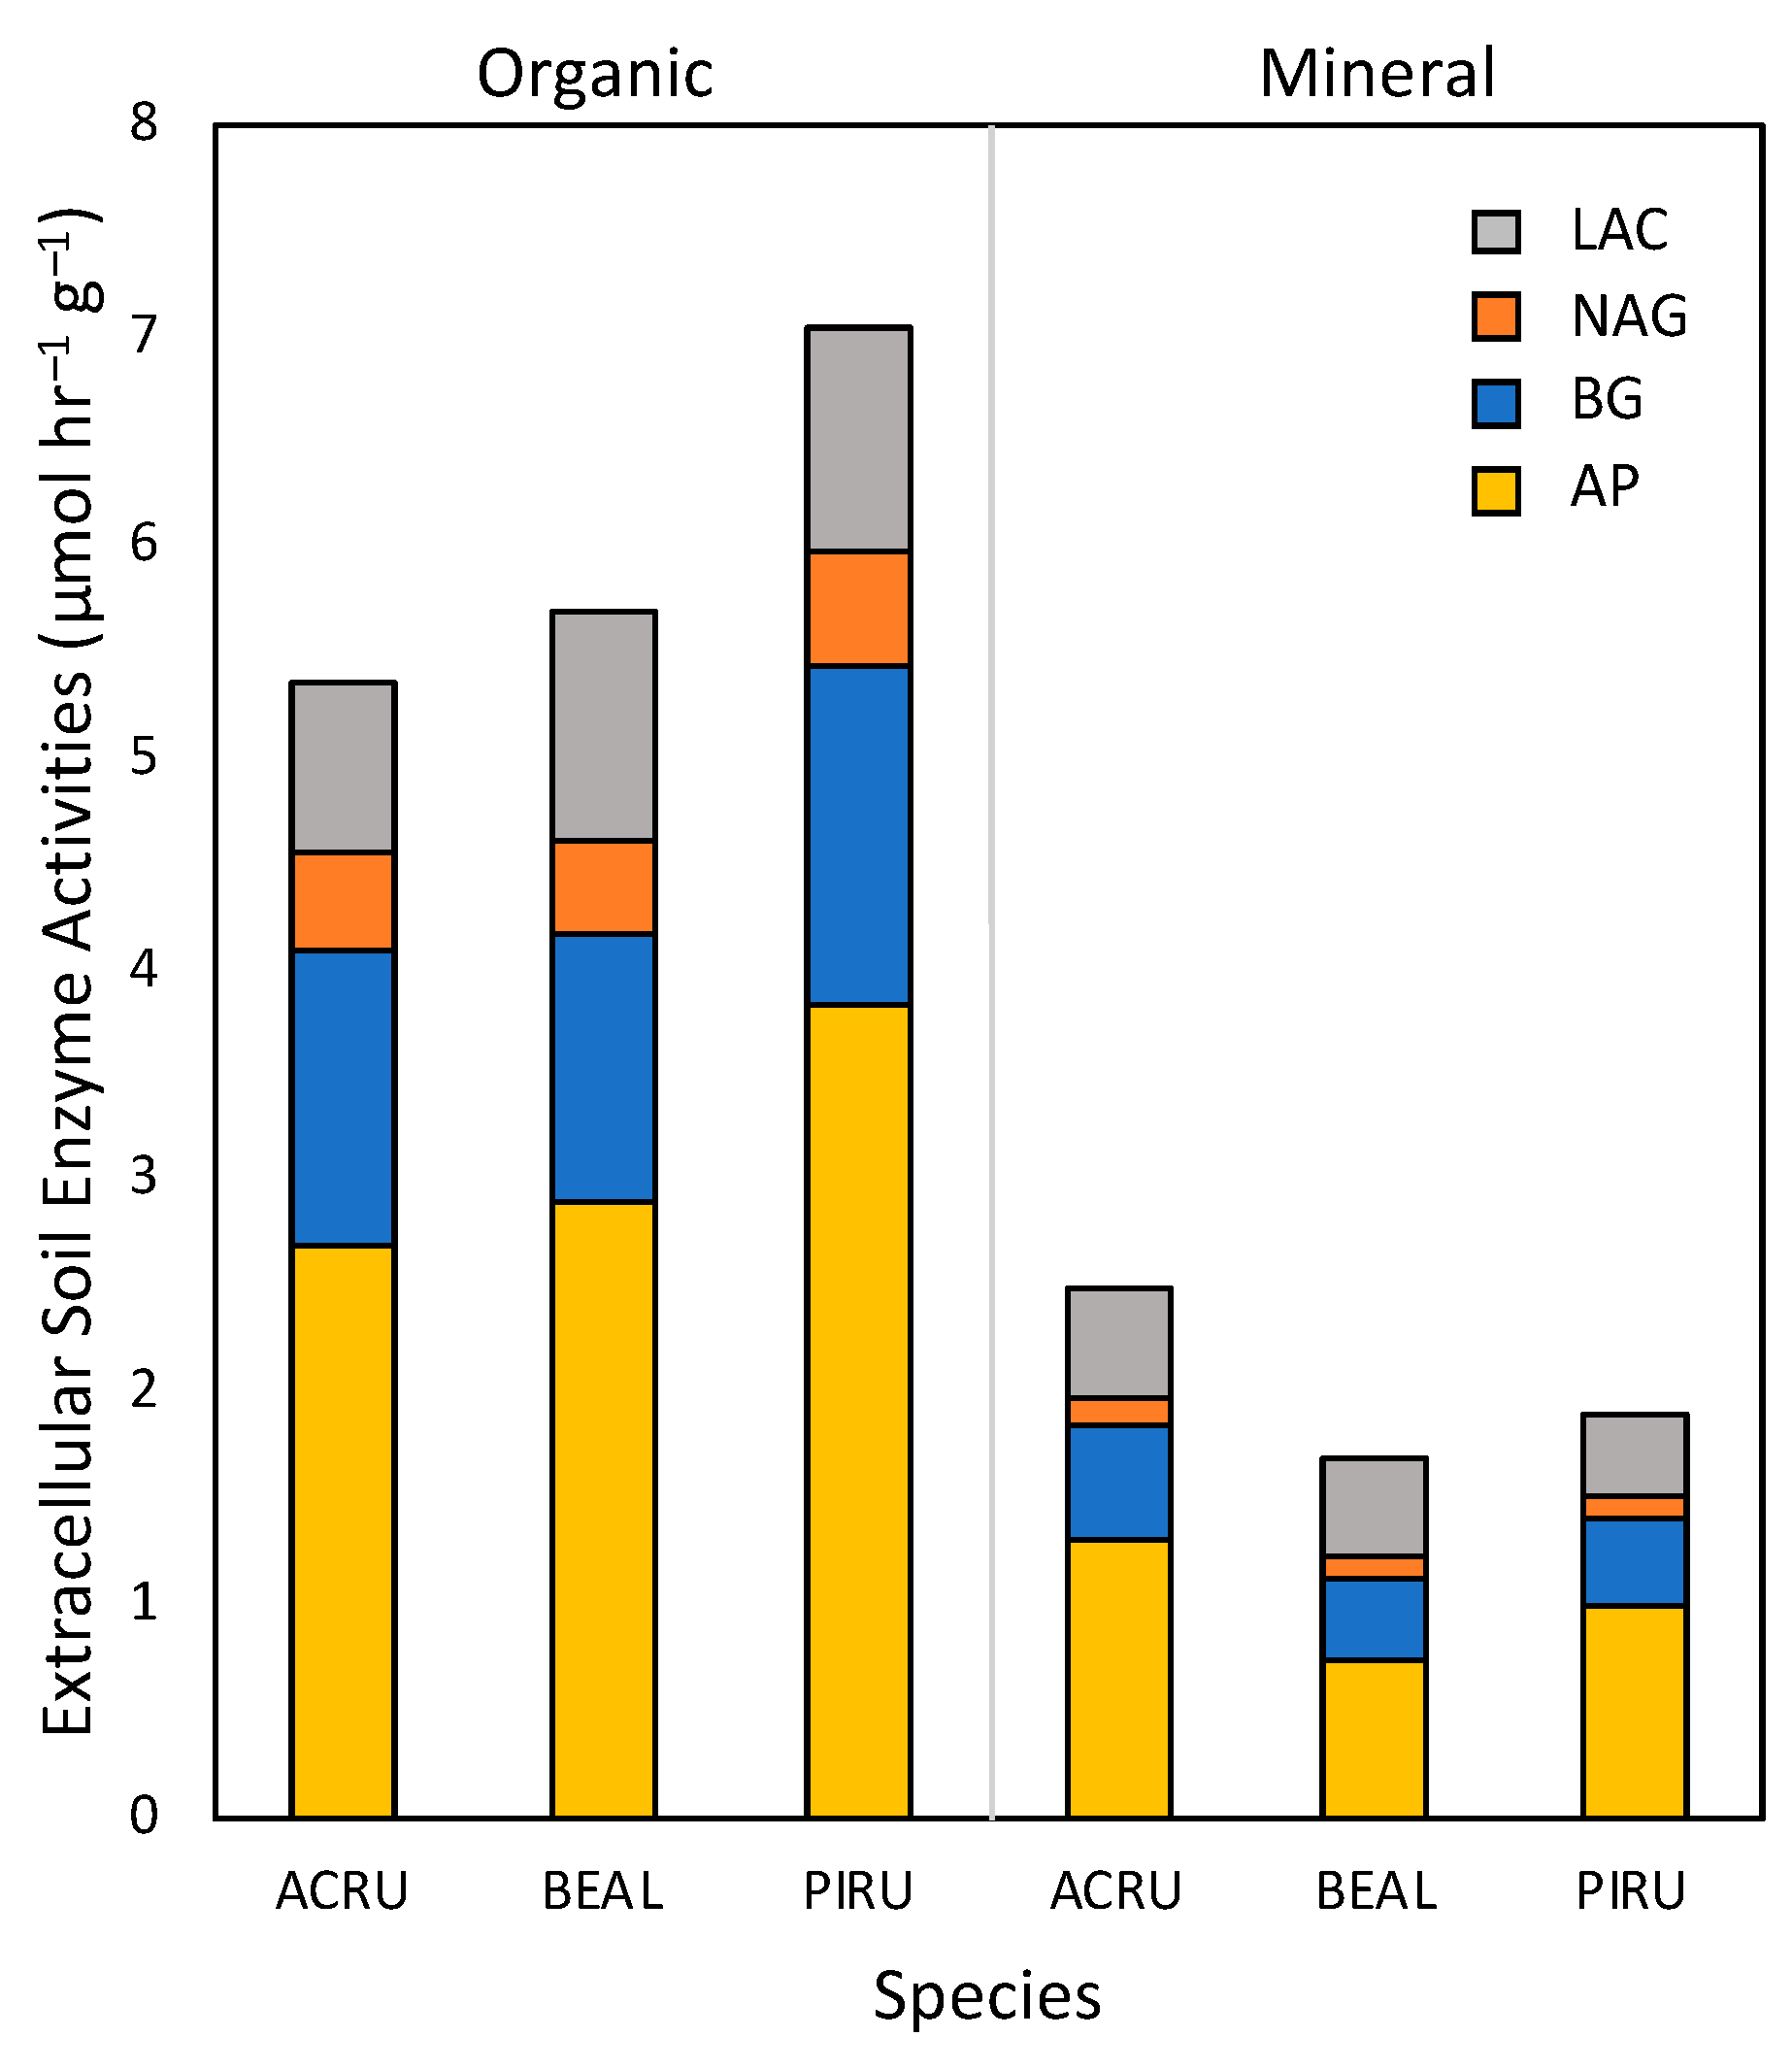
Soil enzyme activities, pooled across time points and sites, consistently exhibited higher mean rates (p < 0.001 for AP, BG, NAG, and LAC) in the organic fraction than in mineral soils (Figure 2). Rates of AP were the highest of the ESEs measured and, for the species evaluated, organic fractions beneath P. rubens exhibited the highest AP (Figure 2). In the mineral fraction, the activity of LAC beneath B. alleghaniensis was greater than that of P. rubens; LAC activity beneath A. rubrum was intermediate between the other two species.
3.3. Temporal, Depositional, and Stand Diversity Effects on ESE Activities
Seasonal effects on ESE activity in organic fractions were significant for BG (p = 0.008) and NAG (p = 0.021) (Table 1) with BG and NAG activity peaking in mid-summer. Soil ESE activities in mineral fractions displayed little temporal change in activity.
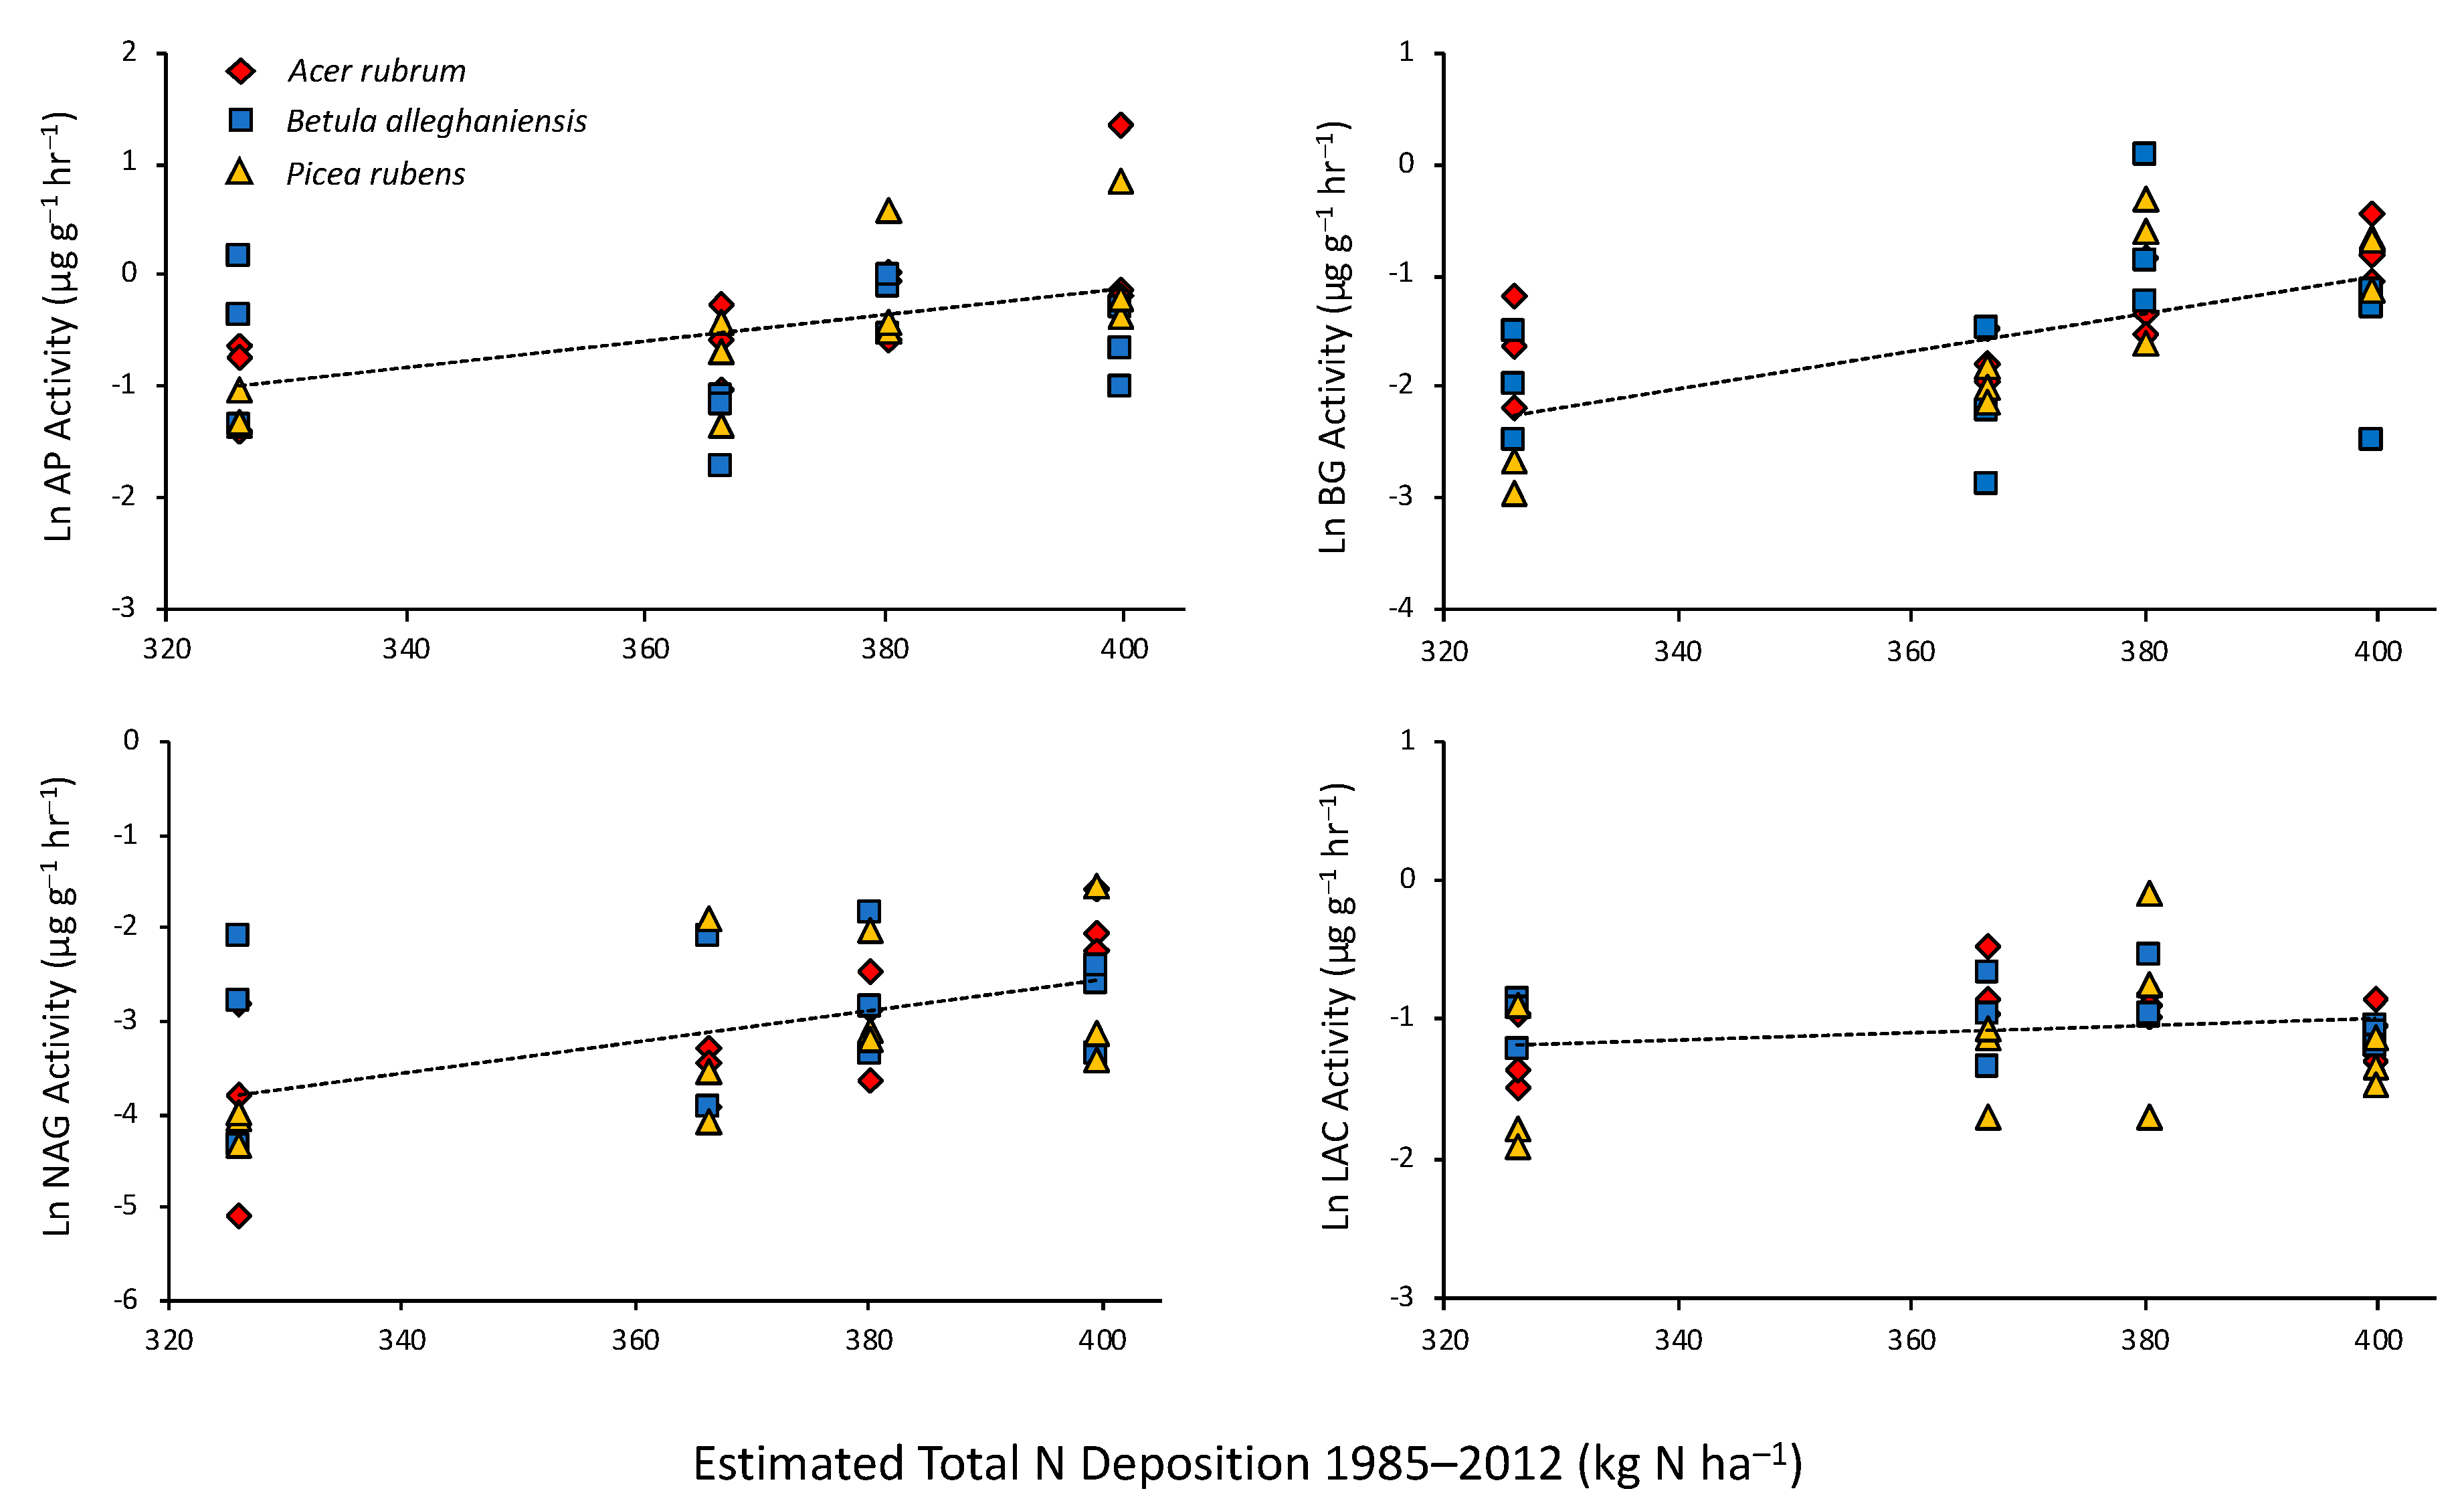
ESE activity in the organic fraction was little affected by N deposition (Table 1). In contrast, AP, BG, and NAG were strongly affected by N deposition in mineral fractions (Table 1). In each case, activity increased with increasing N deposition (Figure 3). The significant species × deposition interactions noted for AP and BG resulted from these ESE responses to N being the greatest in soils beneath P. rubens, and less so beneath A. rubrum, with little response to N in soils collected beneath B. alleghaniensis.
Evaluation of ESE activity as functions of local soil-level and plot-level factors excluding N deposition indicated that ESE activity was not influenced by soil nutrient factors related to N deposition, but rather by plot-level factors that influence the microbial community (Table 2). As noted above, ESE activities were greater in the organic fractions than in mineral fractions (Table 2). In addition, greater plot broadleaf representation depressed AP, BG, and NAG activity, whereas plot tree diversity associated with ectomycorrhizal hosts increased ESE activity as did overall plot tree diversity (Table 2).
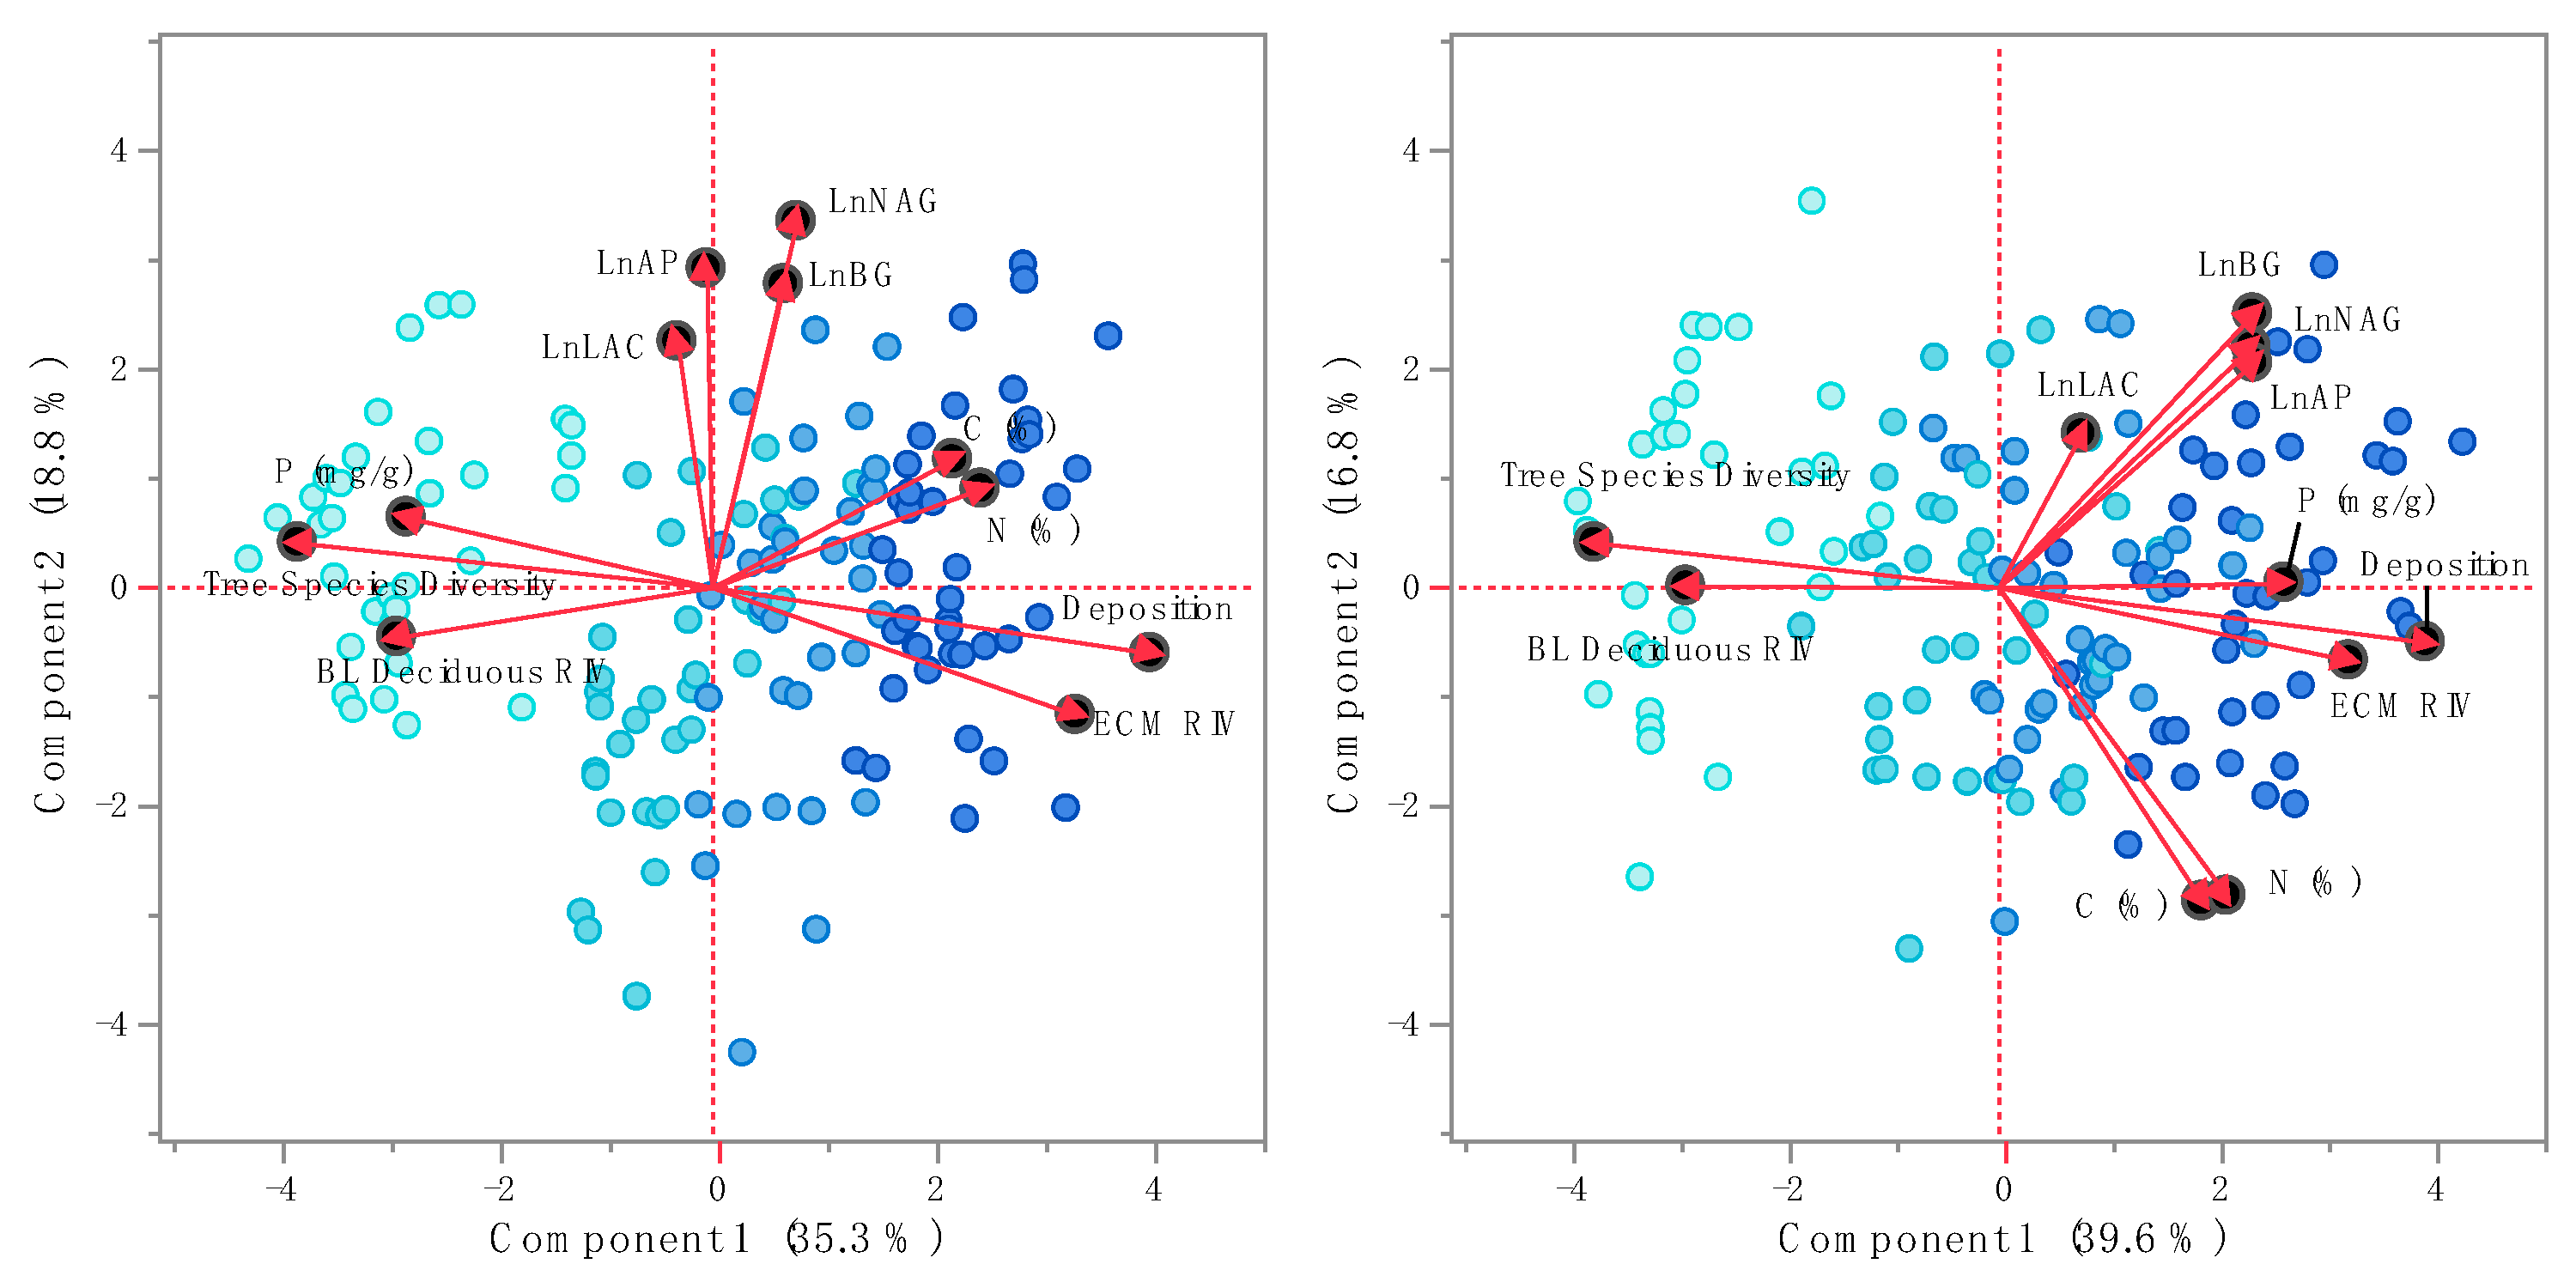
Principle component analysis for soil-level and plot-level predictors of ESE activities highlighted separation among sites driven by N deposition, soil nutrient concentrations, and stand species composition (Figure 4). For the organic fraction, the first two principle components (PCs) explained 54.1% of the variation with N deposition, soil C and N, and ECM RIV having positive influences while soil P, tree diversity, and broadleaf RIV had negative weights on PC1 (Table 3). PC2 reflected the strong correlation of activities among the ESEs measured (Figure 4). In the mineral fraction, the first two PCs accounted for 56.4% of the variation. As with the organic fraction, N deposition, soil C and N, and ECM RIV positively loaded PC1 while broadleaf RIV and tree species diversity negatively weighted PC1 (Table 3). In contrast to the PC1 for the mineral horizon, soil P loaded positively to PC1 in the mineral horizon (Figure 4). PC2 for the mineral fraction highlighted the negative correlation between ESE activity and soil N and C. It is evident from Figure 4 that patterns in the data existed with increasing deposition (symbol color intensity) along the first PC in each soil fraction, which supports soil compositional changes highlighted in Figure 1 and ESE activity responses in Figure 3.
4. Discussion
The long-term inputs of N-containing acidic precipitation into high-elevation forests in the eastern United States have had numerous impacts on trees and soils in these ecosystems. With the implementation of the Clean Air Act, N and S inputs have declined into these systems, although N deposition is still substantial. Increases in soil N, concomitant reductions in cations, and inputs of metals in these soils [15] have the potential to alter microbial community structure and function. In this study, we evaluated the activity of a suite of microbially-produced soil enzymes involved in SOM and nutrient cycling in soils along a modeled N-deposition gradient in the central Appalachian Mountains.
4.1. Soil C, N, and P Responses to N Deposition
Nitrogen inputs into these sites, ranging from 326 to 400 kg N ha−1 between 1985 and 2012, stimulated C and N accretion in both the organic and mineral horizons. However, the observed changes were proportionally greater in the mineral than organic fractions (Figure 1). In contrast, P declined in the organic fraction, but increased substantially in the mineral layers, which suggests an acid-induced redistribution of P from the organic to mineral horizons. We also noted substantial redistribution of cations and metals in these soils [15]. Such changes are typical of N-deposition impacted soils [29,30,31,32] and have the potential to alter microbial communities and their activity directly or indirectly though changes in tree rhizodeposition. ESEs function to access energy and nutrients stored in recalcitrant organic matter in forest soils [33,34]. Alterations for the processes driving decomposition have important consequences for nutrient cycling and C storage within forests [35].
4.2. Soil Fraction and Species Effects on ESE Activities
The predominance of thick, well-developed organic fractions at these sites was typical of the spodic soils that develop under red spruce [36]. Substantially higher enzyme activities in the organic versus the mineral fractions (Figure 2) follow the inverse relationship typically observed between soil microbial biomass and soil depth [37,38,39,40]. In the organic fractions, the growth of microbes is stimulated by SOM, and the ramification of mycorrhizal fungal hyphae and their associated microbial communities in the litter enhance degradation of SOM via nutrient scavenging [4,33]. The mineral fractions, which contain lower quantities of organic matter, exhibited lower ESE activities that are related to differential microbial communities established due to lesser influence of host tree litter and roots [41,42,43].
The microbial community and the activity of ESEs may also respond to changes in the soil environment brought about by variation in the dominant vegetation. The soil microbial community is indirectly influenced by plant diversity through plant traits that influence soil nutrient availability [43]. Quantitative and qualitative differences in litter inputs and differences in root-mycorrhizal associations have large influences on the soil abiotic environment and will influence microbial community structure and function [4,43,44]. In the current study, there were minor differences in ESE activity in soils beneath the three species investigated, such as the higher AP activity beneath red spruce (Figure 2). Multivariate analyses confirmed the importance of function diversity of the forest plots in structuring soil properties and ESE activities (Table 2 and Table 3, Figure 4). ESE activities as a whole were not influenced by the mycorrhizal functional status (ECM vs. AM) of the tree of collection, but rather were more responsive to plot-level characteristics, such as broadleaf RIV and ECM RIV (Table 2 and Table 3), which may influence plot litter quality. We previously reported [15] that, while foliar nutrient concentrations varied extensively among the tree species on these sites, soil nutrient pools were relatively homogeneous. This suggests that plot-level redistribution plays an important factor in establishing soil characteristics and the activity of the microbial community [45,46].
4.3. Temporal, Depositional, and Stand Diversity Effects on ESE Activities
Temperature and moisture are important factors driving microbial activity and decomposition in soils. Even minor increases in soil temperatures can accelerate microbial activity and litter decay rates under the red spruce [47,48]. Soil amino acid pools, primarily utilized by microbes over plants, have been shown to increase during dormant periods and decrease during the growing season [49]. In the current study, the activity of the hydrolytic enzymes, BG and NAG, in the organic horizon were significantly higher in July than in May or October, which is consistent with Kittredge et al. (2018) who demonstrated sensitivity of these enzymes to organic fraction warming [50]. The mineral fractions, which contain lower quantities of organic matter, are additionally buffered from changes in the surface environment, such as moisture and temperature fluctuations, which may minimize seasonal patterns of microbial population growth and activity.
In the current study, we found the activity of AP, BG, and NAG increased significantly across the modeled N deposition gradient at our sites in the mineral, but not organic fractions (Table 1, Figure 3). This mineral-fraction response may reflect the proportionately greater enrichment of this horizon with C, N, and P as N deposition increases when compared to organic fractions (Figure 1), which may stimulate/alter the growth, metabolic activity, and or diversity of the microbial community. This hypothesis is supported by the relationships between variables in PC1 for the mineral fraction (Table 3), where ESE activities are positively weighted with soil N, C, and P. In contrast, suppression of ESE activities concurrent with N fertilization has been observed in several studies [3,51,52]. An evaluation of organic fraction soils across a gradient of N deposition in the Adirondack Mountains of Upstate New York showed a trend between N deposition and organic soil N, but stronger relationships with other site factors such as growing season degree days [50].
In addition to the effects of N deposition, we found that activity in the mineral horizon was negatively correlated with broadleaf RIV and tree diversity, which indicates that, across the depositional gradient, differences in stand broadleaf composition (and the quality of leaf and root litter inputs) may also affect ESE activity. Deposition of N and S impacts not only the microbial community structure, but also biotic interactions between fungi, bacteria, and plants. Chronic NH4NO3 addition has been shown to increase mycorrhization in black spruce (Picea mariana (Mill.) B.S.P.) as well as other species [53,54]. There is evidence that differences in mycorrhizal fungal type, AM or ECM, exert considerable differences in ESE activities. In a similar mixed northern hard-wood/coniferous forest in New England, Brzostek and Finzi (2011) examined the effects of Acer saccharum (AM), Fraxinus americana (AM), Tsuga canadensis (ECM), and Fagus grandifolia (ECM) on ESE activities and found that roots of AM tree species exhibit little influence on ESE activities relative to their ECM counterparts [55]. The effects of mycorrhizal type on ESE activities in the current study were difficult to assess, however, as these stands had very similar mycorrhizal compositions (Appendix A) and the effect of plot mycorrhizal status was more prevalent than a tree sample mycorrhizal type (Table 2).
One cannot rule out that specific site factors, such as mineralogy and elevation, may be playing a role in organizing soil microbial communities and affecting ESE activity profiles. These factors will influence tree stand structure and function. While tree species diversity declines across the depositional gradient, broadleaf RIV is lower only in the site receiving the highest N deposition and ECM RIV is lowest only at the site receiving the lowest deposition (Appendix A). Given that these factors also affect ESE activity (Table 2 and Table 3), it is difficult to unequivocally ascribe N deposition to the changes in ESE activity observed. Smith et al. (2016) found that broadleaf RIV was the primary driver of nitrogen transformations across a broader modeled N deposition gradient that included our plots [45]. Similarly, Zheng et al. (2018) noted that vegetation change, and the concomitant changes in litter inputs, was the primary controller of soil microbial community structure across an elevational gradient in the eastern Tibetan Plateau [44]. Thus, it may be the quality of N (and other nutrients) cycling in soils across our sites, and not the quantity of N, that is driving patterns of ESE activity observed in this case.
5. Conclusions
Nitrogen deposition into high elevation spruce forests in the Appalachian Mountains has increased soil organic fraction C and N and mineral fraction C, N, and P, whereas P concentrations in organic fractions have declined. These changes are also associated with site differences related to tree species composition, including broadleaf deciduous RIV, tree diversity, and ECM RIV. Soil ESE activities increased with modeled deposition across the four sites sampled, and ESE activities for most enzymes were negatively associated with broadleaf RIV and tree diversity while positively correlated to ECM RIV. Sampling time had little effect on the activities of most enzymes, and the paucity of differences observed between seasons may indicate that enzyme activities mediating many of the rate-limiting steps in nutrient transformations are relatively robust against differences in ambient temperatures and precipitation across small temporal scales at these sites. The enzymes most influenced by changes in soil quality relate to P availability and decomposition of complex carbon compounds, which, potentially, results in greater rates of litter decomposition, lower C storage, and a transition towards P limitation as N deposition increases in these forest soils.
Author Contributions
Conceptualization, P.M.C. and J.R.C. Methodology, P.M.C. and J.R.C. Software, P.M.C. and J.R.C. Validation, P.M.C. and J.R.C. Formal analysis, P.M.C. and J.R.C. Investigation, P.M.C. Resources, P.M.C. and J.R.C. Data curation, P.M.C. Writing—original draft preparation, P.M.C. and J.R.C. Writing—review and editing, P.M.C. and J.R.C. Visualization, P.M.C. and J.R.C. Supervision, J.R.C. Project administration, P.M.C. and J.R.C. Funding acquisition, P.M.C. and J.R.C. All authors have read and agreed to the published version of the manuscript.
Funding
The West Virginia University Eberly College of Arts and Sciences Academic Affairs Grant for doctoral students supported this study.
Acknowledgments
We would like to thank Richard Thomas, Kenneth Smith, and Justin Mathias for their assistance in both introducing these sites and assisting the first author in gaining familiarity with these locations. Kenneth Smith with Richard Thomas devised the site selection procedure using NADP data for their own work at these and other sites in central Appalachia. We are also grateful to the U.S. Forest Service for granting us access to these sites to complete the fieldwork. Special thanks to Edward Brzostek and Katie Rohrbaugh for providing technical assistance on laboratory technique and analyses of the extracellular soil enzyme assays, and to Mathew Aldridge for assisting with laboratory work and troubleshooting. We are grateful to James McGraw for his advice concerning the experimental design and statistical analysis as well as Brooke Eastman and Sandra Simon for early manuscript edits and suggestions.
Conflicts of Interest
The authors declare no conflict of interest.
Appendix A

Table A1.
Tree stand composition of the four field sites. Data from Smith et al. (2016).
| Site | AM RIV 1 | ECM RIV 2 | Broadleaf Deciduous RIV 3 | Shannon Index |
|---|---|---|---|---|
| FLR | 15.78 | 84.22 | 20.76 | 0.403 |
| MCG | 11.97 | 88.03 | 50.15 | 0.287 |
| CGL | 20.83 | 79.17 | 49.22 | 0.500 |
| LSB | 28.80 | 71.20 | 53.16 | 0.574 |
1 Arbuscular mycorrhizal host tree relative importance value. 2 Ecctomycorrhizal host tree relative importance value. 3 Broadleaf tree relative importance value.
References
- Sinsabaugh, R.L.; Lauber, C.L.; Weintraub, M.N.; Ahmed, B.; Allison, S.D.; Crenshaw, C.; Contosta, A.R.; Cusack, D.; Frey, S.; Gallo, M.E.; et al. Stoichiometry of soil enzyme activity at global scale. Ecol. Lett. 2008, 11, 1252–1264. [Google Scholar] [CrossRef] [PubMed]
- Arnosti, C.; Bell, C.; Moorhead, D.L.; Sinsabaugh, R.L.; Steen, A.D.; Stromberger, M.; Wallenstein, M.; Weintraub, M.N. Extracellular enzymes in terrestrial, freshwater, and marine environments: Perspectives on system variability and common research needs. Biogeochemistry 2014, 117, 5–21. [Google Scholar] [CrossRef]
- Fierer, N.; Lauber, C.L.; Ramirez, K.S.; Zaneveld, J.; Bradford, M.A.; Knight, R. Comparative metagenomic, phylogenetic and physiological analyses of soil microbial communities across nitrogen gradients. ISME J. 2012, 6, 1007–1017. [Google Scholar] [CrossRef] [PubMed] [Green Version]
- Cumming, J.R.; Zawaski, C.; Desai, S.; Collart, F.R. Phosphorus disequilibrium in the tripartite plant- ectomycorrhiza-plant growth promoting rhizobacterial association. J. Soil Sci. Plant Nutr. 2015, 15, 464–485. [Google Scholar] [CrossRef]
- Phillips, R.P.; Brzostek, E.; Midgley, M.G. The mycorrhizal-associated nutrient economy: A new framework for predicting carbon–nutrient couplings in temperate forests. New Phytol. 2013, 199, 41–51. [Google Scholar] [CrossRef]
- Sinsabaugh, R.L. Soil Biology & Biochemistry Phenol oxidase, peroxidase and organic matter dynamics of soil. Soil Biol. Biochem. 2010, 42, 391–404. [Google Scholar]
- Zechmeister-Boltenstern, S.; Michel, K.; Pfeffer, M. Soil microbial community structure in European forests in relation to forest type and atmospheric nitrogen deposition. Plant Soil 2011, 343, 37–50. [Google Scholar] [CrossRef]
- Wertz, S.; Degrange, V.; Prosser, J.I.; Poly, F.; Commeaux, C.; Guillaumaud, N.; Le Roux, X. Decline of soil microbial diversity does not influence the resistance and resilience of key soil microbial functional groups following a model disturbance. Environ. Microbiol. 2007, 9, 2211–2219. [Google Scholar] [CrossRef]
- DeForest, J.L.; Zak, D.R.; Pregitzer, K.S.; Burton, A.J. Atmospheric nitrate deposition and the microbial degradation of cellobiose and vanillin in a northern hardwood forest. Soil Biol. Biochem. 2004, 36, 965–971. [Google Scholar] [CrossRef]
- Yin, C.; Fan, F.; Song, A.; Cui, P.; Li, T.; Liang, Y. Denitrification potential under different fertilization regimes is closely coupled with changes in the denitrifying community in a black soil. Appl. Microbiol. Biotechnol. 2015, 99, 5719–5729. [Google Scholar] [CrossRef]
- de Menezes, A.B.; Prendergast-Miller, M.T.; Poonpatana, P.; Farrell, M.; Bissett, A.; Macdonald, L.M.; Toscas, P.; Richardson, A.E.; Thrall, H. C/N ratio drives soil actinobacterial cellobiohydrolase gene diversity. Appl. Environ. Microbiol. 2015, 81, 3016–3028. [Google Scholar] [CrossRef] [PubMed] [Green Version]
- Wang, C.; Lv, T.; Liu, X.; Wang, L. Ecological effects of atmospheric nitrogen deposition on soil enzyme activity. J. For. Res. 2013, 24, 109–114. [Google Scholar] [CrossRef]
- Schimel, J.P.; Bennett, J. Nitrogen mineralization: Challenges of a changing paradigm. Ecology 2004, 85, 591–602. [Google Scholar] [CrossRef]
- Fatemi, F.R.; Fernandez, I.J.; Simon, K.S.; Dail, D.B. Nitrogen and phosphorus regulation of soil enzyme activities in acid forest soils. Soil Biol. Biochem. 2016, 98, 171–179. [Google Scholar] [CrossRef] [Green Version]
- Crim, P.M.; McDonald, L.M.; Cumming, J.R. Soil and tree nutrient status of high elevation mixed red spruce (Picea rubens Sarg.) and broadleaf deciduous forests. Soil Syst. 2019, 3, 80. [Google Scholar] [CrossRef] [Green Version]
- DeForest, J.L. The influence of time, storage temperature, and substrate age on potential soil enzyme activity in acidic forest soils using MUB-linked substrates and l-DOPA. Soil Biol. Biochem. 2009, 41, 1180–1186. [Google Scholar] [CrossRef]
- Burns, R.G.; DeForest, J.L.; Marxsen, J.; Sinsabaugh, R.L.; Stromberger, M.E.; Wallenstein, M.D.; Weintraub, M.N.; Zoppini, A. Soil enzymes in a changing environment: Current knowledge and future directions. Soil Biol. Biochem. 2013, 58, 216–234. [Google Scholar] [CrossRef]
- German, D.P.; Weintraub, M.N.; Grandy, A.S.; Lauber, C.L.; Rinkes, Z.L.; Allison, S.D. Optimization of hydrolytic and oxidative enzyme methods for ecosystem studies. Soil Biol. Biochem. 2011, 43, 1387–1397. [Google Scholar] [CrossRef]
- Pind, A.; Freeman, C.; Lock, M.A. Enzymic degradation of phenolic materials in peatlands—Measurement of phenol oxidase activity. Plant Soil 1994, 159, 227–231. [Google Scholar] [CrossRef]
- Bach, C.E.; Warnock, D.D.; Van Horn, D.J.; Weintraub, M.N.; Sinsabaugh, R.L.; Allison, S.D.; German, D.P. Measuring phenol oxidase and peroxidase activities with pyrogallol, l-DOPA, and ABTS: Effect of assay conditions and soil type. Soil Biol. Biochem. 2013, 67, 183–191. [Google Scholar] [CrossRef] [Green Version]
- Floch, C.; Alarcon-Gutiérrez, E.; Criquet, S. ABTS assay of phenol oxidase activity in soil. J. Microbiol. Methods 2007, 71, 319–324. [Google Scholar] [CrossRef] [PubMed]
- Partavian, A.; Mikkelsen, T.N.; Vestergard, M. Plants increase laccase activity in soil with long-term elevated CO2 legacy. Eur. J. Soil Biol. 2015, 70, 97–103. [Google Scholar] [CrossRef]
- Burns, R.G. Enzyme activity in soil: Location and a possible role in microbial ecology. Soil Biol. Biochem. 1982, 14, 423–427. [Google Scholar] [CrossRef]
- Bourbonnais, R.; Paice, M.G. Oxidation of non-phenolic substrates. FEBS Lett. 1990, 267, 99–102. [Google Scholar] [CrossRef] [Green Version]
- Eichlerova, I.; Snajdr, J.; Baldrian, P. Laccase activity in soils: Considerations for the measurement of enzyme activity. Chemosphere 2012, 88, 1154–1160. [Google Scholar] [CrossRef] [PubMed]
- Allison, S.D.; Vitousek, P.M. Extracellular enzyme activities and carbon chemistry as drivers of tropical plant litter decomposition. Biotropica 2004, 36, 285–296. [Google Scholar] [CrossRef]
- JMP®. Version 14.0; SAS Institute Inc.: Cary, NC, USA, 2018; p. 414. Available online: https://support.sas.com/documentation/onlinedoc/jmp/14.0/Discovering-JMP.pdf (accessed on 20 April 2020).
- R Core Team. R: A Language and Environment for Statistical Computing; R Foundation for Statistical Computing: Vienna, Austria, 2019; Available online: https://www.R-project.org/ (accessed on 20 April 2020).
- Shortle, W.C.; Smith, K.T.; Minocha, R.; Lawrence, G.B.; David, M.B. Acidic deposition, cation mobilization, and biochemical indicators of stress in healthy red spruce. J. Environ. Qual. 1997, 26, 871–876. [Google Scholar] [CrossRef]
- Driscoll, C.T.; Lawrence, G.B.; Bulger, A.J.; Butler, T.J.; Cronan, C.S.; Eagar, C.; Lambert, K.F.; Likens, G.E.; Stoddard, J.L.; Weathers, K.C. Acidic deposition in the northeastern United States: Sources and inputs, ecosystem effects, and management strategies. Bioscience 2001, 51, 180–198. [Google Scholar] [CrossRef] [Green Version]
- Schaberg, P.G.; Tilley, J.W.; Hawley, G.J.; Dehayes, D.H.; Bailey, S.W. Associations of calcium and aluminum with the growth and health of sugar maple trees in Vermont. For. Ecol. Manag. 2006, 223, 159–169. [Google Scholar] [CrossRef]
- Hynicka, J.D.; Pett-Ridge, J.C.; Perakis, S.S. Nitrogen enrichment regulates calcium sources in forests. Glob. Chang. Biol. 2016, 22, 4067–4079. [Google Scholar] [CrossRef]
- Caldwell, B.A. Enzyme activities as a component of soil biodiversity: A review. Pedobiologia (Jena) 2005, 49, 637–644. [Google Scholar] [CrossRef]
- Edwards, I.P.; Zak, D.R.; Kellner, H.; Eisenlord, S.D.; Pregitzer, K.S. Simulated atmospheric N deposition alters fungal community composition and suppresses ligninolytic gene expression in a Northern Hardwood forest. PLoS ONE 2011, 6, e20421. [Google Scholar] [CrossRef] [PubMed] [Green Version]
- Taylor, A.R.; Wang, J.R.; Chen, H.Y.H. Carbon storage in a chronosequence of red spruce (Picea rubens) forests in central Nova Scotia, Canada. Can. J. For. Res. 2007, 37, 2260–2269. [Google Scholar] [CrossRef]
- Nottingham, A.C.; Thompson, J.A.; Wood, F.; Edwards, P.J.; Strager, M.P. Mapping pedomemory of spodic morphology using a species distribution model. Geoderma 2017, 352, 330–341. [Google Scholar] [CrossRef]
- Yang, N.; Zou, D.; Yang, M.; Lin, Z. Variations in soil microbial biomass carbon and soil dissolved organic carbon in the re-vegetation of hilly slopes with purple soil. PLoS ONE 2016, 11, e0166536. [Google Scholar] [CrossRef] [PubMed]
- Zhang, B.; Chen, S.Y.; Zhang, J.F.; He, X.Y.; Liu, W.J.; Zhao, Q.; Zhao, L.; Tian, C.J. Depth-related responses of soil microbial communities to experimental warming in an alpine meadow on the Qinghai-Tibet Plateau. Eur. J. Soil Sci. 2015, 66, 496–504. [Google Scholar] [CrossRef]
- Fall, D.; Diouf, D.; Zoubeirou, A.M.; Bakhoum, N.; Faye, A.; Sall, S.N. Effect of distance and depth on microbial biomass and mineral nitrogen content under Acacia senegal (L.) Willd. trees. J. Environ. Manag. 2012, 95, S260–S264. [Google Scholar] [CrossRef]
- Anderson, T.H.; Domsch, K.H. Soil microbial biomass: The eco-physiological approach. Soil Biol. Biochem. 2010, 42, 2039–2043. [Google Scholar] [CrossRef]
- Fierer, N.; Schimel, J.P.; Holden, P.A. Variations in microbial community composition through two soil depth profiles. Soil Biol. Biochem. 2003, 35, 167–176. [Google Scholar] [CrossRef]
- Agnelli, A.; Ascher, J.; Corti, G.; Ceccherini, M.T.; Nannipieri, P.; Pietramellara, G. Distribution of microbial communities in a forest soil profile investigated by microbial biomass, soil respiration and DGGE of total and extracellular DNA. Soil Biol. Biochem. 2004, 36, 859–868. [Google Scholar] [CrossRef]
- Thoms, C.; Gattinger, A.; Jacob, M.; Thomas, F.M.; Gleixner, G. Direct and indirect effects of tree diversity drive soil microbial diversity in temperate deciduous forest. Soil Biol. Biochem. 2010, 42, 1558–1565. [Google Scholar] [CrossRef]
- Zheng, H.; Chen, Y.; Liu, Y.; Zhang, J.; Yang, W.; Yang, L.; Li, H.; Wang, L.; Wu, F.; Guo, L. Litter quality drives the differentiation of microbial communities in the litter horizon across an alpine treeline ecotone in the eastern Tibetan Plateau. Sci. Rep. 2018, 8, 10029. [Google Scholar] [CrossRef] [PubMed]
- Smith, K.R.; Mathias, J.M.; McNeil, B.E.; Peterjohn, W.T.; Thomas, R.B. Site-level importance of broadleaf deciduous trees outweighs the legacy of high nitrogen (N) deposition on ecosystem N status of Central Appalachian red spruce forests. Plant Soil 2016, 508, 343–356. [Google Scholar] [CrossRef]
- Liu, M.; Sui, X.; Hu, Y.; Feng, F. Microbial community structure and the relationship with soil carbon and nitrogen in an original Korean pine forest of Changbai Mountain, China. BMC Microbiol. 2019, 19, 218. [Google Scholar] [CrossRef] [PubMed] [Green Version]
- Rustad, L.E.; Fernandez, I.J. Experimental soil warming effects on CO2 and CH4 flux from a low elevation spruce-fir forest soil in Maine, USA. Glob. Chang. Biol. 1998, 4, 597–605. [Google Scholar] [CrossRef] [Green Version]
- Tewksbury, C.E.; Van Miegroet, H. Soil organic carbon dynamics along a climatic gradient in a southern Appalachian spruce–fir forest. Can. J. For. Res. 2007, 37, 1161–1172. [Google Scholar] [CrossRef]
- Zhang, Z.; Yuan, Y.; Zhao, W.; He, H.; Li, D.; He, W.; Liu, Q.; Yin, H. Seasonal variations in the soil amino acid pool and flux following the conversion of a natural forest to a pine plantation on the eastern Tibetan Plateau, China. Soil Biol. Biochem. 2017, 105, 1–11. [Google Scholar] [CrossRef]
- Kittredge, H.A.; Cannone, T.; Funk, J.; Chapman, S.K. Soil respiration and extracellular enzyme production respond differently across seasons to elevated temperatures. Plant Soil 2018, 425, 351–361. [Google Scholar] [CrossRef]
- Frey, S.D.; Knorr, M.; Parrent, J.L.; Simpson, R.T. Chronic nitrogen enrichment affects the structure and function of the soil microbial community in temperate hardwood and pine forests. For. Ecol. Manag. 2004, 196, 159–171. [Google Scholar] [CrossRef]
- Ramirez, K.S.; Craine, J.M.; Fierer, N. Consistent effects of nitrogen amendments on soil microbial communities and processes across biomes. Glob. Chang. Biol. 2012, 18, 1918–1927. [Google Scholar] [CrossRef]
- Rossi, S.; Bordeleau, A.; Houle, D.; Morin, H. Effect of chronic ammonium nitrate addition on the ectomycorrhizal community in a black spruce stand. Can. J. For. Res. 2012, 42, 1204–1212. [Google Scholar] [CrossRef]
- Clemmensen, K.E.; Michelsen, A.; Jonasson, S.; Shaver, G.R. Increased abundance after ectomycorrhizal fungal fertilization and warming of two arctic tundra ecosystems. New Phytol. 2006, 171, 391–404. [Google Scholar] [CrossRef] [PubMed]
- Brzostek, E.R.; Finzi, A. Substrate supply, fine roots, and temperature control proteolytic enzyme activity in temperate forest soils. Ecology 2011, 92, 892–902. [Google Scholar] [CrossRef] [PubMed]
Figure 1.
Mean soil C, N, and P concentrations for organic and mineral fractions as functions of estimated total N deposition into high elevation spruce forests. Each symbol represents the mean beneath three replicate trees of each species. Regression lines are best fits across all species. Slopes ± SE [(mg kg−1) (kg N ha−1)−1] for the regressions are: Corg, 1133 ± 574, Cmin, 2421 ± 435, Norg, 64.7 ± 25.9, Nmin, 131.0 ± 20.9, Porg, −3.76 ± 0.70, and Pmin, 2.36 ± 0.56. All slopes are significant (p < 0.05).

Figure 2.
Extracellular soil enzymes (ESE) activities pooled across sites and sampling times by tree species for organic (left) and mineral (right) soil fractions. Stacked bars represent the mean activity for each enzyme for three replicate trees of each species assayed at four sites and at three times (n = 36).

Figure 3.
Activity of AP, BG, NAG, and LAC in mineral soil fraction as functions of estimated total N deposition into high elevation spruce forests. Each symbol represents the activity in samples beneath three replicate trees of each species. Regression lines are best fits across all species. Slopes ± SE [ln(µg g−1 h−1) (kg N ha−1)−1] for the regressions are: AP, 0.0115 ± 0.0027 (p < 0.001), BG, 0.0173 ± 0.0036 (p < 0.001), and NAG, 0.0161 ± 0.0041 (p < 0.001), LAC, 0.0026 ± 0.0018 (p = 0.161).

Figure 4.
Principle component analysis for soil extracellular enzyme activities and soil-level and plot-level predictors of ESE activities in the organic and mineral horizons, respectively. Symbol color intensity reflects N deposition at each site (light blue, low, to dark blue, high, N deposition).

Table 1.
F-statistics for three-way ANOVA tests for soil extracellular soil enzymes (ESE) activities.
Table 1.
F-statistics for three-way ANOVA tests for soil extracellular soil enzymes (ESE) activities.
| Factor | DF | AP | BG | NAG | LAC |
|---|---|---|---|---|---|
| Organic Fraction ESE Activity | |||||
| Month | 2 | 0.666 | 3.149 * | 4.640 * | 1.385 |
| Total Deposition | 1 | 0.004 | 1.684 | 0.710 | 0.718 |
| Species | 2 | 7.317 ** | 0.060 | 1.643 | 1.113 |
| Month × Deposition | 2 | 0.741 | 0.325 | 0.120 | 1.049 |
| Month × Species | 4 | 0.145 | 0.602 | 1.180 | 0.706 |
| Deposition × Species | 2 | 0.134 | 0.576 | 0.877 | 1.635 |
| Month × Deposition × Species | 4 | 0.582 | 2.110 | 0.448 | 0.786 |
| Mineral Fraction ESE Activity | |||||
| Month | 2 | 0.271 | 2.627 | 1.480 | 0.360 |
| Total Deposition | 1 | 17.883 *** | 25.011 *** | 17.741 *** | 1.914 |
| Species | 2 | 1.874 | 0.782 | 0.286 | 3.637 * |
| Month × Deposition | 2 | 2.346 | 1.183 | 2.254 | 0.669 |
| Month × Species | 4 | 2.891 * | 1.196 | 1.055 | 1.171 |
| Deposition × Species | 2 | 4.949 * | 3.634 * | 2.320 | 0.793 |
| Month × Deposition × Species | 4 | 1.987 | 0.467 | 3.377 * | 0.921 |
* p < 0.05, ** p < 0.01, *** p < 0.001.
Table 2.
Parameter estimates for multiple linear regression of soil-level and plot-level predictors of ESE activities.
Table 2.
Parameter estimates for multiple linear regression of soil-level and plot-level predictors of ESE activities.
| Factor | AP | BG | NAG | LAC |
|---|---|---|---|---|
| Soil C (%) | 0.0073 | 0.0127 | −0.0098 | −0.0056 |
| Soil N (%) | −0.1606 | −0.3901 | 0.3888 | 0.1173 |
| Soil P (mg kg−1) | −0.0001 | −0.0001 | −0.0001 | 0.0001 |
| Mycorrhizal Type [ECM–AM] † | 0.0012 | −0.0561 | 0.0103 | 0.0169 |
| Soil Fraction [O–M] † | 0.7489 *** | 0.8020 *** | 1.076 *** | 0.3232 *** |
| Plot Broadleaf RIV | −0.0629 *** | −0.0762 *** | −0.0624 ** | −0.0285 |
| Plot Shannon Diversity | 1.827 ** | 2.429 *** | 1.602 * | 1.158 * |
| Plot ECM RIV | 0.0747 ** | 0.1272 *** | 0.0627 * | 0.0473 * |
| R2 | 0.4748 | 0.4431 | 0.5245 | 0.1534 |
| Pmodel | <0.0001 | <0.0001 | <0.0001 | <0.001 |
† Parameter estimate for the difference in response between ECM and AM hosts and between mineral (M) and organic (O) fractions, respectively. * p < 0.05, ** p < 0.01, *** p < 0.001.
Table 3.
Principle component loadings for soil-level and plot-level factors, ESE activities, and N deposition in high elevation red spruce forests. ESE activities were natural log transformed. Values marked with * contribute disproportionately to the PC loadings.
Table 3.
Principle component loadings for soil-level and plot-level factors, ESE activities, and N deposition in high elevation red spruce forests. ESE activities were natural log transformed. Values marked with * contribute disproportionately to the PC loadings.
| Organic Fraction | ||||
|---|---|---|---|---|
| Factor | PC1 | PC2 | PC3 | PC4 |
| % Variation | 35.3 | 18.8 | 15.4 | 8.2 |
| Ln AP | −0.0123 | 0.6876 * | −0.3729 * | −0.0655 |
| Ln BG | 0.1550 | 0.6539 * | −0.0518 | 0.2456 |
| Ln NAG | 0.1823 | 0.7893 * | −0.0361 | −0.1083 |
| Ln LAC | −0.0755 | 0.5304 * | −0.1304 | 0.4710 * |
| Soil C (%) | 0.5201 * | 0.2760 | 0.7677 * | −0.1472 |
| Soil N (%) | 0.5802 * | 0.2127 | 0.7500 * | −0.1279 |
| Soil P (mg kg−1) | −0.6600 * | 0.1510 | 0.0101 | −0.3866 * |
| Plot Broadleaf RIV | −0.6803* | −0.1070 | 0.4515 * | 0.4662 * |
| Shannon Index | −0.8951 * | 0.0968 | 0.3541 * | 0.1685 |
| Plot ECM RIV | 0.7857 * | −0.2749 | 0.0089 | 0.4019 * |
| N Deposition | 0.9467 * | −0.1418 | −0.2222 | 0.0678 |
| Mineral Fraction | ||||
| % Variation | 39.6 | 16.8 | 14.4 | 9.0 |
| Ln AP | 0.5479 * | 0.4771 * | 0.4186 * | −0.2655 |
| Ln BG | 0.5474 * | 0.5809 * | 0.2683 | −0.0050 |
| Ln NAG | 0.5443 * | 0.5108 * | 0.3081 | −0.2963 |
| Ln LAC | 0.1788 | 0.3263 | 0.3637 * | 0.6830 * |
| Soil C (%) | 0.4375 * | −0.6663 * | 0.5397 * | −0.1597 |
| Soil N (%) | 0.4908 * | −0.6549 * | 0.5378 * | −0.0700 |
| Soil P (mg kg−1) | 0.6149 * | 0.0096 | −0.1796 | −0.0634 |
| Plot Broadleaf RIV | −0.6711 * | 0.0030 | 0.4961 * | 0.3031 |
| Shannon Index | −0.8681 * | 0.0951 | 0.4336 * | −0.0292 |
| Plot ECM RIV | 0.7540 * | −0.1556 | −0.0425 | 0.4547 * |
| N Deposition | 0.9187 * | −0.1164 | −0.2800 | 0.1805 |
© 2020 by the authors. Licensee MDPI, Basel, Switzerland. This article is an open access article distributed under the terms and conditions of the Creative Commons Attribution (CC BY) license (http://creativecommons.org/licenses/by/4.0/).
Share and Cite
MDPI and ACS Style
Crim, P.M.; Cumming, J.R. Extracellular Soil Enzyme Activities in High-Elevation Mixed Red Spruce Forests in Central Appalachia, U.S.A. Forests 2020, 11, 468. https://0-doi-org.brum.beds.ac.uk/10.3390/f11040468
AMA Style
Crim PM, Cumming JR. Extracellular Soil Enzyme Activities in High-Elevation Mixed Red Spruce Forests in Central Appalachia, U.S.A. Forests. 2020; 11(4):468. https://0-doi-org.brum.beds.ac.uk/10.3390/f11040468
Chicago/Turabian StyleCrim, Philip M., and Jonathan R. Cumming. 2020. "Extracellular Soil Enzyme Activities in High-Elevation Mixed Red Spruce Forests in Central Appalachia, U.S.A." Forests 11, no. 4: 468. https://0-doi-org.brum.beds.ac.uk/10.3390/f11040468
Note that from the first issue of 2016, this journal uses article numbers instead of page numbers. See further details here.