Cell Wall Saturation Limit and Selected Properties of Thermally Modified Oak Wood and Cellulose


1
Faculty of Wood Sciences and Technology, Technical University in Zvolen, T.G. Masaryka 24, 96001 Zvolen, Slovakia
2
Department of Chemistry, Czech University of Life Sciences Prague, Kamýcká 129, 169 21 Prague 6, Czech Republic
*
Author to whom correspondence should be addressed.
Forests 2020, 11(6), 640; https://0-doi-org.brum.beds.ac.uk/10.3390/f11060640
Submission received: 11 May 2020
/
Revised: 27 May 2020
/
Accepted: 3 June 2020
/
Published: 5 June 2020
(This article belongs to the Special Issue Performance of Wood and Wood-Based Materials)
Abstract
:The interaction of water and oak wood is common in outdoor expositions and will remain a probable occurrence in the future. New insights into the recognition of a cell wall saturation limit are presented by a double-weighing method at 20 °C. The cell wall saturation limit, as the property of thermally modified oak wood, is significantly influenced by different treatment temperatures (20, 160, 180, 210 and 240 °C) on a 5% alpha level. A significantly higher equilibrium moisture content was reached by thermally modified oak wood at a temperature of 20 °C and relative humidity of 65% after its equilibrium in the water-in-reservoir. Moreover, the results are used in the treatment of woodchips to produce cellulose or decomposition of thermally modified wood to its basic chemical components. The investigated properties of cellulose revealed its relationship with water. The number of water molecules bonded to a cellulose chain was correlated with other measured compositions: average molecular weight, total crystalline index, lateral order index and polydispersity index. Analyses showed that there was a strong negative correlation between lateral order index and average molecular weight. The same was true between total crystalline index and average molecular weight. The rest of the properties were positively correlated with the number of water molecules bonded to glucopyranose. The results revealed the possible regeneration of a wood sorption ability after heat treatment and the stability of cellulose in such process.
1. Introduction
Wood is often subjected to water in outside expositions. An example of permanently used wood in contact with water is wood in hydraulic structures [1]. Woodchip-soaking or paper-swelling are examples of processing cellulosic materials in contact with water or polar solvents [2]. If wood is in contact with the water-in-reservoir, the wood is fully saturated with water after a long period of soaking and remains compact. Such an equilibrium is characterized by a maximum moisture content of wood at a given temperature. The equilibrium is reached if the rate of moisture content change is substantially lower than the ratio of the maximum moisture content to the relaxation time of soaking of wood in the water-in-reservoir. The maximum moisture content is one aspect of a sorption isotherm as is documented in the study of [3]. The summarizing study of [3] divided moisture in wood according to different mechanisms of water bonding of wood. Another study [4] added the capillary condensation term to the Brunauer, Emmet and Teller isotherm. The maximum moisture content of wood is the sum of the maximum moisture content of bound water of wood and maximum moisture content of free water of wood. Then, the question arises as to whether it is possible to distinguish the amount of bound and free water of wood during sorption. The method of [5,6] can recognize bound and free water on the basis of Archimedes’ principle. If the moisture content of wood is the property, it therefore must depend only on the state of the wood. Therefore, the method is useable only in the equilibrium of wood with the water-in-reservoir or in the sorption of water in the wood. The equilibrium of wood in the water-in-reservoir is suitable for the purpose of this study. The maximum moisture content of bound water of wood in the water-in-reservoir is defined by [7] as the cell wall saturation limit:
where ρrc is the basic density, ρ0 is the oven-dried density, and ρH2O is the density of water. Then, the maximum moisture content of free water is a result of the subtraction of the maximum moisture content and the cell wall saturation limit. The change in bound water mass causes wood swelling and changing of wood volume [5]. The change in free water mass causes only the change of wood mass [6]. The lower moisture content is reached by thermally modified wood in the environment of moist air [8,9,10,11]. The lower equilibrium moisture content is responsible for the reduction of wood swelling [12]. Thermally treated wood is mainly suitable for outdoor exposition, and can, for example, reduce swelling in a changing climate. Furthermore, different odors of thermally treated wood may lead to discomfort in an indoor environment in comparison to wood without thermal modification. Therefore, the soaking of wood in water in the reservoir is a method of reducing the unpleasant effect of wood modification. It is assumed that the cell wall saturation limit will be influenced by thermal treatment. As far as bound water is bonded in wood on the amorphous part of cellulose on—OH free groups by—H bonding [13], the next hypothesis is that the number of water molecules bonding on glucopyranose will be changed. Finally, the moisture content of thermally modified wood will not be regenerated to the original value of wood without thermal modification by soaking. Therefore, this study aims to show the formulas defining the mass and moisture contents of bound and free water of wood in equilibrium with the water-in-reservoir. The formulas are based only on state variables. Moreover, the formulas are used to determine maximum moisture contents of bound and free water of thermally modified wood and reference samples in the water-in-reservoir. Then, the oven-dried mass is measured. Next, the wood is put into humid air with a temperature of 20 °C and relative humidity of 65% to reach equilibrium again. Moreover, cellulose is produced from thermally modified wood before soaking and a number of water molecules bonded on it are determined to show the number of sorption sites on glucopyranose and cellulose to support or reject the previous results. The other cellulose structural properties are measured to support the results. The changes on macromolecular traits of cellulose (the total crystallinity index (TCI), the lateral order index (LOI), molecular weight, polydispersity) are determined by FTIR and Gel Permeation Chromatography (GPC).
2. Materials and Methods
Oak wood (Quercus robur L.) was obtained from Budča, Central Slovakia. The age of the logging wood was 96 years. It had a diameter of 40 cm. A final moisture content of 10% for flat-sawn timber dimensions of 500 mm per 25 mm in thickness was achieved by the kiln drying method at the Technical University in Zvolen. Then, hydrothermal treatment was performed at the Volga State University of Technology in Joškar-Ola, Russia [14,15]. Ten pieces of timber were thermally treated according to the following procedure:
1st period: the lumber was air-oven-dried at a temperature of 105 °C to constant mass for 24 h.
2nd period: the lumber was heated to different treatment temperatures (160, 180, 210 and 240 °C) for 5 h.
3rd period: the lumber was cooled to an ambient temperature of 20 °C and the target moisture content was reached up to the desired value by the water spraying method (Table 1).
The parts of treated oak timbers were equilibrated with humid air in a climatic chamber Binder KBF 720 (Tuttlingen, Germany). The controlled parameters of humid air were at a relative humidity of 65% and a temperature of 20 °C. The equilibrium was detected according to the constant mass of the moisture specimen of timber using the technical scales Kern KB 1000-2 (Balingen, Germany). The equilibrated oak was used for the specimen production of cubic shape with a dimension of 8 mm.
2.1. Method of Cell Wall Saturation Limit Determination
Sixty replicates of 8 × 8 × 8 mm3 were cut for each modifying temperature. The moisture content w of specimens was measured as follows [16]:
where m is the mass of the specimen and m0 is the oven-dried mass of the specimen, and the moisture content was always measured at a temperature of 20 °C and normal pressure. The masses were measured with the scales Radwag XA 60/220/X (Radom, Poland) equipped with a density determination kit for double weighing.
The specimens were divided into two parts after the specimens were dried to an oven-dried state. Half of the specimens (150 specimens) were used for producing cellulose and the other half was immersed into water in 500-mL flasks to reach the maximum moisture content at a temperature of 20 °C. Water and water extractives were replaced every month for one year to simulate wood in the water-in-reservoir. The method of double weighing was performed to measure the maximum moisture contents of bound and free water of wood. The method is based on Archimedes’ principle.
The mass of wood substance ms and the mass of water compose the mass of wood mmax, which is in equilibrium with the water-in-reservoir:
Later, the density ρ as an intensive property was computed based on extensive properties. The density is defined as the mass of the object m in its unit volume V:
The concentration of a component in the volume of a specimen is the ratio of the mass of the component and volume of the specimen, and the concentration of a component is equal to the density of the component if and only if the component is alone in the volume of the specimen.
Such a scheme is also involved in the measurement of the mass of displaced water mvv and apparent mass mz in Archimedes’ principle:
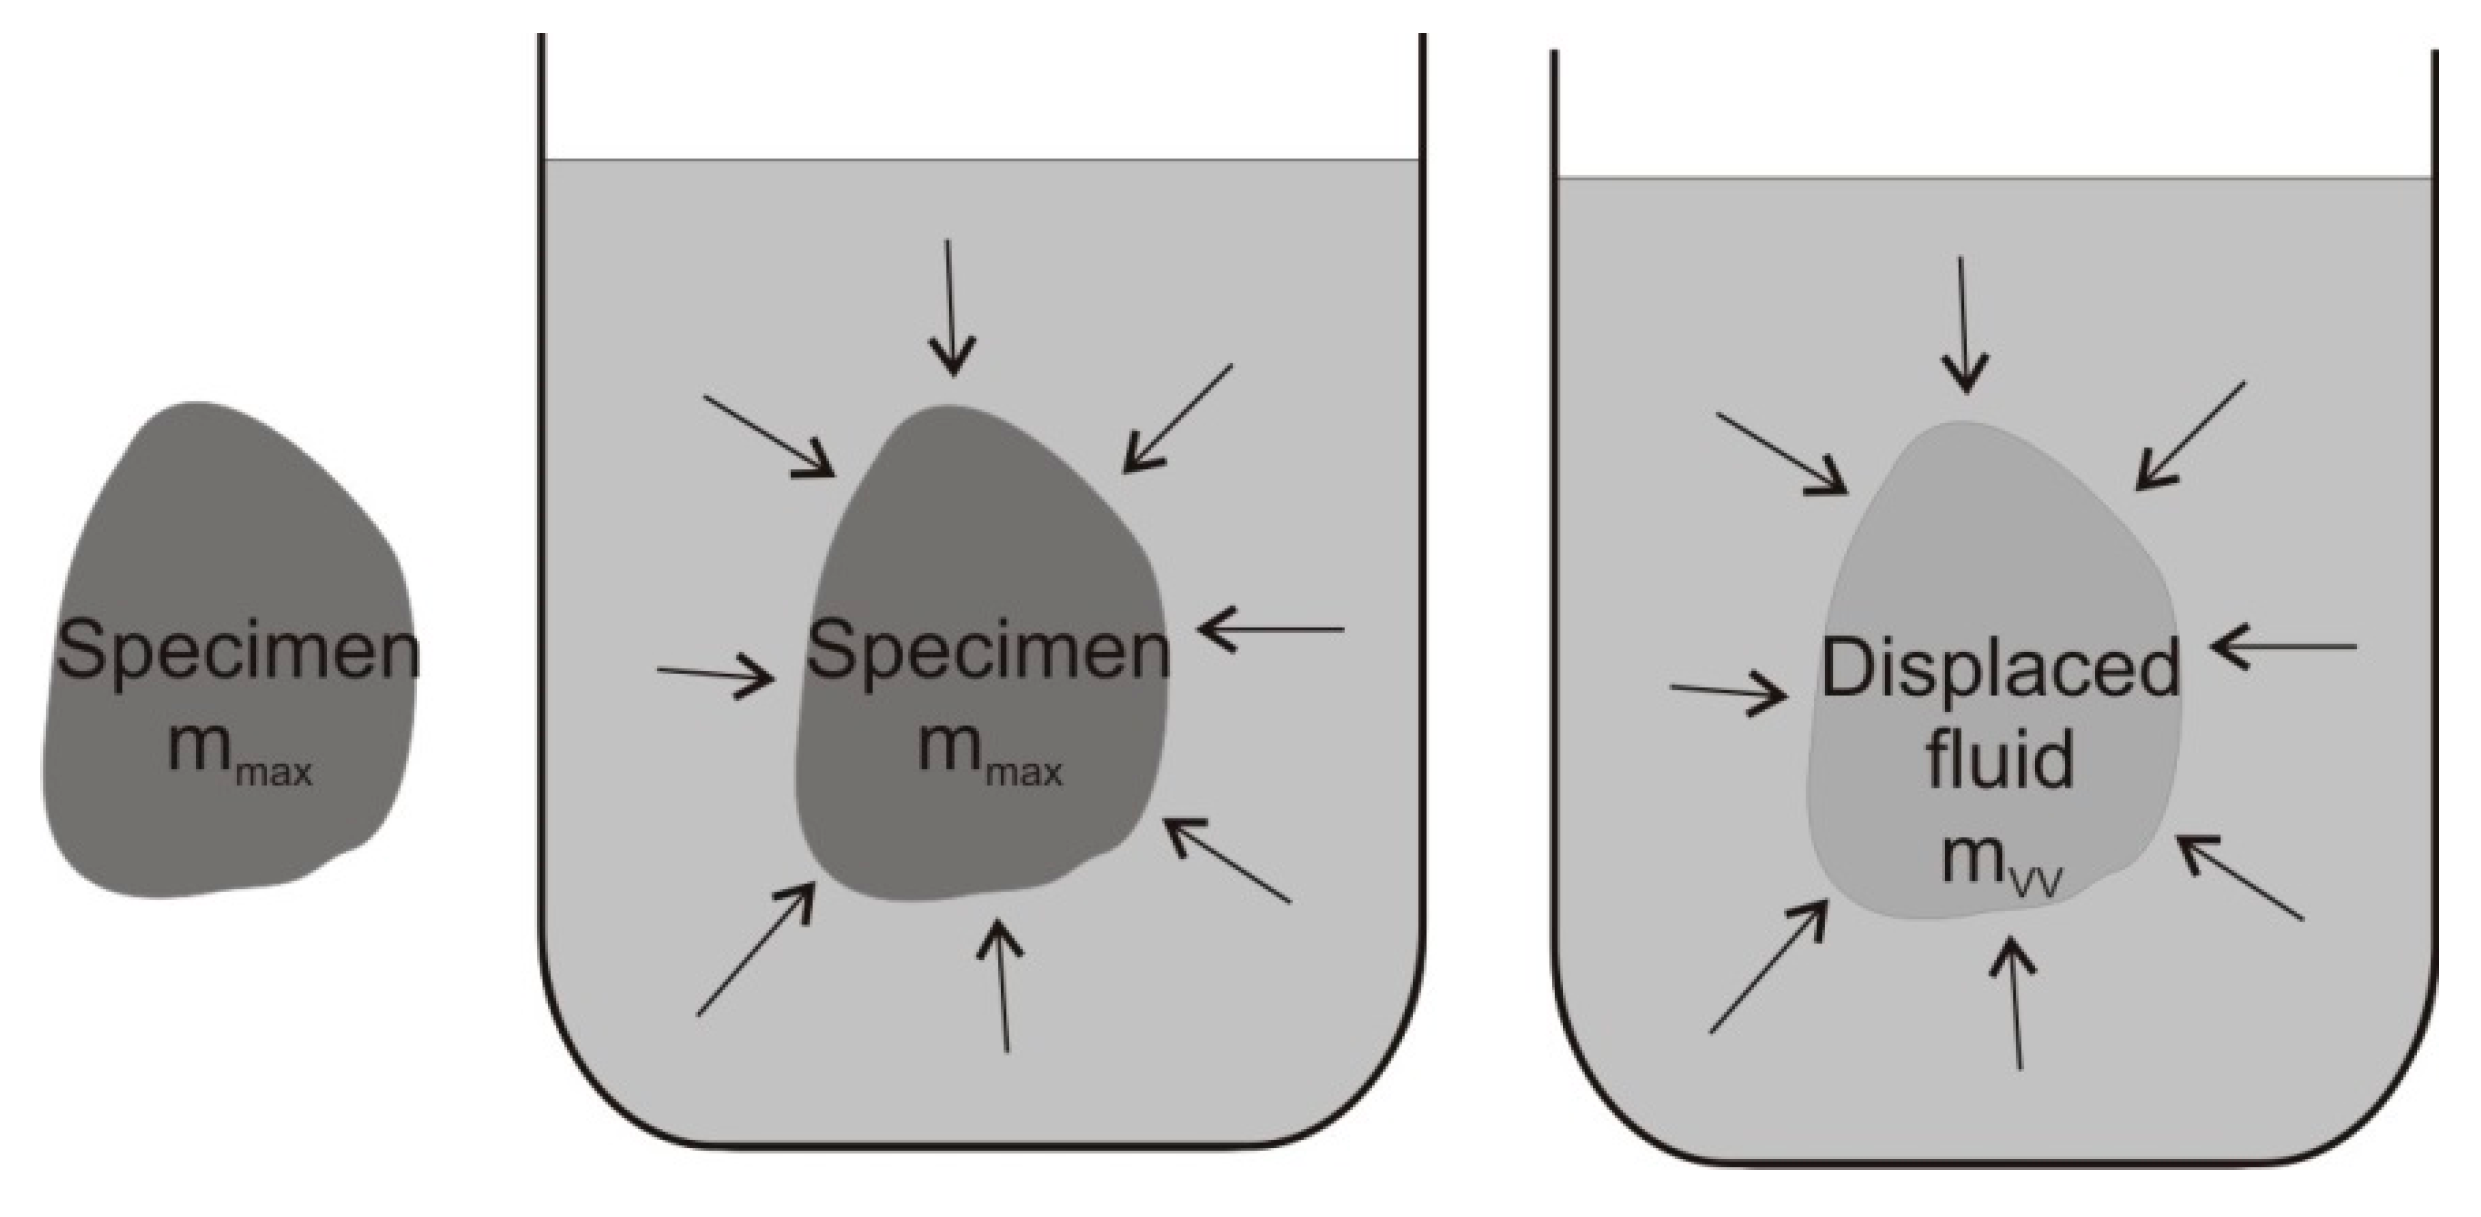
Apparent mass can be seen as a meaningless concept, but it completes the mass of displaced water due to Archimedes’ principle to the mass of wood (Figure 1).
According to Archimedes’ principle, the mass of wood mmax is determined if the wood is in equilibrium with the water-in-reservoir. The product of displaced water density (water-in-reservoir density) and wood volume Vmax is the mass of the displaced water. Since the free water density is equal to the density of displaced water, the wood cell wall density ρBSmax is determined according to Archimedes’ principle in equilibrium with the water-in-reservoir:
The wood cell wall density ρBSmax is the sum of two concentrations on the same basis VBSmax (volume of the wood cell wall). These concentrations must be (i) the concentration of a wood substance in wood cell wall volume and (ii) the concentration of bound water in wood cell wall volume according to the order of items in Equation (5). The experiment must be done to exclude equality between apparent mass and mass of the wood substance. If the wood is not in equilibrium with the water-in-reservoir, many wood specimens do not completely sink under the water level. Moreover, if the wood is in equilibrium with the water-in-reservoir, wood always sinks under the water level or else the apparent mass is not equal to the mass of the wood substance. Additionally, if the free water density is equal to the displaced water density, then the free water mass cannot contribute to apparent mass mz. Finally, the apparent mass of equilibrated wood in the water-in-reservoir is the mass of the bound water [17].
2.2. Meaningful Formulas
The mass of water in wood is the sum of the mass of free water and the mass of bound water. Moreover, the following formula is derived based on Archimedes’ principle:
The mass of free water is equal to the difference between the displaced water mass and the mass of the wood substance. The non-negative remainder of the mass of free water to whole water in wood is the mass of bound water. As wood moisture content is a property of wood and it strictly relates to one state, it is convenient to define it as a ratio of the mass of water in wood to the mass of the wood substance:
The definition of the maximum of free water moisture content of wood in equilibrium with the surrounding water-in-reservoir is
The definition of the maximum of bound water moisture content of wood in equilibrium with the surrounding water-in-reservoir is
which is equal to the cell wall saturation limit.
2.3. The Measurement Method of Macromolecular Traits of Cellulose
The samples (untreated and thermally treated) were mechanically disintegrated to sawdust. In a Soxhlet apparatus, sawdust fractions of 0.5 to 1.0 were extracted with a mixture of ethanol and toluene according to American Standard Test Methods [18].
The cellulose of untreated and thermally treated wood was isolated using the Seifert method [19]. Molecular weights of the cellulose samples were calculated after their conversion into cellulose tricarbanilates. Cellulose tricarbanilates were dissolved in tetrahydrofuran and filtered through a Puradisc 25 NYL filter (Whatman International, Maidstone, UK) with a pore size of 0.45 µm. Size-exclusion chromatography was performed at 35 °C with tetrahydrofuran at a flow rate of 1 mL·min–1 on a PLgel, 10 μm, 7.5 × 300 mm, MIXED-B column (Agilent, Santa Clara, CA, USA) preceded by a PLgel, 10 μm, 7.5 × 50 mm, guard–column (Agilent, Santa Clara, CA, USA) as described by [20]. Data acquisitions were carried out with ChemStation software (Agilent, Santa Clara, CA, USA), and calculations were performed with the Clarity GPC module (DataApex, Prague, Czech Republic). The polydispersity of cellulose was calculated as the ratio of Mw to Mn. The values of weight–average molecular weight, and number–average molecular weight were recalculated to underivatized cellulose using the coefficient 0.31214. Measurements were performed on four replicates per each treatment condition.
FT-IR spectra (Fourier transform—infrared) of isolated cellulose were recorded on a Nicolet iS10 spectrometer equipped with a Smart iTR attenuated total reflectance sampling accessory and diamond crystal (Thermo Fisher Scientific). The spectrum was acquired by accumulating 64 scans at a resolution of 4 cm−1 in absorbance mode (A) from 4000 to 650 cm−1 and normalized at approximately 2900 cm−1 (C–H stretching vibrations). The spectra were measured using OMNIC 8.0 software (Thermo Scientific). Four measurements per sample were performed.
2.4. Determination Method of Bound Water Number Molecules on Cellulose
The maximum bound water moisture content of cellulose was determined according to Equation (9). A total of 50 mg of oven-dried cellulose mc was placed to the water environment in a glass flask of known mass (apparent mass of glass flask). The apparent mass of cellulose mz is equal to the mass of cellulose in the environment of water and is equal to the maximum mass of bound water bonded to cellulose. In general, apparent mass is quantitative property; therefore, a number of water molecules NC1 bonded to glucopyranose was determined according to the formula:
where MH2O is the molar mass of water (18.015 g.mol−1), mc is an oven-dried mass of cellulose, and Mc is the molar mass of glucopyranose (162.144 g.mol−1).
To analyze the expected relationship between selected variables (structural traits of cellulose, the number of water molecules on glucopyranose), the method of correlation analysis was used. At a significance level of α = 0.05, we tested the hypothesis of linear dependence between the mentioned variables. The computed linear correlation coefficients and the corresponding p-value detected the variables with significant positive or negative linear correlations [21]. The statistical data evaluation based on the correlation was computed by Matlab2018.
3. Results and Discussion
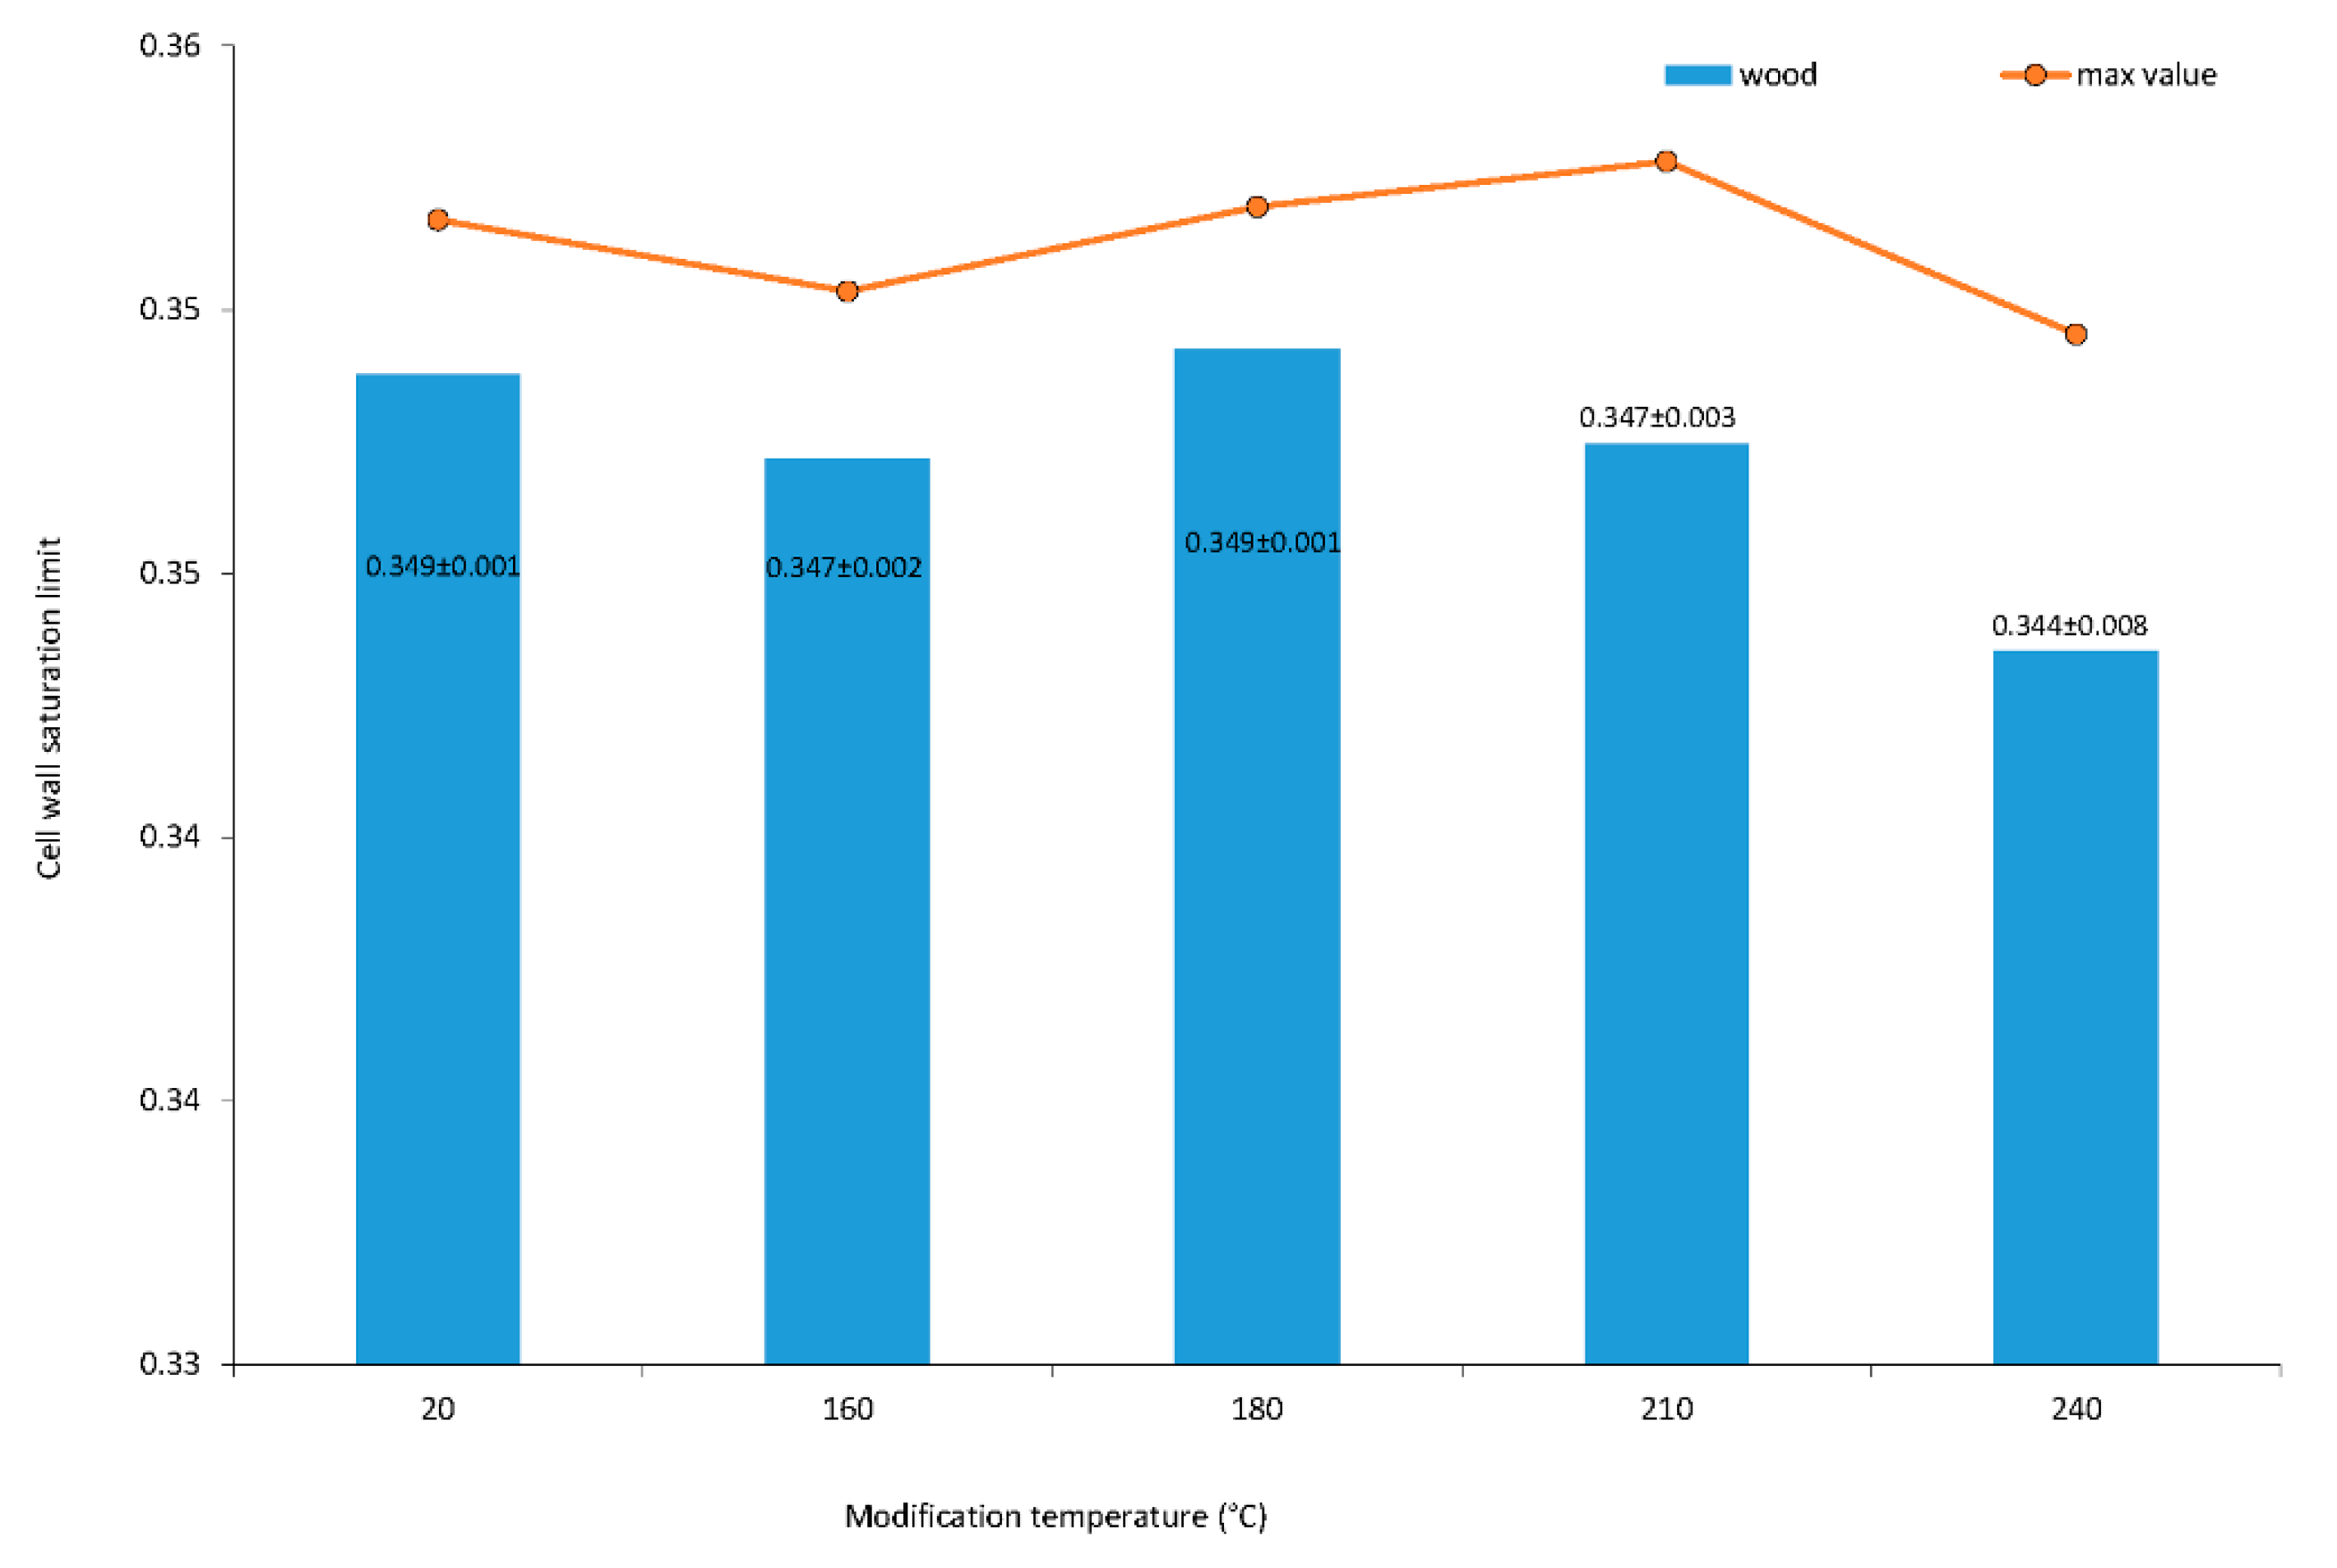
The cell wall saturation limit designed in the article [7] was broadened by [5,6] using the concept of the oven dry density and basic density of wood. The proposed method of the cell wall saturation limit measurement takes advantage using the oven dry mass and apparent mass in the equilibrium of specimen in the water-in-reservoir without the necessity of the measurement of the oven dry volume. Therefore, the cell wall saturation limit is equal to the maximum bound water moisture content. The cell wall saturation limit of wood after thermal modification is shown in Figure 2. The factor of modification temperature is significant. The data are heteroscedastic, and averages are not equal on 0.05 alpha levels among homogeneous groups of 20, 180, 160, 210 and 240 °C.
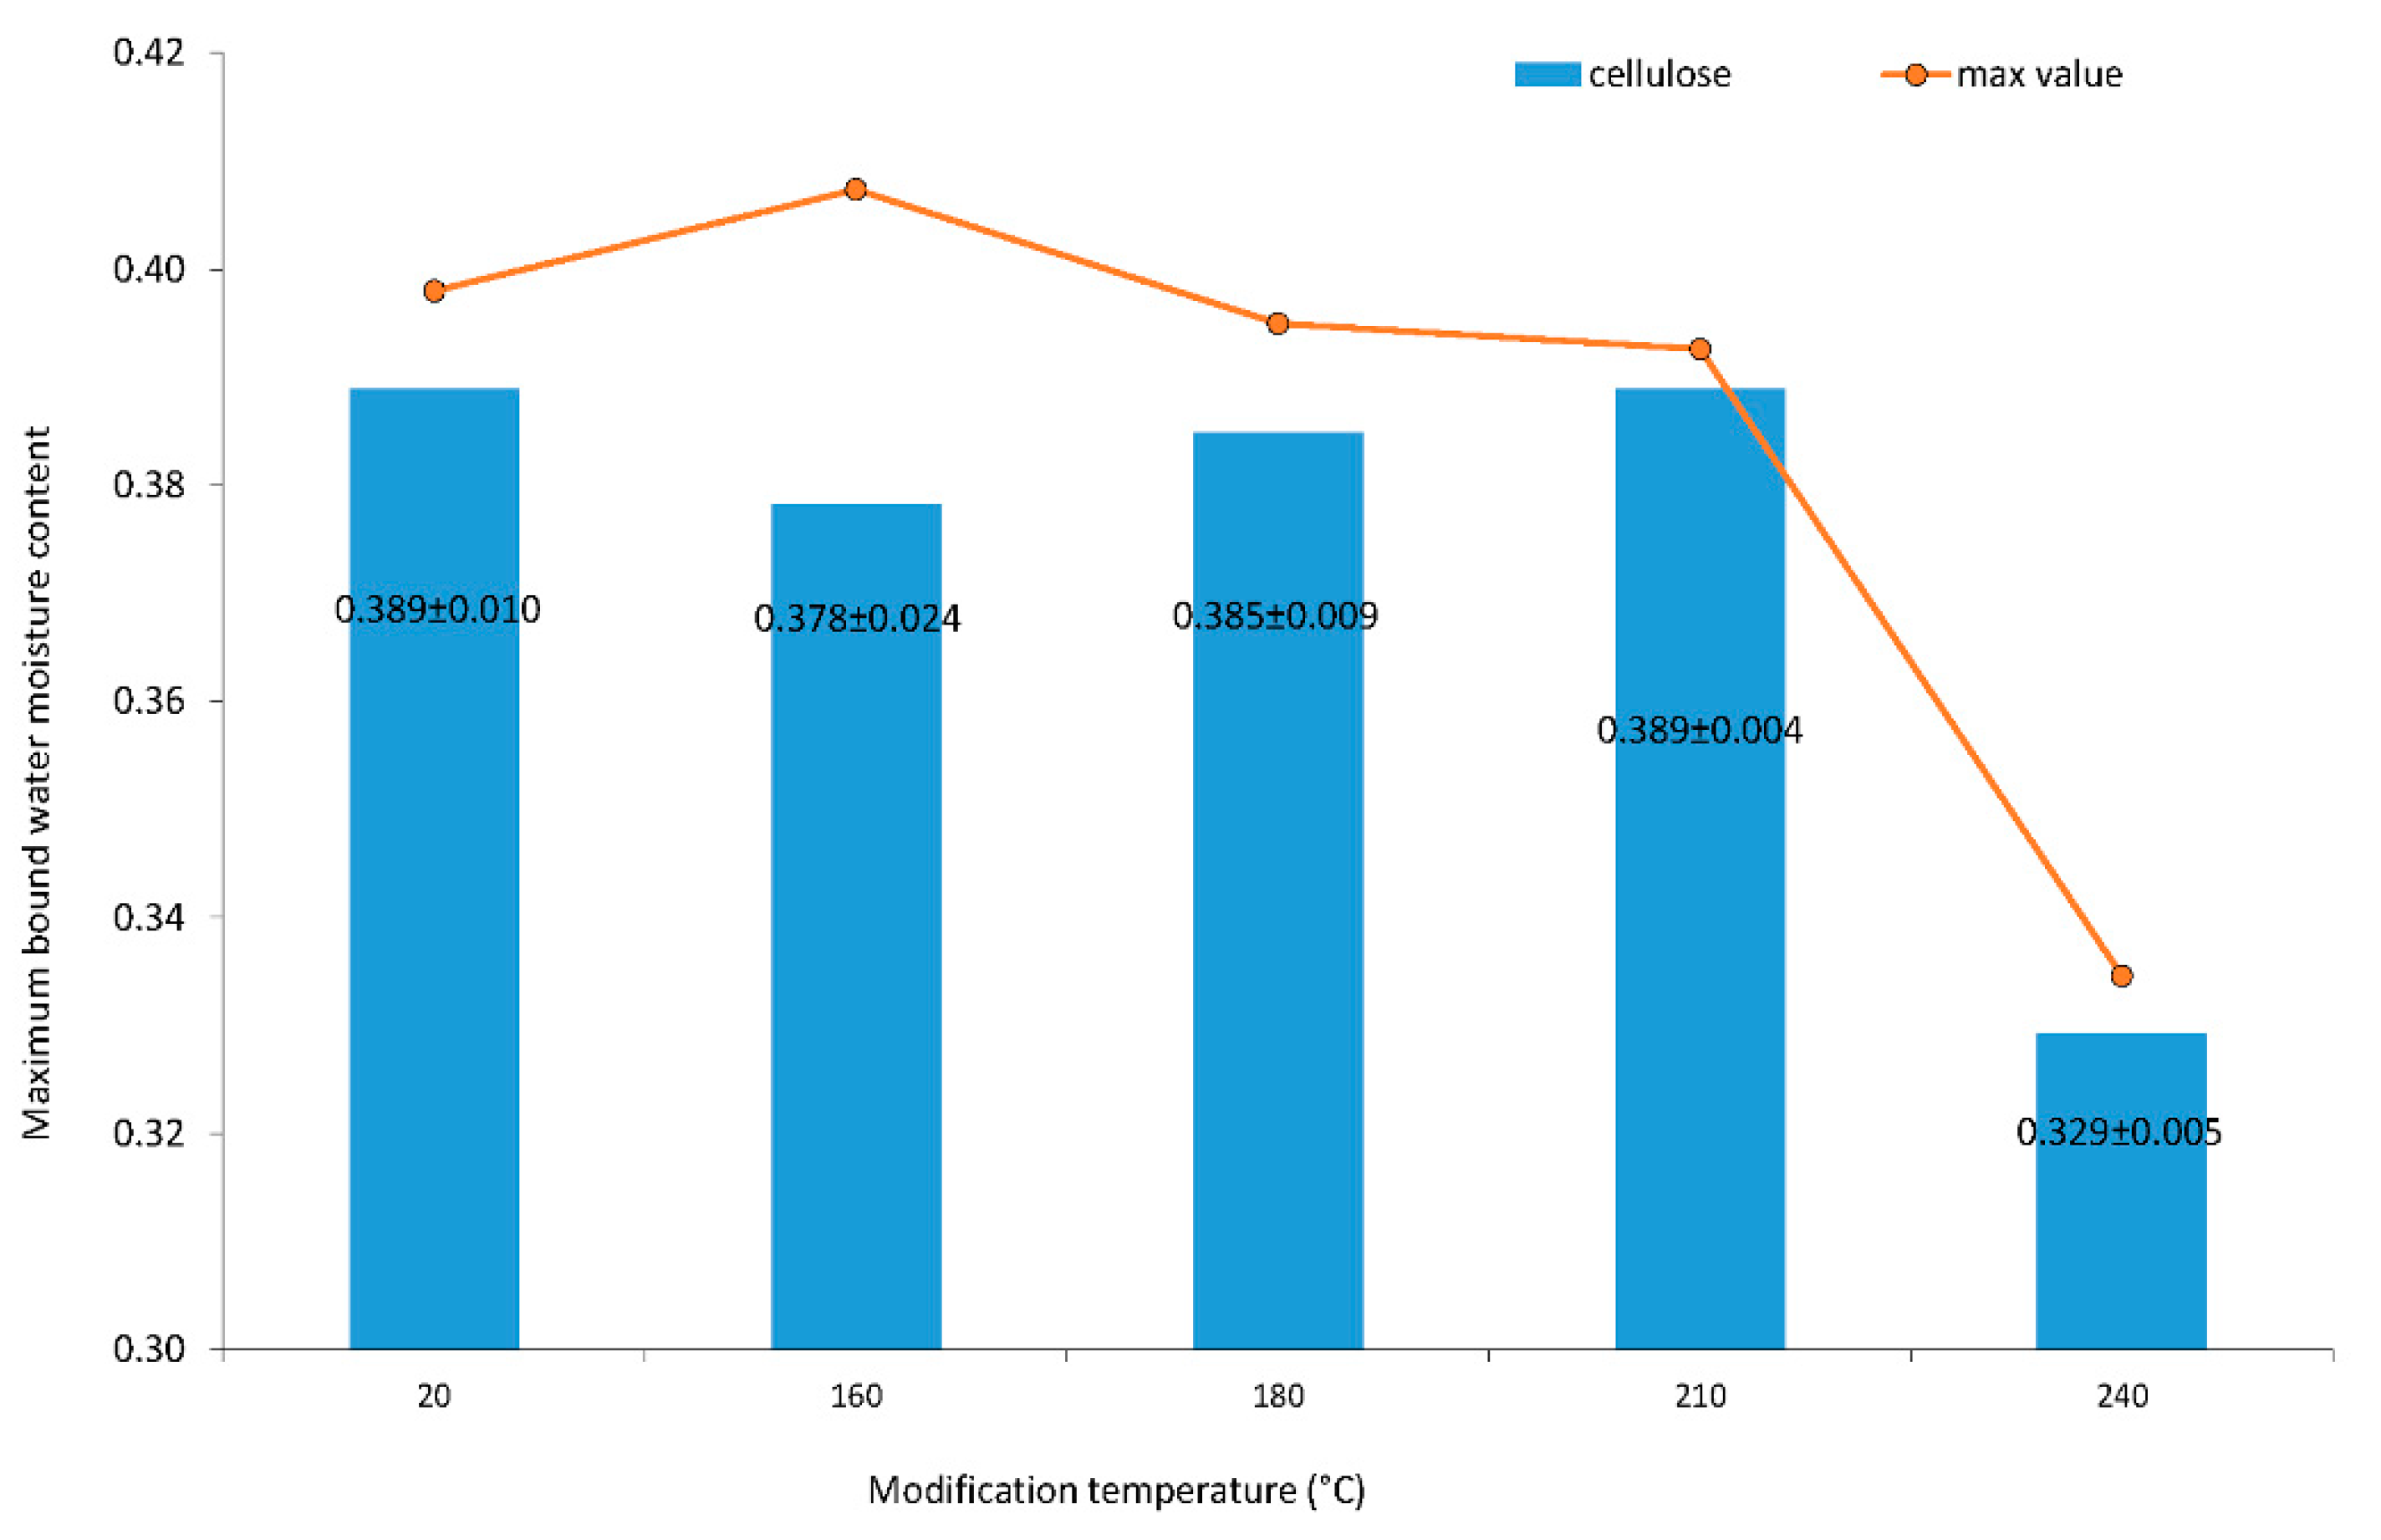
The maximum bound water moisture content of cellulose is shown in Figure 3. The data are heteroscedastic, and averages are not equal on 0.05 alpha levels between homogeneous groups of 20, 180, 160, 210 and 240 °C. Cellulose is stable until 210 °C. The maximum bound water moisture content of cellulose decreased significantly for cellulose modified at a temperature of 240 °C.
The number of water molecules per glucopyranose was constant until the modification temperature was under 210 °C. The number was 3.5 molecules of water per glucopyranose unit. The number of 3.4 molecules of water per glucopyranose unit at 160 °C was the statistically insignificant exception in determination. This deviation may occur because of a large standard deviation of specimens’ files variability at 160 °C (Figure 3). When the modification temperature was 240 °C, then the number of water molecules per glucopyranose unit of cellulose dropped to 3.
The total crystallinity index (TCI) and the lateral order index (LOI) were determined from the FTIR spectra of cellulose. These parameters were used to determine the changes in cellulose crystallinity. The TCI is proportional to the overall degree of cellular crystallinity in wood. The LOI represents the ordered regions perpendicular to the chain direction.
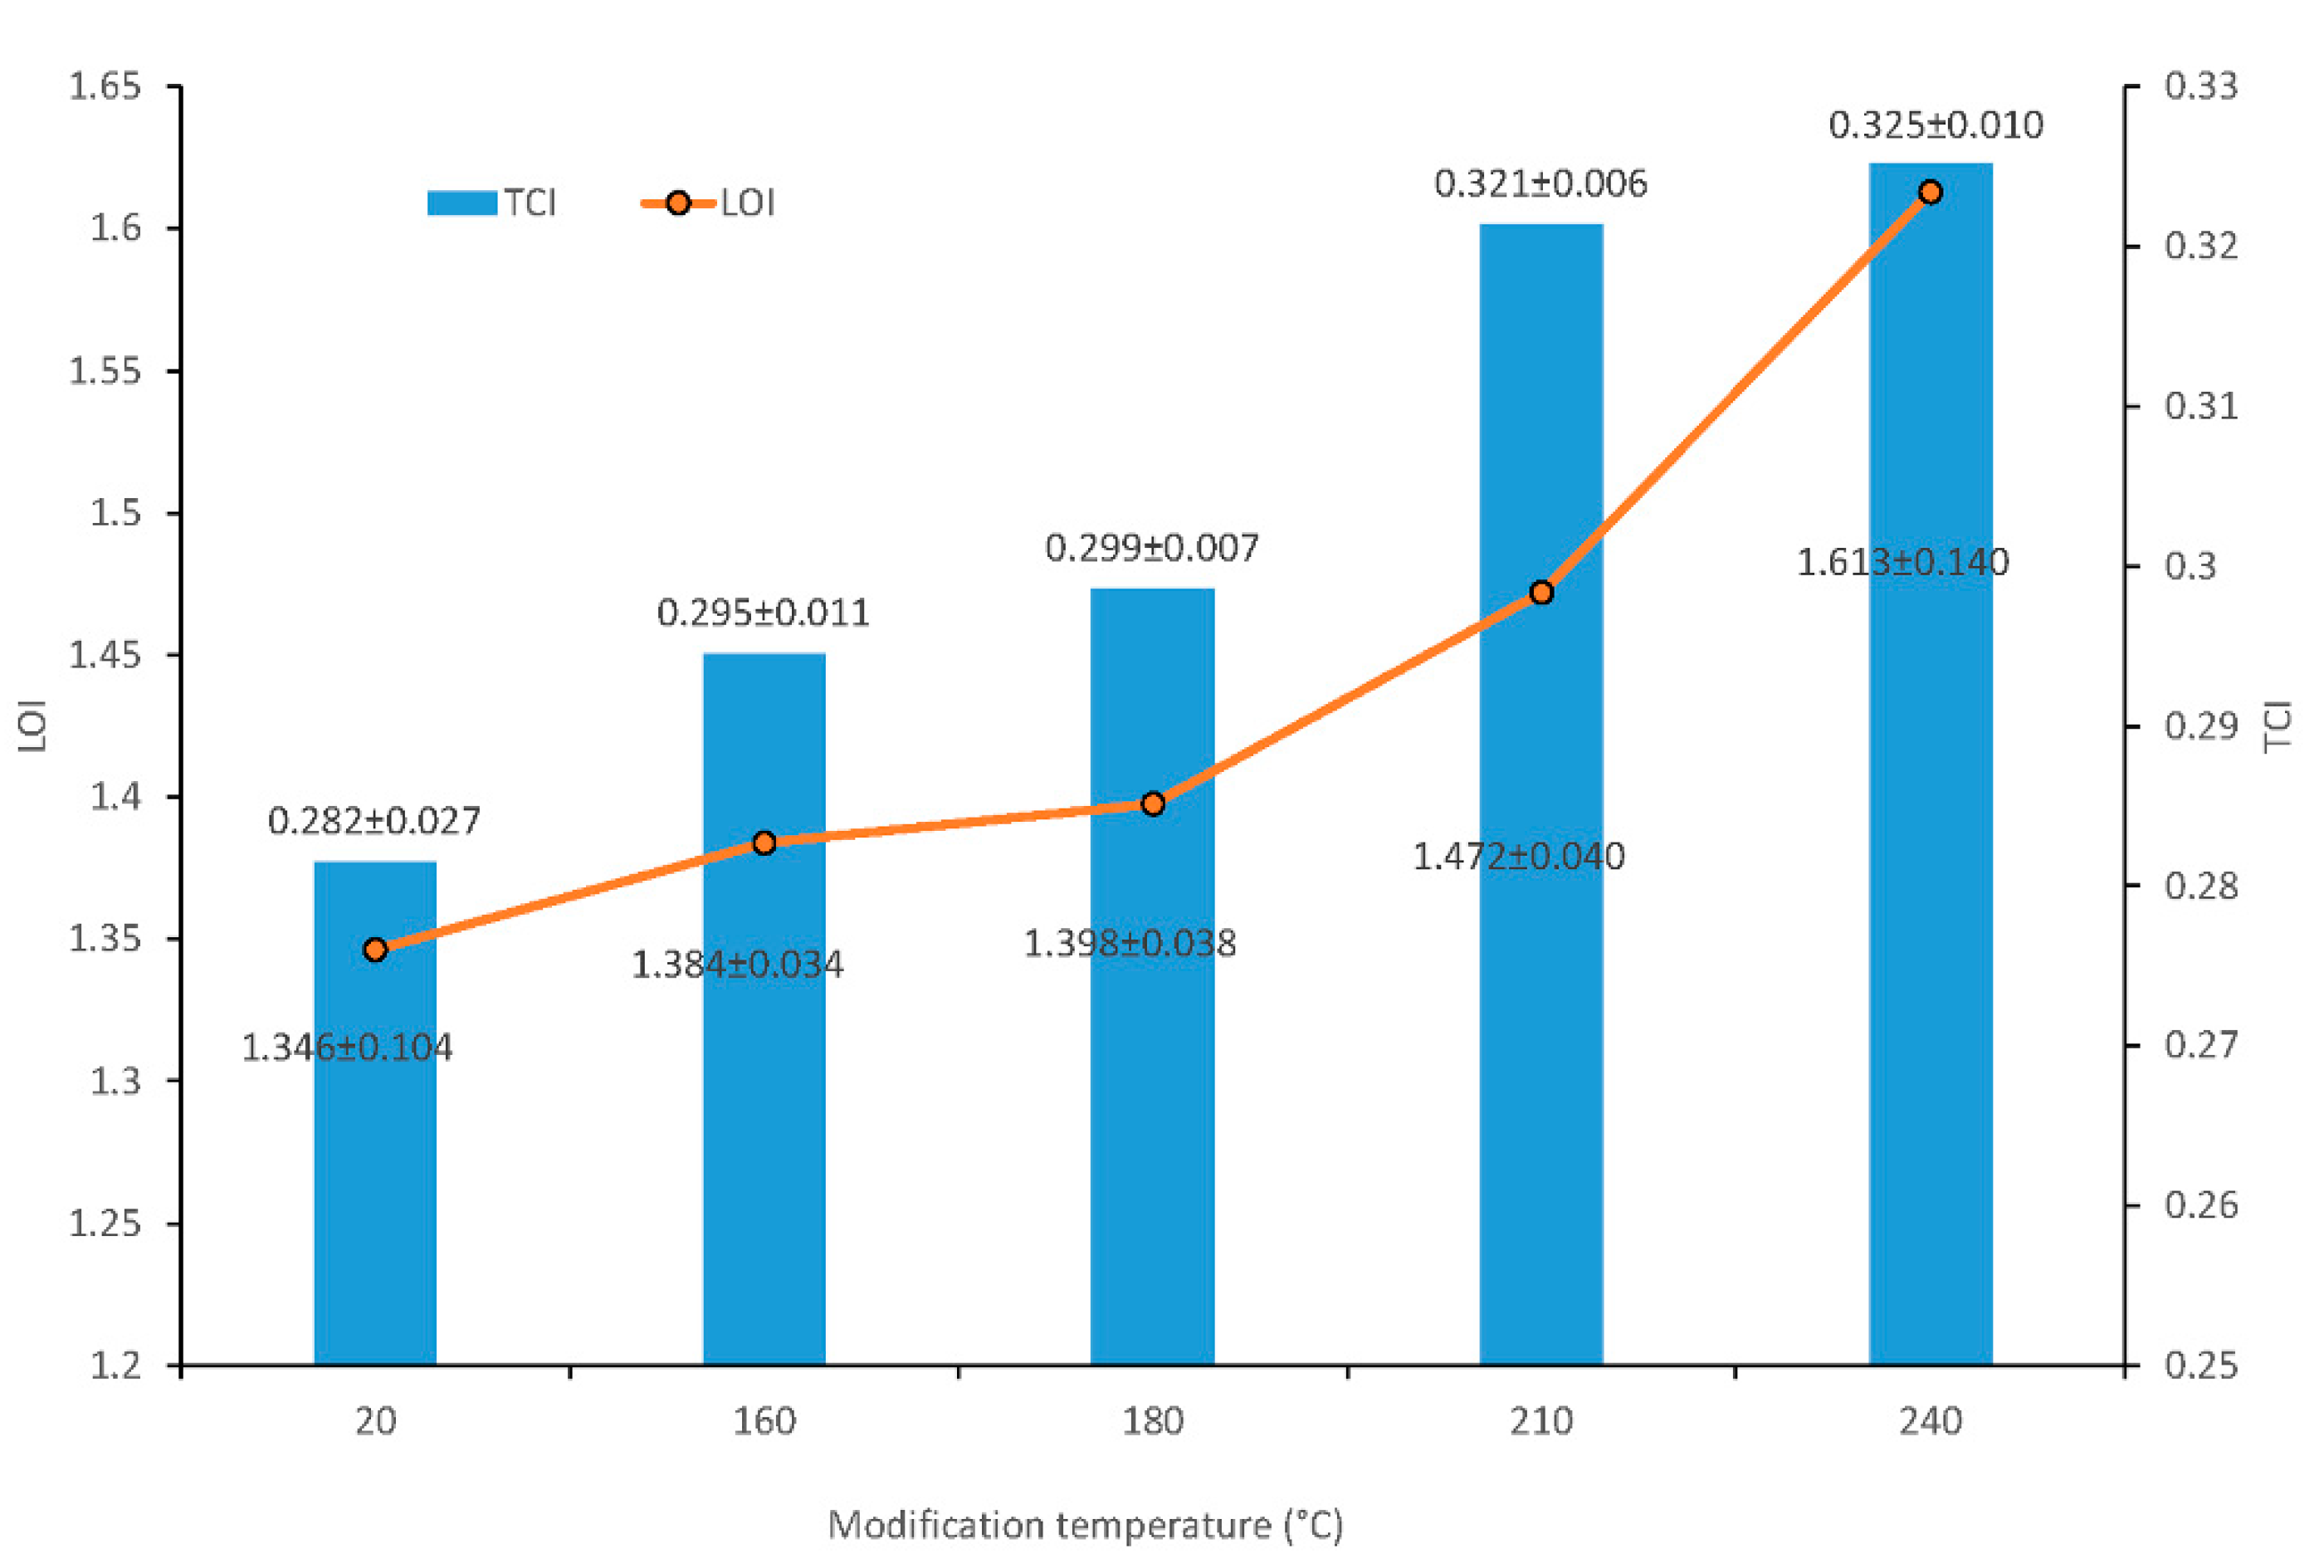
The changes in assigned bands at 897 cm−1 (asymmetric out-of-phase ring stretch in the C1–O–C4 glycosidic linkage), 1375 cm−1 (C–H bending), 1429 cm−1 (C–H wagging) and 2900 cm−1 (C–H stretching) indicated cellulose changes by the thermal treatment of wood. The cellulose crystallinity was assessed using two methods: lateral order index (LOI) from ratios of band–heights H 1429/H 897 [22] and total crystallinity index (TCI) from ratios of band–heights H 1375/H 2900 [23,24]. TCI and LOI parameters are shown in Figure 4.
Increases in LOI and TCI values were observed at all experimental temperatures. The band–height ratios of H 1429/H 897 (LOI) significantly increased when the wood was thermally treated at a temperature of 210 °C. Its highest value was at a temperature of 240 °C, which was 19.2% higher than for the untreated sample. The increase of ratio suggested that at 210 °C, cellulose underwent crystallization. The recorded increase in the values of this index results from greater susceptibility to degradation in the case of amorphous regions in cellulose.
TCI was also significantly affected by treatment above 180 °C. The increase was in the range from 0.282 to 0.325, depending on the treatment condition (Figure 4). At higher temperatures, these changes may have resulted from the faster degradation of the amorphous cellulose regions and the reorganization of the quasi-crystalline cellulose region [25].
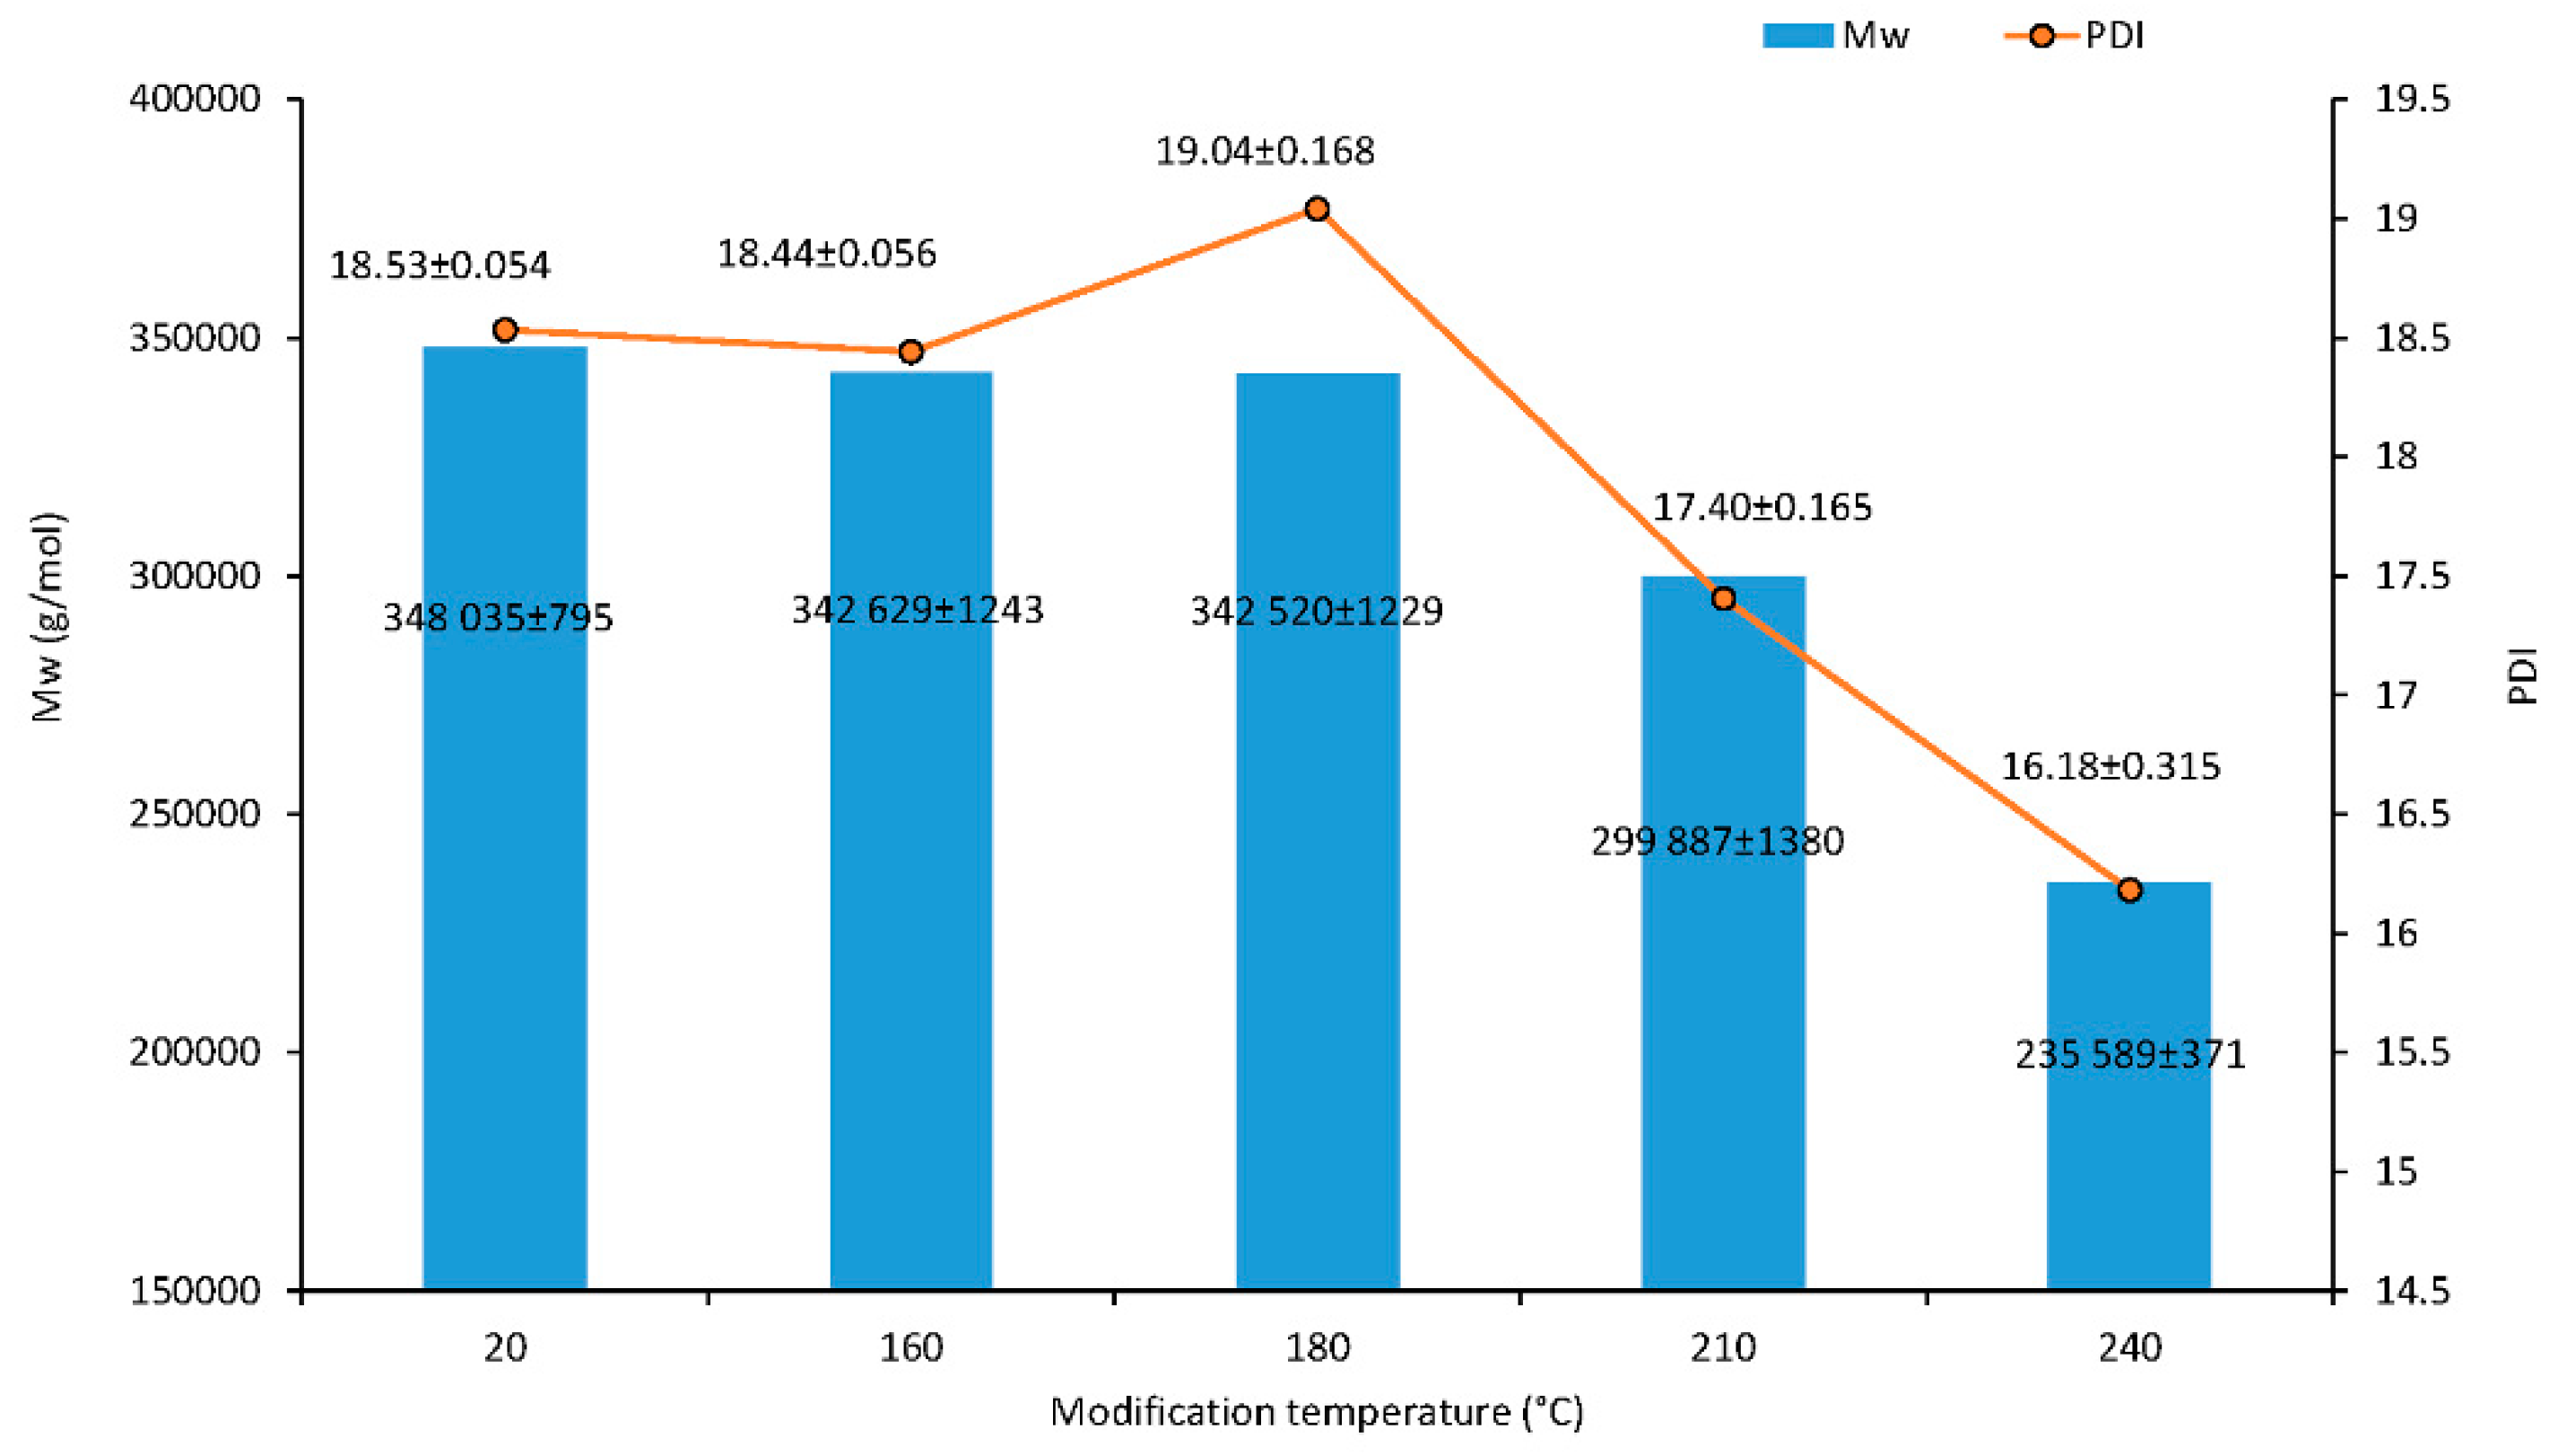
The results of the macromolecular traits of cellulose are presented in Figure 5. Additionally, the effect of the thermal treatment on cellulose Mw was assessed from the GPC of the isolated cellulose of wood. The minor degradation of cellulose occurred at relatively low temperatures at 180 °C; the Mw was 1.6% lower than for untreated wood. The cellulose fractions with a high molecular weight cleave at 210 °C, and the proportion of low molecular weight fractions increased. The lower Mw value of 235,589 g·mol–1 of the treated sample at 240 °C compared to the untreated sample suggested significant degradation of cellulose during treatment, which was a decrease of 32.3%. At higher temperatures, an important amount of acetic acid is released via deacetylation of hemicelluloses which catalyzes the depolymerization of the less ordered carbohydrates as hemicelluloses and amorphous cellulose [26,27]. This causes a decrease in degree of polymerization (DP) and an increase in crystallinity.
The relationship between the polydispersity of wood cellulose and temperature is shown in Figure 5. Polydispersity refers to the fact that, in most cases, there is a mixture of different length cellulose chains in the system. The ratio of the weight average molecular weight to the number average molecular weight is described in the polydispersity index (PDI). The PDI can change differently during degradation processes according to the types of degradation mechanisms occurring (random or systematic). In the case of a random degradation, the ratio does not change, and the molar mass distribution keeps the same profile. The ratio decreases if scissions near the center are favored and increase if scission is formed near the ends [28]. Similar polydispersity values were observed at temperatures of 20 and 160 °C. However, PDI values of cellulose were observed to decrease gradually from 19.04 to 17.40 and 16.18 (180, 210 and 240 °C) within the duration of depolymerization.
As the analysis showed, there was a strong negative correlation between LOI and the following compositions of Mw (r = −0.991, p = 0.001) and PD (r = −0.937, p = 0.019). On the contrary, a positive correlation was observed between LOI and TCI (r = 0.904, p = 0.035). The results of the analysis detected a strong positive association between the values of Mw and PD (r = 0.970, p = 0.006). As we suspected, TCI-correlating with the treatment temperature was significantly positive (r = 0.889, p = 0.044). The cell wall saturation limit significantly dropped at a temperature of 240 °C. This drop was assigned to a change of the maximum moisture content of bound water bonded to cellulose and correspond to a drop of TCI. However, the whole drop of the cell wall saturation limit cannot be assigned to the drop of the maximum moisture content of bound water bonded to cellulose, because the cell wall saturation limit value was higher than the maximum moisture content of bound water bonded to cellulose at a temperature of 240 °C. The other effect on the drop of the cell wall saturation limit was employed. Even when the measurement temperature was 20 °C; the quality of cellulose at the modification temperature 240 °C changed because it bonded to only 3 water molecules instead of 3.5 molecules on glucopyranose at a temperature of 20 °C. Researchers [29] published an estimated average value of 3.9 water molecules per hydroxyl group at fiber saturation point (FSP), which was larger than a value of 3.5 water molecules for all—OH groups on glucopyranose.
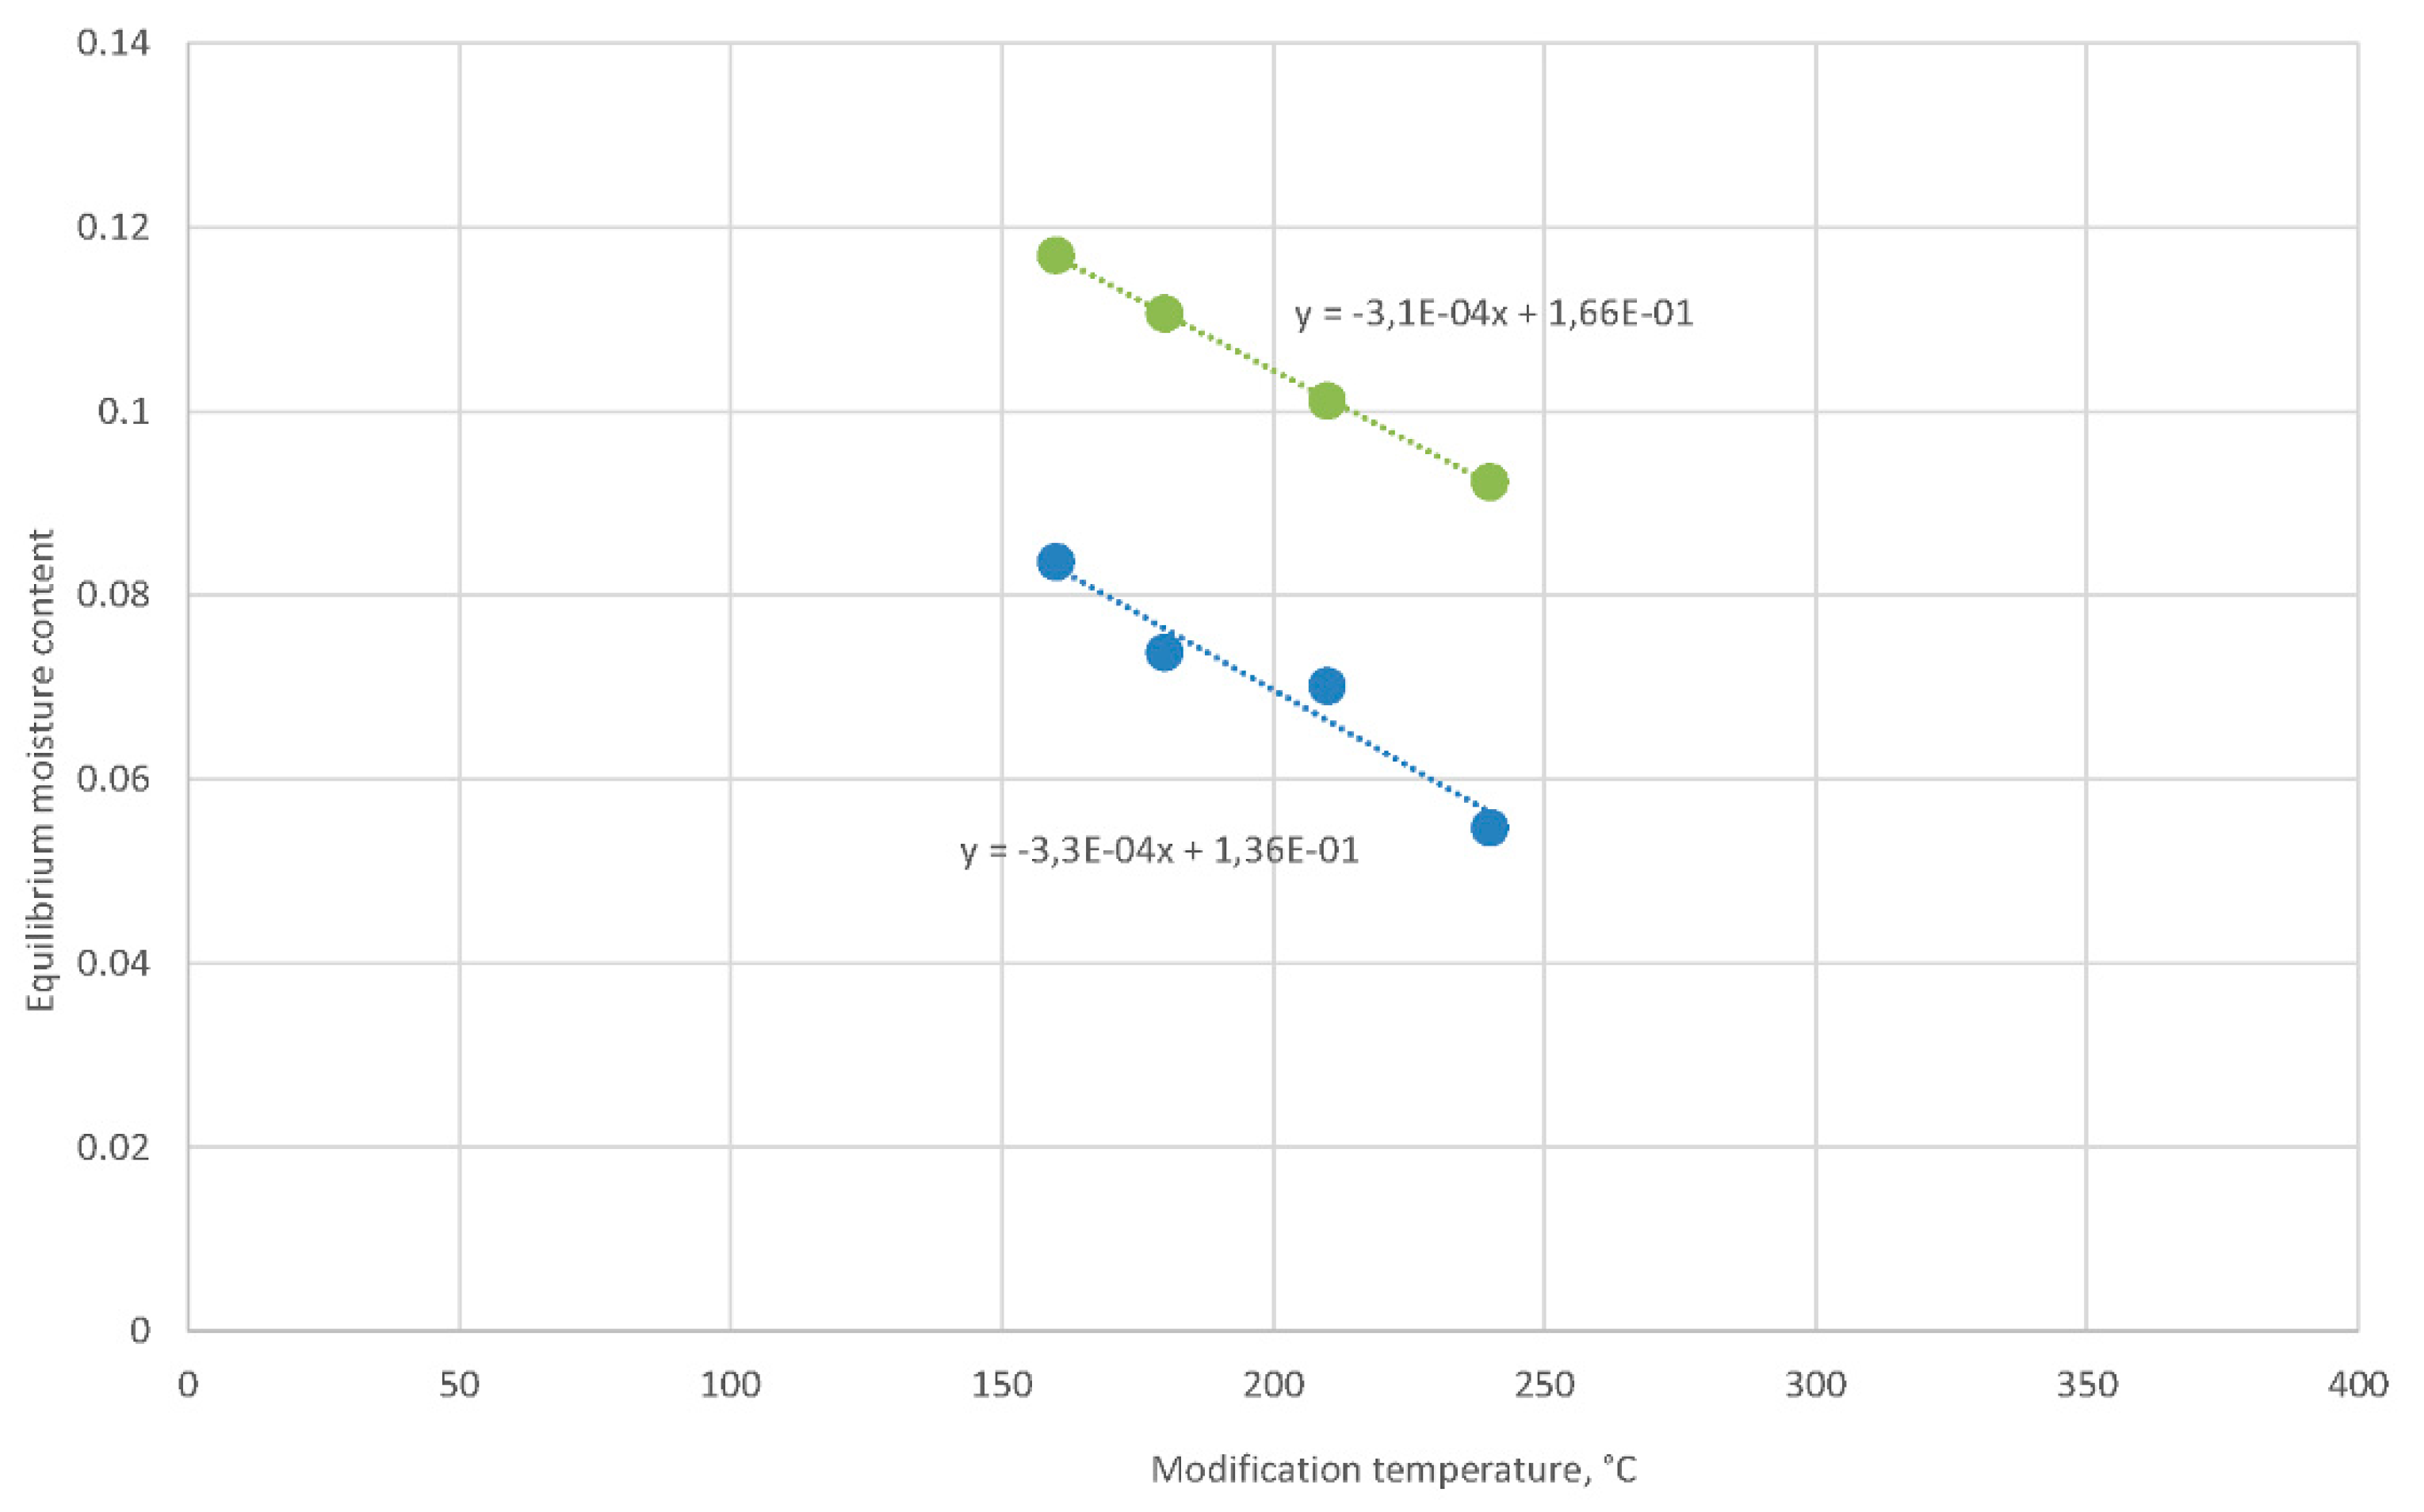
The modification temperature strongly influences the equilibrium moisture content of modified oak wood, for example, at an environment of humid air with a temperature of 20 °C and a relative humidity of 65% (Figure 6).
However, the previous soaking of modified wood at a higher temperature did not change significantly differences among equilibrium moisture content values, but the values of the equilibrium moisture content were much higher (Figure 6). The difference in the equilibrium moisture content after soaking to equilibrium moisture content before soaking was 3%. Therefore, soaking of wood regenerated the equilibrium moisture content of the wood to values that corresponded to lower modifying temperatures. It seems that the difference shift was −105 °C at a given slope. Moreover, another modifying temperature shift of −20 °C led to the intercept with the modification temperature axis at 374 °C, which was the critical temperature of the water.
4. Conclusions
A derived method of identifying the cell wall saturation limit as the maximum bound water moisture of wood was based only on the quantitative properties of wood. The cell wall saturation limit of oak wood and maximum bound water moisture of cellulose were measured at 20 °C and normal pressure after one year of soaking. The factor of modifying the temperature significantly influences the cell wall saturation limit of oak wood, especially at 240 °C. The drop in the cell wall saturation limit value was less than 1% at a temperature of 240 °C and was contrary to the values of the cell wall saturation limit at other modifying temperatures. The significant differences were due to small standard deviations of the oak wood cell wall saturation limit at different modifying temperatures (less than 0.1%).
Modifying the temperature to 240 °C significantly influenced the bound water maximum moisture content of cellulose isolated from oak wood. The drop in the value was less than 6%. This drop significantly influences the number of water molecules bonded to glucopyranose as a unit of cellulose. Three water molecules per glucopyranose of cellulose were determined for oak wood which was modified at a temperature of 240 °C. Three and a half molecules were bonded to glucopyranose as a unit of cellulose isolated from oak wood which was modified at temperatures lower than 240 °C.
The TCI and LOI of cellulose significantly increased with a modifying temperature of 210 °C. At this temperature, the cellulose fractions with high molecular weight were cleaved, and the proportion of low molecular weight fractions increased. These changes resulted from the faster degradation of the amorphous cellulose regions and the reorganization of the quasi-crystalline cellulose region. This caused a decrease in DP and an increase in crystallinity. The PDI of cellulose significantly decreases gradually from 19.04 to 16.18 at temperatures of 180 and 240 °C within the duration of depolymerization.
The soaking of modified wood did not change significantly differences among equilibrium moisture content values, but the values of the equilibrium moisture content measured at temperature of 20 °C and relative air humidity 65% were 3% of the moisture content above the values before soaking.
Author Contributions
Conceptualization, R.H. and V.K.; methodology, R.H. and V.K.; validation, R.H., V.K. and T.H.; formal analysis, R.H., V.K. and T.H.; investigation, R.H. and V.K.; resources, R.H., V.K. and T.H.; data curation, T.H.; writing—original draft preparation, R.H. and V.K.; writing—review & editing, R.H and V.H.; visualization, R.H. All authors have read and agreed to the published version of the manuscript.
Funding
This research was supported by the Slovak Research and Development Agency under contract no. APVV-16–0177 and the Scientific Grant Agency of the Ministry of Education, Science, Research and Sport of the Slovak Republic and the Slovak Academy of Science under contract no. VEGA 1/0397/20.
Acknowledgments
This research was supported by the Slovak Research and Development Agency under contract no. APVV-16–0177 and the Scientific Grant Agency of the Ministry of Education, Science, Research and Sport of the Slovak Republic and the Slovak Academy of Science under contract no. VEGA 1/0397/20.
Conflicts of Interest
The authors declare that there are no conflicts of interest.
References
- Kuilen, J.W.G. The use of timber in hydraulic structures. In End User’s Needs for Wood Material and Products, Proceedings of the COST E53 Conference, 29–30 October 2008, Delft, The Netherlands; Gard, W., van de Kuilen, J.W., Eds.; Delft University of Technology: Delft, The Netherlands, 2008; pp. 303–312. [Google Scholar]
- Geffert, A.; Vacek, O.; Jankech, A.; Geffertová, J.; Milichovský, M. Swelling of cellulosic porous materials—Mathematical description and verification. BioResources 2018, 12, 5017–5030. [Google Scholar] [CrossRef] [Green Version]
- Fredriksson, M. On Wood–Water Interactions in the Over-Hygroscopic Moisture Range—Mechanisms, Methods, and Influence of Wood Modification. Forests 2019, 10, 779. [Google Scholar] [CrossRef] [Green Version]
- Simpson, W.T. Predicting Equilibrium Moisture Content of Wood by Mathematical Models. Wood Fiber 1973, 5, 41–49. [Google Scholar]
- Babiak, M.; Kúdela, J. Rozlíšenie voľnej a viazanej vody v dreve pri nasiakaní (Differentiation of the free and bound water in wood in soaking.). Drevársky Výskum 1988, 117, 1–11. (In Slovak) [Google Scholar]
- Babiak, M.; Kúdela, J. A contribution to the definition of the fiber saturation point. Wood Sci. Technol. 1995, 29, 217–226. [Google Scholar] [CrossRef]
- Ugolev, B.N.; Shhedrina, E.B.; Galkin, V.P. Determination of the Wood Cells’ Walls Saturation Limit after Its Shrinkage; Scientific Works; Moscow State Forest University: Moscow, Russia, 1984; Volume 161, pp. 5–8. (In Russian) [Google Scholar]
- Babiak, M.; Németh, R. Effect of steaming on the sortion isotherms of black locust wood. Environ. Wood Sci. Acta Fac. Ligniensis Sopron 1998, 1, 64–68. [Google Scholar]
- Hill, C.A.S. Wood Modification. Chemical, Thermal and Other Processes; John Wiley & Sons, Ltd.: Chichester, UK, 2006; p. 260. [Google Scholar]
- Olek, W.; Majka, J.; Czajkowski, Ł. Sorption isotherms of thermally modified wood. Holzforschung 2013, 67, 183–191. [Google Scholar] [CrossRef]
- Hrčka, R.; Kučerová, V.; Hýrošová, T. The correlations between oak wood properties. BioResources 2018, 13, 8885–8898. [Google Scholar] [CrossRef]
- Požgaj, A.; Chovanec, D.; Kurjatko, S.; Babiak, M. Štruktúra a Vlastnosti dreva (Wood Structure and Properties); Príroda: Bratislava, Slovakia, 1993; 486p. (In Slovak) [Google Scholar]
- Babiak, M. Wood—Water System; Vysoká škola lesnícka a drevárska Zvolen: Zvolen, Slovakia, 1990; ISBN 80-228-0105-4. [Google Scholar]
- Barcík, Š.; Gašparík, M.; Razumov, E.Y. Effect of temperature on the color changes of wood during thermal modification. Cellulose Chem. Technol. 2015, 49, 789–798. [Google Scholar]
- Hrčková, M.; Koleda, P.; Koleda, P.; Barcík, Š. Color Change of Selected Wood Species Affected by Thermal Treatment and Sanding. BioResources 2018, 13, 8956–8975. [Google Scholar] [CrossRef]
- STN 490103. Drevo. Zisťovanie Vlhkosti pri Fyzikálnych a Mechanických Skúškach. (Wood. Determination of Moisture Content during Physical and Mechanical Testing); Slovak Technical Norm; ÚNM: Prague, Czech Republic, 1979. (In Slovak) [Google Scholar]
- Hrčka, R. Model of free water in wood. Wood Res. 2017, 62, 831–838. [Google Scholar]
- ASTM D1107-96. Standard Test Method for Ethanol-Toluene Solubility of Wood; ASTM International: West Conshohocken, PA, USA, 2013. [Google Scholar]
- Seifert, V.K. Über ein neues Verfahren zur Schnellbestimmung der Rein-Cellulose (About a New Method for Rapid Determination of Pure Cellulose); Das Papier: Darmstadt, Germany, 1956; Volume 10, pp. 301–306. [Google Scholar]
- Kačík, F.; Kačíková, D.; Jablonský, M.; Katuščák, S. Cellulose degradation in newsprint paper ageing. Polym. Degrad. Stab. 2009, 94, 1509–1514. [Google Scholar] [CrossRef]
- Triola, M.F. Elementary Statistics; The Benjamin/Cummings Publishing Company, Inc.: San Francisco, CA, USA, 2018; 784p. [Google Scholar]
- Åkerholm, M.; Hinterstoisser, B.; Salmén, L. Characterization of the crystalline structure of cellulose using static and dynamic FT-IR spectroscopy. Carbohydr. Res. 2004, 339, 569–578. [Google Scholar] [CrossRef] [PubMed]
- Nelson, M.L.; O’Connor, R.T. Relation of certain infrared bands to cellulose crystallinity and crystal lattice type. Part I. Spectra of types I, II, III and of amorphous cellulose. J. Appl. Polym. Sci. 1964, 8, 1311–1324. [Google Scholar] [CrossRef]
- Nelson, M.L.; O’Connor, R.T. Relation of certain infrared bands to cellulose crystallinity and crystal lattice type. Part II. A new infrared ratio for estimation of crystallinity in celluloses I and II. J. Appl. Polym. Sci. 1964, 8, 1325–1341. [Google Scholar] [CrossRef]
- Bhuiyan, T.R.; Hirai, N.; Sobue, N. Changes of crystallinity in wood cellulose by heat treatment under dried and moist conditions. J. Wood Sci. 2000, 46, 431–436. [Google Scholar] [CrossRef]
- Prinks, M.J.; Ptasinski, K.J.; Jansen, F.J.J.G. Torrefection of wood, part 2. Analysis of products. J. Anal. Appl. Pyrol. 2006, 77, 35–40. [Google Scholar]
- Candelier, K.; Thevenon, M.F.; Petrissans, A.; Dumarcay, S.; Gerardin, P.; Petrissans, M. Control of wood thermal treatment and its effects on decay resistance: A review. Ann. Sci. 2016, 73, 571. [Google Scholar] [CrossRef] [Green Version]
- Heywood, A.M.; Emsley, R.J. Computer modelling of the degradation of linear polymers. Polym. Degrad. Stab. 1995, 49, 145–149. [Google Scholar]
- Engelund, E.T.; Thygesen, L.G.; Svensson, S.; Hill, C.A.S. A critical discussion of the physics of wood–water interactions. Wood Sci. Technol. 2013, 47, 141–161. [Google Scholar] [CrossRef] [Green Version]
Figure 1.
Scheme of the specimen and displaced fluid assumed in Archimedes’ principle (arrows show the same applied pressure of the adjacent fluid on specimen mass mmax and displaced fluid mass mvv).
Figure 1.
Scheme of the specimen and displaced fluid assumed in Archimedes’ principle (arrows show the same applied pressure of the adjacent fluid on specimen mass mmax and displaced fluid mass mvv).

Figure 2.
Average and maximum values of cell wall saturation limit of oak wood. Numbers following the averages are standard deviations from a measurement of 30 specimens.
Figure 2.
Average and maximum values of cell wall saturation limit of oak wood. Numbers following the averages are standard deviations from a measurement of 30 specimens.

Figure 3.
Maximum bound water moisture content of cellulose. Numbers following the averages are standard deviations from the measurement of 3 specimens.
Figure 3.
Maximum bound water moisture content of cellulose. Numbers following the averages are standard deviations from the measurement of 3 specimens.

Figure 4.
Total crystallinity index (TCI) and lateral order index (LOI) values of wood cellulose before and after thermal treatment.
Figure 4.
Total crystallinity index (TCI) and lateral order index (LOI) values of wood cellulose before and after thermal treatment.

Figure 5.
Molar weight and polydispersity index of cellulose traits dependence on modification temperature.
Figure 5.
Molar weight and polydispersity index of cellulose traits dependence on modification temperature.

Figure 6.
Increase in the equilibrium moisture content of oak wood in humid air (temperature of 20 °C and relative humidity of 65%) modified with temperatures of 160–240 °C (blue dots) after soaking (temperature of 20 °C) and following the equilibrium in humid air (green dots).
Figure 6.
Increase in the equilibrium moisture content of oak wood in humid air (temperature of 20 °C and relative humidity of 65%) modified with temperatures of 160–240 °C (blue dots) after soaking (temperature of 20 °C) and following the equilibrium in humid air (green dots).


Table 1.
Schedule of the thermal treatment.
| Temperature (°C) | 1st Period (h) | 2nd Period (h) | 3rd Period (h) |
|---|---|---|---|
| 160 | 4 | 5 | 2 |
| 180 | 5 | 5 | 2.5 |
| 210 | 6 | 5 | 3 |
| 240 | 7 | 5 | 3.5 |
© 2020 by the authors. Licensee MDPI, Basel, Switzerland. This article is an open access article distributed under the terms and conditions of the Creative Commons Attribution (CC BY) license (http://creativecommons.org/licenses/by/4.0/).
Share and Cite
MDPI and ACS Style
Hrčka, R.; Kučerová, V.; Hýrošová, T.; Hönig, V. Cell Wall Saturation Limit and Selected Properties of Thermally Modified Oak Wood and Cellulose. Forests 2020, 11, 640. https://0-doi-org.brum.beds.ac.uk/10.3390/f11060640
AMA Style
Hrčka R, Kučerová V, Hýrošová T, Hönig V. Cell Wall Saturation Limit and Selected Properties of Thermally Modified Oak Wood and Cellulose. Forests. 2020; 11(6):640. https://0-doi-org.brum.beds.ac.uk/10.3390/f11060640
Chicago/Turabian StyleHrčka, Richard, Viera Kučerová, Tatiana Hýrošová, and Vladimír Hönig. 2020. "Cell Wall Saturation Limit and Selected Properties of Thermally Modified Oak Wood and Cellulose" Forests 11, no. 6: 640. https://0-doi-org.brum.beds.ac.uk/10.3390/f11060640
Note that from the first issue of 2016, this journal uses article numbers instead of page numbers. See further details here.