Article

Optimizing the Tending of Forest Stands with Interactive Decision Maps to Balance the Financial Incomes and Ecological Risks according to Owner Demands: Case Study in Rakovník, the Czech Republic

1
Faculty of Forestry, Technical University in Zvolen, T.G. Masaryka 24, 960 01 Zvolen, Slovakia
2
Faculty of Forestry and Wood Sciences, Czech University of Life Sciences Prague, Kamýcká 1176, 6–Suchdol, 165 21 Prague, Czech Republic
3
School of Sciences and Technology, Mathematics Department, University of Evora Colégio Luís António Verney, Rua Romão Ramalho, 59, 7000-671 Évora, Portugal
*
Author to whom correspondence should be addressed.
Submission received: 1 June 2020 / Revised: 29 June 2020 / Accepted: 1 July 2020 / Published: 4 July 2020
(This article belongs to the Section Forest Ecology and Management)

Abstract

:
Sustainability and the optimal provision of the various ecosystem services is an essential task in forest management. In this study, we deal with the optimization of forest tending to achieve the maximal long-term provision of financial incomes from wood at a minimal level of ecological risks for selected small ownership unit. The methods of interactive decision maps and reasonable goals (IDM/RGM) were connected with a modern forest growth simulator to investigate the four-dimensional optimization space and to produce the complete set of Pareto optimal solutions. The four different types of forest owners as potential decision-makers were simulated, and precise management goals in multidimensional target space were defined. Then, the optimal tending system for each forest owner in three stands, differing by the degree of the naturalness of the species composition, was detected. The multi-criteria analysis suggests that predominantly economically oriented forest management still prevails in the Czech and Slovak Republics, which can be as a source of conflicts among forest owners and other stakeholders. The existence of trade-offs between biodiversity, ecological stability and wood production and different owners’ demands must be taken into account. The possibility of balancing the management risks and wood provision according to the owner’s and other stakeholders’ demands with the aid of the easy-to-apply IDM/RGM methods (and the careful assistance of a specialist experienced in multi-criteria optimization) was introduced. At the same time, the application of real integrative management in small forest areas was demonstrated in practice. After the change of paradigm in forest management, the applied methods should prevent increasing conflicts among owners and society in former socialist countries, which have undergone a fundamental transformation in terms of forest ownership in recent decades.

1. Introduction

Forest management in Central and Eastern European countries (CEE) has evolved differently to that in Western countries located in the same biogeographic zones [1]. Before the market economy introduction in the last decade of the 20th century, most of the forest land was owned by the state, and forest management was strictly, hierarchically, top-down organized [2,3]. The overall approach to forest utilization had a strong influence on the reduction of forest fragmentation. It led to a change in the original tree species composition in favour of economically more profitable species [4,5]. As a result, centrally planned, economically oriented forestry with an emphasis on the high production of valuable timber was established based on classic age-class forest management.
Although significant changes have emerged within forest management in many countries [6,7], most CEE countries still have technically oriented forestry practices aimed primarily at wood and timber production, with relatively long rotation periods [8]. Several common problems are characteristic, such as inherited management structures or many regulations arising from forest law for forest owners and managers. The strong orientation to wood frequently causes a severe reduction in the biodiversity and ecological stability of forests negatively affected by rapid climate change. The unprecedented decline in biodiversity in Europe urges multi-objective forest management. At present, the need for a multifunctional understanding of forest management arises from different EU documents and action plans for the protection of biodiversity and the prevention of ecosystem degradation [9,10,11,12].
Multifunctional management in Czech or Slovak forestry is not a new idea, but despite the topic having been dealt with theoretically in the past at a very high scientific level (see [13,14,15,16]), it is still more of an abstract idea than a reality. All the forests in Czech and Slovak Republics are managed according to forest management plans (FMPs) elaborated by authorized planning specialists/agencies. FMPs are obligatory for all owners irrespective of the ownership type (state, private, municipal, church, communal or cooperative). The list of mandatory components and exact approaches of elaboration are defined in particular Acts and Decrees related to forests and forest management [17].
The elaboration process results in a single FMP, which is considered to be optimal. There are several sources of the optimality confidence: (i) a very sophisticated phytocoenological classification of forest sites [18,19]; (ii) high-quality classic growth and yield tables [20,21]; or (iii) a large amount of experience from practical silviculture, forest management and protection dating back to the 18th century [22]. Formally, the main goal is sustainable forest management with the maximum feasible economic yield, regulated by the state [13].
The key idea behind the currently used planning system is that the natural conditions, site quality and present stand state fully determine feasible management goals and their importance order. Therefore, the used planning procedure is assumed to correctly account for all possible owner and public demands on forests. Besides, it is assumed that if the site conditions and corresponding stand state do not dramatically change over time, the management goals and their importance will not change either.
Hence, the planning concept claims that management goals are almost independent of the individual needs of the forest owner and the changing economic conditions [17,23]. In practice, multifunctional management is applied in a spatially segregative way through land zoning. The forest stands oriented to wood production are separated from regulative and culturally oriented ones. Classification is done by planning specialists according to the site or habitat conditions and state of forest stands.
However, in order to achieve actual spatially integrative multifunctional management in permanently changing conditions, it is necessary to (i) change the perception that the provision of the regulating and cultural ecosystem services (ES) is only an externality in addition to timber production [17,24]; (ii) adjust contemporary forestry legislation, in which no clear structure has yet been established to support the provision of several ESs and biodiversity at once [25,26,27]; (iii) to create a framework that would allow the formulation of adaptive management strategies based on an exact quantification of the fundamental trade-offs and synergies among the various ESs [5,28]; (iv) to accept participatory decision-making processes that would allow the expression of the preferences of all the stakeholder groups involved in forest management and find the most appropriate compromise that would reflect the defined requirements as much as possible [29,30].
Thus, real multi-objective management must be scientifically sound and formulated as a multi-criteria decision problem [5,31]. The optimization of several ESs and biodiversity through the identification of optimal management alternatives that can meet different social and political requirements for forests [32,33,34,35] is an ideal case for the application of multicriteria decision methods (MCDM). In combination with a new generation of forest growth models [36] and with the involvement of various stakeholders in the decision-making process [37,38], MCDM methods appear to be very suitable for solutions for complex tasks related to forest management [31,33,34,39]. In this regard, the multi-criteria method of interactive decision maps and reasonable goals IDM/RGM [40,41,42] has been successfully applied for the solution of several forestry planning problems [39,43,44] and in several EU projects [45,46]. The method appears to be a very promising and user-friendly means for the interactive solution of multi-criteria optimization problems [47].
An example of a combination of the tree growth simulator SIBYLA [48] and the method of interactive decision maps [40,42] was applied in work in the search for an optimal tending strategy for forest stands differing in ecological stability. Optimization aims to find the optimal balance between the financial incomes from wood harvests and the ecological stability and biodiversity according to the demands of the simulated types of decision-makers/forest owners, which we commonly encounter in forestry practice.
The main goal of the work is to present a planning approach that is fundamentally different in comparison to current practice in the Czech and Slovak Republics, having the potential to put functionally integrated management at the stand level into operational practice. The topic of the integrated management of small forest areas is a relatively hot contemporary topic that can attract attention not only in the mentioned countries but also across Europe or worldwide. Additionally, the work will show the extent to which the results of optimization depend on the simulated type of forest owner and ecological stability of the forest, to demonstrate their importance in the process and facilitate the application of participatory planning in the future.
Overall, the analysis of the trade-offs between financial incomes from provisioning services and ecological risk under various circumstances is one of the most frequently studied problems today [49,50,51,52]. Ensuring the ecological integrity of the forest in addition to the use of wood as a renewable raw material allows us to minimize the risk associated with long-term returns on financial investment and to promote the sustainability of forest ecosystems. The presented case study thus deals with an essential task, and the obtained results can enrich the knowledge base regarding the central problem of today’s forest management.

2. Materials and Methods

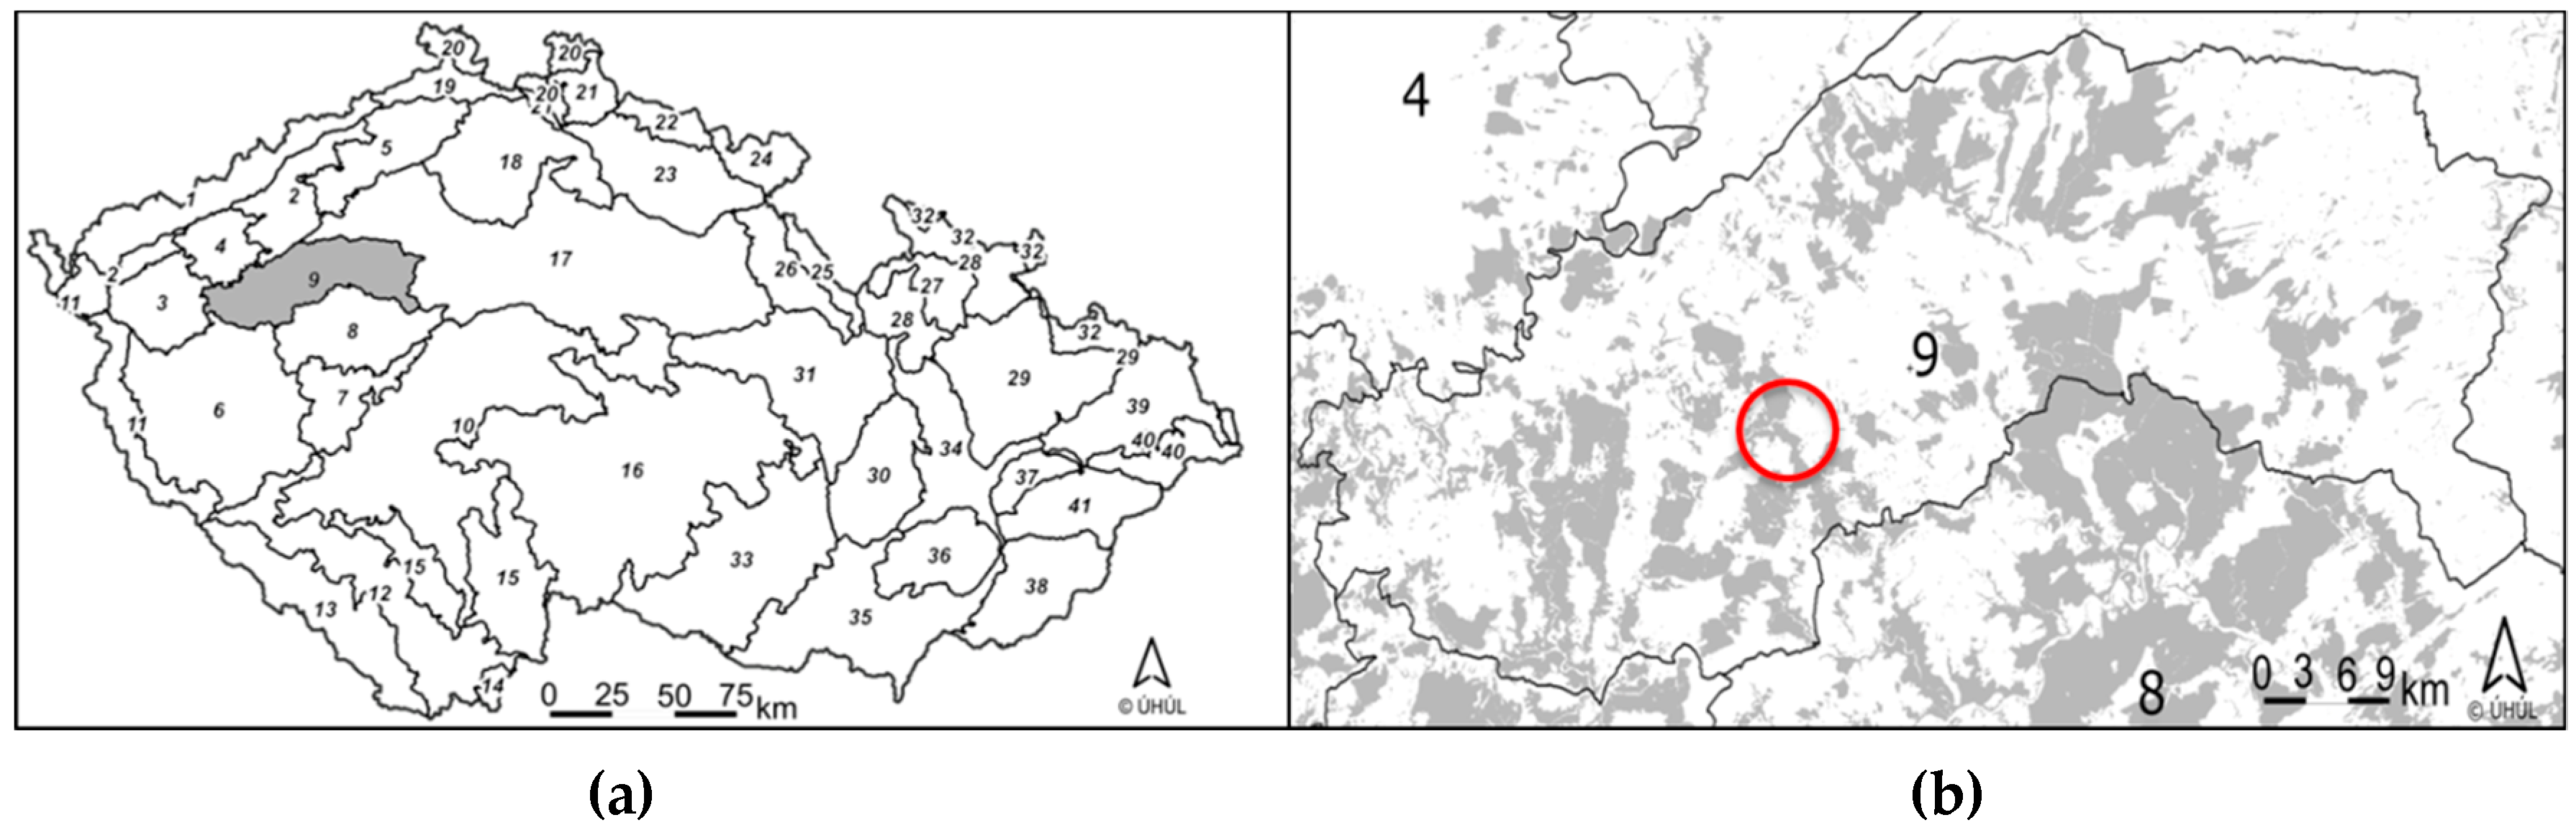
2.1. Case Study Area

The investigated private ownership unit (2 owners) defining the case study area (CSA) has an area of 332 ha. It is located in the Central Bohemian Region in the Czech Republic near the town Rakovník (Figure 1).
The altitude of the area ranges from 196 m to 693 m. The predominant part of the area consists of uplands with an altitude of 300 m to 500 m. It belongs to the moderately warm and dry areas with a mild winter. Depending on the altitude, the average annual temperatures ranges from 7.0 °C to 8.2 °C, and the sums of the average annual precipitation range from 463 mm to 569 mm; the growing season lasts about 162 to 147 days. In general, the case study area is below average or average in terms of site quality in the Czech Republic.
Regarding the current species composition, the territory is dominated by conifers (73.7%). The most represented species are spruce (50.6%), oak (12.7%) and pine (11.5%). The share of deciduous trees in artificial regeneration is increased to 31%, which is a reflection of owners’ efforts to introduce a consolidating admixture into mostly spruce stands.
Natural vegetation formations corresponding to the given environmental conditions in the Czech Republic are oak-beech or beech-oak formations, so the majority of forest stand should be oak-or beech-dominated or may comprise mixtures of both species. Thus, Norway spruce is clearly outside its natural distribution, and it forms secondary plantations. Spruce was artificially spread over the area to improve the economic parameters of management. The transformation of an artificial species composition has become a very urgent task in recent years in the considered area because the frequency and severity of the random wind and bark beetle disturbances have increased.

2.2. Overall Approach

The research involves case study analysis. At selected small ownership units, three representative forest stands (RSTs) differing in the degree of naturalness of the species composition (original, partly modified or entirely modified) were defined based on information from the forest management plan. It was assumed that the degree of naturalness in each RST corresponded to the degree of its ecological stability. In each stand, the multi-criteria optimization of forest tending was performed to determine the optimal system guaranteeing the maximization of the financial incomes from wood harvests at an acceptable level of the ecological risks in even-aged stands with different ecological stability. Concerning the primary goal, a set of alternative tending systems was proposed, and the suitable indicators for the defined management goals were selected. Subsequently, the effects of various tending systems on indicator values within a typical rotation period under given conditions were investigated with the aid of a growth simulation model, SIBYLA [17,48].
After the simulation phase, the method of IDM/RGM [40,42] was used for the selection of the optimal tending strategy in each representative stand. The main optimization steps consisted of (i) the exploration of the trade-offs between the financial incomes from wood harvests and ecological stability and biodiversity for various tending systems, (ii) the separation of the non-optimal (dominated) tending systems from optimal (non-dominated) ones and (iii) the identification of the final optimal tending system within the subset of non-dominated solutions.
The final optimization step cannot be done unless the goal preferences are defined. From a multi-criteria optimization point of view, all non-dominated tending systems and combinations of indicator values forming Pareto frontiers in multidimensional goal space can be considered as equivalent ones until higher-level information is involved in deciding. To overcome this problem, the authors, as forestry experts, defined four types of potential forest owners/stakeholders representing the different thinking of various people encountered in forestry practice.
For each type of potential forest owner, we assumed some distribution of the relative weights assigned to each indicator based on our expert expectations. Thus, we simulated the behavior of different types of potential owners, allowing us to select the optimal tending system for each representative stand. Subsequently, we could study the influence of different demands on the balance between the financial incomes and risks (as decisions of different risk-to-reward investors) and the influence of different ecological stability of managed forests on the attributes of an optimal tending system.

2.2.1. Definition of Representative Forest Stands

In the first step, an exhaustive survey of the stand species compositions of all the forest stands in the defined CSA and their classifications according to the degree of correspondence to natural species composition was done. The native species composition was derived from phytocoenological site characteristics included in the forest management plan. Three stand classes were defined: (i) stands with natural species composition and (ii) stands with partly or (iii) completely changed compositions (in favor of Norway spruce).
Subsequently, the representative species compositions, site indices, relative stocking, stand diameter, height and volumes per hectare were calculated for each naturalness class. The site indices and growth and yield tables [21] were used to generate the realistic initial stand structure in the simulator environment [48] at the age of 30 years (Table 1).
The initial age of 30 years is the age at which tending usually starts in the given management and site conditions.

2.2.2. Forest Growth Simulator SIBYLA

The SIBYLA growth simulator [48] was used to model the impact of different tending systems on wood production, stability and biodiversity from the initial age of 30 years to the age of 90 years in each RST. The age of 90 years is the age at which the final cuttings usually start in the given conditions. SIBYLA is an individual-tree, distance-dependent model (Figure 2).
The core growth sub-model was initially designed by [53]. It is an empirical model that was parameterized and validated using national forest inventory data from Slovakia and Germany and also calibrated for the Czech Republic. The most characteristic features are (i) the ability to generate a realistic 3D structure of a forest stand; (ii) the ability to take into account the influence of stand density, and inter- and intra-specific competition among individual trees on their growth; (iii) the ecological evaluation of site fertility; (iv) the ability to simulate natural tree mortality and practically any type of forest stand silviculture treatment; (v) the possibility to provide a vast spectrum of output information about the wood production, and economic and ecological characteristics of the stand.
Therefore, the model is very flexible and is capable of simulating the growth of any stand type (even- or uneven-aged, unmixed or mixed, with various horizontal and vertical structures) under different site conditions in the Czech or Slovak Republic.

2.2.3. Tending Systems

Tending alternatives are characterized as a schedule of specified thinning actions. Three basic thinning methods were applied: (i) thinning from below with a negative selection of individual trees, (ii) thinning from above with negative selection, and (iii) a target tree method based on positive selection. Both thinning methods based on negative selection were applied in seventy-five intensity variants when fifteen variants of time arrangement (Table 2) and five variants of thinning volumes were combined. The volume of the individual intervention in these cases was defined by the target stocking (relative stand density) after the intervention—levels of 0.6, 0.7, 0.8, 0.9 and 1.0 were explored. For example, the target level 0.6 means that the stand volume after the intervention will represent 60% of the maximal volume at full stocking/occupation of growth space (defined in classic growth and yield tables [21]).
In the target tree method, the same time arrangement variants as in previous cases were present (Table 2), but the strength of the intervention was defined differently. The thinning volume was defined by the spacing of the target crop trees and the degree of aid to the future crop tree defined by the number of individuals removed from the vicinity of the crop trees. In this thinning method, twelve strength variants were examined, which consisted of four variants of future crop tree spacing (7, 8, 9 and 10 m) and three degrees of aid level (1, 2 and 3 trees harvested with each intervention to support the target tree). Finally, 180 different alternatives were examined, consisting of fifteen schedules of thinning (Table 2) applied in 12 strength variants.

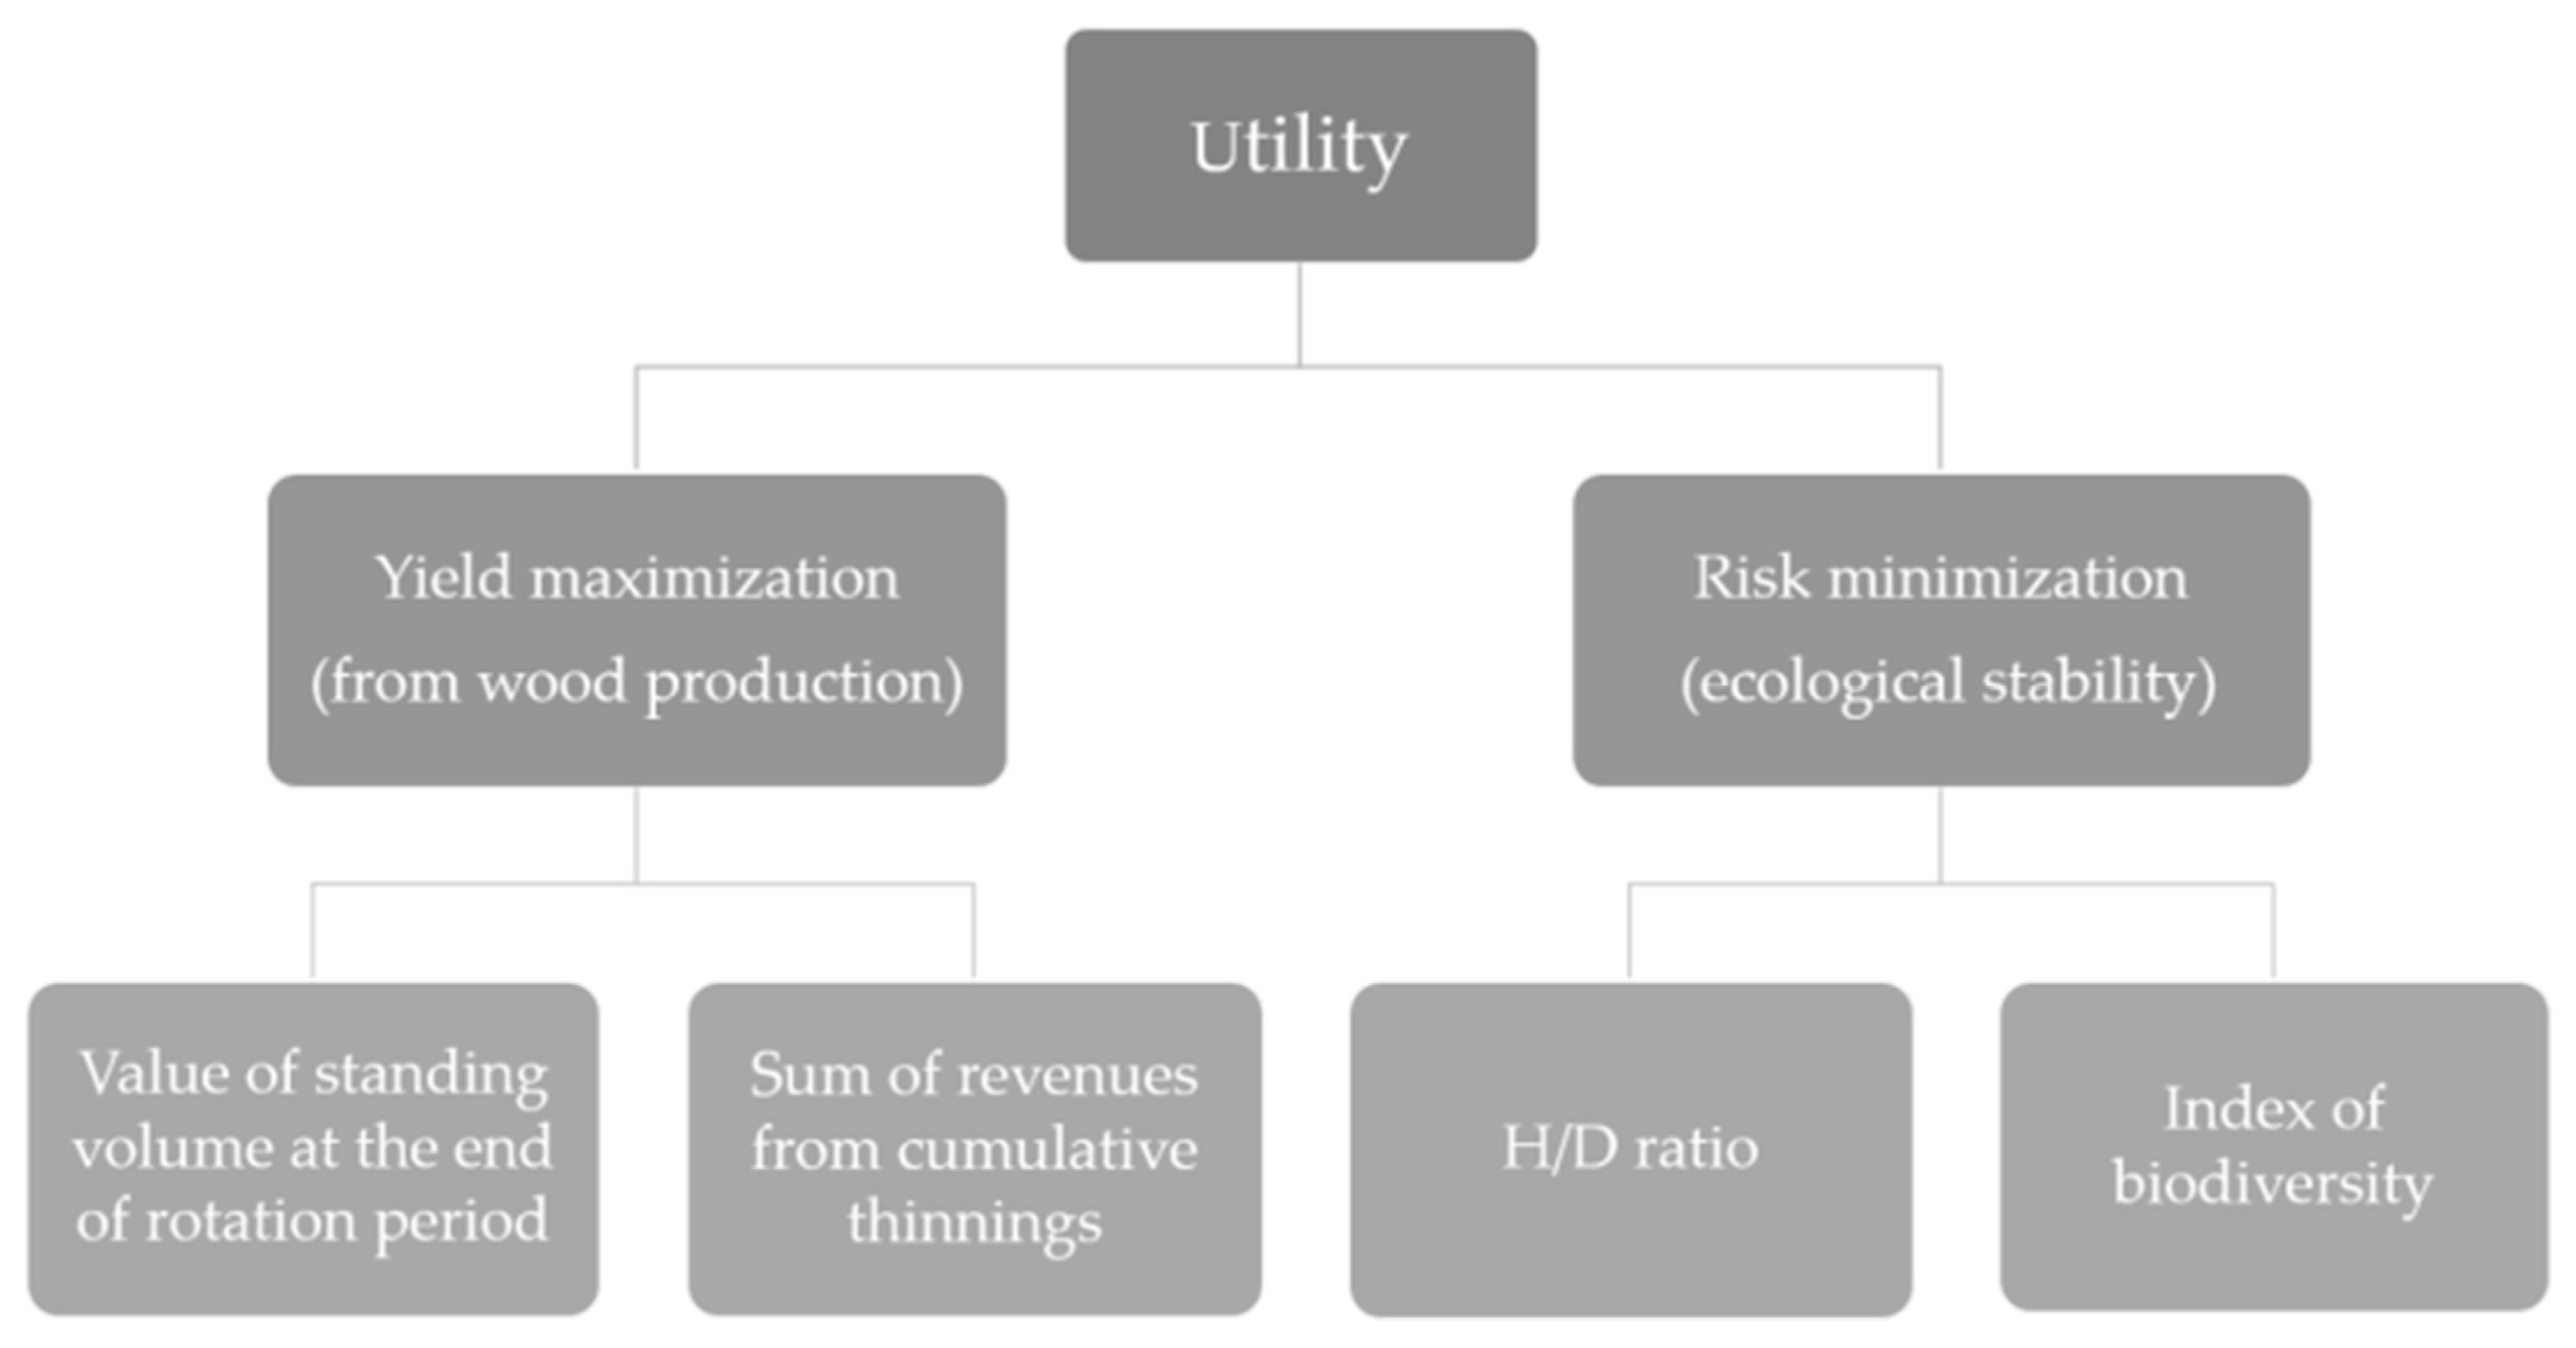
2.2.4. Indicators of Management Goals

The optimal tending system was multi-criteria selected based on selected indicators at the end of rotation at the age of 90 years. As already stated, the tending variants were assessed simultaneously from two different perspectives—maximizing the financial yields from wood and minimizing the ecological risks of wood production (Figure 3).
The evaluation of the wood provision was based on two indicators. The first indicator was the revenues from final cuttings estimated from the financial value of the standing volume at the age of 90 years, which served as an indicator of the long-term financial efficiency of the tending. The financial value of the standing volume was determined by the multiplication of the assortment volumes and their average prices for the period 2015–2019. The second indicator was the cumulative financial income from thinning as an important indicator of the cash flows, which is important mainly for small owners preferring smaller regular incomes instead of a one-time high revenue at the rotation end. Again, the value of individual thinning harvest was determined by multiplication of the assortment volumes and their average prices for the period 2015–2019. The cumulative value at the age of 90 years was obtained by summing the values of the individual harvests for the period from age 30 to age 90 years.
The risk assessment was based on an evaluation of the ecological stability of the stand according to the H/D ratio and the selected biodiversity index. The H/D indicator is the simple ratio of the mean stand height in meters to the mean stand diameter in centimeters. The H/D ratio serves as an indicator of the mechanical stability of the stand and its resistance to wind disturbances [54,55,56,57]. H/D values above one are considered to be generally inappropriate and indicate bad resistance of the stand against the wind, snow or icing. Conversely, values below 0.8 indicate good resistance of the stand against mechanically acting abiotic factors.
The second indicator of ecological stability was the biodiversity index B of the stand according to Jaehne and Dohrenbusch [58], consisting of the sub-indices of tree species diversity S, the diversity of the horizontal and vertical structures H and V, and crown diversity C. The sub-indices S, H, V and C are calculated as:
S = ln ( m ) ( 1.5 Z m a x Z m i n )
H = 1 h m i n / h m a x
V = 1 r m i n / r m a x
C = [ 1 log ( K A m i n ) ] + ( 1 K D m i n / K D m a x )
where m is the number of tree species in a stand; Zmin and Zmax are the minimal and maximal shares of individual species; hmin and hmax are the minimal and maximal heights of an individual tree; rmax and rmin are the minimal and maximal distances between two nearest neighbors; KAmin is the minimum height of the tree crown base; and KDmin and KDmax are the minimal and maximal crown widths of the individual tree. The total tree biodiversity was calculated as:
B = 4 S + 3 H + V + C
Indicator values above nine indicate extremely diverse stands (e.g., mixed uneven-aged stands with high spatial and structural diversity of trees). Values below four indicate monotonic stand structures (e.g., even-aged less variable single-species plantations with a regular distribution of trees). This indicator was selected based on the knowledge that species-rich stands with high vertical and spatial variability of trees are more resistant and resilient to harmful factors and therefore minimize management risks.

2.2.5. Interactive Decision Maps and Reasonable Goals Method

After the obtaining of sets of indicator values for each representative stand and tending variant from the growth simulations, multi-criteria optimization itself was performed by the method of interactive decision maps (IDM) combined with the method of reasonable goals (RGM) using the VisAn software [40,43,59]. The IDM/RGM methods support decision-making for multi-criteria problems with more than three criteria and, at the same time, facilitate the entry of decision-makers (DMs) into the decision-making process. In our application, the potential forest owner acts as the decision-maker and end-user of the optimization results.
In the first step, the methods approximated a set of feasible solutions (here, a set of indicator objective vectors at the age of 90 years obtained by simulation for various tending systems) within the defined optimization constraints (e.g., the site and management conditions, and ecological state of the forest in the CSA). Then, they defined all non-dominated solutions denoted as Pareto optimal. Non-dominated solutions are solutions in which the value of any indicator forming an objective vector cannot be improved without deteriorating the value of another. That means the multi-criteria optimal tending system is a system for which no alternative tending system in a considered set can be found in which all the indicators would simultaneously be better.
After rendering the maps of the target space, the results are available to the forest owner for review. In the second step, the potential forest owner expresses the preferences for optimization goals/indicators and selects a non-dominated tending system that best meets those preferences. In this step, the RGM method is used, which allows the easy identification of a small number of tending alternatives that best reflect the desired objectives. The selection of the optimal alternative is made by simply marking the position in the drawn map of the target space (defining the desired values of indicators). Then, the software tries to find all the real tending alternatives that are close to the selected point using the RGM method. The alternatives found are provided to the forest owners in the form of a list in which they are sorted by distance from the selected (ideal) goal-point selected at the Pareto frontier.
Four types of forest owners as potential decision-makers selecting goal-points in the second optimization step were characterized:
  • The balanced forest owner demands balanced multi-criteria optimization—the goal will be to maximize the growing volume value and cumulative thinning revenues at the rotation end while minimizing the H/D values and maximizing the biodiversity index, with no decisive preference for any indicator. In this case, he/she would be a neutrally oriented DM, who strives for the simultaneous and balanced performance of all the considered indicators at once. Such a forest owner can be denoted as fully integrative or truly multifunctional.
  • The economically oriented risk-seeking owner prefers the maximization of financial incomes from wood over risk minimization—the overall aim of the economically oriented decision-maker is to achieve the highest production of logs and timber and to trade them, over and at the end of rotations, the other aspects including taking ecological risks into account only marginally.
  • The economically oriented risk-avoiding forest owner is worried about the ecological stability of his/her forest over the financial revenues from wood harvests—this decision-maker is focused on strengthening the static stability and sustainability of the forest and primarily tries to minimize the values of the H/D ratios.
  • The nature-oriented decision-maker is focused on nature conservation and landscape protection—the main interest is the maximization of non-economic criteria, namely the preservation and promotion of biodiversity; thus, maximizing the values of the B index is a priority.

3. Results

The first and second optimization steps require the creation of an IDM in the VisAn software environment and the selection of a target end-point by the defined decision-maker. Figure 4a is an exemplary illustration of four-dimensional IDMs created in a VisAn environment for a representative stand with a fully changed species composition (unmixed spruce stand). The graphs in Figure 4b–e are individual graphs selected from the complex four-dimensional matrix in which the goal end-points were defined by a particular simulated forest owner (crosses in Figure 4b–e).
Figure 4a is a four-dimensional matrix created from the rows and columns of two-dimensional graphs, where the individual graphs inside the matrix display the relationship between the standing volume revenues at the age of 90 years (x-axis of individual graphs) and the sum of the cumulative revenues from thinning (y-axis of individual graphs). The rows of the graphs correspond to different levels of biodiversity, and the columns are graded according to the predefined H/D ratio levels.
The relationship between the standing volume revenues at the end of the rotation and the sum of the revenues from the cumulative thinning showed clear trade-offs within a set of Pareto optimal solutions lying at the Pareto frontier. At the same time, the different sizes of the blue areas in Figure 4a illustrate the increases or decreases in the economic yields from wood according to the predefined levels of forest biodiversity and ecological stability. Here, once again, we can directly control the decrease in financial incomes when the biodiversity and ecological stability of the forest increase. The sizes of the blue areas decrease with an increase in the biodiversity values and decrease in the H/D values, indicating improving static stability.
The constructed maps define the feasible combinations of indicators. The borders separate dominated from non-dominated solutions. Maps can be presented to potential forest owners as the main simulation result obtained by experienced planning/optimization experts. They can serve for the definition of management goals by interaction with the forest owner. The end-points representing the desired combinations of indicator values define the particular management goals. Thus, the definition of the optimization goals (reasonable target levels/values of indicators) in the considered four-dimensional goal space is done in two steps: (i) the selection of a 2D graph lying in the row and column of the matrix that best correspond to our preferences for risk minimization objectives and (ii) the subsequent placement of the target end-point on the Pareto boundary of the selected graph corresponding to the selection of the Pareto optimal combination of the financial revenues from the growing stock and the cumulative thinning yields determining the expected economic efficiency.
Figure 4b–e are the individual graphs selected from the larger matrix corresponding to the expected preferences and behaviors of the different potential types of forest owners as decision-makers. We simulated an economically oriented risk-seeking decision-maker by choosing Figure 4b. It is the graph with the largest gray area, representing high economic returns from cumulative thinning and standing volume values at the age f 90 years. At the same time, it is the graph with an extremely low level of biodiversity and a high H/D, indicating an expected acceptance of high risk. Subsequently, we simulated the forest owner’s selection of the position of the target point (vector) on the Pareto boundary in the selected 2D graph. The target point is marked with a red cross in the graphs. By this selection, the simulated owner type determines which combination of revenues from final felling and revenues from thinning he/she prefers at an accepted level of H/D and biodiversity. Here, it was expected that an economically oriented risk-seeking owner would prefer slightly higher continuous revenues from thinning (y-axis) over revenues from final cuttings of the standing volume (x-axis), due to the small area of the considered CSA.
The same simulation procedure for selecting a goal vector was repeated for other types of forest owners. It is expected that Figure 4c will select an economically oriented risk-avoiding owner who focuses on the static stability of the forest stands and considers the economic yields and biodiversity to be less critical. This type of potential owner will probably choose a graph with a low H/D value, which indicates high static stability of the stand, and with higher cumulative revenues from thinning to ensure the profitability of management but with a low value of less preferable biodiversity.
The nature-oriented DM (Figure 4d), aiming to maximize biodiversity, does not consider economic returns to be necessary; after securing biodiversity, he/she tries to maximize the ecological stability of the stand. The last neutral, fully balanced decision-maker (Figure 4e), who puts the same emphasis on all the indicators, would probably choose a graph from the center of the matrix. Additionally, it is expected that the final goal point will be situated in the middle of the Pareto frontier, where the provision of all the services reaches an average value.
After the selection of the goal vectors by the potential forest owner in the IDM graphs (see, also, Figures S1 and S2), it is possible to find the best (existing) tending strategy located closest to the selected goal point using the RGM incorporated in VisAn (Figure 5). The main optimization results are given in Table 3. Here, we can see how the type of stand and simulated behavior of potential forest owner influence the choice of the optimal tending alternative.
The optimal variants of tending do not differ only based on the type of FO that chose them but also based on the type of stand in which they were applied. At the same time, we can also draw more general conclusions from Table 3. For example, if we prefer neutral management goals with the simultaneous maximization of all the considered indicators, it is better to use weaker thinning with a higher frequency. When primarily strengthening the static stability of the stand, it is more appropriate to use stronger interventions with lower frequency.
The optimization of tending in case study area with less fertile and relatively dry soils and lower site indices revealed several interesting facts:
  • If we prefer economic optimization criteria at higher risk levels, the slight-to-average thinning applied once per decade is suggested.
  • If we concentrate on static/ecological stability, various thinning methods can be applied, but the application must be relatively frequent, and the strength must approach the optimal stocking levels defined by Assman [60]. Moreover, in spruce-dominated stands, intensive pre-commercial thinning is the main measure for reducing the risk of damage (mainly by snow). Thinning should be done before a stand top height of 10 m is reached [61,62].
  • If the promotion of biodiversity is at the center of our attention, the conversion of species composition is the first choice (the biodiversity indicator values are lowest in spruce monocultures). A stronger overstory or future crop tree thinning applied less frequently (once per decade) is an additional option.
Fully balanced management can be achieved in given natural conditions by the application of slighter overstorey thinning once per decade. The species composition and degree of naturalness have a fundamental influence on the optimal tending variant. More intensive thinning from below is suggested in artificial monospecific (spruce) stands. However, with an increased share of native broadleaves, the overstorey and target crop tree approaches are more suitable (following expectations). A more detailed assessment of species composition averaged across different FOs suggests applying:
  • Slighter or medium interventions once per decade in spruce-dominated stands.
  • Slighter overstorey interventions with the higher frequency of two times per decade until the age of 50 years and once per decade beyond 50 years for partly changed species composition with the enlarged representation of broadleaves.
  • The overstorey method with intervention once per decade to achieve optimal stocking for native broadleaf-dominated stands.
As a general tendency, lower frequencies of thinning interventions (even at young ages) are characteristic of optimal tending variants, which is probably explainable by the low productivity of sites in the selected case study area.

4. Discussion

As mentioned in the introduction, forestry in former Czechoslovakia has developed differently to that in Western European countries, with strong impacts on the current approaches to forest management. One of the most important results of the case study is the possibility of taking into account the views of the decision-maker in the choice of the optimal educational alternative. The study suggests that the tending procedures used to date in practice correspond most closely to the type of the economically oriented decision-maker. Monofunctional, predominantly economically oriented forest management still prevails [63]. Orientation toward wood production results in relatively uniform tending differentiated only according to stand species composition. This fact can be, and often already is, a source of conflict with other stakeholders under very rapidly changing ecological, economic and social conditions characteristic of many post-socialist European countries.
The transition to multi-objective management should be based on the knowledge that non-provisioning services are not only an externality in addition to the production of wood. Additionally, the recognition of undesirable trade-offs among demanded ESs is necessary. The shift requires both legislative changes and the application of proper schemes of payments for provided ESs [64]. If we want forest managers and owners to produce all the ESs required by society, it is necessary to provide them with positive incentives and compensation for lost profits. Many useful examples of best practices in this area exist [5,26,27,35,65]. The practical implementation of multi-objective management is dependent on the existence of a reliable system for decision support [66]. The exact quantification of the ES provision is needed for proper optimization according to multiple objectives. A participative approach would determine objectives in conflict areas.
In the presented article, we tried to demonstrate the application of modern, user-friendly MCDM methods utilizable in a complex system for decision-making support in the future. Regarding the change in the understanding of multifunctional management, the study demonstrated trade-offs between the biodiversity and ecological stability of the even-aged forest and the overall amounts of financial incomes from thinning or final cuttings. This central trade-off in contemporary forestry is intensively studied across Europe and globally [11,67,68,69]. Even with small changes in the values of ecological stability, it can be seen how its improvement negatively affects the sum of cumulative incomes from thinning and final growing stock value. Eggers et al. [5] and Lafond et al. [70] obtained similar results.
In this regard, the biggest problem for (financial) ES evaluation is still the demands of economists to link evaluation to benefits and end-to-end services for society as well as the ambiguity in the scales and details of the determination of individual services [71]. A study by Schröter et al. [65] addresses the issue at the European level to create a harmonized ES evaluation system for all countries. For the standardization and possibilities of comparison and evaluation produced by the ESs across the European Union, the CICES scheme [10] has been created, which seeks a clear economic evaluation of the EC in connection with environmental accounting.
Our work provides a small clear example of how the state-of-art simulation and optimization tools can solve the described global problems at the forest stand level. Given the extreme complexity of the outlined problems in evaluating the entire ES basket, we focused in this pilot work on a group of provisioning ESs, which are precisely valued by the timber trade. Simultaneously, we focused on the ecological integrity of the forest, which was used as a measure of the risk associated with the management of natural resources. Pasalodos-Tato et al. [72] and Uhde et al. [73] presented the need to calculate risk and uncertainty in the search for optimal management strategies. If uncertainty is not incorporated into the optimization process, non-optimal solutions can be falsely accepted. The non-optimal strategies could lead to a loss of the usefulness of the decision, such as a loss of economic return or irreversible damage to the ecosystem [72,74,75].
Here, the management risks and indicators were directly incorporated into the optimization problem itself. The study leads us to an interesting idea of the two-stage optimization of any basket of conflicting ESs: (i) the study and the optimization of trade-offs among a set of ES indicators against the indicators of ecological stability and biodiversity as measures of the ecological risks at first, and (ii) then, after the associated risks have been set to an acceptable level, the detailed optimization of the provisioning and other non-provisioning services should be done.
Within the described methodology, we also presented the practical applicability of partial components of a complex decision support system, which would be based on the principles of MCDM methods and enable participatory decision-making processes. The widespread use of MCDM methods and their suitability for optimizing the use of natural resources, including forestry, has been confirmed by many studies, e.g., Kangas et al. [76]. At the same time, these methods form the basic framework for linking expertise with practice [33,35], which necessarily makes implementation decisions regarding the management of natural resources complex [36,43].
Here, the method of IDMs provides a forest owner with all the optimal alternatives in an easy-to-understand form. The relationships between the individual optimization goals—how they interact and where the breakpoints or the permissible levels of trade-offs are—are presented. IDMs do not require a priori defined preferences from the decision-maker over the required optimization goals. The DM expresses their requirements only after reviewing all the acceptable (optimal) solutions, which allows the prevention of the intractability of the optimization problem. The advantage of IDM/RGM method is the production of a whole set of Pareto optimal solutions. The method creates an information and communication base for understanding the complexity in the management of specific natural resources [77]. IDM/RGM makes it possible to make interactive decisions, learn about a given problem, think about several dimensions of a decision problem and, at the same time, reduce conflicts in the optimization structure [38].
IDM/RGM offers the possibility to easily and quickly display the relationships between individual goal indicators in an acceptable form, which allows individual or participatory decision-making processes [40]. The whole procedure is very flexible and can be applied in an adaptive setting. At any time when the state of the forest substantially changes, the tending measures can be promptly re-planned for adjusted optimization goals. If necessary, the whole management plan can be completely redrawn. Therefore, if a comprehensive DSS for solving multi-criteria forestry problems will be constructed in Czech or Slovak republic, we recommend the investigated method as very suitable.
Graphically based IDM/RGM allows the intuitive assessment of indicators at absolute scale and greatly facilitates the determination of multiple management goals in multidimensional space. For example, the presented study showed that the graphical presentation of the target optimization space opens up the possibility for a user to control the solution of a complicated silviculture task easily. The graphical method is easy to use and implement, especially in comparison to other approaches serving for the determination of multiple targets in multidimensional spaces [47,78]. The visualization of results increases efficiency and transparency in multi-stakeholder decision-making [28,39,41,79,80]. Still, the assistance of experienced experts in MCDM is inevitable during the possible interactive process. Participatory MCDM methods currently appear to be the most effective in the sustainable management of natural resources [30,35]. At the same time, participatory multi-criteria decision-making processes always generate knowledge about the decision-making problem, which may lead to a reduction in prejudice against the forest sector. This is important at a time when the public is gradually increasing its interest in the management and use of natural resources [30].

5. Conclusions

The study focused on the multi-criteria optimization of forest stand tending in a selected ownership unit in terms of maximizing financial returns and minimizing risk. The simulated growth responses to various tending practices make it possible to indicate and quantify the provision of financial incomes from wood production, and the ecological stability and biodiversity of the representative forest stands differed by the degree of species composition naturalness.
The multi-criteria analysis proved that monofunctional, predominantly economically oriented forest management still prevails in the Czech and Slovak Republics. Orientation toward wood production and relatively unified tending can be a source of conflicts with other stakeholders in the changing ecological, economic and social conditions in many post-socialist European countries. The demonstrated approach based on the application of the visualization optimization method IDM/RGM and the direct involvement of the decision-maker in the optimization procedure showed possibilities for changing the current understanding of the multifunctional management of forests in the Czech and Slovak Republics.
The study proved that the whole procedure is intuitive, complex and easy to implement because the potential forest owner/stakeholder expresses their preferences about ecosystem services on an absolute scale. The graphical display of the optimization results simplifies the problem of choosing an optimal tending alternative and allows the decision-maker to enter into the decision-making process interactively. The method offers complex information in an acceptable and easy-to-understand form.
The most important study finding is confirmation of the existence of trade-offs among biodiversity, ecological stability and wood production. The performed analysis indicates the possibility of directly incorporating the indicators of management risks into the optimization problem itself. It leads to the idea of two-phase optimization in which the acceptable risk levels are defined at first and the detailed optimization of the demanded ESs then performed.
The implementation of multi-objective management in practice will bring, with high probability, a reduction in the financial incomes of forest owners. This loss requires a real paradigm shift in forestry. The supply of non-provisioning services and maintenance of the biodiversity and sustainability of forests must be perceived as a service provided to society by the forest owners and therefore should be adequately valued. Alternatively, there should be some positive incentives from the state for the provision of a broad set of services other than wood production.
However, such an approach first requires solving the problem of ES evaluation and subsequent legislative changes regarding highly regulated Czech and Slovak forest management. The implementation of multi-objective management must be actively addressed because the 60% loss of biodiversity and worsening ability of forests to regulate climate change have been registered in many European regions in recent years.

Supplementary Materials

The following are available online at https://0-www-mdpi-com.brum.beds.ac.uk/1999-4907/11/7/730/s1. Figure S1: Interactive decision maps for representative stand with partly changed species composition; Figure S2: Interactive decision maps for representative stand with native species composition.

Author Contributions

R.S. and J.T. conceived the study; R.S., J.T. and R.M. developed the methodology; R.S., M.L. and J.B. were responsible for processing the data; M.L. wrote the first draft of the manuscript; R.S., J.T., D.S., J.B., V.J. and J.K. contributed to revisions of the first draft; V.A.B. was responsible for software development and supervision; R.S., J.T. and R.M. acquired the funding. All authors have read and agreed to the published version of the manuscript.

Funding

This research received funding from “Advanced research supporting the forestry and wood-processing sector’s adaptation to global change and the 4th industrial revolution“, No. CZ.02.1.01/0.0/0.0/16_019/0000803 financed by OP ERD and the Ministry of Education, Science, Research and Sport of the Slovak Republic (grant agreement VEGA No. 1/0564/19).

Conflicts of Interest

The authors declare no conflict of interest. The funders had no role in the design of the study; in the collection, analyses or interpretation of data; in the writing of the manuscript; or in the decision to publish the results.

References

  1. Lazdinis, M.; Angelstam, P.; Lazdinis, I. Maintenance of forest biodiversity in a post-Soviet governance model: Perceptions by local actors in Lithuania. Environ. Manag. 2007, 40, 20–33. [Google Scholar] [CrossRef] [PubMed]
  2. Brukas, V.; Sallnäs, O. Forest management plan as a policy instrument: Carrot, stick or sermon? Land Use Policy 2012, 29, 605–613. [Google Scholar] [CrossRef] [Green Version]
  3. Brodrechtova, Y.; Navrátil, R.; Sedmák, R.; Tuček, J. Using the politicized IAD framework to assess integrated forest management decision- making in Slovakia. Land Use Policy 2018, 79, 1001–1013. [Google Scholar] [CrossRef]
  4. Kulla, L.; Sitková, S. Reconstruction of Non-Native Spruce Forests: Knowledge, Experience, Recommendations; National Forest Centre: Zvolen, Slovakia, 2012. (In Slovak) [Google Scholar]
  5. Eggers, J.; Holmgren, S.; Nordström, E.; Lämås, T.; Lind, T.; Öhman, K. Balancing different forest values: Evaluation of forest management scenarios in a multi-criteria decision analysis framework. For. Policy Econ. 2019, 103, 55–69. [Google Scholar] [CrossRef]
  6. Lazdinis, M.; Angelstam, P. Functionality of riparian forest ecotones in the context of former Soviet Union and Swedish forest management histories. For. Policy Econ. 2005, 7, 321–332. [Google Scholar] [CrossRef]
  7. Meidinger, E.; Brukas, V.; Bouttoud, G.; Tysiachniouk, M.; Ahas, R.; Actins, A.; Hain, H.; Paschalis-Jakubowicz, P.; Kore, M.; Mardiste, P. Forest certification in Eastern Europe and Russia. In Confronting Sustainability: Forest Certification in Developing and Transitioning Countries; Cashore, B., Gale, F., Meidinger, E., Newson, D., Eds.; Report number 8; Yale University: New Haven, CT, USA, 2006; pp. 163–170. [Google Scholar]
  8. Lawrence, A. Forestry in transition: Imperial legacy and negotiated expertise in Romania and Poland. For. Policy Econ. 2009, 11, 429–436. [Google Scholar] [CrossRef]
  9. Maes, J.; Fabrega, N.; Zulian, G.; Barbosa, A.L.; Vizcaino, P.; Ivits, E.; Polce, C.; Vandecasteele, I.; Rivero, I.M.; Guerra, C.; et al. Mapping and Assessment of Ecosystems and Their Services: Trends in Ecosystems and Ecosystem Services in the European Union between 2000 and 2010; Publications Office of the European Union: Brussels, Belgium, 2015. [Google Scholar]
  10. Haines-Young, R.; Potschin, M.B. Common International Classification of Ecosystem Services (CICES) V5.1 and Guidance on the Application of the Revised Structure; Fabis Consulting Ltd.: Nottingham, UK, 2018. [Google Scholar]
  11. Díaz, S.; Settle, J.; Brondizio, E. Intergovernmental Science-Policy Platform on Biodiversity and Ecosystem Services, (IPBES) Summary for policymakers of the Global Assessment Report on Biodiversity and Ecosystem Services (Version Summary for Policy Makers); Intergovernmental Science-Policy Platform on Biodiversity and Ecosystem Services: Bonn, Germany, 2019. [Google Scholar]
  12. Communication from the Commission to the European Parliament, the Council, the European Economic and Social Committee and the Committee of the Regions: EU Biodiversity Strategy for 2030 Bringing nature back into our lives. COM/2020/380_final. Available online: https://ec.europa.eu/environment/nature/biodiversity/strategy/index_en.htm (accessed on 20 May 2020).
  13. Papánek, F. Theory and Practice of Functionally Integrated Forest Management; Príroda: Bratislava, Slovakia, 1978. (In Slovak) [Google Scholar]
  14. Krečmer, V. Sustainable development and forest management in the Czech Republic (I). Lesnícví-Forestry 1993, 39, 513–519. (In Czech) [Google Scholar]
  15. Vyskot, I. Classification of Forests in the Czech Republic According to the Significance of the Total Real Potential of Society-Wide Functions (for Management Units and Stand Types); ME (MŽP): Prague, Czech Republic, 1999. (In Czech) [Google Scholar]
  16. Vyskot, I.; Schneider, J.; Kozumplíková, A. Dynamics of functional effect of forest stands within ecosystem services problematics. Zprávy Lesníckeho Výskumu 2016, 61, 81–89. (In Czech) [Google Scholar]
  17. Sedmák, R.; Fabrika, M.; Bahýľ, J.; Pôbiš, I.; Tuček, J. Application of simulation and optimization tools for developing forest management plans in the Slovak natural and management conditions. In Implementation of DSS Tools into the Forestry Practice: Reviewed Conference Proceedings; Tuček, J., Ericsson, O., Garcia-Gonzalo, J., Eds.; Technical University in Zvolen: Zvolen, Slovakia, 2013; pp. 139–152. [Google Scholar]
  18. Zlatník, A. Overview of Slovak Forests According to Groups of Forest Types. Files of Scientific Laboratory Biocoenology and Forest Typology, 3rd ed.; Agriculture University in Brno: Brno, Czech Republic, 1959. (In Czech) [Google Scholar]
  19. Plíva, K. Phytocoenological Classification System of Forest Management Institute; Forest management Institute: Brandýs nad Labem, Czech Republic, 1987. (In Czech) [Google Scholar]
  20. Halaj, J.; Petráš, R. Growth Tables of Main Tree Species; Slovak Academic Press: Bratislava, Slovakia, 1998. (In Slovak) [Google Scholar]
  21. Halaj, J.; Grék, J.; Pánek, F.; Petráš, R.; Řehák, J. Growth Tables of Main Tree Species of Czechoslovakia; Nature Press: Bratislava, Slovakia, 1987. (In Slovak) [Google Scholar]
  22. Bavlšík, J.; Kučera, J.; Ruman, K. Forestry Planning and Sustainable Forest Management; National Forest Centre: Zvolen, Slovakia, 2010. (In Slovak) [Google Scholar]
  23. Tuček, J.; Sedmák, R.; Majlingová, A.; Sedliak, M.; Marques, S. Decision support systems in Slovak forestry planning: A review. For. J. 2015, 61, 19–30. [Google Scholar] [CrossRef] [Green Version]
  24. Sedmák, R. System of forest management planning in Slovakia—The time has come for a change? Správy z Výskumu Lesníckej Fakulty pre prax 2018, 2, 5–13. (In Slovak) [Google Scholar]
  25. Quine, C.P.; Bailey, S.A.; Watts, K. Sustainable forest management in a time of ecosystem services frameworks: Common ground and consequences. J. Appl. Ecol. 2013, 50, 863–867. [Google Scholar] [CrossRef] [PubMed] [Green Version]
  26. Považan, R.; Getzner, M.; Kadlečík, J. Assessment of ecosystem services in protected areas of the Carpathians with a focus on Slovakia—Methodological procedure for rapid assessment. Quaest. Rerum Nat. 2014, 1, 7–14. (In Slovak) [Google Scholar]
  27. Považan, R.; Getzner, M.; Švajda, J. On the valuation of ecosystem services in Muránska Planina National Park. J. Prot. Mt. Areas Res. 2015, 7, 61–69. [Google Scholar] [CrossRef]
  28. Nordström, E.; Eriksson, L.O.; Öhman, K. Integrating multiple criteria decision analysis in participatory forest planning: Experience from a case study in northern Sweden. For. Policy Econ. 2010, 12, 562–574. [Google Scholar] [CrossRef] [Green Version]
  29. Estévez, R.A.; Walshe, T.; Burgman, M.A. Capturing social impacts for decision-making: A multi-criteria decision analysis perspective. Divers. Distrib. 2013, 19, 608–616. [Google Scholar] [CrossRef]
  30. Bruña-García, X.; Marey-Pérez, M.F. Public participation: A need of forest planning. iForest Biogeosci. For. 2014, 7, 216–226. [Google Scholar] [CrossRef] [Green Version]
  31. Diaz-Balteiro, L.; Romero, C. Making forestry decisions with multiple criteria: A review and an assessment. For. Ecol. Manag. 2008, 255, 3222–3241. [Google Scholar] [CrossRef]
  32. Muys, B.; Hynynen, J.; Palahí, M.; Lexer, M.J.; Fabrika, M.; Pretzsch, H.; Gillet, F.; Briceño, E.; Nabuurs, G.J.; Kint, V. Simulation tools for decision support to adaptive forest management in Europe. For. Syst. 2010, 19, 86–99. [Google Scholar] [CrossRef] [Green Version]
  33. Rammer, W.; Schauflinger, C.; Vacik, H.; Palma, J.H.N.; Garcia-Gonzalo, J. A web-based ToolBox approach to support adaptive forest management under climate change. Scand. J. For. Res. 2014, 29, 96–107. [Google Scholar] [CrossRef]
  34. Reynolds, K.; Paplanus, S.; Miller, B.; Murphy, P. Design features behind success of the ecosystem management decision support system and future development. Forests 2015, 6, 27–46. [Google Scholar] [CrossRef] [Green Version]
  35. Blattert, C.; Lemm, R.; Thees, O.; Lexer, M.J.; Hanewinkel, M. Management of ecosystem services in mountain forests: Review of indicators and value functions for model based multi-criteria decision analysis. Ecol. Indic. 2017, 79, 391–409. [Google Scholar] [CrossRef]
  36. Segura, M.; Ray, D.; Maroto, C. Decision support systems for forest management: A comparative analysis and assessment. Comput. Electron. Agric. 2014, 101, 55–67. [Google Scholar] [CrossRef]
  37. Mendoza, G.A.; Martins, H. Multi-criteria decision analysis in natural resource management: A critical review of methods and new modelling paradigms. For. Ecol. Manag. 2006, 230, 1–22. [Google Scholar] [CrossRef]
  38. Mazziotta, A.; Podkopaev, D.; Triviño, M.; Miettinen, K.; Pohjanmies, T.; Mönkkönen, M. Quantifying and resolving conservation conflicts in forest landscapes via multi-objective optimization. Silva Fenn. 2017, 51, 1778. [Google Scholar] [CrossRef]
  39. Borges, J.G.; Garcia-Gonzalo, J.; Bushenkov, V.; McDill, M.E.; Marques, S.; Oliveira, M.M. Addressing multi-criteria forest management with Pareto frontier methods: An application in Portugal. For. Sci. 2014, 60, 63–72. [Google Scholar] [CrossRef] [Green Version]
  40. Lotov, A.V.; Zaitsev, A.D.; Kiastanov, A.A. Reasonable Goals Method for Databases (RGDB). Available online: http://www.ccas.ru/mmes/mmeda/soft/third.htm (accessed on 30 May 2020).
  41. Lotov, A.V.; Miettinen, K. Visualizing the Pareto Frontier. In Multi-Objective Optimization: Interactive and Evolutionary Approaches; Branke, J., Branke, J., Deb, K., Miettinen, K., Slowiński, R., Eds.; Springer Science & Business Media: Berlin/Heidelberg, Germany, 2008; pp. 213–244. [Google Scholar]
  42. Lotov, A.V.; Bushenkov, V.A.; Kamenev, G.K. Interactive Decision Maps: Approximation and Visualization of Pareto Frontier; Springer Science & Business Media: Berlin/Heidelberg, Germany, 2013; Volume 89. [Google Scholar]
  43. Borges, J.G.; Marques, S.; Garcia-Gonzalo, J.; Rahman, A.U.; Bushenkov, V.; Sottomayor, M.; Carvalho, P.O.; Nordström, E.M. A multiple criteria approach for negotiating ecosystem services supply targets and forest owners’ programs. For. Sci. 2017, 63, 49–61. [Google Scholar] [CrossRef]
  44. Merganič, J.; Merganičová, K.; Výbošťok, J.; Valent, P.; Bahýľ, J.; Yousefpour, R. Searching for Pareto Fronts for Forest Stand Wind Stability by Incorporating Timber and Biodiversity Values. Forests 2020, 11, 583. [Google Scholar] [CrossRef]
  45. The European Union’s Horizon 2020 Research and Innovation Programme under Grant Agreement No. 676754: Alternative Models and Robust Decision Making for Future Forest Management (ALTERFOR), 2016–2020. Available online: https://alterfor-project.eu/ (accessed on 10 April 2020).
  46. The European Union’s Seventh Program for Research, Technological Development and Demonstration under Grant Agreement No. 282887: Future-Oriented Integrated Management of European Forest Landscapes (INTEGRAL), 2011–2014. Available online: https://cordis.europa.eu/project/id/282887 (accessed on 1 November 2011).
  47. Branke, J.; Miettinen, K.; Slowiński, R. Multiobjective Optimization: Interactive and Evolutionary Approaches; Springer: Berlin/Heidelberg, Germany, 2008. [Google Scholar]
  48. Fabrika, M. SIBYLA Forest Biodynamics Simulator: Concept, Construction and Software Solution; TU Zvolen: Zvolen, Slovakia, 2005. (In Slovak) [Google Scholar]
  49. Augustynczik, A.L.D.; Gutsch, M.; Basile, M.; Suckow, F.; Lasch, P.; Yousefpour, R.; Hanewinkel, M. Socially optimal forest management and biodiversity conservation in temperate forests under climate change. Ecol. Econ. 2020, 169, 106504. [Google Scholar] [CrossRef]
  50. Felton, A.; Petersson, L.; Nilsson, O.; Witzell, J.; Cleary, M.; Felton, A.M.; Björkman, C.; Sang, Å.O.; Jonsell, M.; Holmström, E.; et al. The tree species matters: Biodiversity and ecosystem service implications of replacing Scots pine production stands with Norway spruce. Ambio 2020, 49, 1035–1049. [Google Scholar] [CrossRef] [Green Version]
  51. Duffy, J.E.; Godwin, C.M.; Cardinale, B.J. Biodiversity effects in the wild are common and as strong as key drivers of productivity. Nature 2017, 549, 261–264. [Google Scholar] [CrossRef]
  52. Chu, X.; Yang, H.; Jiang, Y.; Man, R. On the use of observational data in studying biodiversity-productivity relationships in forests. For. Chron. 2019, 95, 24–28. [Google Scholar] [CrossRef]
  53. Pretzsch, H.; Biber, P.; Ďurský, J. The single tree-based stand simulator SILVA: Construction, application and evaluation. For. Ecol. Manag. 2002, 162, 3–21. [Google Scholar] [CrossRef]
  54. Sharma, R.P.; Vacek, Z.; Vacek, S.; Kučera, M. A nonlinear mixed-effects height-to-diameter ratio model for several tree species based on Czech national forest inventory data. Forests 2019, 10, 70. [Google Scholar] [CrossRef] [Green Version]
  55. Pretzsch, H. Forest Dynamics, Growth and Yield: From Measurement to Model; Springer: Berlin/Heidelberg, Germany, 2009. [Google Scholar]
  56. Burkhart, H.E.; Tomé, M. Modeling Forest Trees and Stands, 2nd ed.; Springer: Dordrecht, The Netherland, 2012. [Google Scholar]
  57. O’Hara, K.L. Multiaged Silviculture: Managing for Complex Forest Stand Structures; Oxford University Press: Oxford, UK, 2014. [Google Scholar]
  58. Jaehne, S.; Dohrenbusch, A. A method to evaluate forest stand diversity. Forstwiss. Cent. 1996, 116, 1–6. [Google Scholar]
  59. Soloveitchik, D.; Ben-Aderet, N.; Grinman, M.; Lotov, A. Multiobjective optimization and marginal pollution abatement cost in the electricity sector—An Israeli case study. Eur. J. Oper. Res. 2002, 140, 571–583. [Google Scholar] [CrossRef]
  60. Assmann, E. Waldertragskunde: Organische Produktion, Struktur, Zuwachs und Ertrag von Waldbestände; BLV Verlagsgesellschaft: Munchen, Germany, 1961. [Google Scholar]
  61. Slodicak, M.; Novak, J. Silvicultural measures to increase the mechanical stability of pure secondary Norway spruce stands before conversion. For. Ecol. Manag. 2006, 224, 252–257. [Google Scholar] [CrossRef]
  62. Hein, S.; Herbstritt, S.; Kohnle, U. Auswirkung der Z-Baum-Auslesedurchforstung auf Wachstum, Sortenertrag und Wertleistung im europäischen Fichten-Stammzahlversuch (Picea abies (L. Karst.) in Südwestdeutschland. Allgemeine Forst und Jagdzeitung 2007, 179, 192–201. [Google Scholar]
  63. Konôpka, J. From production to multifunctional utilization of forest ecosystems. For. J. 2010, 56, 81–92. [Google Scholar] [CrossRef] [Green Version]
  64. Sarvašová, Z.; Báliková, K.; Dobšinská, Z.; Štěrbová, M.; Šálka, J. Payments for forest ecosystem services across Europe—Main approaches and examples from Slovakia. Ekológia 2019, 38, 154–165. [Google Scholar] [CrossRef] [Green Version]
  65. Schröter, M.; Albert, C.; Marques, A.; Tobon, W.; Lavorel, S.; Maes, J.; Brown, C.; Klotz, S.; Bonn, A. National ecosystem assessments in Europe: A review. Bioscience 2016, 66, 813–828. [Google Scholar] [CrossRef] [Green Version]
  66. Maria, E.; Maarten, N.; Emin, N.; Başkent, Z.; Biber, P.; Black, K. Forest decision support systems for the analysis of ecosystem services provisioning at the landscape scale under global climate and market change scenarios. Eur. J. For. Res. 2019, 138, 561–581. [Google Scholar] [CrossRef]
  67. Verkerk, P.J.; Mavsar, R.; Giergiczny, M.; Lindner, M.; Edwards, D.; Schelhaas, M.J. Assessing impacts of intensified biomass production and biodiversity protection on ecosystem services provided by European forests. Ecosyst. Serv. 2014, 9, 155–165. [Google Scholar] [CrossRef]
  68. Eyvindson, K.; Repo, A.; Mönkkönen, M. Mitigating forest biodiversity and ecosystem service losses in the era of bio-based economy. For. Policy Econ. 2018, 92, 119–127. [Google Scholar] [CrossRef]
  69. Schwaiger, F.; Poschenrieder, W.; Biber, P.; Pretzsch, H. Ecosystem service trade-offs for adaptive forest management. Ecosyst. Serv. 2019, 39, 100993. [Google Scholar] [CrossRef]
  70. Lafond, V.; Cordonnier, T.; Mao, Z.; Courbaud, B. Trade-offs and synergies between ecosystem services in uneven-aged mountain forests: Evidences using Pareto fronts. Eur. J. For. Res. 2017, 136, 997–1012. [Google Scholar] [CrossRef]
  71. Daily, G.C. What are ecosystem services. In Global Environmental Challenges for the Twenty-First Century: Resources, Consumption and Sustainable Solutions; Lorey, D.E., Ed.; Scholarly Resources Inc.: Wilmington, DE, USA, 2003; pp. 227–231. [Google Scholar]
  72. Pasalodos-Tato, M.; Mäkinen, A.; Garcia-Gonzalo, J.; Borges, J.G.; Lämås, T.; Eriksson, L.O. Review. Assessing uncertainty and risk in forest planning and decision support systems: Review of classical methods and introduction of innovative approaches. For. Syst. 2013, 22, 282–303. [Google Scholar] [CrossRef] [Green Version]
  73. Uhde, B.; Hahn, W.A.; Griess, V.C.; Knoke, T. Hybrid MCDA methods to integrate multiple ecosystem services in forest management planning: A critical review. Environ. Manag. 2015, 56, 373–388. [Google Scholar] [CrossRef] [Green Version]
  74. Pukkala, T. Multiple risks in multi-objective forest planning: Integration and importance. For. Ecol. Manag. 1998, 111, 266–284. [Google Scholar] [CrossRef]
  75. Burkhart, H.E.; Stuck, D.R.; Leuschner, W.A.; Reynolds, M.R. Allocating inventory resources for multiple-use planning. Can. J. For. Res. 2015, 8, 100–110. [Google Scholar] [CrossRef]
  76. Kangas, A.; Kangas, J.; Kurtitil, M. Decision Support for Forest Management; Series: Managing Forest Ecosystems; Springer International Publishing: Cham, Switzerland, 2015; Volume 30. [Google Scholar]
  77. Ananda, J.; Herath, G. A critical review of multi-criteria decision making methods with special reference to forest management and planning. Ecol. Econ. 2009, 68, 2535–2548. [Google Scholar] [CrossRef]
  78. Deb, K.; Singhya, K.; Hakanen, J. Multi-objective optimization. In Decision Sciences: Theory and Practise; Sengupta, R.N., Gupta, A., Dutta, J., Eds.; Taylor & Francis Group: Boca Raton, FL, USA, 2017; pp. 146–183. [Google Scholar]
  79. Bruña-García, X.; Marey-Pérez, M.F. The challenge of diffusion in forest plans: A methodological proposal and case study. Forests 2018, 9, 240. [Google Scholar] [CrossRef] [Green Version]
  80. Miettinen, K. Survey of methods to visualize alternatives in multiplecriteria decision making problems. OR Spectr. 2014, 36, 3–37. [Google Scholar] [CrossRef] [Green Version]
Figure 1. Forest regions of the Czech Republic; (a) Region 9 Rakovnik-Kladno’s upland; (b) Location of case study area (CSA) (gray parts represent forest area distribution).
Forests 11 00730 g001
Figure 2. Information flow and modular structure of growth simulator SIBYLA [48].
Forests 11 00730 g002
Figure 3. Goals of optimization and their indicators.
Forests 11 00730 g003
Figure 4. (a) Interactive decision maps (IDM) are representing a trade-off between the value of the standing volume and cumulative revenues from thinning at a specific level of H/D and B index for a representative forest stand (RST) with a changed species composition. Blue areas represent the set of the feasible solutions that contain Pareto optimal solutions on the hull frontier. (b) IDM that will be probably chosen by the economically oriented risk-seeking owner, (c) IDM probably selected by economically oriented risk-avoiding owner, (d) IDM suitable for nature-oriented decision-maker (DM) and (e) IDM that is likely to be chosen by the balanced owner.
Forests 11 00730 g004
Figure 5. Example of a selection of candidates for an optimal tending system with the shortest distance to the target point determined in the VisAn software environment.
Forests 11 00730 g005
Table 1. The essential characteristics of the representative forest stands used to generate the virtual stand structure in the forest growth simulator SIBYLA at the age of 30 years.
CompositionTree SpeciesQVtableRep.DBHHVactual
(m3ha−1)(%)(cm)(m)(m3ha−1)
Changedspruce24791009.29.079.0
Partly changedspruce2479609.29.047.4
beech2685307.410.125.5
oak2271108.310.17.1
Naturalbeech2685607.410.151.0
oak2271308.310.121.3
fir2259108.68.05.9
Q –site index, Vtable—standing volume for 100% species share and full stocking estimated from growth tables; Rep.—Share of tree species; DBH—Mean diameter at breast height; H—Mean height; Vactual—Standing volume calculated as table volume × species share × mean stocking determined from stand descriptions for each naturalness class.
Table 2. Tending systems—timing and number of interventions.
SystemAge of Forest Stands at the Time of the InterventionN
I 13035404550556065707580859015
II3035404550556065707580 9014
III 2303540455055606570 80 9013
IV30354045505560 70 80 9012
V 33035404550 60 70 80 9011
VI303540 50 60 70 80 9010
VII30 40 50 60 70 80 909
VIII30 40 50 60 70 80 908
IX30 40 50 60 70 80 7
X30 40 50 60 80 6
XI 430 40 60 80 5
XII30 40 60 80 4
XIII 530 40 60 3
XIV30 40 2
XV30 1
N—Number of interventions; Classes of tending systems: 1 Extremely heavy, 2 Heavy, 3 Moderate, 4 Light, and 5 Extremely light variants of tending treatments.
Table 3. Optimal alternatives of tending treatments for representative forest stands.
SCFOTSTSSDDADescription and Recommendations
ChangedEc-RsBVII1--Slight B, 1x per decade, maintain full canopy cover
Ec-RaBII0.8--P, 2x per decade until 80 years; later, 1x per decade, maintain optimal stocking
NrAXII0.8--A, 1x per 20 years, optimal stocking
BaAVII1--Slight A, 1x per decade, full canopy cover
Partly changedEcBVI1--Slight B, 2x per decade until 50 years; later, 1x per decade, full canopy cover
EnAVI1--Slight A, 2x per decade until 50 years; later, 1x per decade
NrTXII-91T, 1x per 20 years, low target tree number—aid 1
BaAVI1--Slight A, 2x per decade until 50 years; later, 1x per decade, full canopy cover
NaturalEcAVII0.8--A, 1x per decade, optimal stocking
EnTXII-92T, 1x per 20 years, low target tree number—aid 2
NrAXII0.7--A, 1x per 20 years, stronger interventions up to critical stocking level
BaAVII0.8--A, 1x per decade, optimal stocking
SC—Species composition; FO—Forest owner; T—Thinning method; S—Tending system; TS—Target stocking after the intervention; SD—Spacing distance of future crop trees in meters; DA—Degree of future crop tree aid (1-2-3); A—Thinning from above (overstory); B—Thinning from below (understory); T—Future crop trees method; Ec—Economically oriented risk-seeking FO; En—Economically oriented risk-avoiding FO; Nr—Nature-oriented FO; Ba—Balanced FO.

