Costs and Carbon Sequestration Assessment for REDD+ in Indonesia
by
 ,
,
Guifang Liu
1,2,3, 
Qing Liu
1,
Mengxiao Song
1,
Junsheng Chen
1,
Chuanrong Zhang
4,
Xing Meng
5,
Jincai Zhao
6 and
Heli Lu
1,2,3,* 1
College of Environment and Planning, Henan University, Kaifeng 475004, China
2
Key Laboratory of Geospatial Technology for the Middle and Lower Yellow River Regions of Ministry of Education, Henan University, Kaifeng 475004, China
3
Key Research Institute of Yellow River Civilization and Sustainable Development & Collaborative Innovation Center on Yellow River Civilization of Henan Province, Henan University, Kaifeng 475001, China
4
Department of Geography and Center for Environmental Sciences and Engineering, University of Connecticut, Storrs, CT 06269-4148, USA
5
Key Laboratory of Geographic Information Science (Ministry of Education), School of Geographical Sciences, East China Normal University, Shanghai 200241, China
6
School of Business, Henan Normal University, Xinxiang 453007, China
*
Author to whom correspondence should be addressed.
Forests 2020, 11(7), 770; https://0-doi-org.brum.beds.ac.uk/10.3390/f11070770
Submission received: 15 June 2020
/
Revised: 12 July 2020
/
Accepted: 13 July 2020
/
Published: 17 July 2020
(This article belongs to the Special Issue REDD+: Protecting Climate, Forests and Livelihoods)
Abstract
:Research Highlights: Our findings highlight that the contribution of carbon sequestration from plantations to REDD+ will remain limited, and that opportunity costs in Southeast Asia will likely increase, due to future oil palm expansion. Background and Objectives: Land use, land-use change, and forestry (LULUCF) are significant sources of carbon emissions. The United Nations Framework Convention on Climate Change (UNFCCC) agreed that the Reducing Emissions from Deforestation and Forest Degradation Plus program, also known as REDD+, could contribute to carbon sinks in tropical regions. These reductions could serve as carbon credits that offset emissions from other sources. Materials and Methods: This study uses the cellular automaton technique to simulate the business-as-usual (BAU) scenario and the gain-loss method, to measure carbon emissions resulting from forest conversion. The output of the integration of the models makes it possible to evaluate one of the most important financial costs: opportunity costs. Two scenarios (with and without consideration of carbon sequestration) in rubber and oil palm plantations are examined. Results: A sensitivity assessment in Kalimantan, Indonesia, shows that carbon sequestration from plantations affects value of opportunity costs less than social discount rates. Further analysis suggests that oil palm plantations have a greater impact than rubber plantations. Conclusions: Our study provides a case that can be applied to other regions for evaluating the impacts of plantation carbon sequestration, and insights that can help local policymakers design a financially attractive REDD+ program in other forest areas of the world.
1. Introduction
Currently, climate change is one of the most urgent topics of global concern [1,2]. Climate change is caused by the effects of increased greenhouse gas emissions, such as carbon dioxide, due to anthropogenic activities [3,4,5,6,7,8]. Tropical rain forests play a key role in coping with the increase in global carbon dioxide levels [9], because tropical rainforest vegetation contains more carbon than the mid-temperate zone and frigid zone forests [10,11]. At present, the carbon released by tropical rain forests due to deforestation accounts for 6%–15% of the annual global greenhouse gas emissions [12,13,14,15].
The 19th Conference of the Parties to the United Nations Framework Convention on Climate Change (COP19) and the 9th Conference of the Parties to the Kyoto Protocol (CMP9) were jointly held on the topic of Reducing Emissions from Deforestation and Forest Degradation Plus (REDD+) funding in Warsaw, Poland, from 11–22 November 2013. In-depth discussions on the action points, coordination of REDD+ action support, and land use, land-use change, and forestry -related technical issues were held [16,17,18]. In 2016, the central role of forests to meet the well below 2 °C goal through mitigation from REDD+ action was recognized by Article 5 of the Paris Agreement [19,20]. Most recently, developing country Parties implementing REDD+ activities are encouraged to complete the Warsaw Framework for REDD+, with online safeguards information systems and submissions of summaries of information to the UNFCCC (REDD monitor, 2020) [21].
Deforestation and forest degradation monitoring, reporting and verification, determination of the carbon emission reference levels (baselines), the National Forest Monitoring System (NFMS), the Forest Reference Emission Level and Forest Reference Level (FREL/FRL), the Strategic Environmental and Social Assessment (SESA), REDD+ Strategy are basic issues for REDD+ [22,23]. The goal of REDD+ is to raise funds from developed countries to help developing countries reduce emissions caused by deforestation. Its core principle involves using market mechanisms to encourage reduction of the greenhouse gas emissions caused by deforestation, by reducing forest damage and preventing forest degradation, while allowing these countries to obtain corresponding income through the carbon market [24,25,26,27,28].
Nowadays, cocoa, coffee, tea, coconut, bananas, rubber, and oil palm are the most valuable plantations in tropical regions [29]. Financial costs play a key role in REDD+. The IPCC AR5 performed a detailed analysis of global and regional costs associated with REDD+. This analysis demonstrated that forestry-related emission mitigation represents a cost-effective mechanism and, furthermore, produces other benefits [1]. Despite these benefits and the substantial progress of REDD+, costs are one of unresolved fundamental issues [30,31,32]. Opportunity costs (OC) are one of the major costs in the application of REDD+. OC could be defined as the net income divided by the net carbon emissions avoided per hectare. By disregarding the existence of and circumstances surrounding weak property rights and limited control over land use in many tropical forests, deforestation actors command their resources in any manner they see fit to gain financial (or other) benefits [26]. In the REDD+ program, policymakers establish an incentive payment or a payment for ecosystem service (PES) scheme, thereby rewarding actors with carbon credits for reducing emissions related to deforestation and forest degradation below a given threshold. Whether actors cut forests down is determined by the revenue gap between net present values (NPV) from composite commodities and perceived REDD+ payments for actors. In this way, deforestation is positively related to income associated with timber sales and agricultural activities, and negatively related to REDD+ payments. Alternatively, lower levels of deforestation result in reduced income from composite commodities, but higher revenues from the REDD+ program [27].
Farmers should be compensated for their losses of opportunity costs from stopping deforestation activities. OC can serve to indicate the minimum amount that would need to be paid to forest owners to keep them from engaging in deforestation [33]. In contrast, in places with the potential for development of high-value economic activities, REDD+ activities may only make sense as an incremental incentive in forest conservation. In addition, investments towards improving forest governance and regulation, or recognizing customary land rights, can be a cheaper option for protecting natural forests [34]. Gregersen et al [18] indicate that OC may distort the real costs of REDD+. These distortions are caused by the fact that: (i) OC may not be an appropriate indicator for measuring the true costs of stopping deforestation; (ii) OC may not be sufficient to explain the payment required to stop deforestation; (iii) in a system with poor market operation, estimation of OC is difficult; and (iv) in the case of the continuous development of the main carbon offset market, the price paid to forest land owners for non-deforestation is determined by the market.
One of the factors in OC is the discount rate. The choice of the discount rate depends on various factors, like whether a country is developed or developing. Smith indicated that since REDD+ implementation is for a long period of time a social discount rate could better reflect its feature of non-marginal policy [35]. For example, the major assessments of climate change policies, the Stern Review and the Garnaut Review, usually used the social discount rates, rather than a market rate [36,37].
As the first and second in production in the world, oil palm plantations in Indonesia and Malaysia are major cause of the massive destruction of tropical forests, since they generate about USD 10 billion in exports [38,39]. For example, due to palm oil plantation expansion, the current forest cover in Kalimantan of Indonesia declined from 75% in the mid-1980s, with an annual deforestation rate of 1.3 million ha. As a result, Kalimantan suffered the highest rate of deforestation in Indonesia [40,41]. The drivers of such large-scale of deforestation are economic, social, and especially from the decentralization policy implemented in Indonesia since 2000.
There is long standing debate on the appropriate scale and intensity for carbon sequestration in these agroecosystems in these two countries. For example, the GHG inventory in the Second National Communication by the Ministry of Natural Resources and Environment Malaysia [25] showed that, in 2007, oil palm plantations and forests were the two primary CO2 removers for Malaysia. The prior studies of the OC for REDD+ mainly concentrate on costs assessment. However, few studies focus on the carbon sequestration impact from the agroecosystems on OC, which is important to understand the payment barriers, potential trade-offs between environment and development, and the possible co-benefits that can be achieved within a successful REDD+ implementation. Since OC is defined as the net income divided by the net carbon emissions avoided per hectare, the carbon sequestration from these plantations has potential impact on OC of avoided deforestation which could be compensated by REDD+ payment. For this purpose, we developed a spatially explicit modelling framework to capture reasonable payments under two scenarios that reflect concerns about carbon sequestration in plantations: (1) Scenario A: without consideration of carbon sequestration in plantations, and (2) Scenario B: with consideration of carbon sequestration in plantations. We conducted a case study on Kalimantan, Indonesia, and focused on two major types of plantations: oil palm and rubber plantations.
2. Materials and Methods
2.1. Study Area
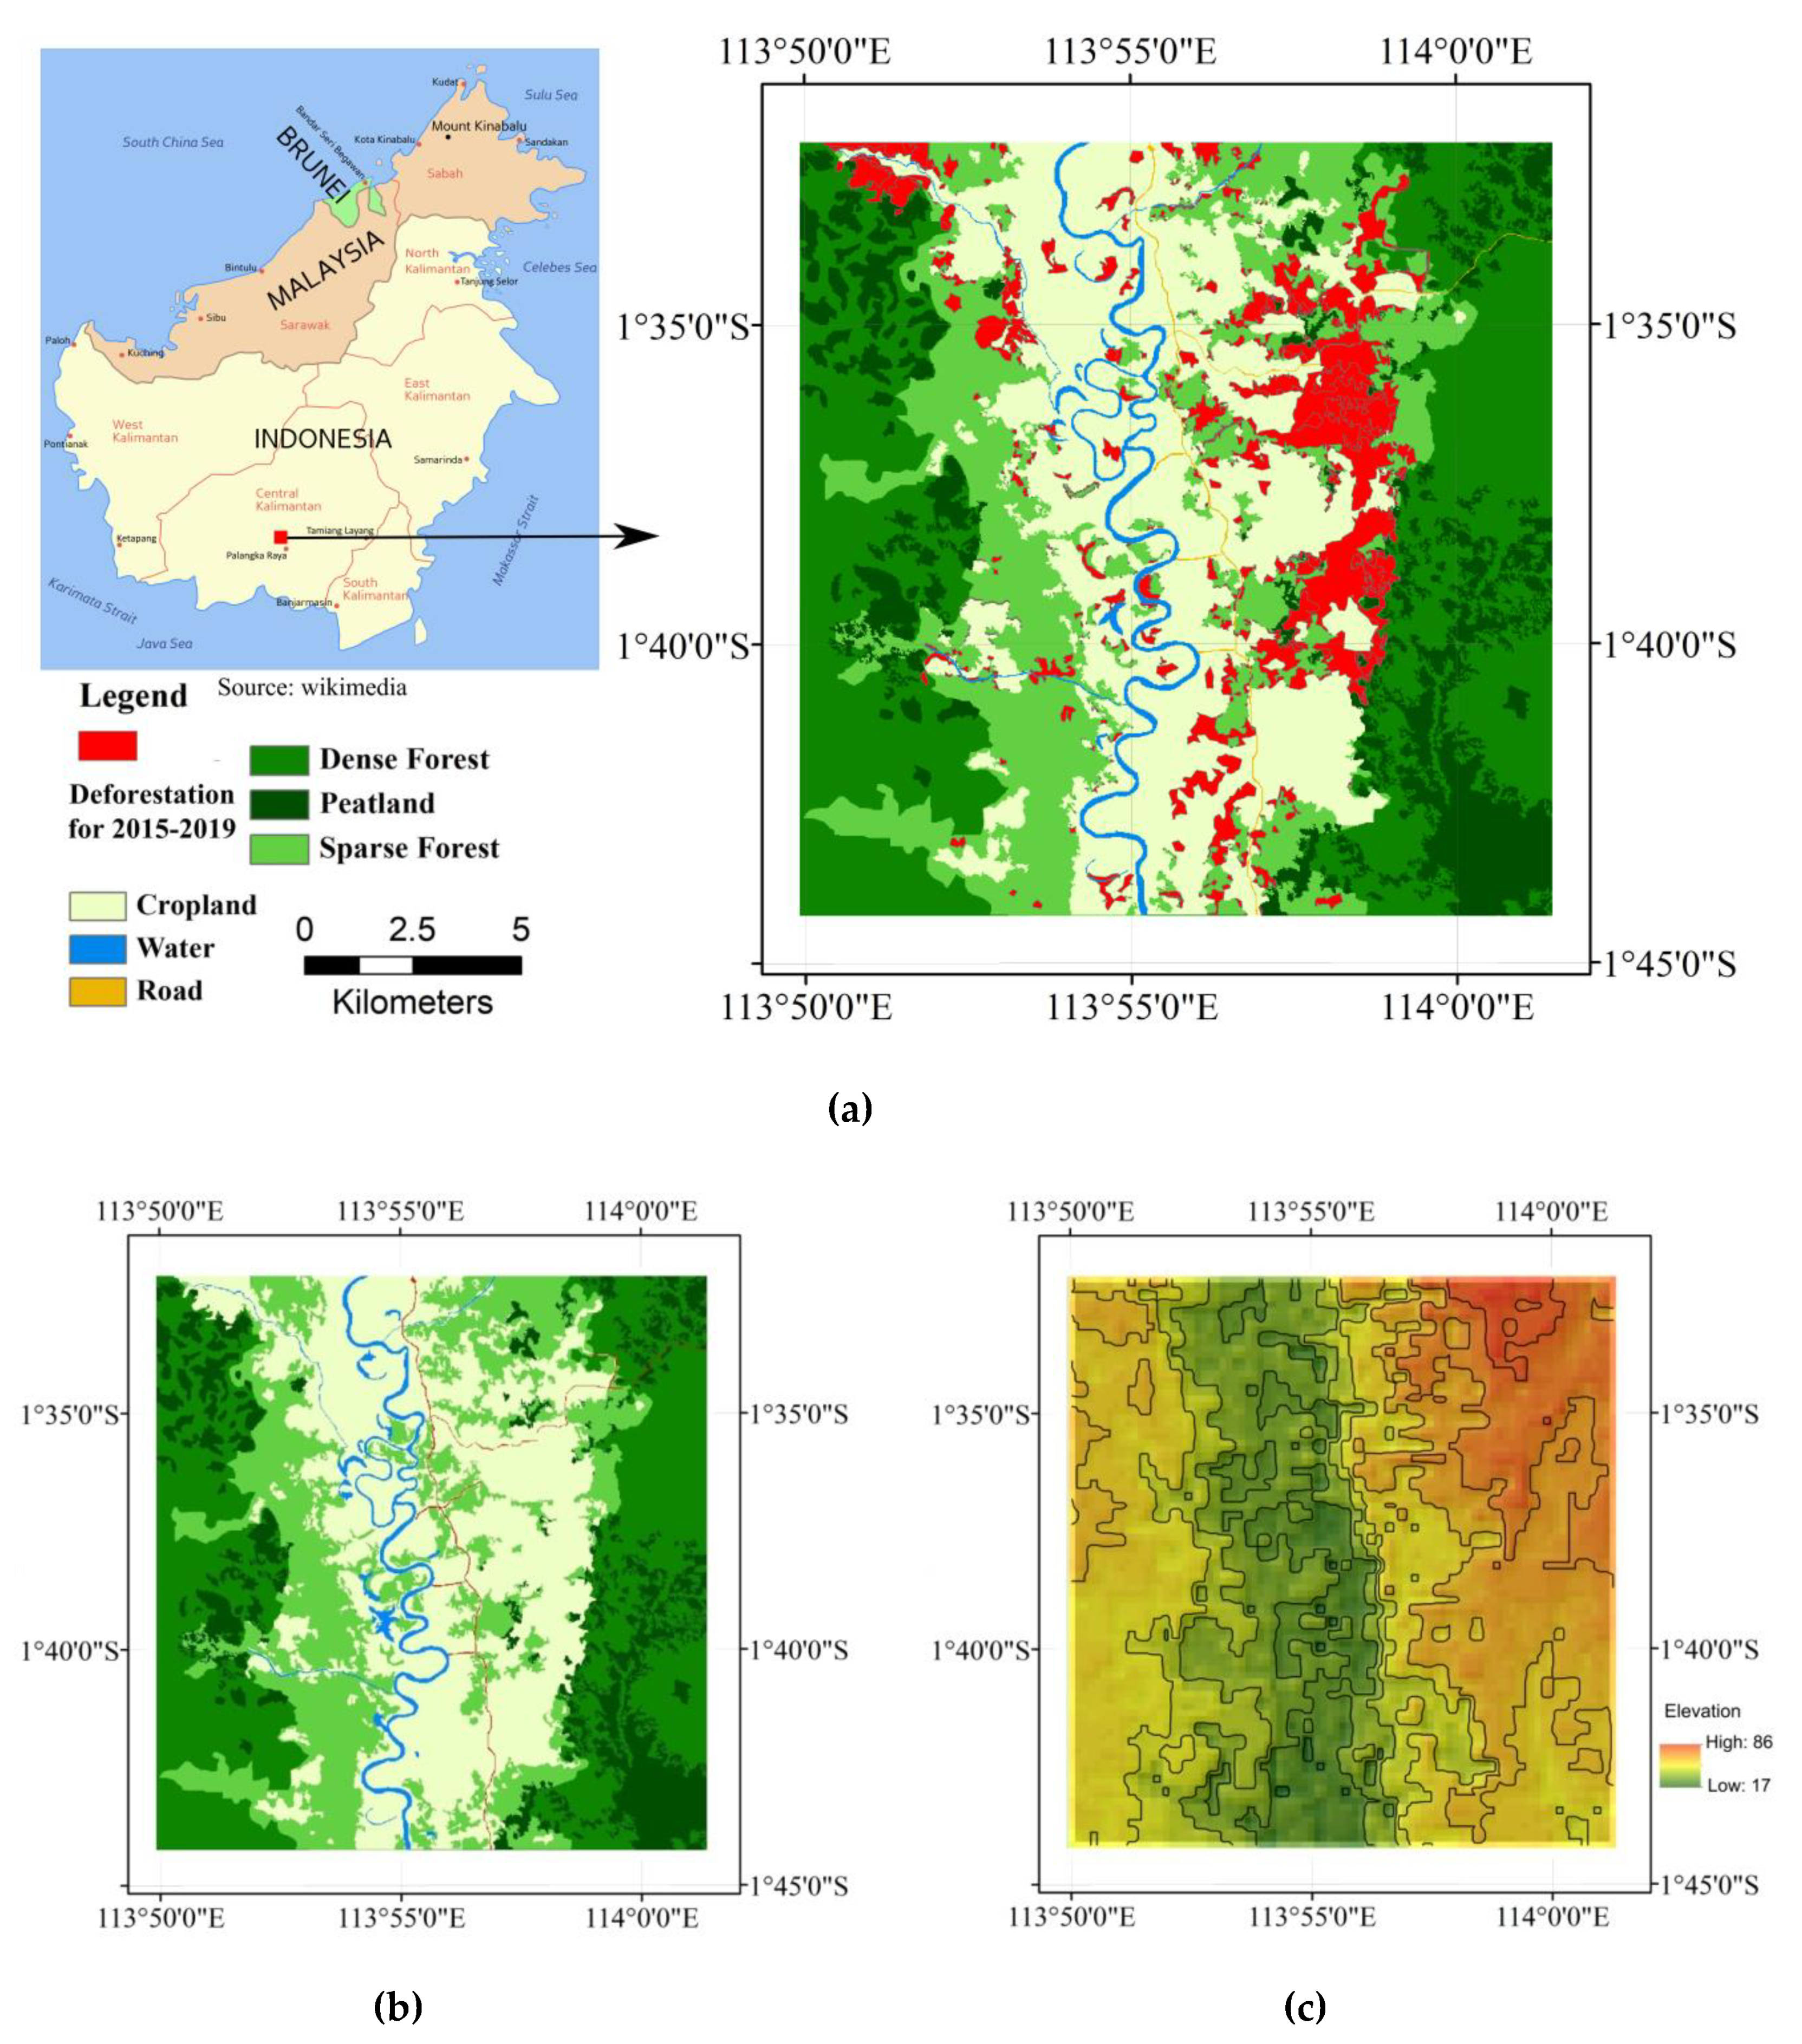
The study area (Figure 1) is 22.5 km × 21.5 km (47,940.75 hectares) at north Palangka Raya in Central Kalimantan, Indonesia. This area has historically been surrounded by heath forests and peat swamps, but has experienced deforestation since 2000. The study by Kanninen et al. [42] showed that, in the next 30 years, the clearing rate of the forests in this area could reach the highest level.
2.2. Data Description and Processing
Taking into account the availability of the data and their matching, this study used the Enhanced Thematic Mapper Plus/Thematic Mapper (ETM+/TM) remote sensing images in the study area, to interpret land use changes. The band combination technique is helpful for distinguishing different vegetation types when supplemented by NDVI data. Supervised classification was performed using the selected training samples to obtain the classification results. In this method, we first generated representative parameters in known areas for each land use class of dense forest, peatland, sparse forest, cropland, road, and water. We then checked and compared spectral characteristics for these classes to ensure the distinction. Finally, the maximum likelihood classification (MLC) technique, which assumes that the statistics for each class in each band can be described by a multivariate normal distribution and calculates the probability that a given pixel belongs to a specific class [43], was used, to perform classification via all the bands of the data. FAO [44] indicated that changes from dense forest, peatland, and sparse forest could be regarded as “deforestation”.
OC could be calculated using the following formula:
where OCBAU is opportunity costs, measured as the revenues gained per tonne of CO2 emissions avoided under business-as-usual (BAU) conditions (expressed in USD/tCO2); PtFC represents the net revenues (revenues minus costs) gained from a composite commodity after a forest is converted to land amenable to plantations (expressed in USD); and CtFC stands for total emissions produced from converting a forest (expressed in tonneCO2).
As a composite variable, PtFC is the net present value (NPV) generated from harvesting one hectare of forest. This composite variable can be modelled as:
where PhFC(t) is the one-time timber harvest value at time t; Ai(t) is the annual net revenue of the ith agricultural activity permitted by the land conversion at time t; Ri(t) is the annual revenue of the ith agricultural activity permitted by the land conversion at time t. Ci(t) is the annual costs of the ith agricultural activity permitted by the land conversion at time t. T denotes the period over which the forest is protected (expressed in years). For the expression ψ = ln(1+γ), γ is the discount rate. Finally, θi is the ratio of ith agricultural activity area to the total area.
Due to the limitation of the resolution of the satellite sensors, we conducted field surveys to reveal the ratio of plantation area. By visiting 189 randomly chosen households, we found that the average of oil palm plantation area and rubber plantation area is about 51% and 32.7% of the total, respectively. In the study from Yamamoto and Takeuchi [45] it was found that oil palm plantations and rubber plantation produce yield by the 3rd year and the 11th year, respectively. Plantation costs are USD 830 per hectare, when considering logging revenue and worker wages.
In order to set emission reduction targets, a reference level, which reflects what would have happened in the absence of REDD+, and thus quantifies the mitigation impact of a project or policy, must be developed. Using a reference level, reductions in emissions can be measured and credited, allowing for the provision of compensation. Bond et al. [17] indicated three approaches to determining the reference level: (i) extrapolating existing or historical rates of deforestation, also called BAU; (ii) estimating changes in carbon stocks from economically attractive land use options, taking into account barriers to investment; and (iii) estimating changes in carbon stocks from the most likely land use at the beginning of the project. This study used the cellular automata model to simulate the BAU related to land use development and changes [28]. The cellular automaton model, which is comprised of four elements and one important condition, can be expressed as follows:
where BAU represents spatial pattern of land use change under business as usual; X represents the individual land use cell; S indicates how the land is being used as per REDD+; N is the cell neighbourhood, which represents the attraction (positive) and repulsion (negative) effects of the various land use cells; DR indicates the rate of deforestation, which can be calculated using the compound interest law [46]; DA1 indicates forest area (in hectares) at t1; and DA2 indicates forest area (in hectares) at t2.
N is obtained as:
where Wsxd is the weighting parameter applied to states S at position x in distance zone d of the neighbourhood; Ixd is the Dirac delta function, which equals 1 if the cell is occupied by state S, and 0 otherwise; and R indicates the transition rules that represent a vector of transition potentials for each cell from Ni:
where W+ is the weight of evidence, which can be calculated as:
where D is the event.
There are two methods to estimate carbon emissions in IPCC guidelines: gain-loss method and stock-difference method [47]. Gain-loss method considers all carbon gains processes (e.g., growth) and all carbon losses processes (e.g., clearing, fires, decay et. al.), and, thus, is used to measure forest conversion emissions in this study. Forest emissions can be estimated as [48]:
where Cf,netFC(t) is total flux from forest conversion; Cf,burnFC(t) is burnt flux; Cf,decayFC(t) is the fluxes of carbon from decay; and Cf,plantationsFC(t) is carbon flux from uptake from plantations. They are expressed in tC/yr.
Following Ramankutty’s work [30] burnt flux is calculated as:
where Bioclear(t) is the total biomass from deforestation and the biomass from cleared secondary vegetation (expressed in tC/yr). This can be calculated with the following formula:
where BioSFclear(t) is:
and ASF(t,τ) represents the area of secondary forest for age-cohort τ at time t [30].
The following differential equation represents carbon fluxes from the slash, product, and elemental pools:
where Cin is the transfer of carbon from deforestation, and λ is the decay rate. The respective carbon dynamics for the various pools can be calculated using:
and the fluxes of carbon from the decay of these pools are calculated as:
where λslash = 0.1, λprod = 0.1, and λelem = 0.001 [30].
Over the course of period T, the carbon flux from uptake from plantations is:
where θi is the ratio of ith agricultural activity area to the total area.
The values from in situ forest inventories from Rahajoe [49] were the values of biomass. The studies on rubber plantations from Wauters et al. [50] and oil palm plantation from Khasanah et al. [51] were used to obtain carbon stocks for rubber and oil palm, respectively. The parameters for carbon pools from Ramankutty et al [48] were used in Equation (7)–Equation (16). A field survey revealed that most forests in the study area were mature forests. It is common practice under REDD+ to exclude this marginal benefit of retaining forests, so we ignore carbon sequestration from the remaining forest area.
To identify how significant any given input variable is in determining a project’s worth, or to reveal which parameter is more important on the results when we change input values, we conducted sensitivity analyze in this study. Sensitivity analysis is calculated as following [52]:
where S is sensitivity, x is state variable (e.g., OC), p is parameter (e.g., discount rates or plantation area), dx and dp are change of values of state variables and parameters.
Grieg-Gran indicated that 10% was the most common discount rate used in REDD+ studies for OC [53]. As a result, in this study a discount rate of 10% was used as a base case, to compare costs incurred at different points in the future to costs incurred today based on the normative approach. For a sensitivity analysis that determines model robustness, we calculate the OC using lower social discount rates of 2.5% and 5%, and higher social discount rates of 10% and 15% under the two scenarios.
3. Results and Discussion
3.1. Land Use Changes
The land use maps show that forested areas (dense forest, peatland, and sparse forest) declined from 61.5% in 2005 to 54.6% in 2009, indicating an average annual loss of 2.31% of the forest area. This loss in forest area occurred in parallel with an increase of 3.15 × 10³ hectares in the farming and plantation area, and a small increase in the number of roads, indicating that farming and plantations were the primary drivers of deforestation. In the business-as-usual (BAU) simulations, we tested a set of physical parameters as factors that affect changes in land use. These parameters include aspect, elevation, slope, soil type, distance to previously deforested land, distance to rivers, distance to roads, and distance to villages. After comparing the simulation results with an actual land-use map, we calculated a Kappa coefficient of 0.65.
3.2. Carbon Emissions and Net Present Values
Figure 2 illustrates carbon emissions by predicting future land use changes under two scenarios. Deforestation reduction in the east of the study area is disproportionately important to achieve REDD+ emission reduction targets due to paired high risks and high carbon stocks. Wilson, K. A et.al. [54] indicated that such hotspots with vulnerability to deforestation should be well identified, mapped, and characterized to help improve the planning of budgets and conservation plans for REDD+ implementation.
The prediction of the net present value obtained from rice, logging, oil palm plantations, and rubber plantations using Equation (6) is illustrated in Figure 3. Oil palm plantations and rubber plantations will generate USD 15.2 million (with USD 1.57 million in six years) and USD 10.5 million in revenue in 25 years, respectively. In Indonesia over the last twenty years oil palm and rubber plantations have been the most profitable land use choice for farmers [55,56]. In general, farmers first shifted from rice cultivation to rubber plantation and then to oil palm plantation, due to high yields and relatively low labor wages.
3.3. Opportunity Costs
The IPCC [6] estimated the savings and costs expected from forestry-related activities. For instance, mitigation efforts are predicted to be able to achieve emission reductions of 0.2–13.8 GtCO2/yr at costs of up to USD 100 per ton by 2030, of which about one-third can be achieved at less than USD 20/tCO2. It is true that the current carbon price has not reached USD 100/tCO2, indicating that there is still much uncertainty about future climate change and its mitigation costs. As a result, the uncertainties of costs and benefits should be taken into account during the decision making process. Figure 4 illustrates information in this study and from different sources of OC, and shows that OC and its applicability vary significantly by measure, scale, and region. This variability can be attributed to differing local biophysical, socioeconomic, and cultural conditions. According to a new study reviewing 57 REDD+ projects in Southeast Asia, Graham et al. [57] concluded that the cost of reducing emissions ranged from USD 9 to USD 75 per tonne (i.e., from USD 2.45/tCO2 to USD 20.44/tCO2 after conversion). This study can be used as a comparison. Our study shows that OC in Kalimantan, Indonesia ranges from 3.5/tCO2 to 19.6/tCO2, depending on different social discount rates, with an average value of USD 8.56/tCO2.
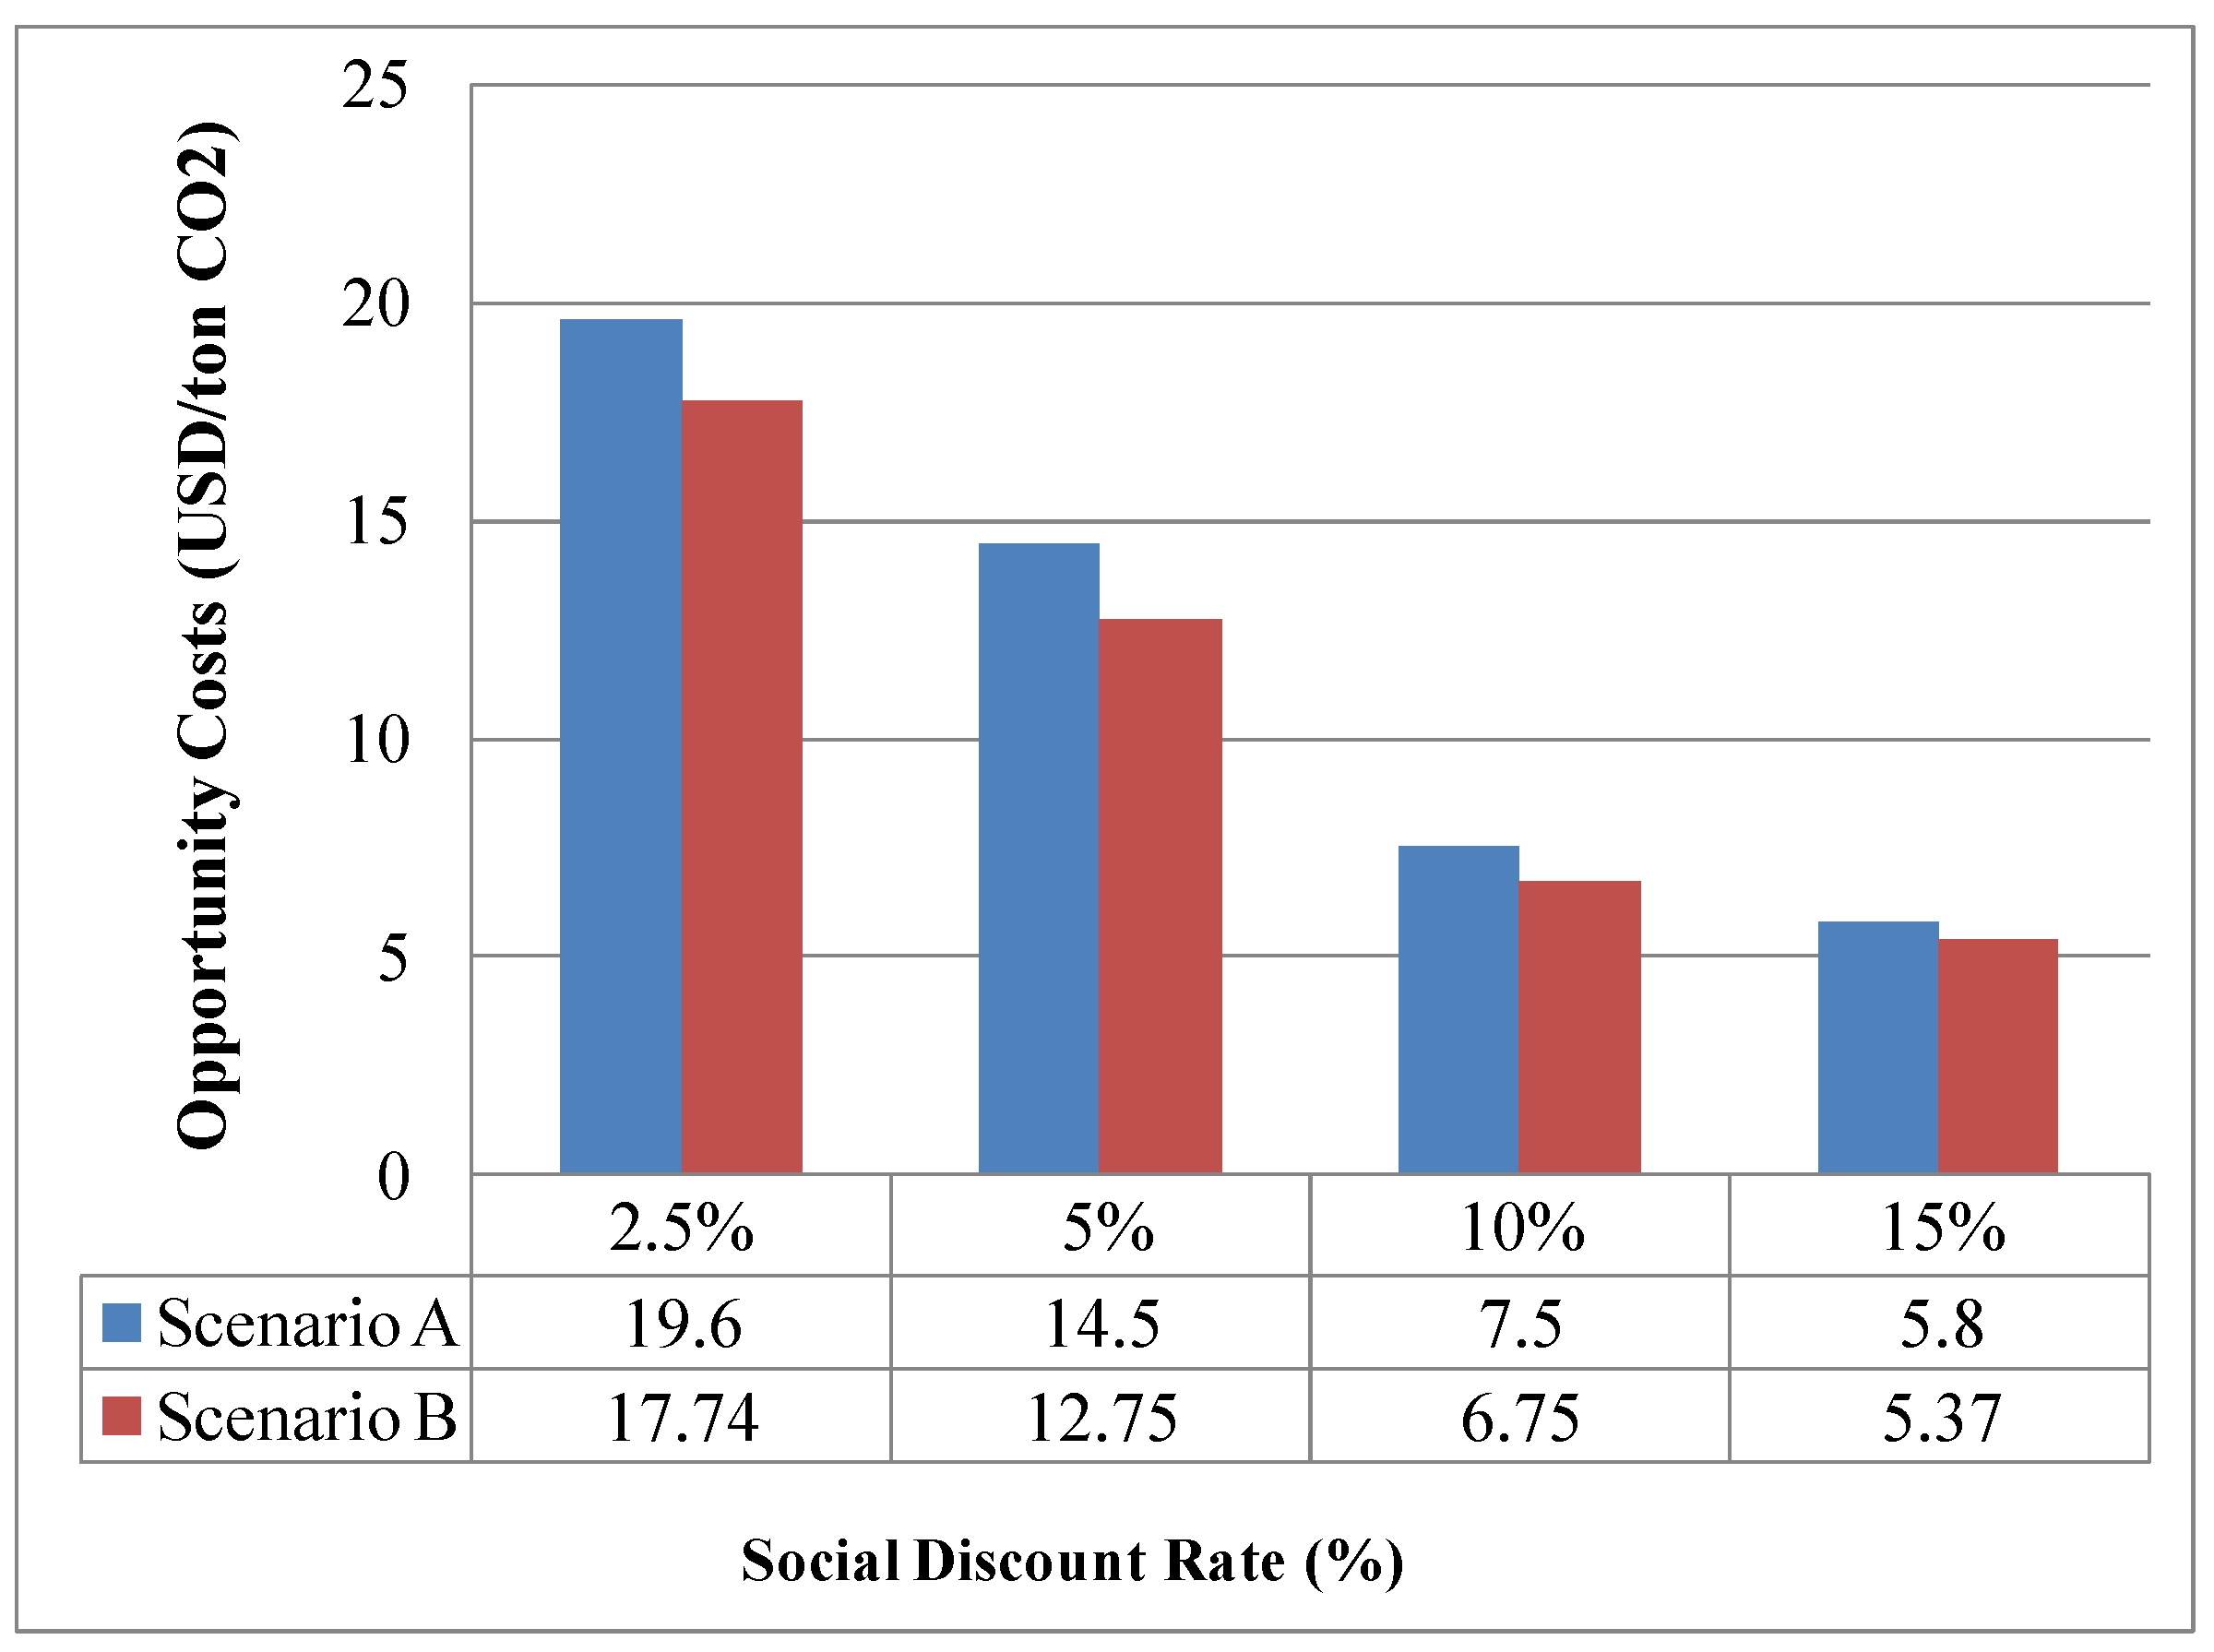
3.4. Sensitivity Analysis
Figure 5 shows sensitivity analysis of social discount rate to OC under two scenarios. It shows that OC decreases slowly as social discount rate increases. Under scenario A, the ratio changes by −26%( from USD 19.6 to USD 14.5) as the social discount rate increases by 2.5% (from 2.5% to 5%). In contrast, the change in OC is approximately the same percentage when the social discount rate increases by 5%( from 10% to 15%). Meanwhile, compared with scenario A, which considers the carbon in plantations, OC changes are almost all the same under scenario B, which does not consider the carbon in plantations, when the social discount rate changes from 2.5% to 15%. It is apparent that, relative to the social discount rate, carbon emissions from plantations have a much smaller impact on OC for REDD+ in Kalimantan, Indonesia.
We conducted a sensitivity analysis by increasing or decreasing plantation area by approximately 10% or 20% of the original value under the two scenarios. For each parameter change, we recorded the percentage impact on OC, which is graphically illustrated using a tornado diagram in Figure 6. Figure 6 shows that, under scenario A (without consideration of carbon in plantations), the change in incremental OC is only approximately 6%, when the oil palm plantation area increases by 10%. When the oil palm plantation area increases by 20%, OC increases from 13.3% to 51.6%. Rubber plantations show the same trend, that is, OC increases from 3% to 13.3% for the 10% case and from 7.5% to 25.5% in the 20% case. Compared with scenario A, OC decreases by 2.3% under scenario B, when the oil palm plantation area increases by 20%.
The values for individual oil palm plantations are always larger than those of rubber plantations. For example, under scenario A, when the area increase is 10%, the difference in OC between oil palm and rubber plantations (oil palm plantation minus rubber plantation) is 3%, and for a 20% increment, it is 5.8%. Under scenario B, the difference is smaller: 1.97% for the 10% case and 3.58% for the 20% case. Thus, we may conclude that OC increases faster in oil palm plantations than in rubber plantations.
4. Policy Implications
This study determined how carbon sequestration from plantations affects opportunity costs of avoided deforestation by defining two scenarios: with and without consideration of carbon sequestration in plantations. In addition, we identified the influences of individual plantations using a sensitivity analysis. Our outputs provided significant insights into the regions’ food, plantation agriculture, financial costs, and carbon emissions from the viewpoint of a developing country.
4.1. The Contribution of Carbon Sequestration from Plantations Is Limited on the Opportunity Costs of Avoided Deforestation
It takes about 60 to 80 years for natural forests to reach maximum stock when compared with about 25 years for rubber plantation and about 20 years for oil palm plantation. Although the agricultural plantation sector has a higher carbon sequestration rate (3–5 t C/ha/year) than maturing natural forests (0.5 t C/ha/year), it takes a very long time for the release of forest carbon to the atmosphere to be offset by claimed plantation growth rates [58,59]. Meanwhile the ‘production life cycle’, which considers the fate of an oil palm or rubber plantation from initial planting until the end of the economic life cycle and replanting, has a short natural lifespan of a couple of decades. In practical terms, this leads to plantations taking a long time to repay the carbon debt on that land. As a result, the effect of carbon sequestration from plantations is limited to the opportunity costs of avoided deforestation.
Furthermore, although carbon sequestration can be expected to offset emissions from land conversion in tropical forests with approximately net neutral effects over a plantation life cycle, these plantations in the species-rich tropics would have catastrophic effects on environmental conservation, and consequently threatening the global biological diversification. As a result, conversion of forests for plantations with high economic viability is putting carbon-rich ecosystems at risk, and thus not the best way to address the challenges of climate changes.
4.2. The Opportunity Cost of Avoided Deforestation in Southeast Asia Will Increase Due to Future Oil Palm Expansion
Our results indicate that OC increases significantly with a rise in oil palm plantations, whereas rubber plantations (as they currently stand) have a smaller effect. This finding is particularly relevant to Kalimantan, which has an accelerated expansion of oil palm plantations [60,61]. Carlson et al. [62] indicate that by 2020, the complete development of allocated leases is predicted to convert a total of 93,844 km2 of land (~90% forested land, including 41% intact forests) to oil palm plantations. In our study, when the area increased by 20%, the difference in OC between oil palm and rubber plantations increased by 5.8%. Thus, our research provides a strong perspective on OC for local policymakers, who can contribute toward political decision making and the evaluation of the potential of fields. This is especially meaningful, given the need for a locally adaptive regulatory framework to fulfil various climate objectives [63,64,65,66,67].
In Southeast Asia, plantations in Indonesia and Malaysia undoubtedly hold economic importance in the region [68,69,70]. These financial revenues have become more aggressive with the palm oil price boom. In fact, average crude palm oil prices have increased 2.5 times in real terms, from USD 417/tonne to USD 1041/tonne in recent years, and remain at approximately USD 634.4/tonne as of 2015 [71]. For example, the volume of oil palm brought USD 18.6 billion in foreign exchange revenue into Indonesia when compared with exports decreased by 2.91% to 2.6 million tonnes worth USD 4.74 billion USD for rubber in 2016. With spiraling market prices and relatively low production costs of oil palm, the value of OC is expected to increase significantly [72,73,74,75].
The results from local parameters used in this study yield only OC of carbon emissions in north Palangka Raya, Kalimantan, where a REDD+ program is particularly challenging, because of the accelerated expansion of plantations, and where the impact of plantations on REDD+ program compensation is poorly understood. Although there is no universal solution to the issue of REDD+ OC, our study provides a case that can be applied to other region for evaluating the impacts of plantation carbon sequestration and insights that can help local policymakers design a financially attractive REDD+ program in other tropical forests all over the world.
Author Contributions
Conceptualization, H.L.; Data curation, G.L., C.Z., J.Z.; Formal analysis, X.M. and Q.L.; Investigation, Q.L., M.S. and J.C.; Methodology, G.L. and C.Z.; Project administration, H.L.; Resources, G.L.; Writing—original draft, H.L. and G.L.; Writing—review & editing, H.L. All authors have read and agreed to the published version of the manuscript.
Funding
This study is under the auspices of NSFC41371525, JOF201702 and 2020K13. Open Fund of Key Laboratory of Geospatial Technology for the Middle and Lower Yellow River Regions (Henan University), Ministry of Education (Grant Number: GTYR201905).
Acknowledgments
The authors thank the anonymous reviewers and Academic Editor whose comments and suggestions were very helpful in improving the quality of this paper.
Conflicts of Interest
The authors declare no conflict of interest.
References
- IPCC. Climate Change 2014: Impacts, Adaptation, and Vulnerability. Part A: Global and Sectoral Aspects. Contribution of Working Group II to the Fifth Assessment Report of the Intergovernmental Panel on Climate Change; Field, C.B., Barros, V.R., Dokken, D.J., Mach, K.J., Mastrandrea, M.D., Bilir, T.E., Chatterjee, M., Ebi, K.L., Estrada, Y.O., Genova, R.C., Eds.; Cambridge University Press: Cambridge, UK; New York, NY, USA, 2014. [Google Scholar]
- IPCC. Climate Change 2007: Synthesis Report. Contribution of Working Group I, II and III to the Fourth Assessment Report of the Intergovernmental Panel on Climate Change. Summary for Policymakers; Solomon, S., Qin, D., Manning, M., Chen, Z., Marquis, M., Averyt, K.B., Tignor, M., Miller, H.L., Eds.; Cambridge University Press: Cambridge, UK, 2007. [Google Scholar]
- Sagar, R.; Li, G.Y.; Singh, J.S.; Wan, S. Carbon fluxes and species diversity in grazed and fenced typical steppe grassland of Inner Mongolia, China. J. Plant. Ecol. 2019, 12, 10–22. [Google Scholar] [CrossRef]
- Wang, X.; Fu, S.; Li, J.; Zou, X.; Zhang, W.; Xia, H.; Lin, Y.; Tian, Q.; Zhou, L. Forest soil profile inversion and mixing change the vertical stratification of soil CO2 concentration without altering soil surface CO2 flux. Forests 2019, 10, 192. [Google Scholar] [CrossRef] [Green Version]
- Wu, H.; Ding, J. Global change sharpens the double-edged sword effect of aquatic alien plants in China and beyond. Front. Plant. Sci. 2019, 10, 787. [Google Scholar] [CrossRef] [Green Version]
- Edenhofer, O.; Pichs-Madryga, R.; Sokona, Y.; Farahani, E.; Kadner, S.; Seyboth, K. Climate Change 2014: Mitigation of Climate Change; Cambridge University Press: Cambridge, UK; New York, NY, USA, 2014; pp. 511–597. [Google Scholar]
- Solomon, S. IPCC: Climate Change The Physical Science Basis; AGU Fall Meeting Abstracts; Cambridge University Press: Cambridge, UK, 2007. [Google Scholar]
- Meiyappan, P.; Jain, A.K.; House, J.L. Increased influence of nitrogen limitation on CO2 emissions from future land use and land use change. Glob. Biogeochem. Cycles 2015, 29, 1524–1548. [Google Scholar] [CrossRef]
- Houghton, R.A. The emissions of carbon from deforestation and degradation in the tropics: Past trends and future potential. Carbon Manag. 2013, 4, 539–546. [Google Scholar] [CrossRef]
- Lewis, S.L.; Lopez-Gonzalez, G.; Sonké, B.; Affum-Baffoe, K.; Baker, T.R.; Ojo, L.O.; Comiskey, J.A. Increasing carbon storage in intact African tropical forests. Nature 2009, 457, 1003–1006. [Google Scholar] [CrossRef]
- Malhi, Y.; Aragão, L.E.O.C.; Metcalfe, D.B.; Paiva, R.; Quesada, C.A.; Almeida, S.; Costa, A.C.L.D. Comprehensive assessment of carbon productivity, allocation and storage in three Amazonian forests. Glob. Chang. Biol. 2009, 15, 1255–1274. [Google Scholar] [CrossRef]
- Houghton, R.A. Emissions (and sinks) of carbon from land-use change. In Report to the World Resources Institute from the Woods Hole Research Center; Woods Hole Research Center: Falmouth, MA, USA, 2003. [Google Scholar]
- Houghton, R.A.; House, J.I.; Pongratz, J.; Van Der Werf, G.R.; Defries, R.S.; Chansen, M.C.; Quere, C.L.; Ramankutty, N. Carbon emissions from land use and land-cover change. Biogeosciences 2012, 9, 5125–5142. [Google Scholar] [CrossRef] [Green Version]
- Lin, D.; Xia, J.; Wan, S. Climate warming and biomass accumulation of terrestrial plants: A meta-analysis. New Phytol. 2010, 188, 187–198. [Google Scholar] [CrossRef]
- Liang, J.; Xia, J.; Liu, L.; Wan, S. Global patterns of the responses of leaf-level photosynthesis and respiration in terrestrial plants to experimental warming. J. Plant Ecol. 2013, 6, 437–447. [Google Scholar] [CrossRef] [Green Version]
- Graham, V.; Laurance, S.G.; Grech, A.; McGregor, A.; Venter, O. A comparative assessment of the financial costs and carbon benefits of REDD+ strategies in Southeast Asia. Environ. Res. Lett. 2016, 11, 1–11. [Google Scholar] [CrossRef] [Green Version]
- Bond, I.; Grieg-Gran, M.; Wertz-Kanounnikoff, S.; Hazlewood, P.; Wunder, S.; Angelsen, A. Incentives to Sustain Forest Ecosystem Services: A Review and Lessons for REDD; Natural Resource Issues No. 16; International Institute for Environment and Development: London, UK; CIFOR: Bogor, Indonesia; World Resources Institute: Washington, WA, USA, 2009. [Google Scholar]
- Gregersen, H.; El Lakany, H.; Karsenty, A.; White, A. Does the Opportunity Cost Approach Indicate the Real Cost of REDD+? Rights and Realities of Paying for REDD+. Available online: http://rightsandresources.org/wp-content/exported-pdf/reddbriefdraftjune28.pdf (accessed on 12 January 2018).
- Rogelj, J.; den Elzen, M.; Höhne, N.; Fransen, T.; Fekete, H.; Winkler, H.; Meinshausen, M. Paris Agreement climate proposals need a boost to keep warming well below 2 °C. Nature 2016, 534, 631–639. [Google Scholar] [CrossRef] [PubMed] [Green Version]
- Peters, G.P.; Andrew, R.M.; Canadell, J.G.; Fuss, S.; Jackson, R.B.; Korsbakken, J.I.; Nakicenovic, N. Key indicators to track current progress and future ambition of the Paris Agreement. Nat. Clim. Chang. 2017, 7, 118–122. [Google Scholar] [CrossRef]
- REDD Monitor. The Warsaw Framework for REDD Plus: The Decision on Summary of Information on Safeguards. Available online: http://rightsandresources.org/wp-content/exported-pdf/reddbriefdraftjune28.pdf (accessed on 12 January 2020).
- Pelletier, J.; Gélinas, N.; Skutsch, M. The place of community forest management in the REDD+ landscape. Forests 2016, 7, 170. [Google Scholar] [CrossRef] [Green Version]
- Chhatre, A.; Lakhanpal, S.; Larson, A.M.; Nelson, F.; Ojha, H.; Rao, J. Social safeguards and co-benefits in REDD+: A review of the adjacent possible. Current opinion in environmental. Sustainability 2012, 4, 654–660. [Google Scholar]
- Lamade, E.; Bouillet, J. Carbon storage and global change: The role of oil palm. Ocl-ol. Corps Gras Lipides 2005, 12, 154–160. [Google Scholar] [CrossRef]
- Ministry of Natural Resources and Environment Malaysia. Malaysia Second National Communication to the UNFCCC. 2011, p. 154. Available online: https://www.tl.undp.org/content/timor_leste/en/home/all-projects/Second-National-Communication-UNFCCC.html (accessed on 1 July 2020).
- Busch, J.; Godoy, F.; Turner, W.R.; Harvey, C.A. Biodiversity co-benefits of reducing emissions from deforestation under alternative reference levels and levels of finance. Conserv. Lett. 2011, 4, 101–115. [Google Scholar] [CrossRef]
- Pana, A.C.; Gheyssens, J. Baseline choice and performance implications for REDD. J. Environ. Econ. Policy 2016, 5, 79–124. [Google Scholar] [CrossRef] [Green Version]
- Verbury, P.H.; Kok, K.; Pontius, R.G. Veldkamp. Modeling Land-Use and Land-Cover Change; Springer: Berlin/Heidelberg, Germany, 2006; pp. 117–135. [Google Scholar]
- Knowlton, J.L.; Zayas, E.E.M.; Ripley, A.J.; Valenzuela-Cordova, B.; Collado-Torres, R. Mammal diversity in oil palm plantations and forest fragments in a highly modified landscape in southern Mexico. Front. For. Glob. Chang. 2019, 2, 67. [Google Scholar] [CrossRef]
- Pendrill, F.; Persson, U.M.; Godar, J.; Kastner, T.; Moran, D.; Schmidt, S.; Wood, R. Agricultural and forestry trade drives large share of tropical deforestation emissions. Glob. Environ. Chang. Hum. Policy Dimens. 2019, 56, 1–10. [Google Scholar] [CrossRef]
- Sharma, B.P.; Cho, S.-H. Using portfolio theory in spatial targeting of forest carbon payments: An effective strategy to address spatiotemporal variation in land use opportunity costs? Can. J. For. Res. 2020, 50, 170–184. [Google Scholar] [CrossRef]
- Sheng, J.; Hong, Q.; Han, X. Neoliberal conservation in REDD+: The roles of market power and incentive designs. Land Use Policy 2019, 89, 104215. [Google Scholar] [CrossRef]
- Cho, S.-H.; Sharma, B.P. Optimal spatial budget distribution of forest carbon payments that balances the returns and risks associated with conservation costs. Environ. Dev. Sustain. 2019. [Google Scholar] [CrossRef]
- Ji, Y.; Ranjan, R. A global climate-economy model including the REDD option. J. Environ. Manag. 2019, 247, 342–355. [Google Scholar] [CrossRef]
- Smith, K. Discounting, Risk and Uncertainty in Economic Appraisals of Climate Change Policy: Comparing Nordhaus, Garnaut and Stern; Commissioned Work. Garnaut Climate Change Review; Department of Climate Change and Energy Efficiency: Canberra, Australia, 2011. [Google Scholar]
- Stern, N. The Economics of Climate Change: The Stern Review; Cambridge University Press: Cambridge, UK, 2007. [Google Scholar]
- Garnaut Review. Weighing the Costs and Benefits of Climate Change Action; Garnaut Climate Change Review; Garnaut Review: Canberra, Australia, 2011. [Google Scholar]
- FAO (Food and Agriculture Organization). State of the World’s Forests 2009; Food and Agriculture Organization: Rome, Italy, 2009. [Google Scholar]
- Miettinen, J.; Shi, C.; Liew, S.C. Deforestation rates in insular Southeast Asia between 2000 and 2010. Glob. Chang. Biol. 2011, 17, 61–70. [Google Scholar] [CrossRef]
- Suwarno, A.; Hein, L.; Sumarga, E. Governance, decentralisation and deforestation: The case of central Kalimantan province, Indonesia. Q. J. Int. Agric. 2015, 54, 77–100. [Google Scholar]
- Broich, M.; Hansen, M.C.; Potapov, P.; Adusei, B.; Lindquist, E.J.; Stehman, S.V. Time-series analysis of multi-resolution optical imagery for quantifying forest cover loss in Sumatra and Kalimantan, Indonesia. Int. J. Appl. Earth Obs. Geoinf. 2011, 13, 277–291. [Google Scholar] [CrossRef]
- Kanninen, M.; Murdiyarso, D.; Seymour, F.; Angelsen, A.; Wunder, S.; German, L. Do Trees Grow on Money? The Implications of Deforestation Research for Policies to Promote REDD; Center for International Forestry Research: Bogor, Indonesia, 2007; pp. 1–61. [Google Scholar]
- Richards, J.A. Remote Sensing Digital Image Analysis: An Introduction, 2nd ed.; Springer: Berlin, Germany, 1993. [Google Scholar]
- FAO. State of the World’s Forests 2001; Food and Agriculture Organization: Rome, Italy, 2001. [Google Scholar]
- Yamamoto, Y.; Takeuchi, K. Estimating the break-even price for forest protection in Central Kalimantan. Environ. Econ. Policy Stud. 2012, 14, 289–301. [Google Scholar] [CrossRef] [Green Version]
- Puyravaud, J.P. Standardizing the calculation of the annual rate of deforestation. For. Ecol. Manag. 2003, 177, 593–596. [Google Scholar] [CrossRef]
- IPCC. Agriculture, forestry and other land use. In IPCC Guidelines for National Greenhouse Gas Inventories, Prepared by the National Greenhouse Gas Inventories Programme; Eggleston, H.S., Buendia, L., Miwa, K., Ngara, T., Tanabe, K., Eds.; Institute for Global Environmental Strategies (IGES): Kanagawa, Japan, 2006. [Google Scholar]
- Ramankutty, N.; Gibbs, H.K.; Achard, F.; DeFries, R.S.; Foley, J.A.; Houghton, R.A. Challenges to estimating carbon emissions from tropical deforestation. Glob. Chang. Biol. 2007, 13, 51–66. [Google Scholar] [CrossRef]
- Rahajoe, J. Managing Ecosystems Services in Asia: A Critical Review of Experiences. Final Report (ARCP2009–06CMY-Braimoh) for APN Project. Japan, 2009. Available online: https://www.apn-gcr.org/resources/items/show/1557 (accessed on 1 July 2020).
- Wauters, J.; Coudert, S.; Grallien, E.; Jonard, M.; Ponette, Q. Carbon stock in rubber tree plantations in Western Ghana and Mato Grosso (Brazil). For. Ecol. Manag. 2008, 255, 2347–2361. [Google Scholar] [CrossRef]
- Khasanah, N.; Noordwijk, M.V.; Ningsih, H. Aboveground carbon stocks in oil palm plantations and the threshold for carbon-neutral vegetation conversion on mineral soils. Congent Environ. Sci. 2015, 1, 1119964. [Google Scholar] [CrossRef]
- Jorgensen, S.E. Fundamental of Ecological Modellnig; Elsevier: Amsterdam, The Netherlands, 1994. [Google Scholar]
- Grieg-Gran, M. The Cost of Avoiding Deforestation: The Report Prepared for the Stern Review of the Economics of Climate Change; International Institute for Environment and Development: London, UK, 2008. [Google Scholar]
- Wilson, K.A.; Pressey, R.L.; Newton, A.C.; Burgman, M.A.; Possingham, H.P.; Weston, C.J. Measuring and incorporating vulnerability into conservation planning. Environ. Manag. 2005, 35, 527–543. [Google Scholar] [CrossRef] [PubMed]
- Feintrenie, L.; Chong, W.; Levang, P. Why do farmers prefer oil palm? Lessons learnt from Bungo district, Indonesia. Small Scale. For. 2010, 9, 379–396. [Google Scholar] [CrossRef]
- Investing in Oil Palm: An Analysis of Independent Smallholder Oil Palm Adoption in Sumatra, Indonesia. Available online: http://www.worldagroforestry.org (accessed on 5 July 2012).
- Silva, F.F.; Perrin, R.K.; Fulginiti, L.E. The opportunity cost of preserving the Brazilian Amazon forest. Agric. Econ. 2019, 50, 219–227. [Google Scholar] [CrossRef]
- Brofeldt, S.; Theilade, I.; Burgess, N.D.; Danielsen, F.; Poulsen, M.K.; Adrian, T.; Bang, T.N.; Budiman, A.; Jensen, J.; Jensen, A.E.; et al. Community monitoring of carbon stocks for REDD+: Does accuracy and cost change over time? Forests 2014, 5, 1834–1854. [Google Scholar] [CrossRef] [Green Version]
- Thuy, P.T.; Moeliono, M.; Locatelli, B.; Brockhaus, M.; Gregorio, M.D.; Mardiah, S. Integration of adaptation and mitigation in climate change and forest policies in Indonesia and Vietnam. Forests 2014, 5, 2016–2036. [Google Scholar] [CrossRef] [Green Version]
- Fujisaki, T.; Hyakumura, K.; Scheyvens, H.; Cadman, T. Does REDD+ ensure sectoral coordination and stakeholder participation? A comparative analysis of REDD+ national governance structures in countries of Asia-Pacific region. Forests 2016, 7, 195. [Google Scholar] [CrossRef] [Green Version]
- Jeon, S.; Sarker, P.K.; Giessen, L. The forest policies of Asean and Montréal process: Comparing highly and weakly formalized regional regimes. Forests 2019, 10, 929. [Google Scholar] [CrossRef] [Green Version]
- Carlson, K.M.; Curran, L.M.; Asner, G.P.; Pittman, A.M.; Trigg, S.N.; Adeney, J.M. Carbon emissions from forest conversion by Kalimantan oil palm plantations. Nat. Clim. Chang. 2013, 3, 283–287. [Google Scholar] [CrossRef]
- Neudert, R.; Olschofsky, K.; Kübler, D.; Prill, L.; Köhl, M.; Wätzold, F. Opportunity costs of conserving a dry tropical forest under REDD+: The case of the spiny dry forest in southwestern Madagascar. For. Policy Econ. 2018, 95, 102–114. [Google Scholar] [CrossRef]
- Gronau, S.; Winter, E.; Grote, U. Papyrus, forest resources and rural livelihoods: A village computable general equilibrium analysis from Northern Zambia. Nat. Resour. 2018, 9, 268–296. [Google Scholar] [CrossRef] [Green Version]
- West, T.A.P.; Grogan, K.A.; Swisher, M.E.; Caviglia-Harris, J.L.; Sills, E.; Harris, D.; Roberts, D.; Putz, F.E. A hybrid optimization-agent-based model of REDD+ payments to households on an old deforestation frontier in the Brazilian Amazon. Environ. Model. Softw. 2018, 100, 159–174. [Google Scholar] [CrossRef]
- Ickowitz, A.; Sills, E.; de Sassi, C. Estimating smallholder opportunity costs of REDD+: A pantropical analysis from households to carbon and back. World Dev. 2017, 95, 15–26. [Google Scholar] [CrossRef]
- Nakajima, T.; Shiraishi, N.; Kanomata, H.; Matsumoto, M. Development and analysis of an opportunity cost simulation accounting for the spatial distributions of local forest management. Ann. For. Res. 2017, 60, 145–159. [Google Scholar] [CrossRef] [Green Version]
- Merger, E.; Dutschke, M.; Verchot, L. Options for REDD+ voluntary certification to ensure net GHG benefits, poverty alleviation, sustainable management of forests and biodiversity conservation. Forests 2011, 2, 550–577. [Google Scholar] [CrossRef] [Green Version]
- Mulyani, M.; Jepson, P. Does the ‘One map initiative’ represent a new path for forest mapping in Indonesia? Assessing the contribution of the REDD+ initiative in effecting forest governance reform. Forests 2017, 8, 14. [Google Scholar] [CrossRef] [Green Version]
- Sunderlin, W.D.; De Sassi, C.; Ekaputri, A.D.; Light, M.; Pratama, C.D. REDD+ contribution to well-being and income is marginal: The perspective of local stakeholders. Forests 2017, 8, 125. [Google Scholar] [CrossRef] [Green Version]
- IMF Primary Commodity Prices. Available online: http://www.imf.org/external/np/res/commod/index.asp (accessed on 19 April 2020).
- Butler, R.; Koh, L.P.; Ghazoul, J. REDD in the red: Palm oil could undermine carbon payment schemes. Conserv. Lett. 2009, 2, 67–73. [Google Scholar] [CrossRef]
- The Cost of Avoiding Deforestation Update of the Report prepared for the Stern Review of the Economics of Climate Change. Available online: https://digital.library.unt.edu/ark:/67531/metadc13712/ (accessed on 18 April 2020).
- The Costs of REDD: Lessons from Amazonas. Available online: http://www.iied.org (accessed on 19 April 2020).
- Venter, O.; Meijaard, E.; Possingham, H.P.; Dennis, R.; Sheil, D.; Wich, S.A.; Hovani, L.; Wilson, K.A. Carbon payments as a safeguard for threatened tropical mammals. Conserv. Lett. 2009, 2, 123–129. [Google Scholar] [CrossRef]
Figure 1.
(a) Deforestation map, (b) land use map, and (c) topography in the study area.

Figure 2.
In both color and height, three-dimensional graphs display subtle variations of carbon emissions by predicting future land use changes under two scenarios: (1) Scenario A: without consideration of carbon sequestration in plantations, and (2) Scenario B: with consideration of carbon sequestration in plantations. X axes represent longitude, Y axes represent latitude, and Z axes represent carbon emissions from deforestation (unit: tonne CO2) in study area of total 47.9 thousand hectares.

Figure 3.
Net revenues for oil palm, rubber, rice, and forestry in the study area in twenty-five years under the business-as-usual (BAU) simulations.
Figure 3.
Net revenues for oil palm, rubber, rice, and forestry in the study area in twenty-five years under the business-as-usual (BAU) simulations.

Figure 4.
Opportunity costs (OC) from different sources.

Figure 5.
Sensitivity analysis of social discount rate to OC under two scenarios: (1) Scenario A: without consideration of carbon sequestration in plantations, and (2) Scenario B: with consideration of carbon sequestration in plantations.
Figure 5.
Sensitivity analysis of social discount rate to OC under two scenarios: (1) Scenario A: without consideration of carbon sequestration in plantations, and (2) Scenario B: with consideration of carbon sequestration in plantations.

Figure 6.
Sensitivity analysis of plantation area to OC under two scenarios: (1) Scenario A: without consideration of carbon sequestration in plantations, and (2) Scenario B: with consideration of carbon sequestration in plantations.
Figure 6.
Sensitivity analysis of plantation area to OC under two scenarios: (1) Scenario A: without consideration of carbon sequestration in plantations, and (2) Scenario B: with consideration of carbon sequestration in plantations.

© 2020 by the authors. Licensee MDPI, Basel, Switzerland. This article is an open access article distributed under the terms and conditions of the Creative Commons Attribution (CC BY) license (http://creativecommons.org/licenses/by/4.0/).
Share and Cite
MDPI and ACS Style
Liu, G.; Liu, Q.; Song, M.; Chen, J.; Zhang, C.; Meng, X.; Zhao, J.; Lu, H. Costs and Carbon Sequestration Assessment for REDD+ in Indonesia. Forests 2020, 11, 770. https://0-doi-org.brum.beds.ac.uk/10.3390/f11070770
AMA Style
Liu G, Liu Q, Song M, Chen J, Zhang C, Meng X, Zhao J, Lu H. Costs and Carbon Sequestration Assessment for REDD+ in Indonesia. Forests. 2020; 11(7):770. https://0-doi-org.brum.beds.ac.uk/10.3390/f11070770
Chicago/Turabian StyleLiu, Guifang, Qing Liu, Mengxiao Song, Junsheng Chen, Chuanrong Zhang, Xing Meng, Jincai Zhao, and Heli Lu. 2020. "Costs and Carbon Sequestration Assessment for REDD+ in Indonesia" Forests 11, no. 7: 770. https://0-doi-org.brum.beds.ac.uk/10.3390/f11070770
Note that from the first issue of 2016, this journal uses article numbers instead of page numbers. See further details here.