Article

Does Juvenile Stand Management Matter? Regional Scenarios of the Long-Term Effects on Wood Production

1
Natural Resources Institute Finland (Luke), Latokartanonkaari 9, FI-0079 Helsinki, Finland
2
Natural Resources Institute Finland (Luke), Paavo Havaksen tie 3, FI-90570 Oulu, Finland
3
Natural Resources Institute Finland (Luke), Ounasjoentie 6, FI-96200 Rovaniemi, Finland
4
Natural Resources Institute Finland (Luke), Yliopistokatu 6, FI-80100 Joensuu, Finland
*
Author to whom correspondence should be addressed.
Submission received: 4 December 2020 / Revised: 11 January 2021 / Accepted: 12 January 2021 / Published: 14 January 2021
(This article belongs to the Section Forest Ecology and Management)

Abstract

:
We analysed the regional level effects of juvenile stand management (early cleaning and precommercial thinning), shortly termed tending on wood production and the profitability of forest management. Altogether ca. 0.4 million hectares of juvenile stands from two significant forestry regions of Finland, South and North Savo, were examined. We used plot-level data of the 11th National Forest Inventory to represent the current status of juvenile stands in the study area, and the Motti stand simulator to predict the future developments of those stands for the next 100 years. We applied three scenarios: (i) Timely tending, (ii) delayed tending, and (iii) no tending, to examine differences between these alternative levels of juvenile stand management. The results showed the benefits of tending at a regional level. Timely tending was the most profitable option when low or modest interest rates (2–3%) were applied in the assessment. Even a short delay in tending clearly increased the tending costs. Delaying and neglecting tending resulted in significant losses, especially in sawlog removals and stumpage earnings. The financial gain from tending was the highest on fertile sites. Due to the high growth rate of trees, the situation may change very quickly on such sites. For the operational forestry, this means that fertile sites should have a high priority when conducting timely tendings.

1. Introduction

There has been an upward trend in the forest growth over several decades in Nordic forests. For example, in Finland, the annual increment of growing stock has recently reached ca. 110 million cubic meters, which is nearly double compared to the level in the 1950s [1]. Despite this, the concern about the sustainable availability of pulpwood and high-quality timber for industry has been raised. This is due to the increasing demands of wood-based raw material after recent, large-scale investments by the Finnish forest industry [1,2]. At the same time, the importance of forests on carbon sequestration and maintaining biodiversity are emphasized. This means that the forests should be managed so that, in addition to wood production, they provide a wide range of other ecosystem services as well. To get more high-quality timber to the markets, particular attention needs to be put to the management of young stands (e.g., [3]).
In Finland, forests are mainly managed by small forest stands according to even-aged stand management from regeneration to the final cutting (i.e., rotation forestry). Most of the stands are regenerated for Scots pine (Pinus sylvestris L., henceforth pine) or Norway spruce (Picea abies (L.) Karst., henceforth spruce), and only a small proportion for silver birch (Betula pendula Roth.) or other tree species. At the juvenile stand stage, stands are generally managed once or twice in order to provide favourable growth conditions to regenerated tree species. Juvenile stand management, shortly termed tending, includes two separate silvicultural treatments: Early cleaning and precommercial thinning. In newly regenerated stands, abundant fast-growing broadleaves create a need for early cleaning to control competition. Furthermore, in subsequent years, precommercial thinning is generally needed to control the overall structure and stem density in a stand [4]. The recommendations for the appropriate timing and intensity for tending are given in silvicultural guidelines [5]. For example, in spruce stand, early cleaning is recommended to be done when the stand reaches one meter in height. Later, when the height is 3–5 m, the stand is recommended to be thinned to the density of 1600–2200 stems per hectare.
Tending affects several ways on the development of trees and stands. Removing undesired broadleaves and other competing vegetation from young stand increases the growth of the released trees and enhances the yield of commercial timber [6,7,8,9]. Controlling stand density by thinning, in turn, accelerates the diameter and volume increment of the stems and enhances the development of the crowns, although thinning is known to reduce total yield [10,11]. Due to the enlarged growing space, tree branches grow thicker and longer, and crown recession slows down [12,13]. On the other hand, especially for pine, keeping the stand density longer at a relatively high level may have positive impacts on stem quality, enabling thin branches and good stem form [14].
Positive impacts of tending include improved profitability of forest management in the long term [3,15]. Currently in Finland, however, tending is conducted in much smaller areas than deemed necessary. According to the 11th National forest inventory (NFI11), from the silvicultural point of view, there is an urgent need for tending in at least 700,000 ha (ca. 18% of seedling stands) and a need for tending in the next few years in 1 million ha [16]. In the study region, Savo, the corresponding numbers are ca. 130,000 ha and 190,000 ha, respectively [16]. The financial motivation of forest owners to conduct pre-commercial silvicultural operations is challenging due to the associated immediate high costs and far-off benefits (i.e., long payback period). In particular, the costs of tending and clearing operations have been increasing [17,18].
The realized benefits of tending depend on the manner the tending is implemented. Timing and intensity of precommercial thinning affect the yield and quality development of young stands, e.g., the timing and profitability of the first commercial thinning [4,19]. In practice, however, broadleaves competing with the conifers are often removed too late to get the most benefit from the work [20,21]. Timing impacts directly on the working costs. The cost of precommercial thinning increases rapidly over time, due to the fast growth of the undesired trees and sprouts. According to Kaila et al. [22], a two-year delay can increase the cost by 8–42%. In addition, the availability of labour can be a restricting factor due to the high seasonality of silvicultural work. Thus, there is an obvious need to improve practices to reduce the costs of tending and, on the other hand, to demonstrate the effects of tending on the future incomes for forest owners and the consequential impacts on society.
The stand-level effects of tending have been extensively studied in Nordic countries (e.g., [14,15,19,21,23,24]), whereas large-scale results are sparse to support decision-making in forest management planning and forest policy making. Recently, Huuskonen et al. [3] studied the benefits of juvenile stand management in a nationwide study. Still, there is an increasing demand for analyses at the regional level. For this study, we selected Savo as a study area. The area encompasses the south Savo and north Savo regions, two of the current 19 regions in Finland. These two regions play a vital role in forest biomass production in Finland, because of their forest structures and wood export volumes (e.g., [25]). For example, in the year 2018 the Savo regions shared about 21% of total harvesting supply in Finland [26].
Huuskonen et al. [3] emphasized the general gain of tending. In the study at hand, we sharpened the examination to the timing of treatments. In addition, Huuskonen et al. [3] reported the differences between larger climatic regions (i.e., southern, central, and northern Finland) in the benefits of tending, whereas in our regional level study, the differences between site fertility levels were examined.
The objective of the study was to analyse the effects of tending at the regional level on forest growth, total wood production by timber assortments, and on the profitability of forest management. The NFI11-data were applied from the selected study area representing the current status of juvenile stands in Savo. We used scenario analysis based on the simulated development of stands and examined the differences between three management alternatives for juvenile stands: Timely tending, delayed tending, and no tending.

2. Materials and Methods
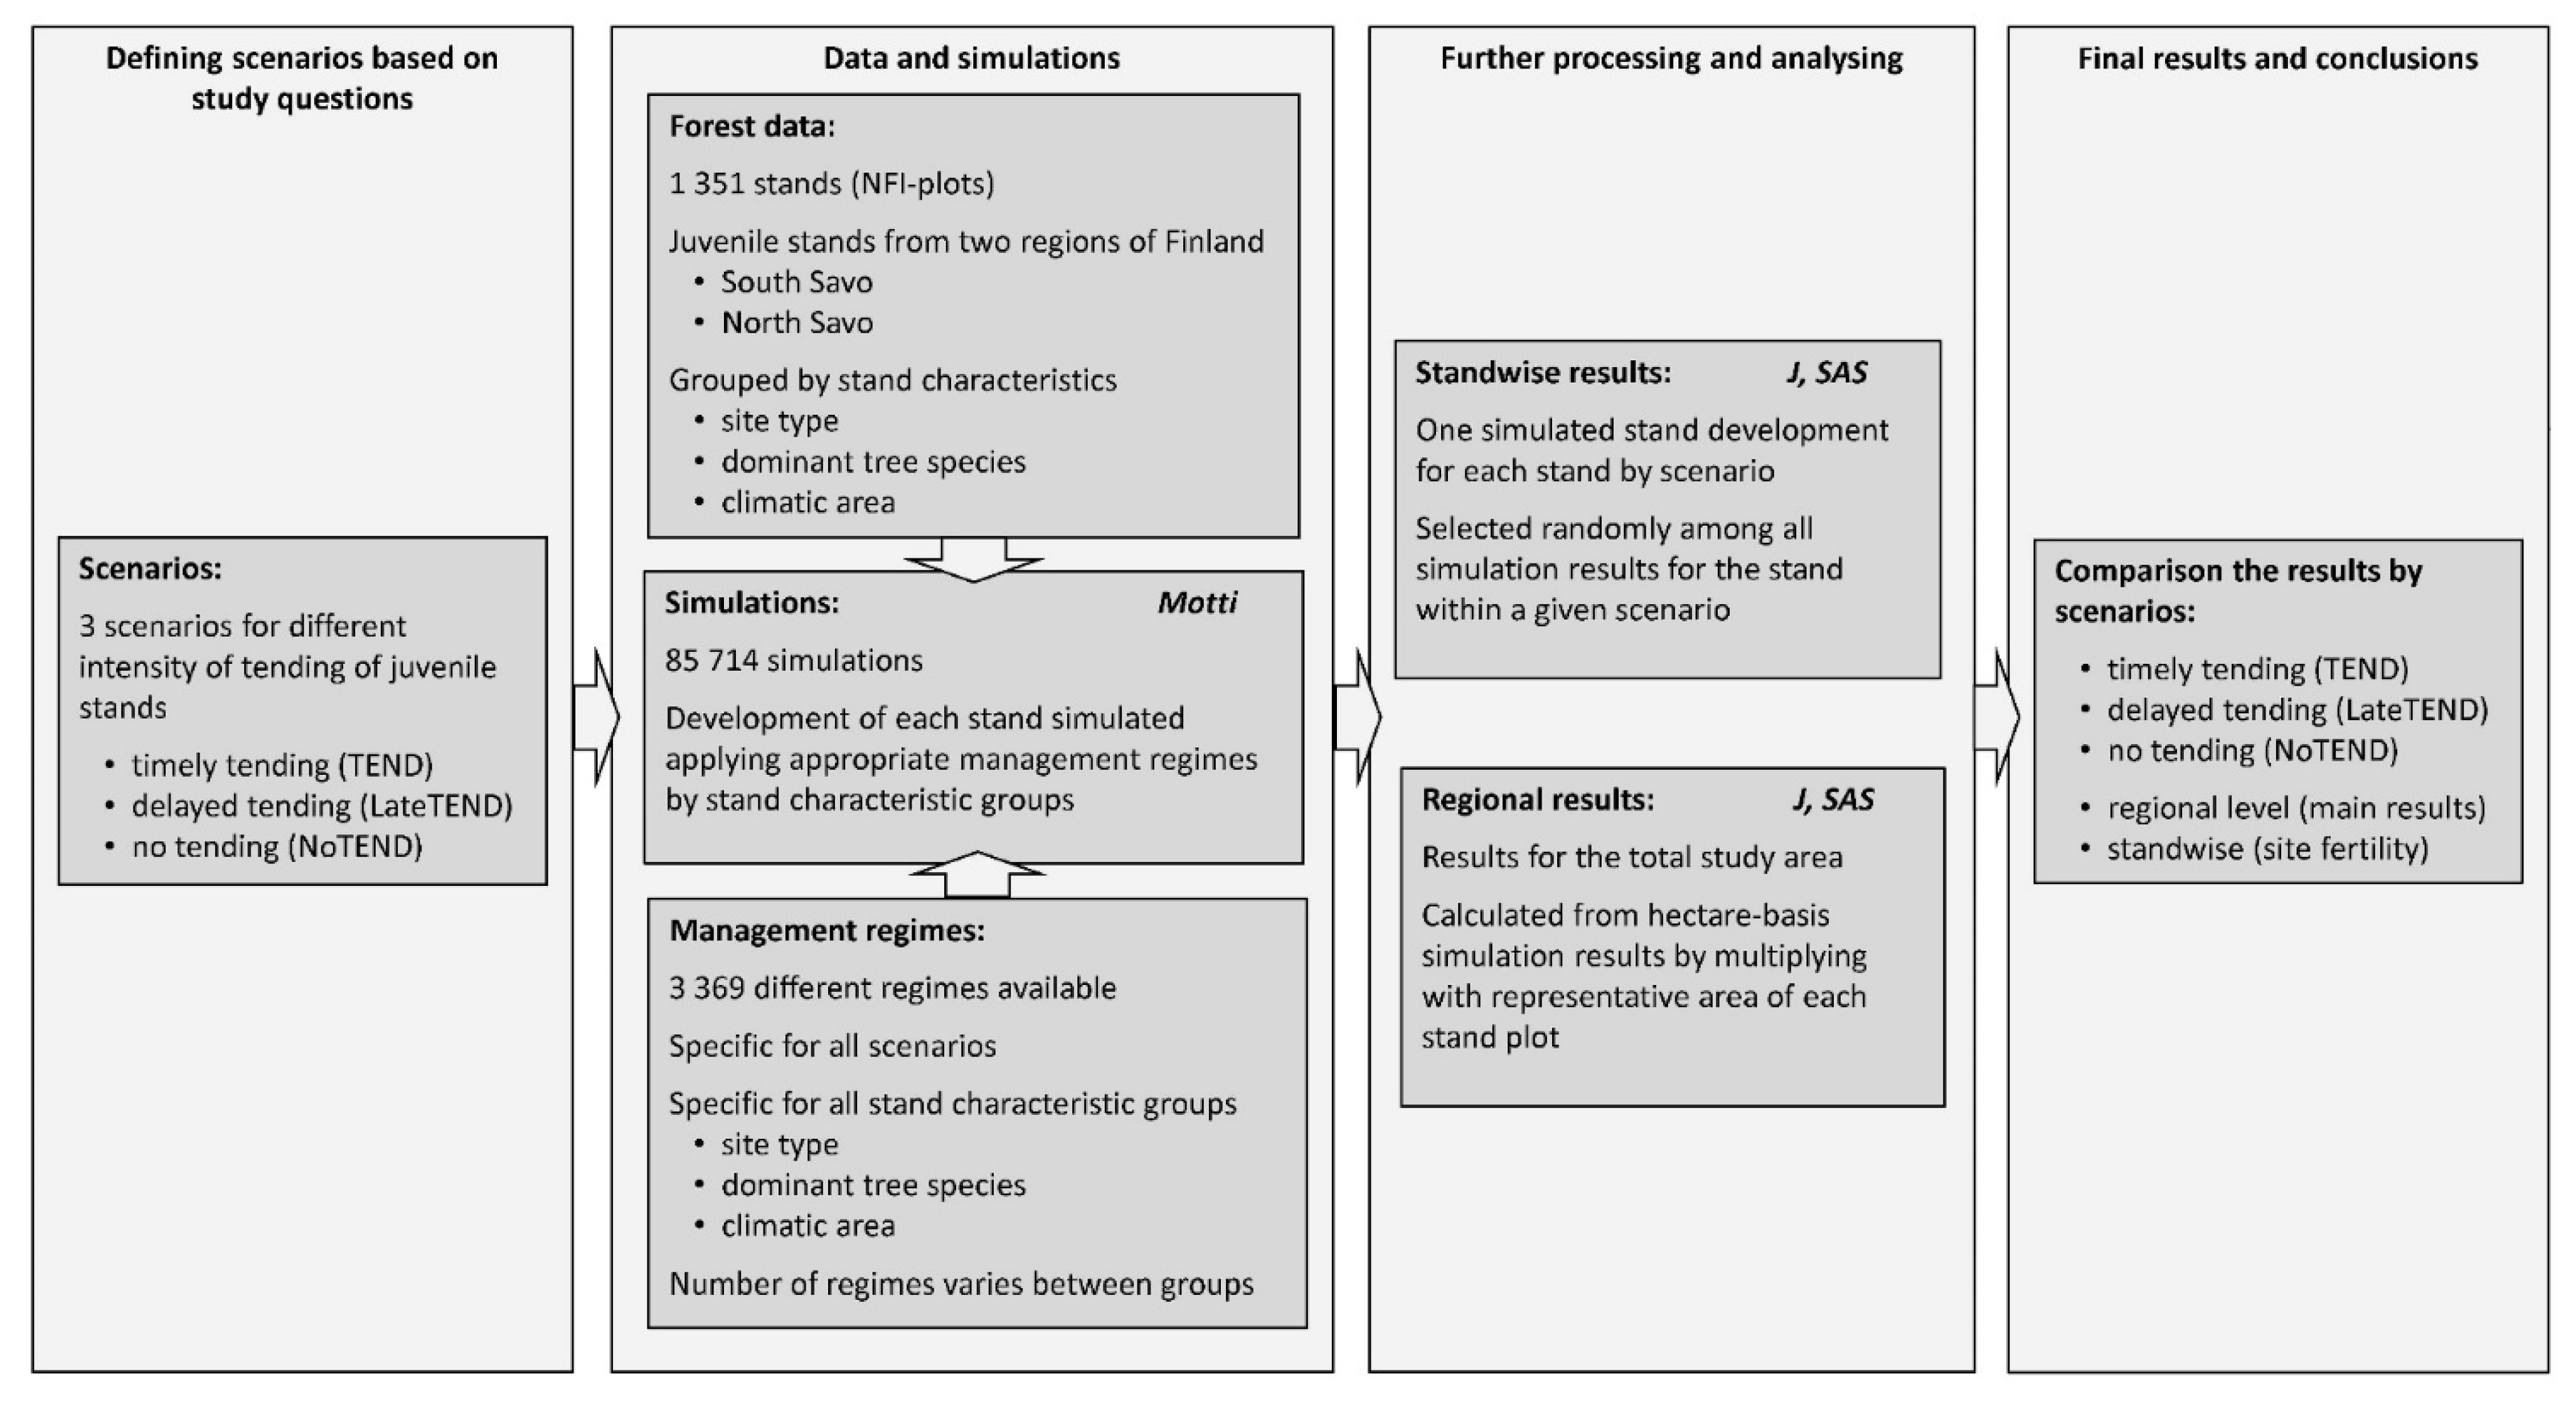
2.1. Scenarios

In order to describe the long-term effects of tending on wood-production potential, we compiled three different scenarios representing different management strategies: Timely tending (scenario TEND), delayed tending (LateTEND), and no tending (NoTEND) (Figure 1). The first two scenarios, TEND and LateTEND, included tending treatments as early cleaning and precommercial thinning. In TEND, both treatments were applied on time (timing according to silvicultural guidelines, based on the mean height of the dominant tree species), whereas in LateTEND only precommercial thinning was applied, but executed notably later (in 1.5 m higher stand) than in TEND. In the third scenario, NoTEND, neither early cleaning nor precommercial thinning was conducted. After the first commercial thinning stage, management regimes recommended in the silvicultural guidelines [5] were applied for all the three scenarios.

2.2. Forest Data

To get a representative basis for the simulations, we obtained the NFI11-data [16] covering the regions of South Savo and North Savo (henceforth referred as Savo) (Figure 1 and Figure 2). Then, we selected the juvenile stands locating on productive forest land (i.e., annual increment of growing stock over the rotation >1 m3 ha−1) available for wood production, and having a maximum stand mean height of 3.5 m for spruce, and 5 m for both pine and broadleaved dominated stands (according to dominant tree species). The height criteria were applied to include only juvenile stands where precommercial thinning would normally be a standard management option. We excluded clearcut areas, which were not yet regenerated, as well as the juvenile stands with an overstorey.
The final forest data comprised of 1351 plots, representing a total area of 0.39 million ha (Figure 1, Table 1). Site fertility variated from the most fertile (class 1) to barren sites (class 6) on mineral soils and drained peatlands (Table 1). Due to the small proportion of peatland sites (13%), we reported only the combined results for peatland and mineral soil sites. Dominant tree species were pine, spruce, and birch species (silver birch on mineral soils, and downy birch (Betula pubescens Ehrh.) on drained peatlands). Fertile sites are mainly dominated by spruce and the poorer sites by pine (Table 1). Based on the stands’ locations in the study area, they represented one of the three climatic areas: <1000 d.d. (degree days), 1000–1200 d.d., >1200 d.d., according to the cumulative annual temperature sum with a +5 °C threshold value. The major part (70%) of our study area represented the climatic area of 1000–1200 d.d., whereas ca. 30% represented the higher temperature sums and only a couple of stands located in the area of lower temperature sums. Together, the classes of site fertility, dominant tree species, and climatic area formed stand characteristic groups, where each stand can be fitted and, for which the specific management regimes were defined.

2.3. Management Regimes

All the simulated management practices of a stand over a rotation were arranged as management regimes (Figure 1). We constructed tailored sets of alternative management regimes for each scenario and for different types of stands. By scenarios, management regimes included different kinds of treatments for the juvenile stands (timely tending, delayed tending, and no tending). Within the scenarios, management regimes varied according to stand characteristic groups based on site fertility, dominant tree species, and climatic area, and included successive silvicultural treatments and cuttings as suggested in silvicultural guidelines [5]. Since the guidelines include recommended range of intensity and timing of activities, several alternative management regimes were usually available for one stand characteristic group. As a result, 3369 specific management regimes were available for simulations (Figure 1). Examples of the regimes are shown in Table 2.

2.4. Simulations

We used the Motti stand simulator to predict the development of each stand according to alternative management regimes (Figure 1; Table 2). Using Motti, we were able to utilize a large and complex set of models to predict the natural dynamics as well as the effects of silvicultural treatments on stand dynamics [30]. Motti includes both stand- and tree-level growth and yield models for stand dynamics (regeneration, growth, and mortality), separately for mineral soil and drained peatland stands (e.g., [30,31,32,33]). The technical design of Motti is described by Salminen et al. [34].
The simulation period was 100 years. When the stand reached regeneration maturity (defined by stand mean diameter) before the simulation period ended, final cut was simulated, followed by forest regeneration according to the particular management regime. The number of simulations depended on the number of stands in the stand characteristic groups and the number of corresponding management regimes available for each group. For the stands of this study, we simulated altogether 85,714 stand developments (Figure 1, Table 2).

2.5. Details of Treatments Applied in Simulations

In the TEND scenario, early cleaning and precommercial thinning were simulated as suggested in silvicultural guidelines [5]. The timing of tending treatments was based on stand dominant height (early cleaning ca. 1 m, precommercial thinning from 3.5 m to 5.5 m depending on site and tree species). Early cleaning was typically applied at a stand age of 4 to 6 years and precommercial thinning at the age from 10 to 15 years. Depending on site, tree species, and regeneration method, the number of seedlings after early cleaning was 3000–4000 trees per hectare. All seedlings considered as potential crop trees were left in early cleaning. In seedling stands, the models also predict the natural establishment of seedlings in addition to artificially regenerated seedlings. When early cleaning is applied in simulation, the opening of the growing space triggers an immediate emergence of new seedlings to the site [32].
After precommercial thinning, the stem number was 2000–2400 stems per hectare for pine and 1800–2200 stems per hectare for spruce. For birch, the stem number was 1600–1800 and 2000–2200 stems per hectare on mineral soils and peatlands, respectively. For the biodiversity aspect, stem numbers included a small proportion of broadleaved trees in coniferous stands. In the LateTEND scenario, early cleaning was not carried out, but precommercial thinning was carried out when the stand dominant height was from 5.0 m to 7.0 m to the same densities as in TEND (Table 2). No tending was simulated in the NoTEND scenario.
The first commercial thinnings were simulated when the stands reached the predefined dominant height level depending on site type, tree species, and the climatic area. In dense stands (i.e., stem number more than 2600 per hectare), clearing of the thinning area was applied before the first commercial thinning. Quality thinning or thinning from below was used. The stem number after the first commercial thinning was set as 700–1100 stems per hectare depending on site and tree species. In the NoTEND scenario, stand density after thinning was slightly higher (100 stems per ha) than in the TEND and LateTEND scenarios to reduce the risk for wind and snow damage. In addition to pulpwood and sawlogs, the tree tops and stems smaller than pulpwood size were collected as delimbed energy wood in the first commercial thinning of LateTEND and NoTEND.
Thereafter, similar management were applied for all the scenarios. Intermediate thinnings were timed according to the stand basal area and dominant height as suggested in the thinning guidelines. Thinning from below was used. The timing of final cuttings was based on the stand mean diameter varying by site type, tree species, and climatic area. Four alternative thresholds with 2–3 cm intervals around recommended mean diameters for final cuttings were used. The method of site preparation and forest regeneration varied according to site type. For fertile sites, planting was applied (mainly for spruce and birch). For pine, seeding or natural regeneration was applied depending on the site type. Genetically improved regeneration material was also alternatively available in artificial regeneration for pine on mineral soil sites. Ditch network maintenance was included in the management regimes on peatlands.
In intermediate thinnings and final cuttings, the harvesting method was conventional pulpwood and sawlog harvesting. In all cuttings, logging of the stems was based on the rules that are widely used in Finland. For the simulated sawlog volumes, a tree-level reduction function was used to model the effect of large branches, forking, sweep, and other defects on the stems [35].

2.6. Unit Prices, Cost Factors, and Costs

The costs of silvicultural treatments were defined by time consumption models integrated in Motti and the unit costs (long-term mean values) from statistics (Table 3). In the time consumption models for early cleaning, precommercial thinning, and clearing of the thinning area, it was assumed that the work was done manually with a clearing saw. The time consumption models for early cleaning and precommercial thinning was based on the number and size (mean stump diameter and height) of removed trees. The time used for clearing was also based on stem number, height, and size, but obtained in four classes from easy to very difficult. In regeneration, planting was assumed to be carried out manually. Material costs were included in the planting and seeding costs. For harvesting revenues, stumpage prices by tree species and felling methods were used (Table 3). Both prices and costs were based on statistics from the years 2002 to 2016 [17,36]. The nominal time series were deflated by the cost-of-living index to the year 2016 [37]. The net present values (NPV) were calculated with real interest rates (i.e., net of inflation) from 2% to 5%.

2.7. Processing of Simulation Results

For further analysing and up-scaling results to the regional level we used software J [28] and SAS [27]. First, for each scenario (TEND, LateTEND, and NoTEND), we randomly selected one simulated stand development for each stand among all the simulated alternatives for that stand within a given scenario (Figure 1). Technically, random selection was carried out with a linear programming software J applying the procedure documented by Huuskonen et al. [3]. The applied procedure guaranteed that all simulated alternatives for the stand had an equal probability to be selected. As a sensitivity analysis, we separately tested the effect of this randomizing procedure on the results.
Secondly, we scaled the stand-level results up to the regional level applying the representative area of each NFI-plot. Software J was also used in this step producing the results for the total study area including all variables examined. In general, the calculation procedures were similar to those applied in Huuskonen et al. [3].

3. Results

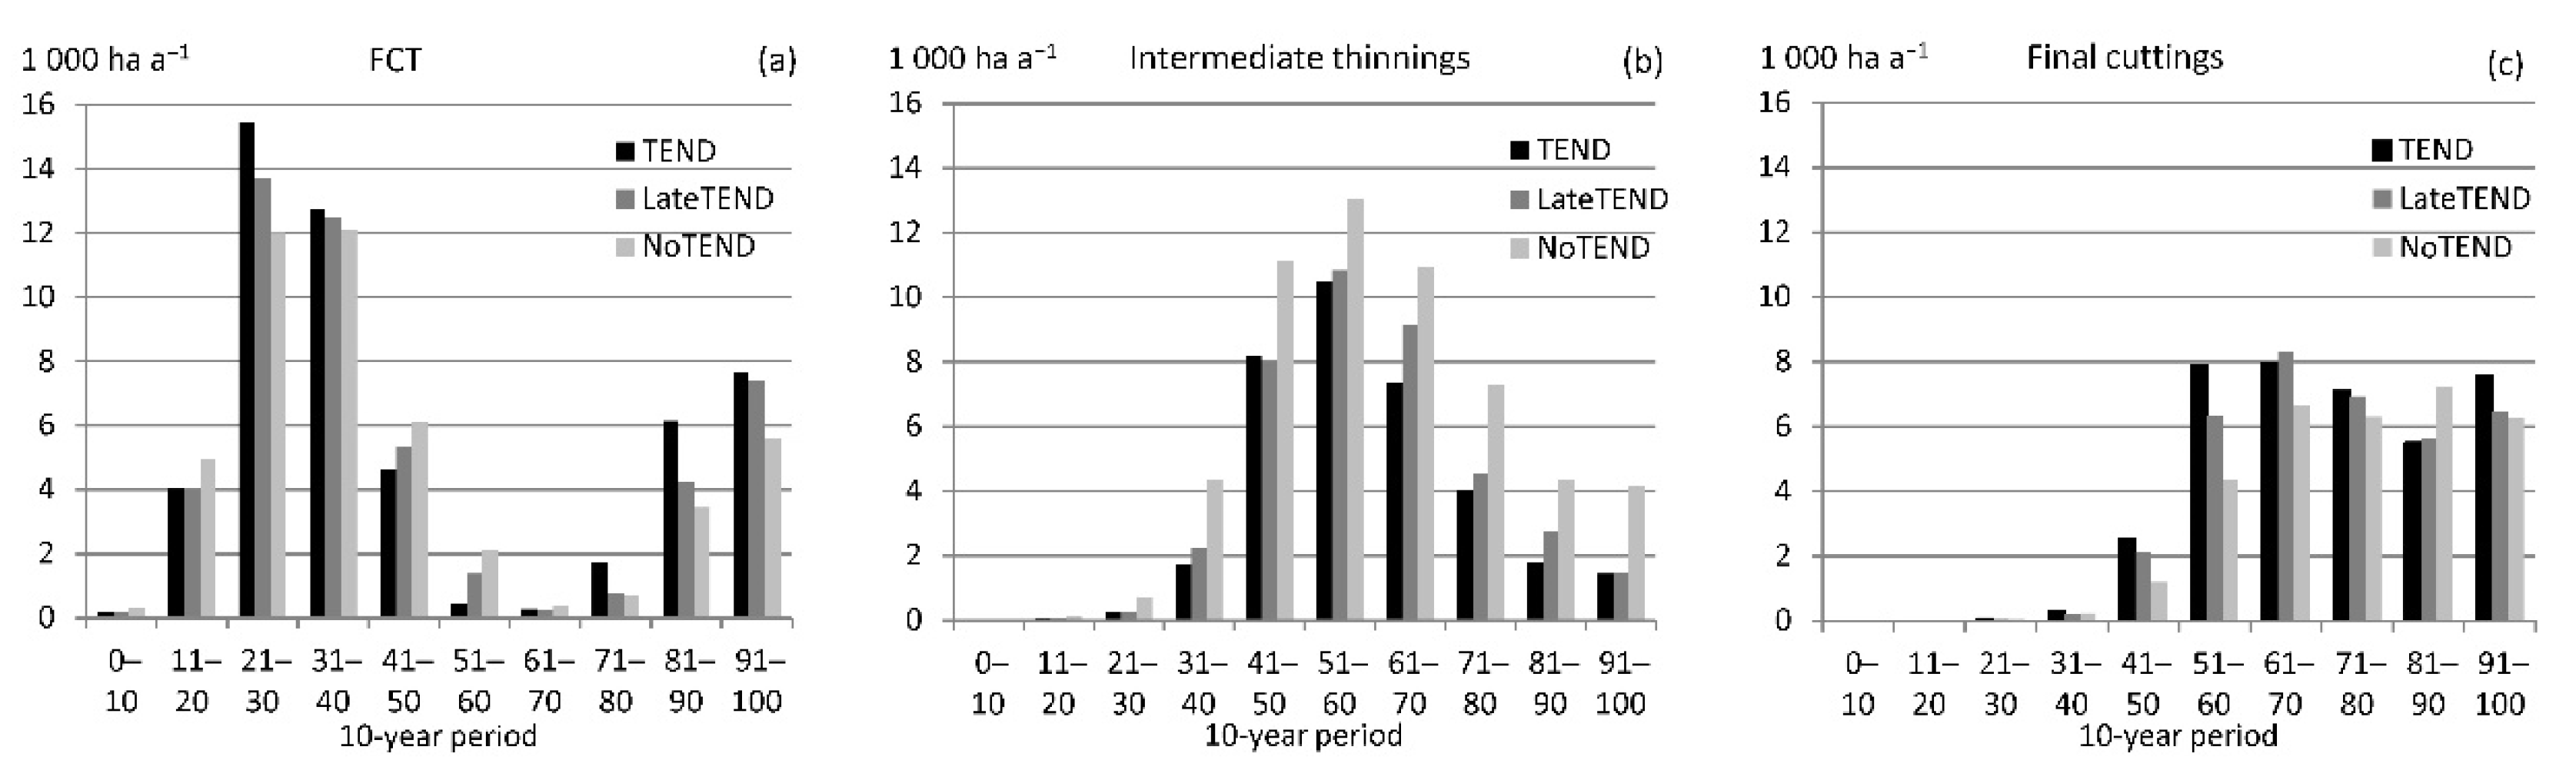
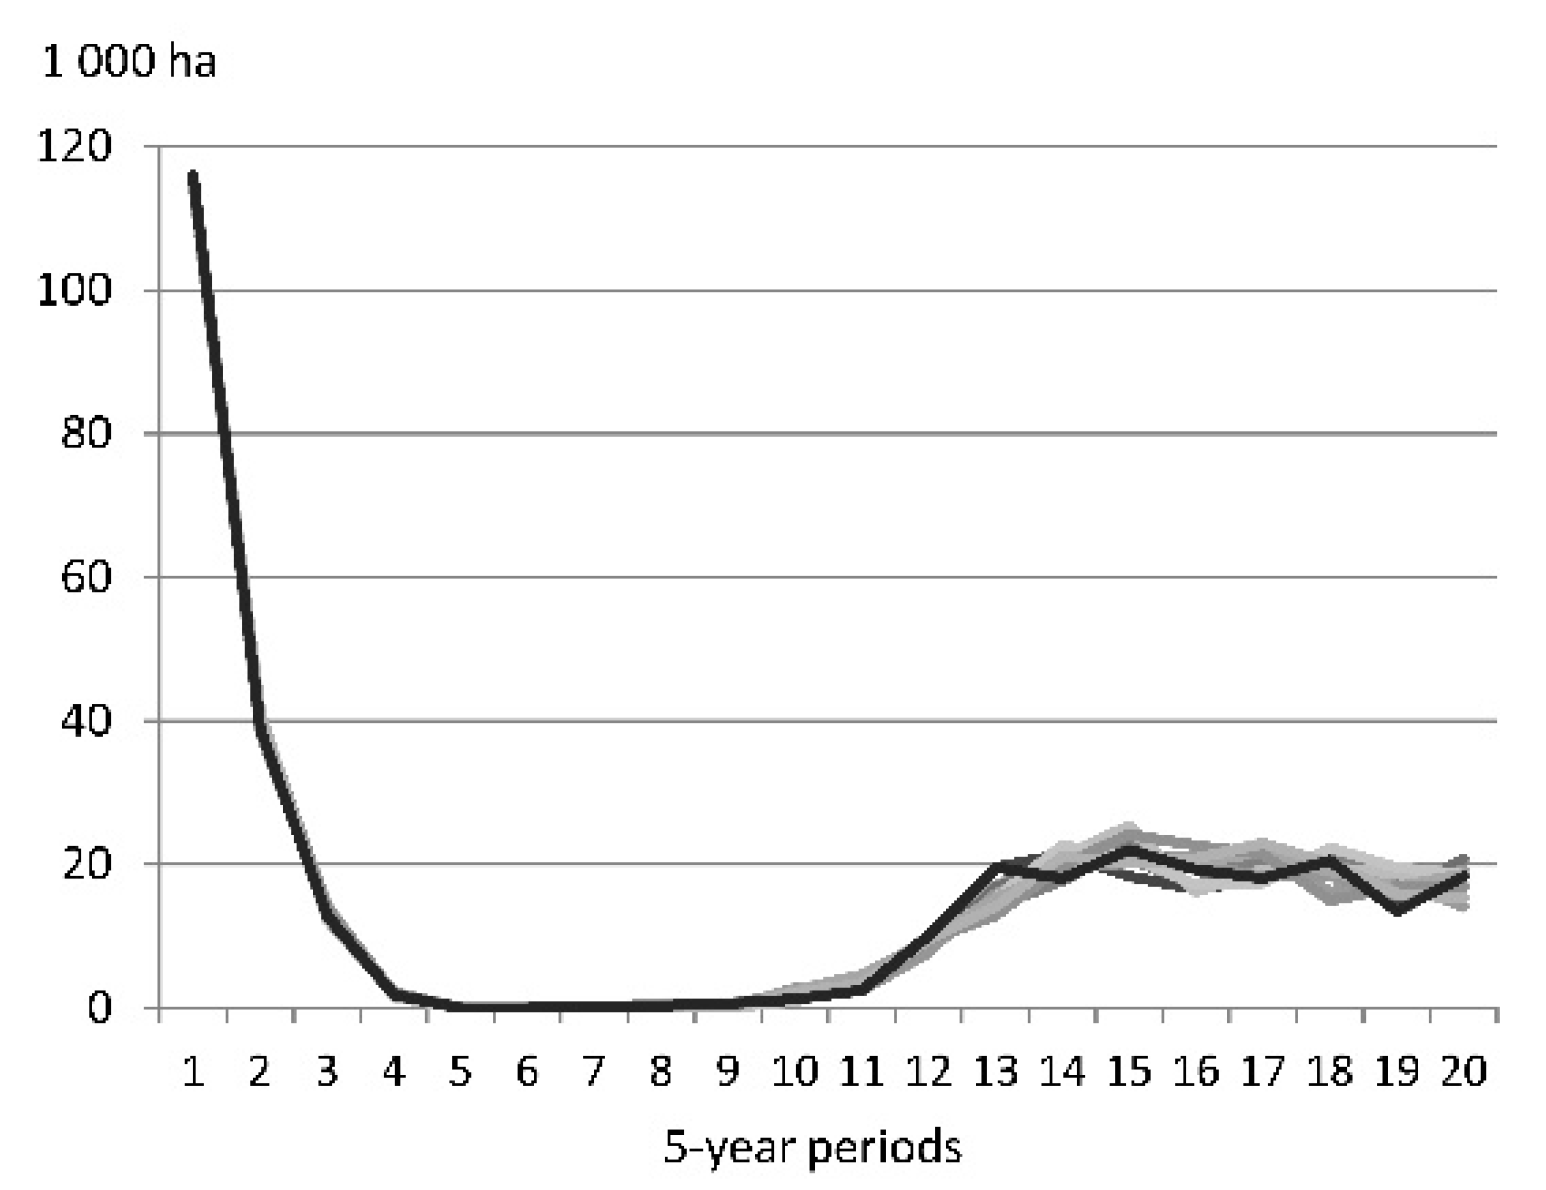
3.1. Treatment Areas
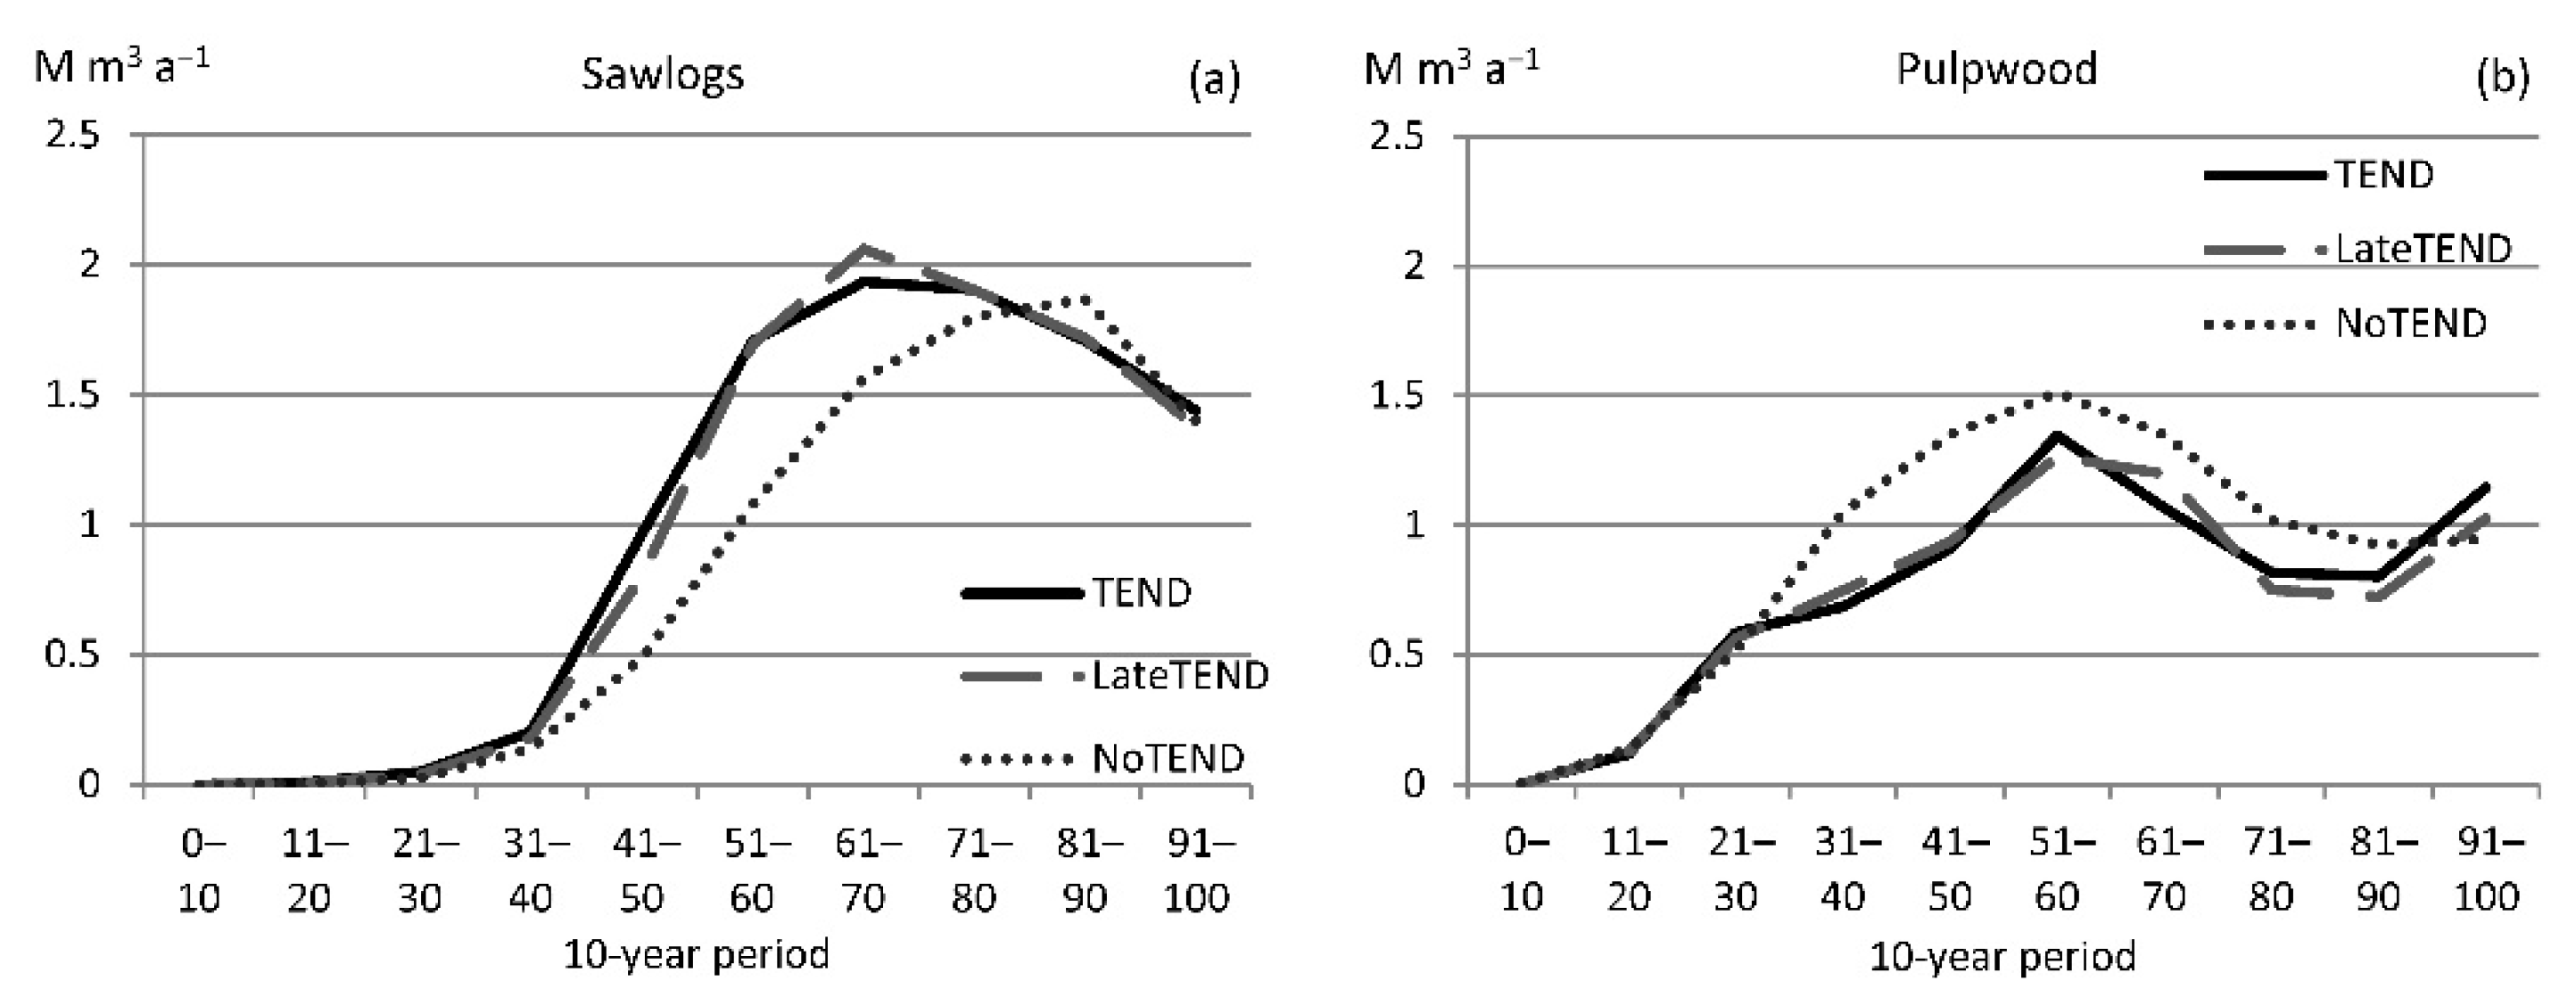
Average annual tending areas were the largest in the TEND scenario (Figure 3). There were two reasons for that. Firstly, early cleanings and precommercial thinnings were applied in TEND, whereas only precommercial thinning in LateTEND. Thus, the tending area during the first 20 years of the simulation period was ca. 27% greater in TEND than in LateTEND. Secondly, in TEND, stands reached the end of the rotation earlier, and all the actions of their next rotation were consequently scheduled earlier than in the other scenarios. Earlier treatments can be seen in Figure 3, where, for example, the area of precommercial thinnings during the simulation years of 61–70 is 53% higher in TEND than in LateTEND.
The first commercial thinnings and final cuttings were generally conducted earlier in TEND than in other scenarios indicating a faster development of stand mean diameter in the stands managed with tending (Figure 4). On the contrary, intermediate thinnings were applied earlier in NoTEND and their annual areas were notably larger when compared to TEND. Earlier intermediate thinnings were partially due to the slightly lower intensity of the first commercial thinning in NoTEND, where retained stands were left somewhat denser after thinning than in the other scenarios. During the first 20 years, the annual area of the first commercial thinnings was small, but thinnings were applied slightly more in NoTEND than in the other scenarios. Later, the annual first commercial thinning areas were clearly larger in TEND than in LateTEND or NoTEND (Figure 4).

3.2. Removals

In the TEND scenario, the total removals from the 100-year period was 173 million m3, including 57% sawlogs and 43% pulpwood (Table 4). Energy wood was not collected in TEND. In the LateTEND scenario, the total removals, including 2 million m3 of energy wood, were 0.6% smaller than those of TEND. In NoTEND, the total removals were almost the same as those of TEND, but included 4 million m3 of energy wood, and the proportion of sawlogs was smaller at 47%. The relation between sawlogs and pulpwood was almost the same in TEND (1.31) and LateTEND (1.32), whereas in NoTEND it was as low as 0.94.
As a summary, although the total removals were highest in the NoTEND scenario (Table 4), TEND resulted in the earliest and highest sawlog removals and NoTEND resulted in the earliest and highest pulpwood removals during the 100-year period (Figure 5).

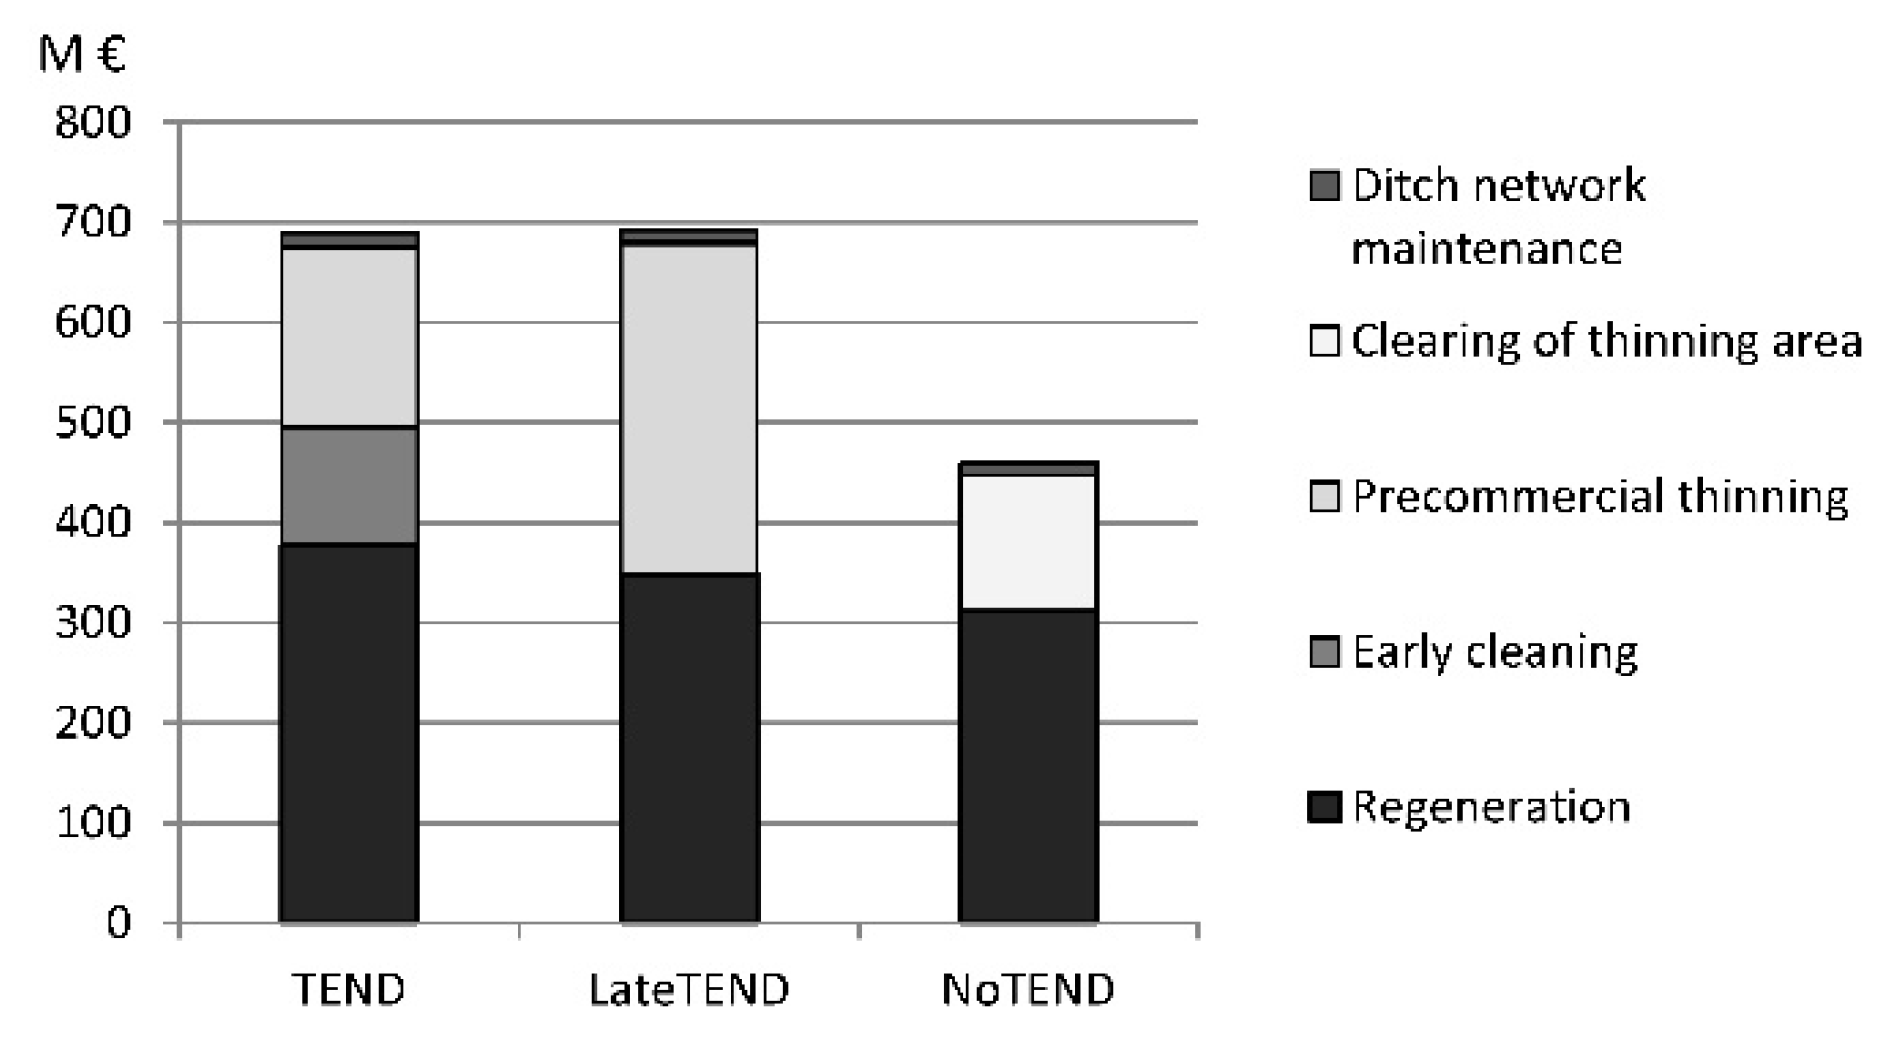
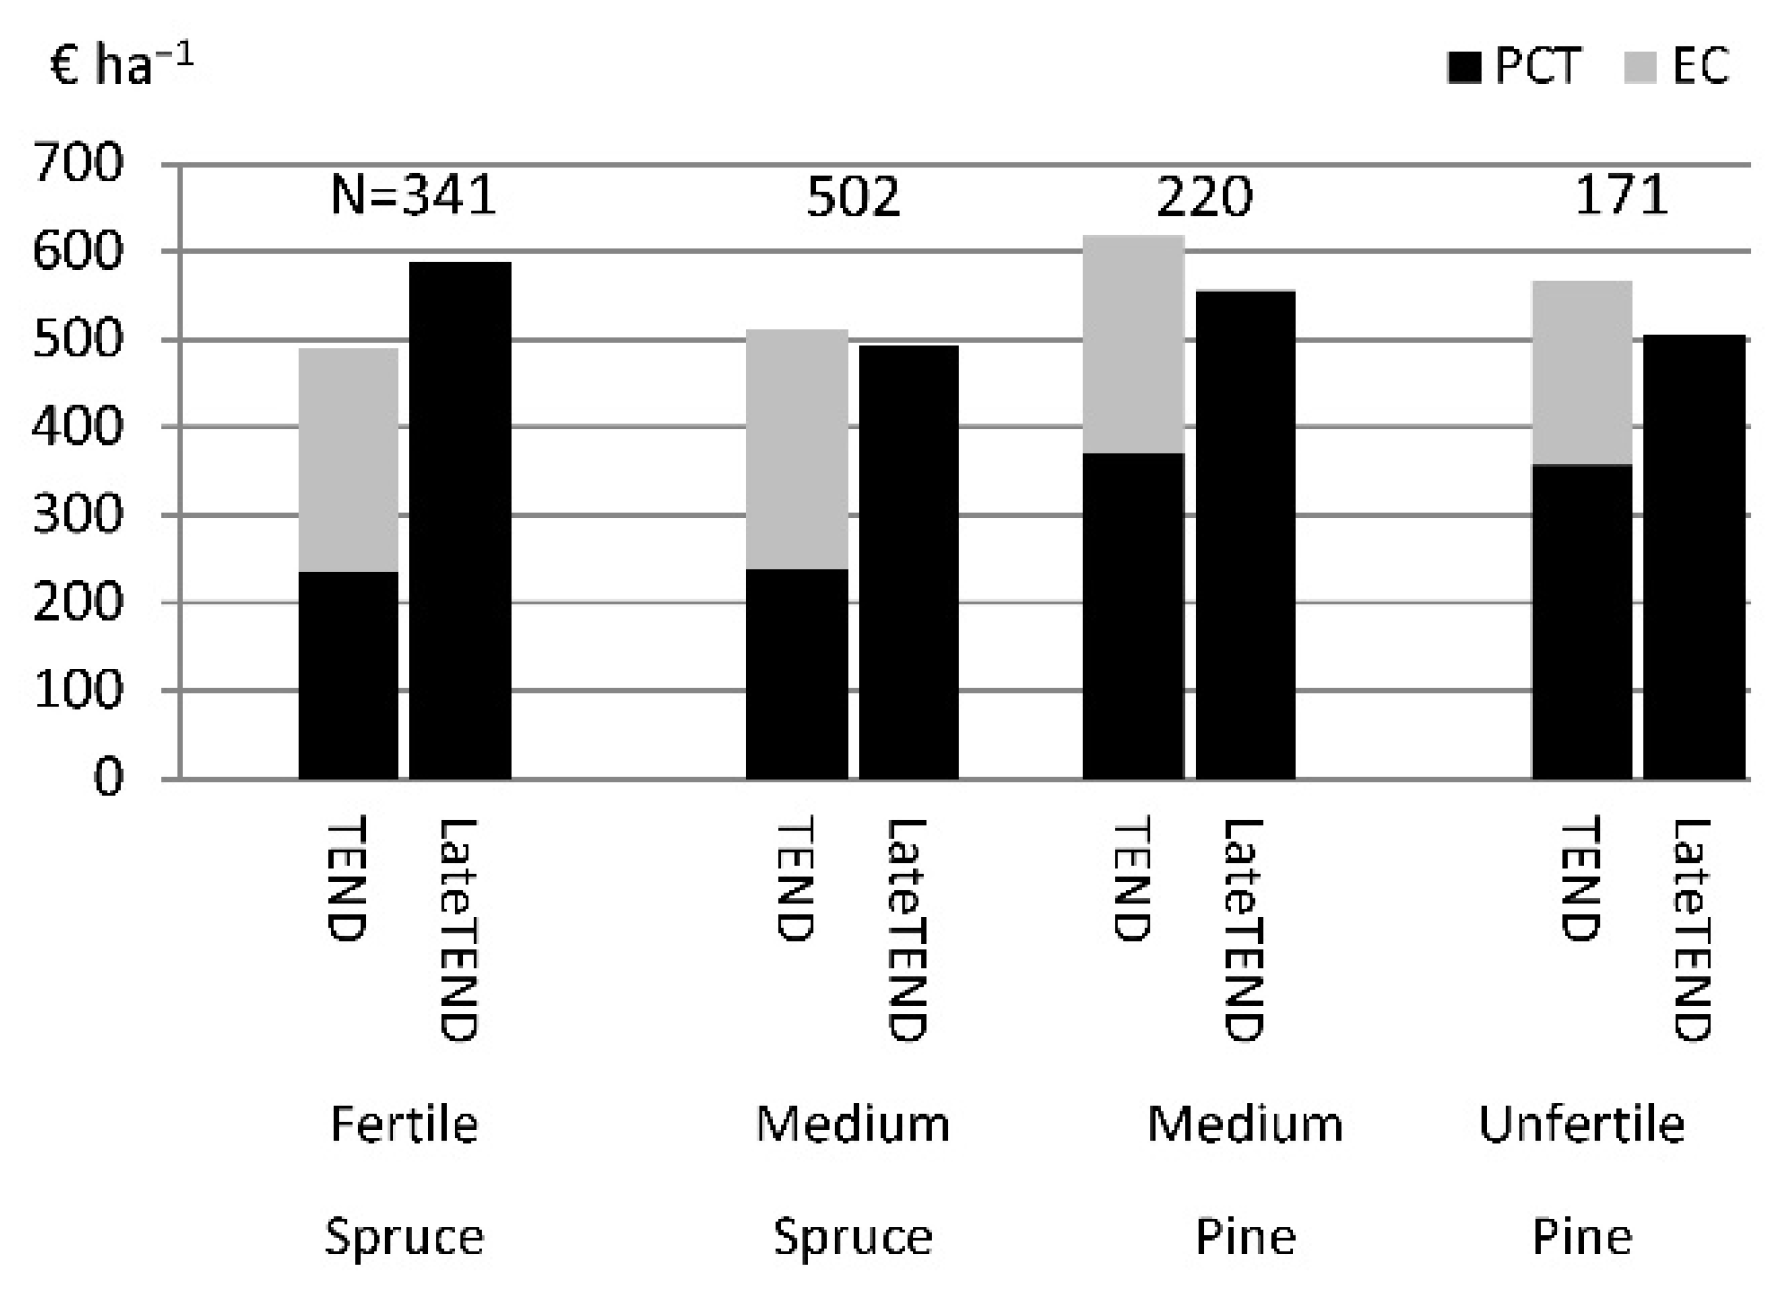
3.3. Costs and Revenues
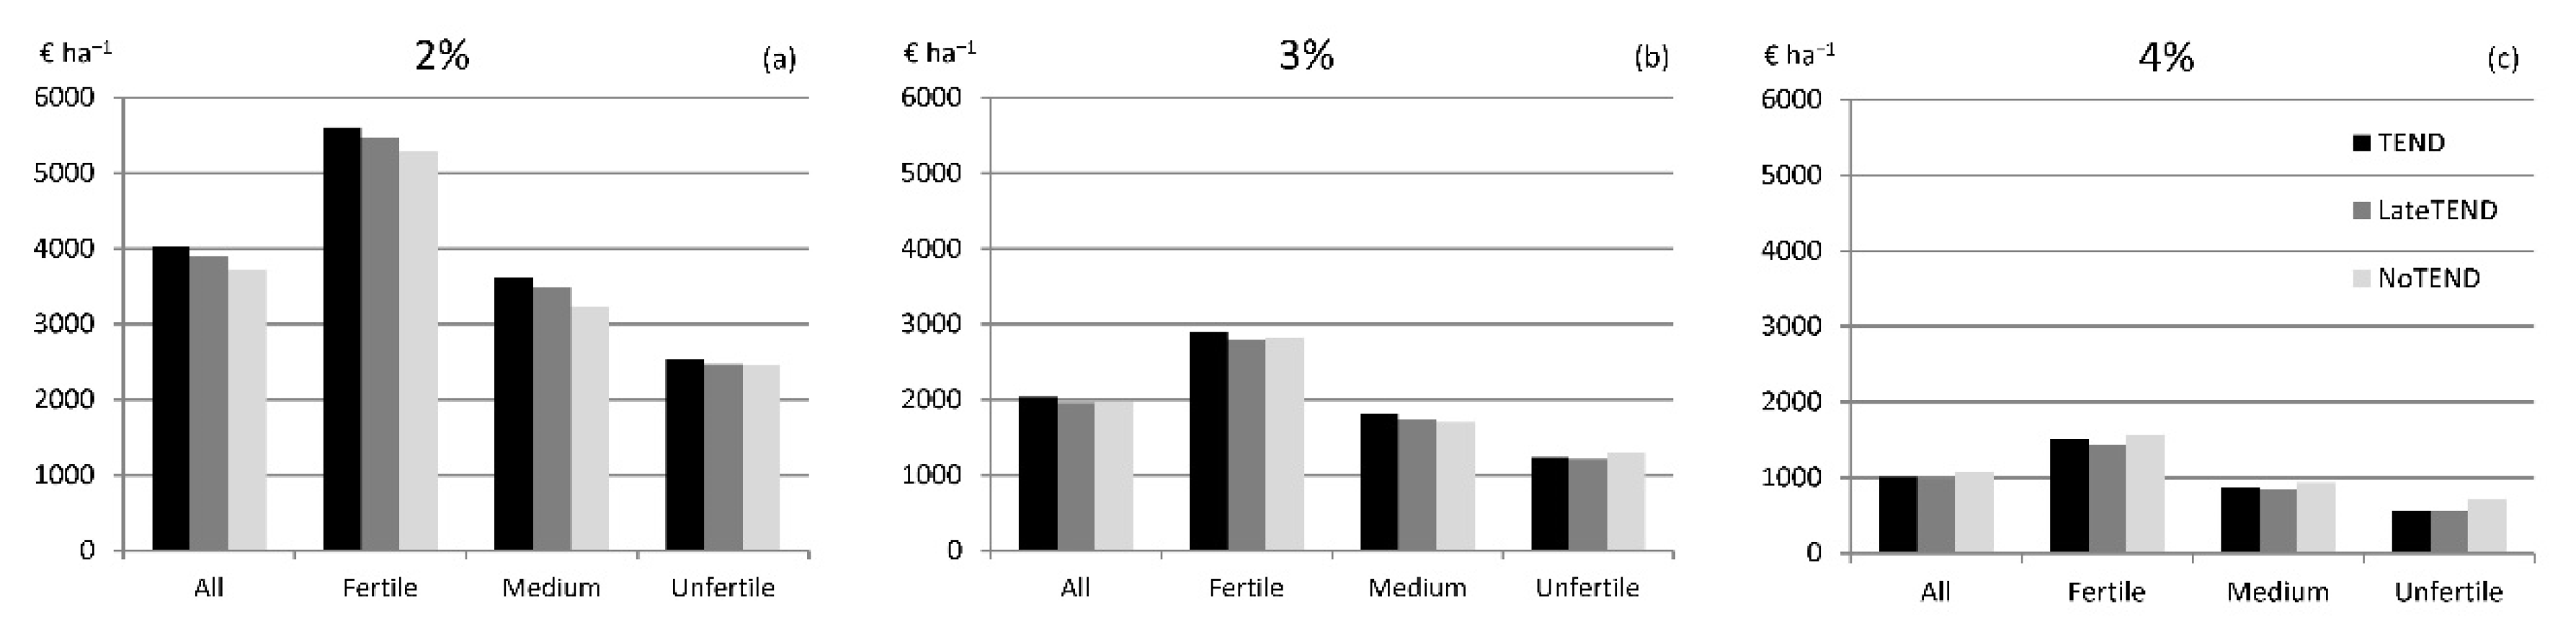
The total silvicultural costs in the 100-year period were equal in TEND and LateTEND, whereas they were ca. 33% lower in NoTEND (Table 4, Figure 6). Tending costs represented almost half of all silvicultural costs involved in TEND and LateTEND. The regeneration costs were related to the final cut and regenerated area during the 100-year period, thus being highest in TEND and second highest in LateTEND (Figure 6).
The total costs of tending (early cleaning and precommercial thinning) in TEND were 11% lower than those of LateTEND, in which only precommercial thinning was carried out (Table 4, Figure 6). In NoTEND, there were no costs from tending treatments, whereas clearing of the first commercial thinning area caused significant costs (Figure 6). In the other scenarios, clearing costs were negligible.
The total stumpage earnings from the 100-year period were the highest in TEND and lowest in NoTEND (Table 4). Comparing the total silvicultural costs and incomes, TEND resulted in higher costs of ca. €230 million (50%) when compared to NoTEND, but at the same time stumpage earnings were €822 million (13%) higher. Correspondingly, LateTEND resulted in €233 million (51%) higher costs compared to NoTEND, but at the same time stumpage earnings were €677 million (11%) higher. When TEND was compared to LateTEND, the costs were €3 million (0.4%) lower, whereas stumpage earnings were €145 million (2%) higher.
The average costs per hectare for precommercial thinning were €282 ha−1 and €540 ha−1 in TEND and LateTEND, respectively. The early-cleaning cost in TEND was on average €261 ha−1. As a result, the average costs per hectare for tending were practically equal for both scenarios (€542 ha−1 and €540 ha−1 in TEND and LateTEND, respectively).
The site effect on tending costs was examined per hectare basis. Since tree species had different principles for tending, sites were further divided by dominant tree species. However, spruce stands on unfertile sites, pine stands on fertile sites, and birch stands were not examined by sites due to the small number in the dataset.
The average early cleaning costs were the lowest on unfertile sites (ca. €209 ha−1) and the highest in spruce stands on medium sites (€272 ha−1) (Figure 7).
The average precommercial thinning costs were, in principle, higher in pine stands than in spruce stands, due to the notably later timing of recommended treatments for pine (see Table 2). This can be seen in the results of TEND, where the precommercial thinning costs were, on average, ca. 50% higher in pine stands. In LateTEND, the difference between spruce and pine stands was smaller, and costs were highest in spruce stands on fertile sites (€587 ha−1).
In fertile sites, the average cost of one precommercial thinning in LateTEND was 20% higher than the combined cost of early cleaning and precommercial thinning in TEND. On medium and unfertile sites, the costs of one treatment were lower than the costs of two treatments together (4% lower in spruce stands, and 10% lower in pine stands) (Figure 7).

3.4. Profitability

The NPV calculated from the whole 100-year period was the highest in the TEND scenario compared to other scenarios with an interest rate of up to 3% (Table 4, “All” in Figure 8). With higher interest rates (from 4% to 5%), LateTEND was the least profitable and NoTEND turned out to be the most profitable option.
With the 3% interest rate, the NPV of TEND was slightly higher (difference €71 ha−1) than the NPV of NoTEND. At a regional level, this meant that TEND resulted in a higher NPV of €14 million than NoTEND. However, NoTEND outperformed LateTEND, resulting in a higher NPV of ca. €1 million.
With the 4% interest rate, the NPV of TEND was €73 ha−1 lower than the NPV of NoTEND. At the regional level, NoTEND resulted in a €15 million higher NPV than TEND, and a €22 million higher NPV than LateTEND.
By site fertility levels, NPVs (€ ha−1) were higher than average on fertile sites, but lower than average on medium and unfertile sites, as anticipated (Figure 8). An advantage of TEND was retained on fertile and medium sites (for both spruce and pine stands) up to an interest rate of 3%, whereas NoTEND was the most profitable on unfertile sites.

3.5. Sensitivity Analysis

We separately tested the effect of the randomizing procedure (i.e., the random selection of the one simulation result for each stand by scenario) on the results. As a sensitivity analysis, we repeated randomizing 10 times for the North Savo stands, and then compared the results to the initial results by a few selected variables (NPV, harvesting removals, area of tending).
The sensitivity analysis showed the stability of our results (i.e., our results changed very little although the randomizing was repeated several times). The relative standard deviations of NPV among 11 cases (i.e., the initial + 10 repeated randomizations) were between 0.52% and 1.28% depending on the interest rate and scenario. According the NPV, the best scenario remained exactly same as in the initial results in all repeated cases and with all interest rates (0%–5%).
Harvesting removals from the whole 100-year period also varied very little between different randomizing cases, with relative standard deviations being from 0.75% to 1.00%. For the total area of tending, the relative standard deviation was 1.01% and 0.83% in TEND and LateTEND, respectively. Temporal variation of precommercial thinning area during the 100-year period in 10 replicates is shown in Figure 9.

4. Discussion

4.1. Benefits of Tending

Our results showed the important role of tending as a part of the chain of silvicultural treatments. Although the costs of tending were high and occurred in the early stages of the rotation, higher and earlier incomes from future harvestings compensated these costs when discounting with modest interest rates at 2% to 3%. The financial viability at stand level analysis of precommercial thinning has been shown earlier e.g., in the studies of Pitt et al. [38], Bataineh et al. [39], and Fahlvik et al. [15].
The profitability of the scenarios was conditional to the applied interest rate. Timely tending (TEND) resulted in the highest NPV with an interest rate of up to 3%. Delayed tending (LateTEND) was the second best up to 2%, but with the 3% interest rate neglecting tending (NoTEND) turned out to be second best option before LateTEND. With 4% and 5% interest rates, NoTEND outperformed the alternatives with tending (TEND and LateTEND). Thus, according to this study, tending turns into a financially unattractive measure when the interest rate exceeds ca. 3%. However, the increased risk of damage related to unmanaged young stand is not taken into account, which overestimates the financial outcome associated with NoTEND.
Our choice to apply interest rates of 2–4% is a compromise between fluctuating time spans (associated with rotation periods ranging from 40 to 110 years) and recent studies on applicable interest rates in forestry [40,41,42]. Price [42] illustrated the discount schedules for three countries (UK, Norway, and France): The suggested discount rates fluctuated between 2% and 4% when the time horizon is from 30 to 200 years.
Benefits of tending varied by sites. The financial gain from tending, expressed as NPV, was the highest on fertile sites, where the competition by broadleaves is intense, but where the high growth rate of trees and their fast and intensive reactions to thinning can compensate the costs of tending. Timely tending (TEND) was more profitable than LateTEND and NoTEND on fertile and medium sites with an interest rate of up to 3%. On unfertile sites, TEND was outperformed by NoTEND. In terms of NPV, delaying tending on unfertile sites would not be advisable since costs were poorly compensated due to relatively low growth rates.
Tree species affected the average costs of tending. The average costs of timely precommercial thinning (€ ha−1) were higher in pine stands than in spruce stands because the recommended timing for the treatment for pine stands is later than for the spruce stands (i.e., precommercial thinning was more time-consuming in 5.5 m pine stands than in 3.5 m spruce stands). When treatment was delayed, the difference in costs between spruce and pine stands narrowed. Delaying did not increase costs in pine stands as much as in spruce stands. In pine stands, the average costs of tending were higher in TEND including two tending treatments than in LateTEND including only one treatment. However, in spruce stands on a fertile site, the situation was opposite: Average costs of one delayed treatment in LateTEND were higher than the costs of two timely treatments in TEND. The fast increase of costs associated with delaying is due to the high tree growth on those sites (both the dominant tree species as well as the undesired broadleaves). Another reason for the higher increase in costs in spruce stands (delayed vs. timely precommercial thinning) is the trees to be removed in tending: On fertile sites they usually are overtopped by broadleaves, whereas in pine stands on unfertile sites removed trees are pines and smaller than retained trees (e.g., [21]). The fast increase of costs also indicates that the stand condition (in relation to stand density and the silvicultural need for tending) is rapidly getting worse. Thus, on the stands on fertile sites, the best gain will be reached with timely tending, and therefore, they should be the first to be taken care of.
Compensation for tending costs comes from the harvesting removals. Although the total biomass production was almost equal between scenarios, the proportion of timber assortments differed considerably. With timely tending (TEND), substantially more sawlogs were produced, whereas the proportion of pulpwood was larger in the scenario without tending (NoTEND). In this regard, tending and delayed tending were quite similar. According to earlier studies (e.g., [43]), the quality of stems will be better in tended stands due to the possibility to select best stems to grow. Therefore, it is worth mentioning that a possibly better quality of timber (due to tending) was not considered in the study at hand. This might underestimate the NPV associated with TEND and LateTEND.
From a profitability point of view, if the recommended time for tending has already passed, neglecting tending turned out to be the most profitable option, especially with higher interest rates. However, neglecting tending involves higher risk of damage, which was not considered in our analysis. Evidently, this would have an impact on financial performance. Neglecting tending was the most profitable, even though it caused extra clearing costs at the time of the first commercial thinning. In practice, a possible option may be either pure or integrated energy wood thinning [44,45,46]. However, beside the financial aspects, the benefits of tending can be valued by other indicators as well (being not examined in this study), although many of them also have indirect impacts on profitability. Delaying or neglecting tending decreases the vitality of the trees, threatens the health of the stands, and increases the risks for different kinds of damage (e.g., [47,48,49]). For example, if precommercial thinning is carried out at a delayed stage in juvenile stands, the retained trees are thin, having a high risk for snow damage [50,51,52]. Due to changes in climate, the importance of the vitality of the stands and forests will be strongly emphasized in the future (e.g., [53]). Finally, the higher amount of sawlogs associated with tending has indirect economic effects not considered in this study. For instance, the higher amount of sawlogs generates more value added through wood processing and creates positive welfare impacts to society (for value-added production in forest industry, see Lantz [54]).
Although the time span of the simulations was long, our study ignored the expected impacts of climate change on the growth and productivity of boreal forests (e.g., species distribution) as well as the possible increases in abiotic and biotic risks to forests. For this, further studies are needed. The other improvements for this kind of scenario analysis should include, e.g., a more detailed economic analysis, including a sensitivity analysis for the changes in costs and stumpage earnings in the future. Some details such as the dependence of clearing at the first commercial thinning on timing of precommercial thinning could easily be ascertained with the long-term field experiments [4]. In addition, the long-term field experiments would improve our knowledge of the future development of unmanaged juvenile stands.

4.2. Regional Impacts of Tending

The results of this study revealed the benefits of timely tending on future harvesting removals and stumpage earnings at a regional level. The estimated future yield of sawlogs and pulpwood from the current juvenile stands of Savo during the 100-year period by timely tending (TEND) would be 2.7 million m3 more than without tending (NoTEND). Sawlog removals would be 19% higher in TEND, whereas pulpwood removals would be 15% lower, compared to NoTEND.
The results also showed significant losses of NPV at a regional level due to delaying or neglecting tending (with 3% interest rate: €14.9 million or €13.8 million, in LateTEND and NoTEND, respectively). Although the total silvicultural costs would increase remarkably due to tending (+ €230 million) it would generate €822 million more stumpage earnings at Savo over a 100-year period (without discounting). Delaying tending causes further costs (+ €3 million) and decreases stumpage earnings by €145 million (without discounting).
In this analysis, the TEND scenario represented an ideal situation, where all forest management was supposed to be done according to silvicultural guidelines. Thus, regional scenario results indicate solely the potential and the results need to be proportionate to the actual intensity level of tending in the study area. According to the NFI11 field data, the need for precommercial thinning was obtained on 320,000 hectares, of which more than a half was in urgent need for tending [16].
Thus, inevitably some (monetary) losses have already occurred in those stands. Furthermore, the current intensity level of tending (i.e., the average annual area of combined early cleaning and precommercial thinning) in the commercial forests of Savo is 23,600 hectares (average of years 2016–2018). Thus, the forest areas, where tending was carried out in practice, have been notably smaller than needed. If this intensity continues, it means that more and more juvenile stands will be left without tending or tended later than recommended.
Depending of the site type, delaying tending by 1.5 m (in stand height) equals ca. 4–6 years in stand age. It is a short time, given the practices in operational forest management. Almost one third of the current juvenile stands in Savo are growing on the fertile sites, and more than a half on medium sites. The better the site, the more quickly juvenile stand develops, the narrower the timeframe for timely tending. Furthermore, losses caused by delaying will be higher on the better sites than on the poorer sites.

5. Conclusions

Our results underline the importance of timely tending at regional level. Timely tending was the most profitable when a modest interest rate (2–3%) was applied in the assessment. However, the scenario analysis showed only the potential future directions at a regional level, and the actual outcomes eventually depend on the practices and activities directed to the silvicultural sector in the future.
Financially, applying tending later than recommended cannot be suggested due to the increased discounted tending costs. At a regional level, both delaying and neglecting tending generated significant losses especially in sawlog removals and stumpage earnings. Great care must be taken particularly on fertile sites. Timely tending turned to delayed tending in a very short time, rapidly increasing tending costs and decreasing the profitability of forest management. The magnitude of this decrease was strongly related to the applied interest rate so that the higher the rate, the greater the decrease. However, totally neglecting tending would generate risks which would have a negative effect on interest rate and further on the profitability.

Author Contributions

Conceptualization, S.H. (Soili Haikarainen), S.H. (Saija Huuskonen), J.R., H.S., A.A. and J.H.; methodology, S.H. (Soili Haikarainen), S.H. (Saija Huuskonen), A.A., M.L., H.S., J.S., and J.H.; software, M.L., H.S. and J.S.; formal analysis, S.H. (Soili Haikarainen), S.H. (Saija Huuskonen) and A.A.; data curation, K.T.K.; writing—original draft preparation, S.H. (Soili Haikarainen), S.H. (Saija Huuskonen) and J.R.; writing—review and editing, S.H. (Soili Haikarainen), S.H. (Saija Huuskonen), A.A., J.H. and H.S.; visualization, S.H. (Soili Haikarainen) and S.H. (Saija Huuskonen); funding acquisition and project administration, J.R.; All authors have read and agreed to the published version of the manuscript.

Funding

This work was supported by the Bio Based Industries Joint Undertaking under the European Union’s Horizon 2020 research and innovation program, TECH4EFFECT—Techniques and Technologies for Effective Wood Procurement—project, (grant number 720757) and the Strategic Research Council of Academy of Finland, FORBIO—Sustainable, climate-neutral and resource-efficient forest-based bioeconomy project (grant number 314224).

Institutional Review Board Statement

Not applicable.

Informed Consent Statement

Not applicable.

Data Availability Statement

The original NFI dataset and the further generated input data for Motti simulations are not publicly available to protect the privacy of forest owners and to keep the location of permanent plots secret.

Conflicts of Interest

The authors declare no conflict of interest. The funders had no role in the design of the study; in the collection, analyses, or interpretation of data; in the writing of the manuscript, or in the decision to publish the results.

References

  1. Finnish Forest Statistics (Web Publication). Natural Resources Institute Finland. Available online: https://stat.luke.fi/sites/default/files/suomen_metsatilastot_2019_verkko2.pdf (accessed on 23 March 2020).
  2. Viitanen, J.; Mutanen, A. (Eds.) Finnish Forest Sector Economic Outlook 2018–2019; Natural resources and bioeconomy studies Natural Resources Institute Finland: Helsinki, Finland, 2018; Volume 50, p. 8. [Google Scholar]
  3. Huuskonen, S.; Haikarainen, S.; Sauvula-Seppälä, T.; Salminen, H.; Lehtonen, M.; Siipilehto, J.; Ahtikoski, A.; Korhonen, K.T.; Hynynen, J. Benefits of Juvenile Stand Management in Finland—Impacts on Wood Production Based on Scenario Analysis. For. Int. J. For. Res. 2020, 93, 458–470. [Google Scholar] [CrossRef]
  4. Uotila, K. Optimization of Early Cleaning and Precommercial Thinning Methods in Juvenile Stand Management of Norway Spruce Stands. Diss. For. 2017, 231, 42. [Google Scholar]
  5. Rantala, S. (Ed.) Finnish Forestry Practice and Management; Metsäkustannus: Helsinki, Finland, 2011. [Google Scholar]
  6. Walfridsson, E. Lövets konkurrens i barrkulturen [Competition from broadleaf trees in young conifer stands]. Skogen 1976, 63, 631–633. [Google Scholar]
  7. Boateng, J.O.; Heineman, J.L.; Bedford, L.; Harper, G.J.; Linnel Nemec, A.F. Long-Term Effects of Site Preparation and Postplanting Vegetation Control on Picea Glauca Survival, Growth and Predicted Yield in Boreal British Columbia. Scand. J. For. Res. 2009, 24, 111–129. [Google Scholar] [CrossRef]
  8. Jobidon, R. Density-Dependent Effects of Northern Hardwood Competition on Selected Environmental Resources and Young White Spruce (Picea Glauca) Plantation Growth, Mineral Nutrition, and Stand Structural Development—A 5-Year Study. For. Ecol. Manag. 2000, 130, 77–97. [Google Scholar] [CrossRef]
  9. Nilsson, U.; Örlander, G. Water Uptake by Planted Picea Abies in Relation to Competing Field Vegetation and Seedling Rooting Depth on Two Grass-Dominated Sites in Southern Sweden. Scand. J. For. Res. 1999, 14, 312–319. [Google Scholar] [CrossRef]
  10. Assmann, E. The Principles of Forest Yield Study—Studies in the Organic Production, Structure, Increment and Yield of Forest Stands; Pergamon Press: Oxford, UK, 1970. [Google Scholar]
  11. Vuokila, Y. Nuoren männikön kasvureaktio ensiharvennuksen jälkeen. Summary: The growth reaction of young pine stands to the first commercial thinning. Folia For. 1981, 468, 13. [Google Scholar]
  12. Fahlvik, N.; Ekö, P.-M.; Pettersson, N. Influence of Precommercial Thinning Grade on Branch Diameter and Crown Ratio in Pinus Sylvestris in Southern Sweden. Scand. J. For. Res. 2005, 20, 243–251. [Google Scholar] [CrossRef]
  13. Kellomäki, S.; Tuimala, A. Puuston tiheyden vaikutus puiden oksikkuuteen taimikko- ja riukuvaiheen männiköissä. Summary: Effect of stand density on branchiness of young Scots pines. Folia For. 1981, 478, 27. [Google Scholar]
  14. Varmola, M.; Salminen, H. Timing and Intensity of Precommercial Thinning in Pinus Sylvestris Stands. Scand. J. For. Res. 2004, 19, 142–151. [Google Scholar] [CrossRef]
  15. Fahlvik, N.; Berglund, M.; Holmström, H.; Nilsson, U. Simulation of the Long-Term Effects of Different Strategies for Precommercial Thinning in Pinus Sylvestris. Scand. J. For. Res. 2018, 33, 347–356. [Google Scholar] [CrossRef]
  16. Korhonen, K.T.; Ihalainen, A.; Ahola, A.; Heikkinen, J.; Henttonen, H.M.; Hotanen, J.-P.; Nevalainen, S.; Pitkänen, J.; Strandström, M.; Viiri, H. Suomen Metsät 2009–2013 ja Niiden Kehitys 1921–2013; Luonnonvara-Ja Biotalouden Tutkimus; Natural Research Institute Finland: Helsinki, Finland, 2017; 86p. [Google Scholar]
  17. Luke, Natural Resources Institute Finland. Statistics Database. [Choose Forest Statistics/Economy/Volumes and Prices in Roundwood Trade/Annual Statistics/Stumpage Prices of Roundwood by Year]. Available online: https://statdb.luke.fi/PXWeb/pxweb/en/LUKE/?rxid=9dc1d1ef-f143-49af-aff3-61e935eadc8f (accessed on 15 November 2018).
  18. Luke, Natural Resources Institute Finland. Statistics Database. [Choose Forest Statistics/Structure and Production/Silvicultural and Forest Improvement Work/Silvicultural and Forest Improvement Work/Silvicultural and Forest Improvement Work 2015–]. Available online: https://statdb.luke.fi/PXWeb/pxweb/en/LUKE/?rxid=9dc1d1ef-f143-49af-aff3-61e935eadc8f (accessed on 15 November 2018).
  19. Huuskonen, S.; Hynynen, J. Timing and Intensity of Precommercial Thinning and Their Effects on the First Commercial Thinning in Scots Pine Stands. Silva Fenn. 2006, 40. [Google Scholar] [CrossRef] [Green Version]
  20. Uotila, K.; Rantala, J.; Saksa, T. Estimating the Need for Early Cleaning in Norway Spruce Plantations in Finland. Silva Fenn. 2012, 46. [Google Scholar] [CrossRef] [Green Version]
  21. Uotila, K.; Saksa, T. Effects of Early Cleaning on Young Picea Abies Stands. Scand. J. For. Res. 2014, 29, 111–119. [Google Scholar] [CrossRef]
  22. Kaila, S.; Kiljunen, N.; Miettinen, A.; Valkonen, S. Effect of Timing of Precommercial Thinning on the Consumption of Working Time in Picea Abies Stands in Finland. Scand. J. For. Res. 2006, 21, 496–504. [Google Scholar] [CrossRef]
  23. Fahlvik, N.; Ekö, P.M.; Petersson, N. Effects of Precommercial Thinning Strategies on Stand Structure and Growth in a Mixed Even-Aged Stand of Scots Pine, Norway Spruce and Birch in Southern Sweden. Silva Fenn. 2015, 49. [Google Scholar] [CrossRef] [Green Version]
  24. Holmström, E.; Hjelm, K.; Johansson, U.; Karlsson, M.; Valkonen, S.; Nilsson, U. Pre-Commercial Thinning, Birch Admixture and Sprout Management in Planted Norway Spruce Stands in South Sweden. Scand. J. For. Res. 2016, 31, 56–65. [Google Scholar] [CrossRef]
  25. Karttunen, K.; Ahtikoski, A.; Kujala, S.; Törmä, H.; Kinnunen, J.; Salminen, H.; Huuskonen, S.; Kojola, S.; Lehtonen, M.; Hynynen, J.; et al. Regional Socio-Economic Impacts of Intensive Forest Management, a CGE Approach. Biomass Bioenergy 2018, 118, 8–15. [Google Scholar] [CrossRef] [Green Version]
  26. Industrial Roundwood Removals by Region (Web Publication). Natural Resources Institute Finland. Available online: https://stat.luke.fi/en/industrial-roundwood-removals-by-region (accessed on 1 December 2020).
  27. SAS 9.4 Product Documentation. Available online: https://support.sas.com/documentation/94/ (accessed on 26 November 2020).
  28. Lappi, J.; Lempinen, R. A Linear Programming Algorithm and Software for Forest-Level Planning Problems Including Factories. Scand. J. For. Res. 2014, 29 (Suppl. 1), 178–184. [Google Scholar] [CrossRef]
  29. Tonteri, T.; Hotanen, J.-P.; Kuusipalo, J. The Finnish Forest Site Type Approach: Ordination and Classification Studies of Mesic Forest Sites in Southern Finland. Vegetatio 1990, 87, 85–98. [Google Scholar] [CrossRef]
  30. Hynynen, J.; Salminen, H.; Ahtikoski, A.; Huuskonen, S.; Ojansuu, R.; Siipilehto, J.; Lehtonen, M.; Eerikäinen, K. Long-Term Impacts of Forest Management on Biomass Supply and Forest Resource Development: A Scenario Analysis for Finland. Eur. J. For. Res. 2015, 134, 415–431. [Google Scholar] [CrossRef]
  31. Hynynen, J.; Salminen, H.; Ahtikoski, A.; Huuskonen, S.; Ojansuu, R.; Siipilehto, J.; Lehtonen, M.; Rummukainen, A.; Kojola, S.; Eerikäinen, K. Scenario Analysis for the Biomass Supply Potential and the Future Development of Finnish Forest Resources; Working Papers of the Finnish Forest Research Institute: Vantaa, Finland, 2014; Volume 302, p. 106. [Google Scholar]
  32. Siipilehto, J.; Ojansuu, R.; Miina, J.; Hynynen, J.; Valkonen, S.; Saksa, T. Metsikön Varhaiskehityksen Kuvaus MOTTI-Ohjelmistossa [Early Development of Young Stands in Motti Software]; Working Papers of the Finnish Forest Research Institute: Vantaa, Finland, 2014; Volume 286, p. 43. [Google Scholar]
  33. Repola, J.; Hökkä, H.; Salminen, H. Models for Diameter and Height Growth of Scots Pine, Norway Spruce and Pubescent Birch in Drained Peatland Sites in Finland. Silva Fenn. 2018, 52. [Google Scholar] [CrossRef]
  34. Salminen, H.; Lehtonen, M.; Hynynen, J. Reusing Legacy FORTRAN in the MOTTI Growth and Yield Simulator. Comput. Electron. Agric. 2005, 49, 103–113. [Google Scholar] [CrossRef]
  35. Hynynen, J.; Ojansuu, R.; Hökkä, H.; Siipilehto, J.; Salminen, H.; Haapala, P. Models for Predicting Stand Development in MELA System; Research Papers; Finnish Forest Research Institute: Vantaa, Finland, 2002; Volume 835, p. 116.
  36. Luke, Natural Resources Institute Finland. Statistics Database. [Choose Forest Statistics/Structure and Production/Silvicultural and Forest Improvement Work/Unit Costs of Silvicultural and Forest Improvement Work 2002–2014]. Available online: https://statdb.luke.fi/PXWeb/pxweb/en/LUKE/?rxid=9dc1d1ef-f143-49af-aff3-61e935eadc8f (accessed on 15 November 2018).
  37. Official Statistics of Finland (OSF). Consumer Price Index [e-Publication]. January 2017, Appendix Table 3. Cost-of-living Index 1951:10=100. Available online: http://www.stat.fi/til/khi/2017/01/khi_2017_01_2017-02-20_tau_003_en.html (accessed on 15 November 2018).
  38. Pitt, D.; Lanteigne, L.; Hoepting, M.K.; Plamondon, J.; Duchesne, I.; Bicho, P.; Warren, G. Effects of Precommercial Thinning on the Forest Value Chain in Northwestern New Brunswick: Part 6–Estimating the Economic Benefits. For. Chron. 2013, 89, 502–511. [Google Scholar] [CrossRef] [Green Version]
  39. Bataineh, M.M.; Wagner, R.G.; Weiskittel, A.R. Long-Term Response of Spruce–Fir Stands to Herbicide and Precommercial Thinning: Observed and Projected Growth, Yield, and Financial Returns in Central Maine, USA. Can. J. For. Res. 2013, 43, 385–395. [Google Scholar] [CrossRef]
  40. Davies, O.; Kerr, G. Comparing the Costs and Revenues of Transformation to Continuous Cover Forestry for Sitka Spruce in Great Britain. Forests 2015, 6, 2424–2449. [Google Scholar] [CrossRef] [Green Version]
  41. Knoke, T.; Paul, C.; Härtl, F. A Critical View on Benefit-Cost Analyses of Silvicultural Management Options with Declining Discount Rates. For. Policy Econ. 2017, 83, 58–69. [Google Scholar] [CrossRef]
  42. Price, C. Declining Discount Rate and the Social Cost of Carbon: Forestry Consequences. J. For. Econ. 2018, 31, 39–45. [Google Scholar] [CrossRef]
  43. Huuskonen, S.; Hynynen, J.; Ojansuu, R. Stand Characteristics and External Quality of Young Scots Pine Stands in Finland. Silva Fenn. 2008, 42. [Google Scholar] [CrossRef] [Green Version]
  44. Heikkilä, J.; Sirén, M.; Ahtikoski, A.; Hynynen, J.; Sauvula, T.; Lehtonen, M. Energy Wood Thinning as a Part of Stand Management of Scots Pine and Norway Spruce. Silva Fenn. 2009, 43. [Google Scholar] [CrossRef] [Green Version]
  45. Routa, J.; Kellomäki, S.; Kilpeläinen, A.; Peltola, H.; Strandman, H. Effects of Forest Management on the Carbon Dioxide Emissions of Wood Energy in Integrated Production of Timber and Energy Biomass. GCB Bioenergy 2011, 3, 483–497. [Google Scholar] [CrossRef]
  46. Bergström, D.; Fulvio, F.D. Comparison of the Cost and Energy Efficiencies of Present and Future Biomass Supply Systems for Young Dense Forests. Scand. J. For. Res. 2014, 29, 793–812. [Google Scholar] [CrossRef]
  47. Jactel, H.; Nicoll, B.C.; Branco, M.; Gonzalez-Olabarria, J.R.; Grodzki, W.; Långström, B.; Moreira, F.; Netherer, S.; Orazio, C.; Piou, D.; et al. The Influences of Forest Stand Management on Biotic and Abiotic Risks of Damage. Ann. For. Sci. 2009, 66, 701. [Google Scholar] [CrossRef]
  48. Garbelotto, M.; Gonthier, P. Biology, Epidemiology, and Control of Heterobasidion Species Worldwide. Annu. Rev. Phytopathol. 2013, 51, 39–59. [Google Scholar] [CrossRef] [PubMed] [Green Version]
  49. Wallentin, C.; Nilsson, U. Storm and Snow Damage in a Norway Spruce Thinning Experiment in Southern Sweden. For. Int. J. For. Res. 2014, 87, 229–238. [Google Scholar] [CrossRef] [Green Version]
  50. Valinger, E.; Lundqvist, L.; Brandel, G. Wind and Snow Damage in a Thinning and Fertilisation Experiment in Pinus Sylvestris. Scand. J. For. Res. 1994, 9, 129–134. [Google Scholar] [CrossRef]
  51. Valinger, E.; Pettersson, N. Wind and Snow Damage in a Thinning and Fertilization Experiment in Picea Abies in Southern Sweden. For. Int. J. For. Res. 1996, 69, 25–33. [Google Scholar] [CrossRef]
  52. Päätalo, M.-L. Risk of Snow Damage in Unmanaged and Managed Stands of Scots Pine, Norway Spruce and Birch. Scand. J. For. Res. 2000, 15, 530–541. [Google Scholar] [CrossRef]
  53. Felton, A.; Nilsson, U.; Sonesson, J.; Felton, A.M.; Roberge, J.-M.; Ranius, T.; Ahlström, M.; Bergh, J.; Björkman, C.; Boberg, J.; et al. Replacing Monocultures with Mixed-Species Stands: Ecosystem Service Implications of Two Production Forest Alternatives in Sweden. Ambio 2016, 45, 124–139. [Google Scholar] [CrossRef] [Green Version]
  54. Lantz, V. Measuring Scale, Technology and Price Effects on Value-Added Production across Canadian Forest Industry Sectors. For. Policy Econ. 2005, 7, 333–344. [Google Scholar] [CrossRef]
Figure 1. Overview of step-by-step process applied in the scenario analysis. Motti stand simulator was used in the simulations. Further analyses were carried out with SAS [27] and J [28] software.
Forests 12 00084 g001
Figure 2. Regions in Finland (2019) and our study area Savo, made up of the regions of South Savo and North Savo.
Forests 12 00084 g002
Figure 3. Temporal variation of average annual areas (1000 ha a−1 average in 10-year periods) of early cleaning (EC) and precommercial thinning (PCT) in the scenarios of (a) timely tending, TEND, and (b) delayed tending, LateTEND.
Forests 12 00084 g003
Figure 4. Temporal variation of the average annual harvesting areas (1000 ha a−1 average in 10-year periods) by scenario. (a) First commercial thinnings, (b) intermediate thinnings, and (c) final cuttings.
Forests 12 00084 g004
Figure 5. Annual harvesting removals by the scenarios of timely tending (TEND), delayed tending (LateTEND), and no tending (NoTEND). (a) Sawlogs, and (b) pulpwood removals.
Forests 12 00084 g005
Figure 6. Total silvicultural costs (million € within the 100-year period) by the scenarios of timely tending (TEND), delayed tending (LateTEND), and no tending (NoTEND).
Forests 12 00084 g006
Figure 7. Average costs (€ ha−1) of early cleaning (EC) and precommercial thinning (PCT) in pine and spruce dominated stands by scenarios of timely tending (TEND), and delayed tending (LateTEND), and by site fertility levels.
Forests 12 00084 g007
Figure 8. Net present value (NPV; € ha−1;) of all sites and by site fertility levels. Interest rates (a) 2%, (b) 3%, and (c) 4%.
Forests 12 00084 g008
Figure 9. Temporal variation of tending area during the 100-year simulation period according to initial results (black line) and based on the 10 repetitions in sensitivity analysis.
Forests 12 00084 g009
Table 1. Number (N) of NFI11-plots included in the study and their representative forest area by regions, site fertility levels, and dominant tree species.
NArea, haArea, %Proportion of Dominant Tree Species 2
Pine, %Spruce, %Birch, %Total
RegionSouth Savo673183,78747
North Savo678207,41153
All1351391,199100
Fertility levels 1Fertile (site classes 1–2)399115,3972948610100
Medium (site class 3)754218,4155629674100
Unfertile (site classes 4–6)19857,386159370100
All1351391,199100
1 site fertility levels based on the Finnish site type classes from the most fertile (class 1) to the most barren (class 6), see e.g., [29]. 2 Pine = Scots pine, Spruce = Norway spruce, Birch = silver birch on mineral soils, downy birch on peatlands.
Table 2. Examples of alternative management regimes for spruce and pine in the climatic area of 1200–1100 d.d.
ScenariosSpruce, Site Type 3 1Pine, Site Type 4 1
TENDLateTENDNoTENDTENDLateTENDNoTEND
Regeneration Two (2) optionsTwo (2) optionsTwo (2) options
Tree speciesNorway spruceNorway spruceNorway spruceScots pineScots pineScots pine
MethodPlantingPlantingPlantingSeedingSeedingSeeding
Genetically improved material 2---Yes or NoYes or NoYes or No
Density (N ha−1)180018001800400040004000
Soil preparationSpot moundingSpot moundingSpot moundingDisc trenchingDisc trenchingDisc trenching
Early cleaningTiming (mean height, m)1--1--
Growing density (N ha−1)ca. 3000 ca. 4000
Precommercial thinningTiming (dominant height, m)3.55.0-5.57.0-
Growing density, (N ha−1)20002000 20002000
Tree species selection10% birch mixture10% birch mixture
First commercial thinningMethodThree (3) optionsThree (3) optionsThree (3) optionsThree (3) optionsThree (3) optionsThree (3) options
BelowBelowBelowQuality thinningQuality thinningQuality thinning
Timing (dominant height, m)12, 14, or 1612, 14, or 1612, 14, or 1612, 14, or 1612, 14, or 1612, 14 or 16
Growing density (N ha−1)100010001100100010001100
AssortmentsPulpwood and sawlogsPulpwood, sawlogs, and energy woodPulpwood, sawlogs, and energy woodPulpwood and sawlogsPulpwood, sawlogs, and energy woodPulpwood, sawlogs, and energy wood
Intermediate thinningsMethodBelowBelowBelowBelowBelowBelow
Timing (basal area, m2 ha−1, and dominant height, m)Thinning guidelinesThinning guidelinesThinning guidelinesThinning guidelinesThinning guidelinesThinning guidelines
Basal area (m2 ha−1)Thinning guidelinesThinning guidelinesThinning guidelinesThinning guidelinesThinning guidelinesThinning guidelines
AssortmentsPulpwood and sawlogsPulpwood and sawlogsPulpwood and sawlogsPulpwood and sawlogsPulpwood and sawlogsPulpwood and sawlogs
Final cuttingMean diameter (cm)Eight (4 × 2) optionsEight (4 × 2) optionsFour (4) optionsFour (4) optionsFour (4) optionsFour (4) options
22, 26, 30 or 3422, 26, 30 or 3422, 26, 30 or 3422, 26, 30 or 3422, 26, 30 or 3422, 26, 30 or 34
AssortmentsPulpwood and sawlogsPulpwood and sawlogsPulpwood and sawlogsPulpwood and sawlogsPulpwood and sawlogsPulpwood and sawlogs
Recovery of logging residues and stumpsYes or NoYes or No----
Total number of regimes242412242424
1 Site fertility levels on mineral soils 3: Medium, 4: Quite poor. 2 Genetically improved material was not available for spruce.
Table 3. Real (i.e., deflated) stumpage prices and silvicultural costs.
Stumpage Prices 1, € m−3 SawlogsPulpwoodEnergy Wood
First commercial thinningPine 241.8112.6
Spruce 241.9314.92
Birch 237.1212.07
Intermediate thinningPine50.2415.63
Spruce49.7319.52
Birch41.6614.28
Final cuttingPine59.3318.36
Spruce58.9623.77
Birch48.9517.88
All cuttings and tree speciesStems 3.97
Crowns 3.29
Stumps 1.21
Silvicultural Costs
Labour costs of planting, € plant−10.16–0.20 3
Material costs of planting, € plant−10.19–0.24
Seeding, € ha−1215.5
Mounding, € ha−1342.5
Disc trenching, € ha−1188.6
Patch scarification, € ha−1304.1
Early cleaning, € h−135.0 4
Precommercial thinning, € h−135.0
Clearing of thinning area, € h−135.0
Ditch network maintenance, € ha−1184.5
1 The original time series of nominal stumpage prices and silvicultural costs (covering years 2002–2016) were deflated according to the cost-of-living index (1951:10 = 100 and index value for year 2016 = 1913) [37]. 2 Pine = Scots pine, Spruce = Norway spruce, Birch = Silver birch on mineral soils (on peatlands, downy birch was not artificially regenerated). In harvesting removals, birch pulpwood may include small amounts of other broadleaved tree species. 3 cost depending on tree species. 4 h = Total work hours. Time consumption is calculated as effective work hours. Total work hours were calculated by multiplying effective work hours by a constant 1.3.
Table 4. Total removals (million m3), stumpage earnings, silvicultural costs, and net present values (NPV) 2–5% (million €) from the 100-year period by scenario (EC = early cleaning, PCT = precommercial thinning).
TENDLateTENDNoTEND
Removals, million m3Sawlog98.296.582.3
Pulpwood74.773.287.9
Energy wood0.02.13.9
All172.9171.8174.1
Stumpage earnings, million €All7094.46949.26271.9
Costs, million €EC118.00.00.0
PCT179.3330.00.0
Other391.9361.8459.4
All689.1691.9459.4
NPV 2%, million € 787.6762.3725.2
NPV 3%, million € 397.2382.3383.4
NPV 4%, million € 196.0188.1210.5
NPV 5%, million € 88.785.8120.0
Publisher’s Note: MDPI stays neutral with regard to jurisdictional claims in published maps and institutional affiliations.

