Threat Degree Classification According to Habitat Quality: A Case Study from the Czech Republic


1
Department of Forest Botany, Dendrology and Geobiocenology, Faculty of Forestry and Wood Technology, Mendel University, Zemědělská 3, CZ-613 00 Brno, Czech Republic
2
Department of Forest Management and Applied Geoinformatics, Faculty of Forestry and Wood Technology, Mendel University, Zemědělská 3, CZ-613 00 Brno, Czech Republic
*
Author to whom correspondence should be addressed.
Forests 2021, 12(1), 85; https://0-doi-org.brum.beds.ac.uk/10.3390/f12010085
Submission received: 9 December 2020
/
Revised: 28 December 2020
/
Accepted: 11 January 2021
/
Published: 14 January 2021
(This article belongs to the Section Forest Ecology and Management)
Abstract
:Important sources of information in the field of nature protection are red lists, which define the degree of threat to individual species. In practice, an assessment of the quality of the habitats in which a species occurs is used to a very limited extent in the preparation of red lists of vascular plants. At the same time, this parameter is usually essential to determine their degree of threat. At present, habitat quality data are available for the territory of the Czech Republic; these were obtained during Natura 2000 habitat mapping in the years 2000–2019. In this paper we propose the use of habitat quality data to determine the degree of threat to selected species of vascular plants and to compile a national red list. Nine plant species from three habitat types were selected for this study: meadows and wetland habitats in the alluvium of large rivers (Cardamine matthioli Moretti, Gratiola officinalis L., Teucrium scordium L.), fen habitats (Carex appropinquata Schumach., C. cespitosa L., C. lepidocarpa Tausch) and ecotone shrub habitats (Rosa agrestis Savi, R. micrantha Borrer ex Sm., R. spinosissima L.). For these species, the quality of the habitats in which they occur was analysed and grid maps were created, which present (1) the level of knowledge of habitat quality and (2) the average habitat quality. The results were compared with the degree of threat in the current national red list. Habitat quality analysis should also be used in the future to detect threatened species, which today are outside the red list and this assessment may be useful in compiling another updated red list of vascular plants of the Czech Republic.
1. Introduction
Red lists, which categorise species of living organisms or habitats according to their urgency of threat, are indispensable sources of information in nature conservation. For some groups of organisms, such as birds and mammals [1] or vascular plants, red lists have been being drawn up for a long time, in contrast to other, lesser known and lesser-explored groups. Red lists of vascular plants at different geographical levels (regional, national, continental) have been available for many years. Criteria for assessing the degree of threat are being developed and the lists are more or less regularly updated. Red lists of habitats, on the other hand, are relatively ‘young’ documents. Their creation has been stimulated by the ecosystem approach of nature protection and the necessity of management at the level of landscape units [2].
The International Union for Conservation of Nature (IUCN) has established basic principles for the assessment of the risk of extinction of species according to standardised criteria for the creation of red lists, and also determines the possible applications of these criteria in the assessment of natural habitats (Red List Categories and Criteria [3,4,5]. At the same time, it draws attention to the advantages and possible pitfalls of the evaluation process at a regional level. However, the evaluation process at global and regional levels can be considered stable at present [6,7,8] and a number of Central European countries use it to compile their red lists [9,10,11,12,13,14,15,16].
In the 1980s, the so-called Central European threat classification [17] was created using the original threat categories established by the IUCN in 1994 [18], which was also used for the first red list of vascular plants of the Czech Republic [19]. Its division into eight threat categories was also followed by the subsequent updated red list [20]. The 3rd version of the national red list based on the same classification was published twelve years later [21] and was subsequently supplemented with IUCN categories [22]. The classification of vascular plant taxa into degrees of threat in all these mentioned red lists is just based on empirical evaluation, only in the latest one [22] grid maps of historical and current distribution were used and compared with some data contained in the NDOP (Species Occurrence Database) and PLADIAS (Database of the Czech Flora and Vegetation). The result of this method is directly proportional to the floristic knowledge of the editor and some regional experts. However, it can still be inaccurate or even erroneous at the regional level. On the other hand, it should be mentioned that a first attempt to standardise the classification was already published by Čeřovský [23], who proposed a theoretical model for a so-called ‘socioecological index’, which was ultimately not used.
However, there is still a lack of sufficient knowledge of the possibilities of using habitat data to determine the degree of threat to plant species. The indication of endangerment of plant species according to habitat quality is solved less often or not at all [24]. The reason may be the limited possibility of obtaining adequate data on habitat quality, which can usually be acquired only in a limited space, respectivley at particular localities where plant species important for nature conservation occur, e.g., in part of northern Bohemia [25]. Krahulec [26] attempted the first simplified comparison of threatened species and communities in the Czech Republic, using an overview of plant communities in the Czech Republic and their threats, previously published by Moravec et al. [27] as one of the first in the world. The lack of new and easily accessible data on species and habitats, which may be a limitation for a comprehensive classification of threatened species, was mentioned by Blasi et al. [28]. Articles dealing with this topic appear rarely.
At present, a large amount of floristic data are available, which are contained both in national electronic databases [29,30] and in herbarium collections or other sources, which can be used for compiling red lists. However, habitat data [31] are also available for the whole territory of the Czech Republic, therefore it is appropriate to try to analyse these data sets and find out whether it would be useful in the determination of the degree of threat to vascular plant species and thus the compilation of the next, updated Red List.
Part of the Natura 2000 network is an ambitious project of mapping habitats in the Czech Republic. This project started in the year 2000 with the aim of obtaining the most comprehensive overview of the vegetation cover in the Czech Republic, especially of the occurrence of natural habitats [32]. These data have become a professional basis for the definition of Sites of Community Importance of the Natura 2000 system in the Czech Republic of the so-called Habitat Directive (Council Directive 92/43EEC on the conservation of natural habitats and wild fauna and flora). The result is a ‘habitat mapping layer’ (HML), which provides comprehensive information on the occurrence and status of natural (and partly unnatural) habitats in the Czech Republic (see [33] for details) and is the fundamental database for evaluating their quality. The basic habitat mapping was followed in 2006 by a ‘habitat mapping update’, which aims to bring an up-to-date picture of habitats in the Czech Republic in cycles of about twelve-years. The Natura 2000 mapping has provided basic information on the quality of habitats in our territory [33,34] and the Red List of Habitats of the Czech Republic [35] was based on data from the mapping project. These data were used also to present the original Czech method of forest habitats monetary valuation within the European context [36].
The comprehensive mapping of habitats in the Czech Republic is a unique project at least on a European scale. Nowotny and Hinterstoisser [37], Nowotny [38] and Keusch et al. [39] deal with similar mapping, but to a limited extent, on the territory of the Austrian federal state of Salzburg. Assessment of the quality of habitats on a wider landscape scale (not only in legally protected parts, but also in other landscapes) is rather unique. Similar studies are known from Germany [40] and the USA [41]. Other studies only focus on small groups of habitats or on selected habitats, mainly concentrated on plant species diversity. Godefroid and Koedam [42] deal with the species composition and quality of suburban forest habitats near Brussels. Cousin and Ihse [43] present a method of assessing the agricultural landscape in Sweden, based on criteria such as degree of conservation of the natural habitat, stage of succession, physiognomy of the stand and its species composition. A system of criteria was designed for the National Red Book of Habitats of the Netherlands to describe the state of habitats and provide data for nature conservation [44].
The ‘Catalogues of Habitats’ of European countries (created mainly for Natura 2000) deal with the relationship of vascular plant species to a given habitat [32,45,46]. In addition to the description of the structure, ecology and distribution of the habitats, plant species are also associated with the habitats. Some other studies look into habitat changes in relation to threatened plant species [47].
Sádlo et al. [48] published basic data obtained from a newly created database containing ‘species pools’ of vascular plants for habitats in the Czech Republic, i.e., lists of species which are potentially able to grow in the habitat. Indices of ecological specialisation (ESI) for species of the Czech flora, which can be used for classification of their degree of threat, are newly published by Zelený and Chytrý [49].
A basic premise of this study is that the current red list of vascular plants in the Czech Republic [22] is not a completely adequate reflection of their actual threat and requires a partial reclassification. However, this is also based on the assumption that the list’s validity is time limited. The aims of the study were: (1) verify the possibility of using data on habitat quality from the Natura 2000 mapping project to classify the degree of threat to selected (pilot) species in the Czech Republic; (2) verify whether the data on habitats contained in the habitat mapping layer [50] can be used to specify the relationship of a particular species to habitat, population dynamics and subsequently degree of threat; (3) verify whether it is possible to define functional groups of plant taxa according to their level of threat.
As interesting habitat types, with the occurrence of threatened species, the following were selected:
- (1)
- Aluvia of large rivers tend to be centres of biodiversity and their species richness often exceeds the surrounding higher habitats [51,52]. The undeniable importance of the floodplain ecosystem is officially confirmed by the Ramsar Convention on Wetlands [53] and some floodplain habitats have also been included among the priority habitats within the Natura 2000 system [32]. The floodplain has a high degree of habitat diversity as well as natural and anthropogenic disturbances. They are associated with a very dynamic course of subsequent succession [54,55]. These areas have long been under strong anthropogenic pressure, mainly due to agricultural use and the supply of nutrients through floods. Floodplain habitats are also invaded by non-native species, which significantly affect their species composition and structure [56].
- (2)
- Fen habitats at lower and middle altitudes. These are usually small-scale habitats that are rare in the landscape. Degradation of these habitats is mainly caused by drainage, succession, afforestation, eutrophication and abandonment of traditional farming [32]. Fen habitats are very sensitive to changes in hydrogeological conditions, especially those caused by humans [35]. They are refuges of many threatened plant species that are rare and very sensitive to changes in water regime, nutrient concentrations or management [57,58]. These species are usually not competitive and disappear rapidly with increased nutrient intake due to competitively stronger species [59]. This easily leads to a change in different types of meadow vegetation and subsequently to overgrowth by the forest.
- (3)
- Ecotone shrub habitats. These are habitats that usually form a vegetation mosaic with dry lawns. In these habitats, the so-called ecotonal effect is manifested—fringe communities tend to be species-richer than related communities [60,61]. Degradation is mainly caused by overgrowth and eutrophication. However, the occurrence of overgrowth trees in dry grasslands cannot be considered exclusively undesirable. Habitat heterogeneity increases with reasonable shading and mosaicity and preservation of mowing, grazing and occasional partial pruning [60,62,63], but overgrowth of the shrub layer may have a negative effect on species richness [63]. The influence of management is also significant; mowed or grazed stands have greater species richness [64,65,66,67].
2. Material and Methods
The basic data source for the quality of habitats in the Czech Republic is the habitat mapping layer (HML) [50], in which segments (polygons) are its basic unit. During the data collection directly in the field, both floristic data and data on the quality and structure of the given habitat are acquired for each segment. The following attributes are assessed by habitat mapping: (a) Representativeness of the habitat, (b) spatial and age structure of the tree and shrub layer (only for scrub and forests), (c) quantity of deadwood (only for forests), (d) degree of habitat degradation, (e) significance of the habitat on a regional scale (occurrence of threatened and phytogeographically interesting plant species), (f) habitat structure and functions. For more details on the assessed attributes and habitat mapping methodology, see Lustyk [68,69].
The direct relationship of vascular plants to a particular segment (habitat) allows us to work with the acquired data and find out the state (quality) of the habitats where the given plant species grows. This information was used to determine the degree of threat to the selected taxa or their (functional) groups. These data were concentrated for each selected taxon and each habitat in which they occur: locality, geographical coordinates (in WGS 84), grid mapping quadrant [70], author of the record, year of find, habitat type, habitat degradation, habitat structure and functions (Habitat degradation and its structure and functions are the parameters on the basis of which habitat quality is determined [71]), polygon ID, habitat quality (see Table 1).
Data were collected, modified, supplemented and reduced (multiple and unusable data, i.e., insufficiently accurate). Species databases have been created. These were supplemented by targeted field research. Its aim was to verify some occurrences of selected species and to supplement data on habitats where it was not available in the foundation database of habitats also [22]. The data were divided into time intervals. Only subrecent and recent data were used for further processing, i.e., approximately from 1980 to the present. In exceptional cases, even older data (between 1970 and 1980), but only if their location was unambiguous and accurate.
Data on the occurrence of plant species from the Natura 2000 habitat mapping project can be identified with specific habitats and determine their quality. We used two pieces of basic information on habitat parameters to determine the habitat quality: habitat degradation and habitat structure and functions [71].
Data on the occurrence of plant species from sources other than habitat mapping were assigned to specific habitats via coordinates (HML). In some cases, however, this was not possible because occurrences were either located in the non-mapped area (in the HML there is no information on the occurrence of habitats at the given site) or in an area with more than one habitat, so that an unambiguous assignment was not possible. Habitat data are missing for these occurrences, so they were assigned a quality value of 0 (= unknown).
Based on the collected data, two types of maps were created for each selected plant species: (1) map of the level of knowledge of its habitat quality; (2) map of its habitat quality. The database of plant species records was converted to a spatial geodatabase and projected into the S-JTSK Krovak East North coordinate system. All collected attributes were unified. Spatial data were further spatially overlayed with a predefined grid of 10 × 10 km squares covering the entire area of the Czech Republic. Maps of the level of knowledge of the habitat quality and maps of the habitat quality were generated using a proper set of marks based on multiple characters.
Using the Pearson’s Chi-squared test, the homogeneity of the frequency of occurrence of selected species in habitats of different quality (p < 0.01) was tested. Differences in incidence between species were determined using the post-hoc Pearson’s Chi-squared test and divided into groups (listed in Table 2, column Group).
Data Sources
The basic sources for obtaining floristic data were NDOP (Species Occurrence Database, 2019), Database of the Czech flora and vegetation [30], selected herbarium collections in the Czech Republic—PR, PRC, BRNM, BRNU, MP, HR—according to Thiers [72]). In addition, selected literary sources were used for supplementation [73,74,75]. Data on selected species from 1980 to the present (in exceptional cases also data from the period 1970–1980) have been collected. The source of data on habitats and their quality is the Habitat Occurrence Database [31], which contains data on habitats from the projects Habitat and Landscape Mapping of the Czech Republic (2000–2004) and Habitat Mapping Update (2006–present).
The floristic data on the selected species are of two types:
- (1)
- Floristic data from habitat mapping projects. Data on the occurrence of individual species can thus be precisely linked to the occurrence of specific habitats,
- (2)
Selected Species, Their Numbers of Occurrences and Relation to Habitats
A total of nine species were selected for evaluation (Cardamine matthioli, Carex appropinquata, C. cespitosa, C. lepidocarpa, Gratiola officinalis, Rosa agrestis, R. micrantha, R. spinosissima and Teucrium scordium). The main criterion for the selection of these species was their relation to the same or similar habitats. Three habitat categories were selected: (1) meadows and wetland habitats in the alluvium of large rivers, (2) fen habitats at lower and middle altitudes, (3) ecotone shrub habitats and habitats with potentially high succession rates.
In the selection of taxa, different levels of threat were assessed [22]. The nomenclature of the vascular plants follows Kaplan et al. [76].
- (1)
- Group of plant species with their centre of occurrence in meadows and wetland habitats in alluvia of large rivers (Cardamine matthioli, Gratiola officinalis and Teucrium scordium). These areas have long been under strong anthropogenic pressure, mainly due to agricultural use and the supply of nutrients through floods.
- Cardamine matthioli (ca. 200 occurrences) has its centre of occurrence in the habitat of continental inundated meadows [32]. The species is also present in reed beds of eutrophic still waters, tall-sedge beds, alluvial Alopecurus meadows and hardwood forests of lowland rivers [31]. Of the three species, it is the most tolerant of meadow management (mowing and light fertilisation). However, the species declines due to intensified farming.
- Gratiola officinalis (ca. 130 occurrences) occurs predominantly in continental inundated meadows [32]. It is also present in reed beds of eutrophic still waters, tall-sedge beds and vegetation of exposed fishpond bottoms [31]. The species is sensitive to changes in water regime. Many occurrences have disappeared due to extensive river regulations and drainage of floodplain meadows.
- (2)
- Group of sedges with their centre of occurrence in fen habitats at lower and middle altitudes. These species are differently sensitive to habitat disturbance, especially to changes in water regime and eutrophication (Carex appropinquata, C. cespitosa, C. lepidocarpa).
- Carex appropinquata (ca. 790 occurrences) occurs most often in tall-sedge beds, acidic moss-rich fens and alder carrs [32]. The species may be also present in, e.g., the habitats of reed beds of eutrophic still waters, wet Cirsium meadows, wet Filipendula grasslands, intermittently wet Molinia meadows, ash-alder alluvial forests and waterlogged spruce forests [31].
- Carex cespitosa (ca. 1150 occurrences) occurs in the Czech Republic in tall-sedge beds and wet Cirsium meadows [32]. The species is also present in the habitats of acidic moss-rich fens, wet Filipendula grasslands, intermittently wet Molinia meadows, alder carrs and ash-alder alluvial forests [31]. It also occurs on unmaintained meadows, where it can form connected stands of large (up to 1.5 m high) tussocks which may block further succession. It is the most abundant of the three sedges and the most tolerant of habitat changes.
- Carex lepidocarpa (ca. 130 occurrences) occurs mainly in springs (habitats of meadow springs with tufa formation and meadow springs without tufa formation), marginally in calcareous fens with Cladium mariscus [32]. In the Czech Republic it also grows in acidic moss-rich fens, wet Cirsium meadows and intermittently wet Molinia meadows [31]. It is the most sensitive to changes in the environment and therefore also the rarest of the selected Carex species.
- (3)
- Group of chamaephytes (Rosa agrestis, R. micrantha and R. spinosissima) with frequent occurrence in the ecotone shrub habitats and habitats with potentially high succession rates (e.g., dry grasslands), where in addition, due to their growth in the absence of appropriate management, degradation of these habitats can occur. The rarest of them in the Czech Republic is Rosa micrantha, Rosa spinosissima is more abundant, and the most common is R. agrestis. Data based on the herbarium specimens of larger herbaria of the Czech Republic (BRNM, BRNU, PR, PRC) have been revised by P. Maděra (Mendel Univ. in Brno).
- Rosa agrestis (ca. 390 occurrences) occurs predominantly in tall mesic and xeric scrub [32], but often also in various herbaceous habitats (e.g., rock-outcrop vegetation with Festuca pallens, narrow-leaved dry grasslands, broad-leaved dry grasslands, acidophilous dry grasslands, mesic herbaceous fringes, acidophilous grasslands on shallow soils) or in open forests: central European basiphilous thermophilous oak forests, acidophilous thermophilous oak forests, dry acidophilous oak forests and forest-steppe pine forests [31].
- Rosa micrantha (ca. 50 occurrences) has its centre of occurrence in the habitat of tall mesic and xeric scrub [32]. The species is also present in herbaceous habitats such as narrow-leaved dry grasslands, broad-leaved dry grasslands, acidophilous dry grasslands, mesic herbaceous fringes, edges of ravine forests and acidophilous thermophilous oak forests [31].
Rosa spinosissima (ca. 250 occurrences) occurs predominantly in low xeric scrub [32]. Furthermore, it occurs at a lower frequency in a whole range of mainly grassland habitats: Sesleria grasslands, narrow-leaved dry grasslands, broad-leaved dry grasslands, acidophilous dry grasslands, dry herbaceous fringes, dry lowland and colline heaths [31].
3. Results
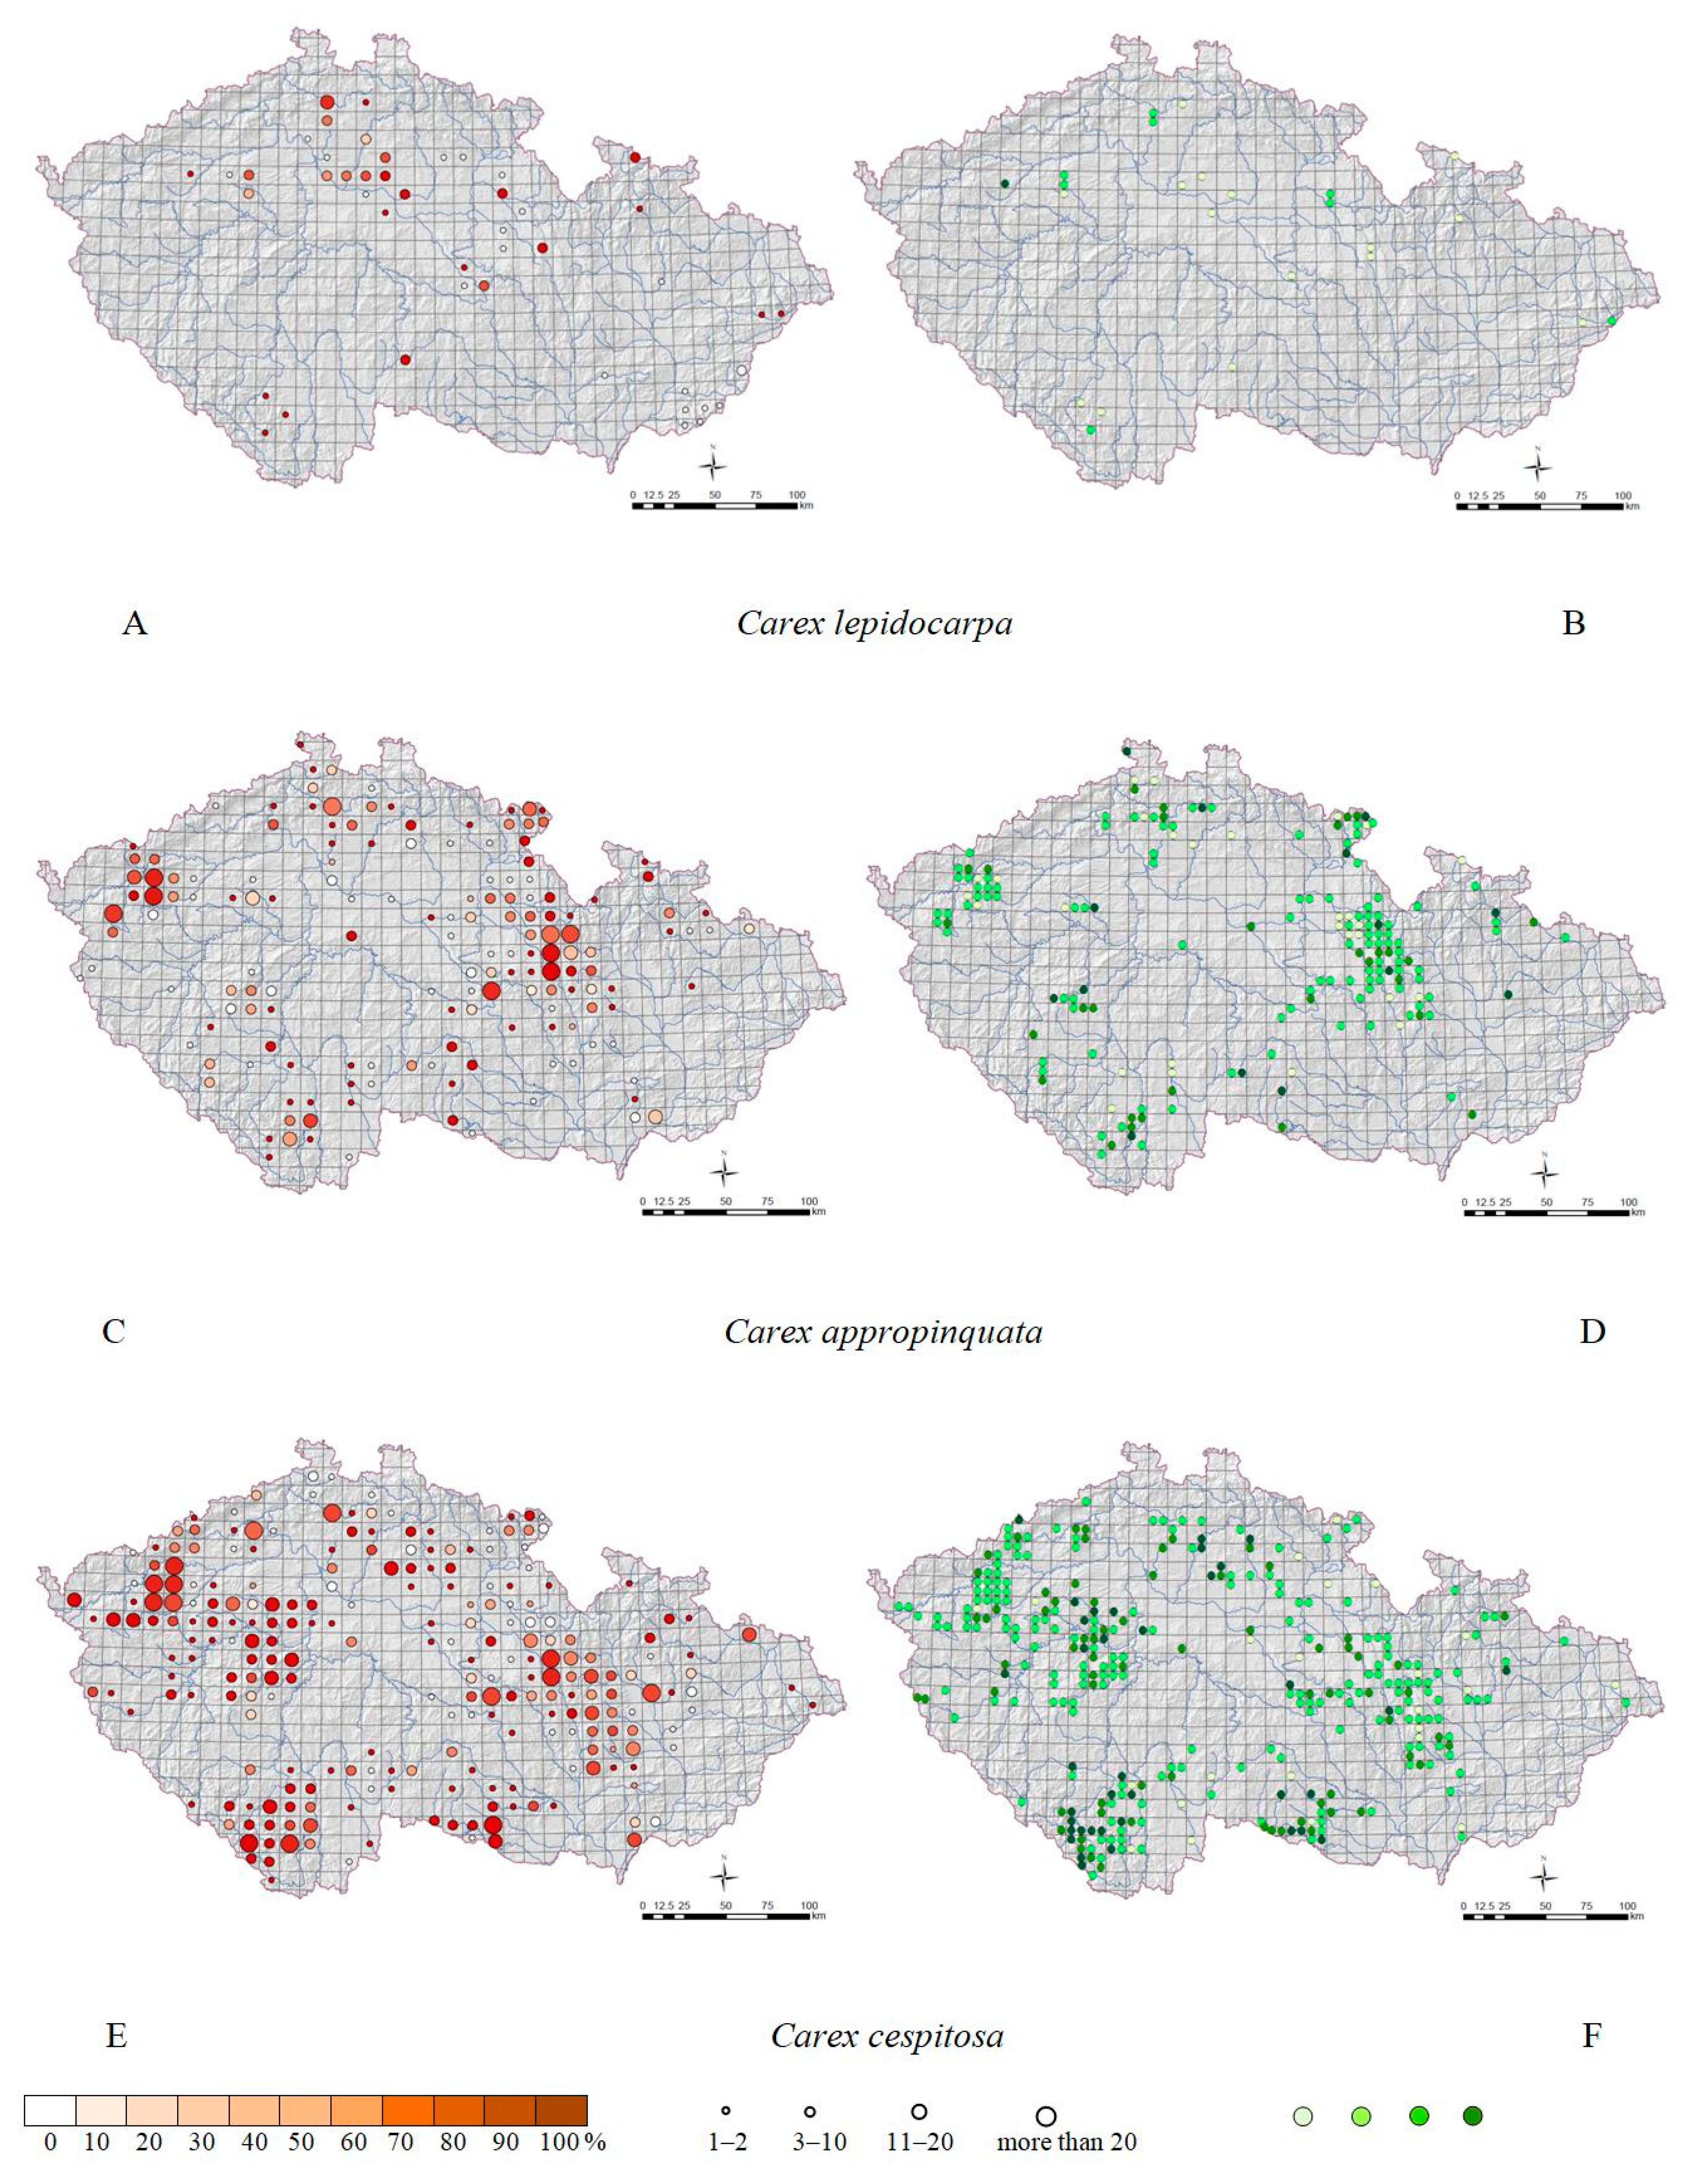
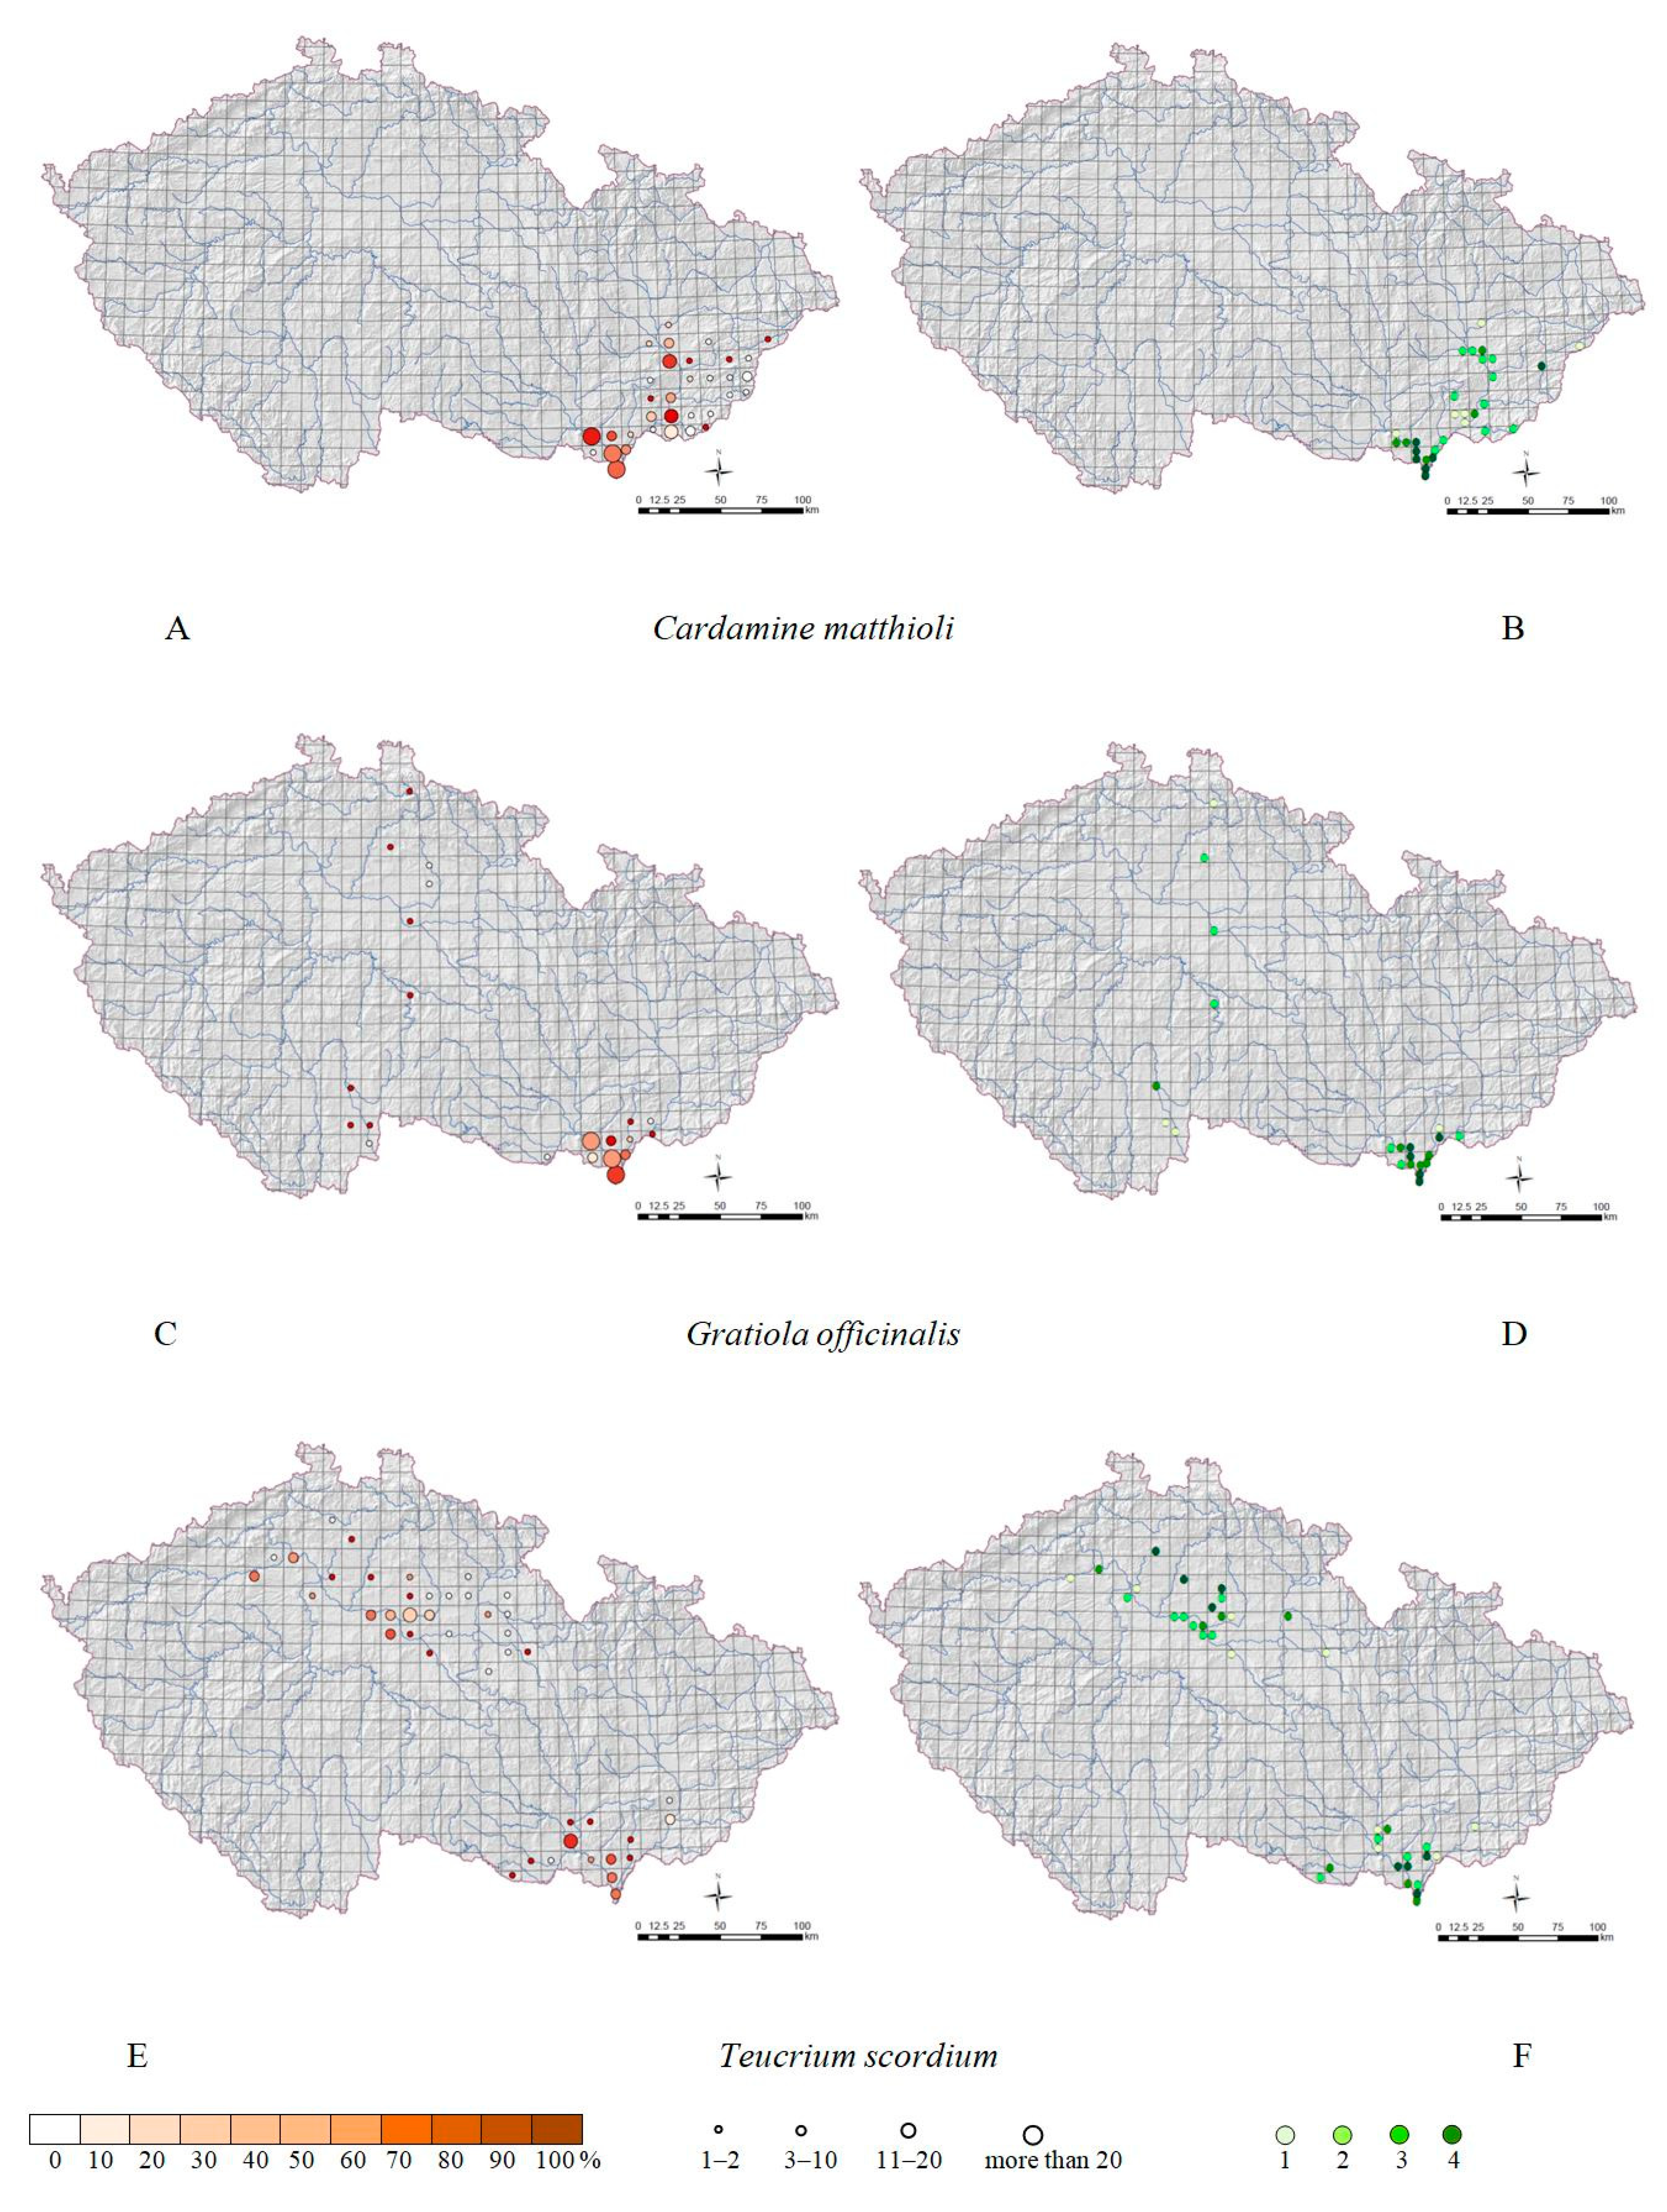
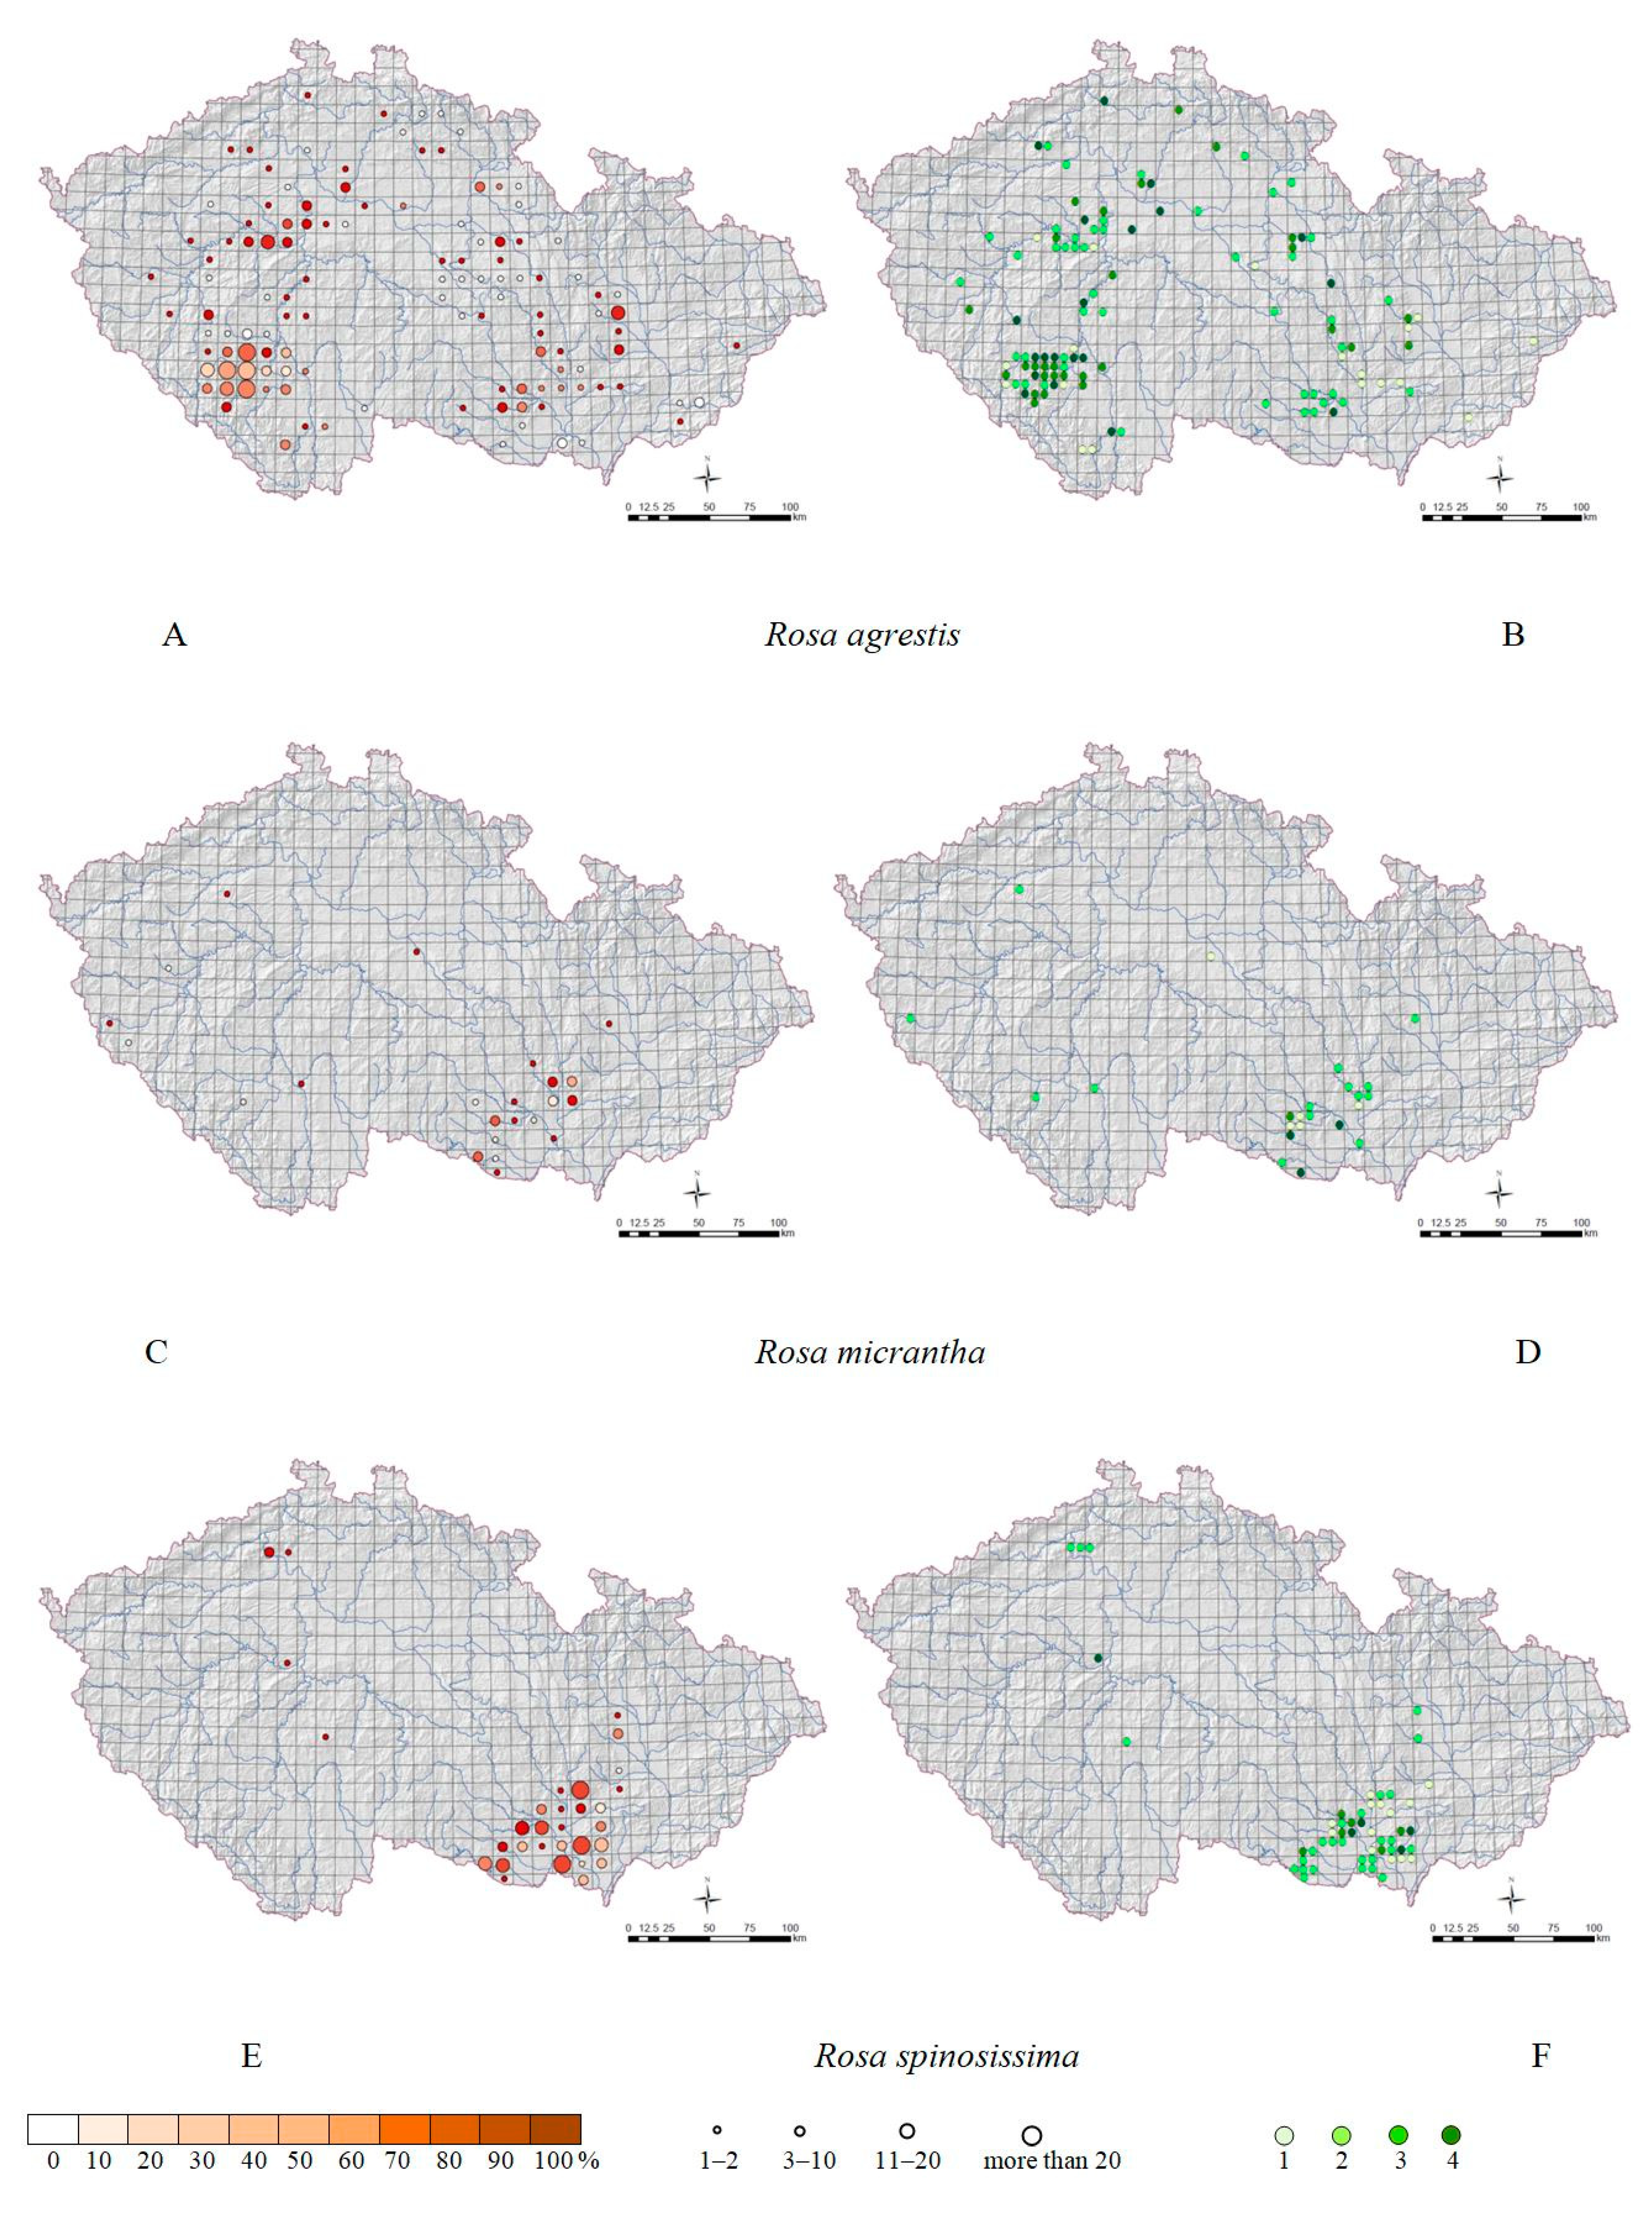
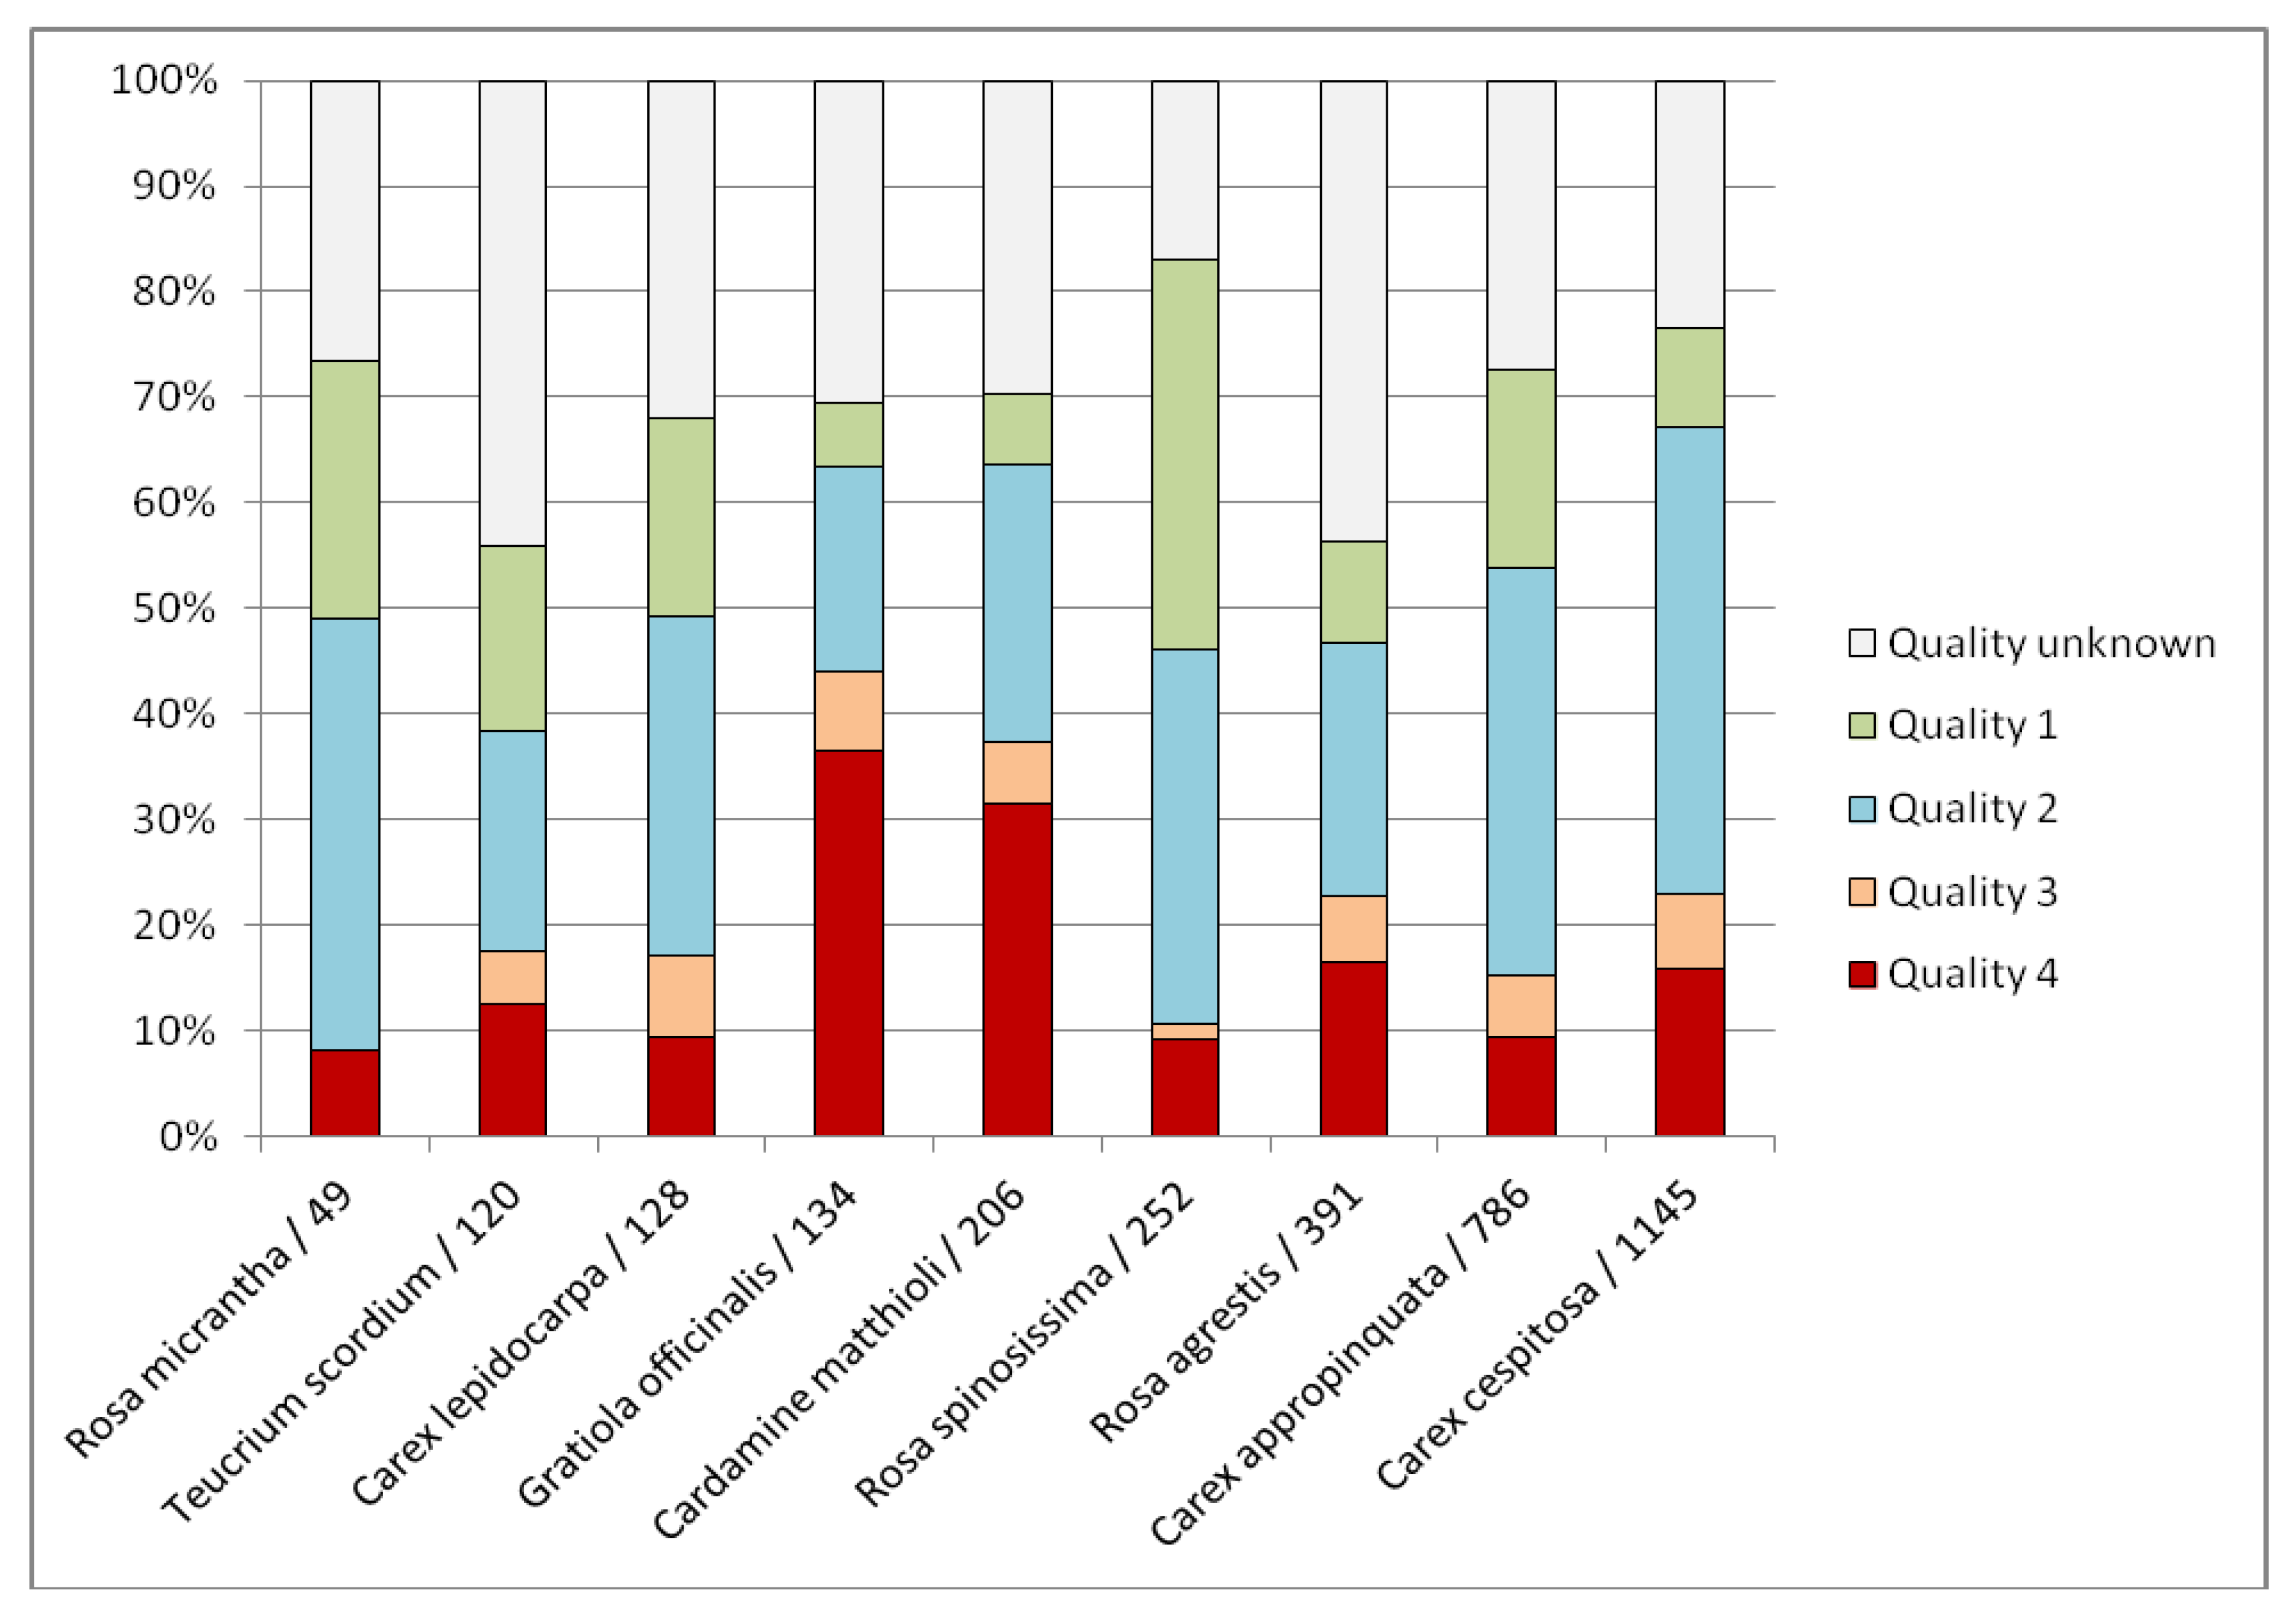
Based on the determined habitat quality for individual occurrences of the selected plant species, grid maps were created, which present (1) the level of knowledge of habitat quality, (2) the average habitat quality (Figure 1, Figure 2 and Figure 3). The percentages of occurrences of selected species in the quality categories is shown in the graph (Figure 4).
3.1. Map of the Level of Knowledge of Habitat Quality
These maps show (in the 10 × 10 km map grid) the ratio between the number of occurrences of plant species for which the habitat quality can be determined and the number of occurrences for which it cannot be determined. It is obvious that, especially in species with a large number of occurrences, such as Carex cespitosa, there are still a large number of occurrences for which we have no data on the habitat quality (the species occurrence outside the habitat is indicated by empty circle in the map). For rarer species, on the other hand, the knowledge of habitat quality is relatively favourable.
3.2. Map of Habitat Quality
These maps show the average quality of the habitat in which the plant species occurs in the map grid (10 × 10 km) divided into quadrants 5 × 5 km. The map does not show occurrences for which the habitat quality is unknown. The predominance of habitat of poor quality is evident, for example, in Gratiola officinalis, while the habitat quality for roses (Rosa agrestis, R. micrantha, R. spinosissima) is relatively high.
Using the Chi-squared test (significance level p < 0.01), the homogeneity of the frequency of occurrence of the selected species in habitats with different degrees of quality was tested. Differences between particular species were determined and sorted according to the test results (Table 2, column Group) in order to define the so-called ‘functional groups of species’ with a similar habitat quality distribution. Subsequently, the current classification of the selected plant species into categories of threat in the red list [22] was compared with the distribution of the quality of their habitats.
The species Carex appropinquata, Rosa agrestis, R. spinosissima, Carex lepidocarpa and Teucrium scordium, and further Cardamine matthioli and Gratiola officinalis have a similar distribution of habitat quality levels. The species Rosa micrantha and Carex cespitosa have a dissimilar quality distribution. In assessing the degree of threat to individual plant species, in addition to the distribution of their habitats’ quality, the total number of occurrences must also be taken into account.
Carex appropinquata, although having a habitat quality distribution similar to e.g., Carex lepidocarpa, has about six times as many occurrences. Therefore, the threat level of this species [22] corresponds to degree C3/NT and also to the test results.
For Rosa agrestis, almost half of all known occurrences are in habitats of unknown quality and the proportion of occurrences in habitats of low quality is also significant (22%). The actual level of threat to the species is likely to be higher than reported by Grulich [22], but the addition of more accurate data on the habitats in which the species occurs is necessary for such a decision.
In Rosa spinosissima, the fact that it occurs very often in protected areas is reflected in the distribution of its habitat quality. This is also why the number of occurrences in habitats of unknown quality is very low (17%) and at the same time the percentage of occurrences in habitats of higher quality is high (72%). The level of threat [22] corresponds to the current situation and also to the test results.
Carex lepidocarpa and Teucrium scordium have a relatively high proportion of occurrences in habitats of higher quality (51% and 46%). However, they also have a rather high proportion of habitats of unknown quality (41% and 53%). For specification of their degree of threat, it is therefore necessary to supplement more accurate data on their habitats; however, the current level C2/EN [22] corresponds to reality and also to the test results.
About a third of all occurrences of Gratiola officinalis are in habitats of the lowest quality. There is also a high proportion of occurrences for which we do not know the habitat quality. Classification in category C2/EN corresponds to the present degree of threat to the species and also to the test results.
For Rosa micrantha, according to available sources, the total number of known sites is relatively low. In addition, it is a species occurring in ecotonal communities (tall mesic and xeric scrub) and its protection lies in the conservation of vegetation mosaics. Its current degree of threat is probably higher than stated by Grulich [22].
The species Carex cespitosa and Cardamine matthioli are currently included in the red list in the C4a/NT category [22] but differ fundamentally in the total number of occurrences. Other differences are their biology and relationship to habitats. Carex cespitosa is a species which can survive in wet meadows without any management for a long time and even expand in these habitats. The quality of its habitat indicates its degree of threat to just a certain extent. On the contrary, Cardamine matthioli occurs in mowed floodplain meadows and recedes in the absence of management. In addition, a high proportion of occurrences in habitats of the lowest quality could indicate its current underestimated classification in the C4a/NT category.
4. Discussion
One of the basic evaluation parameters for the creation of a red list of plant species should be the quality of the habitat in which plant species occur.
However, this aspect is currently neglected and the current categorisation of degree of threat to vascular plant species is primarily based on criteria concerning number of localities and population size. Only in the case of IUCN criterion B2 (area of occupancy) subcriterion B2b (continuing decline in area, extent and quality of habitat, [77]) is defined. This subcriterion combines both the decrease in habitat area and its quality, which may not always be directly related. In addition, the use of this subcriterion is only based on empirical assessment. In the red list of vascular plants in the Czech Republic [22], this subcriterion was used to classify 356 taxa from a total of 908 plant species into categories critically endangered (CR), endangered (EN) and vulnerable (VU). For categories extinct (EX) and regionally extinct (RE), its use is irrelevant. If the assessed taxon does not reach the limit value for any criterion (and thus also for subcriterion B2b), it is included in one of the lower threat categories, e.g., near threatened (NT), least concern (LC) or data deficient (DD) [77].
Just an empirical assessment of the B2b subcriterion is insufficient for the vast majority of the evaluated species, especially for less threatened species. Assessment of habitat quality for such species, based on more accurate data, can yield surprising results, such as in the case of Cardamine matthioli. This species is evaluated as C4a/NT, but has a similar distribution of habitat quality levels as Gratiola officinalis (C2t/EN). Although it has a higher number of occurrences and more numerous populations, its evaluation in the given category is probably underestimated.
For some plant species, their habitat quality, based on the parameters of habitat degradation and habitat structure and functions, may not be, at the first sight, related directly to their threat or to the threat to a species population in a particular habitat. The habitat fragmentation and isolation can also have a significant effect on the decline of populations of threatened species, and habitat quality may not decrease and nevertheless, threatened species may gradually disappear from localities [78]. However, the process of fragmentation and isolation will usually affect the quality of the habitat over time, e.g., by an edge effect—these changes can be captured by mapping habitats, mainly through the parameter structure and function, or by reduced evaluation of this parameter.
For example, Carex cespitosa may have an expansive character in the habitat of wet Cirsium meadows and the species therefore thrives at the locality, but the quality of these habitats can be assessed as poor in terms of species diversity and physiognomy of the stand. However, the advancing succession can cause overgrowing the habitat with shrubs and trees, which may also result in a final weakening of the Carex cespitosa population.
The quality of dry grasslands (narrow-leaved and broad-leaved dry grasslands) which are overgrown with shrubs such as Rosa agrestis or R. micrantha can be assessed in a similar way. These species cause degradation of these habitats, although the populations of these roses are thriving just because of the partial absence of management. However, further succession and a higher proportion of shrubs and trees cause a decrease in habitat diversity [63] and eventually the disappearance of these roses.
Data on habitat quality cannot therefore be used in the same manner for all species. This parameter is very important for species sensitive to overall habitat degradation, as well as for species associated with microhabitats and specific conditions, e.g., root parasites in the genus Thesium [79]. On the other hand, for many species (rare field weeds, rare species of disturbed habitats, species of ecotones, species occurring in dynamic habitats—e.g., gravel and muddy river banks, exposed fishpond bottoms) its use is very limited or has no sense because the populations size and vitality of these species may not be related to habitat quality or only marginally.
Just as it has been compared on the basis of extensive vegetation surveys of habitats of common and rare species in central England [80], determining habitat quality [71] provides a new perspective on the degree of threat to individual plant species. Many rare and potentially threatened species are restricted to lowland and mid-altitude areas, which are used by agriculture. Where are the pressures to greatest change land use? Rare species are concentrated in less fertile habitats, and often occur in relict ones. Many rare species have a narrow ecological valence, some appear to be limited to “transitional” habitats (e.g., ecotones). It is these localities that should be the aim of habitat mapping, which provides information about their quality.
Very rare species and their habitats are relatively often studied. The degree of threat to less rare and so-called common species can be interpreted in terms of the availability of suitable habitats and their quality thanks to habitat mapping. The so-called Habitat Directive (Council Directive 92/43EEC on the conservation of natural habitats and wild fauna and flora) assesses, among other things, the status of European important species in terms of their protection. This is done by (a) population dynamics data on the species, (b) the natural range of the species, (c) sufficiently large habitat to maintain its populations for on a long-term basis. In terms of their threat, they determine only their major threats, however, level of the habitat’s quality can provide more accurate information on the degree of threat to the species.
For nature conservation is very important the detection of the threatened species localities for which we do not have sufficient information about the quality of the habitats in which they grow, i.e., no habitat is recorded in the HML at the site of their occurrence. Therefore, emphasis should be placed on further data collection, creation of species databases, their continuous supplementation and updating, which should always precede the assessment of the degree of threat to a species. It is the high proportion of occurrences with unknown habitat quality data (e.g., Rosa agrestis and Teucrium scordium) which points to this shortcoming.
In the future, the set of threatened species could be divided into groups according to the number of current occurrences. Within each group, it is then possible to compare the ratios of quality levels of the habitats in which these species occur and determine ‘functional groups’. Such a categorisation could be used to determine the degree of threat to the taxa, of course connected to other characters relating to this process (e.g., population size and its trend, extent of occurrence, number of localities, population dynamics).
If in the future we assess the degree of threat to plant species also on the basis of the habitats quality in which they occur, it is necessary:
- (a)
- The creation and updating of species databases, as a necessary basis for creation of any red list. The compilation of these databases for species with a larger number of occurrences will be particularly problematic and laborious. Current floristic databases contain large amounts of data, but some of them are inaccurate or even incorrect. Above all, however, it is often data of a multiple character, and it cannot be used;
- (b)
- Maximum spatial accuracy of floristic data, which is necessary for their unambiguous assignment to the polygon with the given habitat. It is problematic to meet this requirement in a situation where there is a high habitat heterogeneity that are mapped in a mosaic at a given site.
The use of this method is especially suitable for species with a higher number of localities. We usually do not know their exact or at least approximate number and today we only empirically estimate the degree of the species threat. It is absolutely essential to use the habitat quality to detect the degree of threat to the so-called common species, which today are outside the red list.
It should be emphasized that for some species the use of this method is problematic (e.g., rare archaeophytic weeds, rare ruderal species, etc.), because the habitat quality is not directly related to the size and vitality of their populations. In addition, habitats of these species are mapped rarely, so they are included in the database only exceptionally and usually without the parameters needed to determine their quality.
5. Conclusions
The habitats quality is a very important criterion in determining the degree of threat to vascular plant species and the subsequent compilation of a national red list. In the Czech Republic, thanks to the habitat mapping project, a lot of data on the quality of habitats is available, as well as a large amount of floristic data in national electronic databases. The analysis of these data sets can provide a more objective and detailed view of the degree of threat to rare species and the detection of possible threats to so-called common species, where so far only empirical assessment has been used. This assessment may be useful in compiling another updated red list of vascular plants of the Czech Republic.
Author Contributions
P.L. designed the study and wrote the manuscript. P.V. conducted the GIS analyses of input data. All authors have read and agreed to the published version of the manuscript.
Funding
This research received no external funding.
Institutional Review Board Statement
Not applicable.
Informed Consent Statement
Not applicable.
Data Availability Statement
The data presented in this study are available on request from the corresponding author. The data are not publicly available due to limited access to databases of Czech habitat mapping results.
Acknowledgments
Authors thank Radomír Řepka for valuable advice and comments, Lubomír Tichý for help with the data processing and the Nature Conservation Agency in Prague (Michal Ferenc, Pavla Klabanová, Zdeněk Kučera) for providing data from the mapping of habitats in the Czech Republic and the data from the NDOP database used in this study. Authors also thank the anonymous reviewers for their comments and recommendations.
Conflicts of Interest
The authors declare no conflict of interest. The founding sponsor had no role in the design of the study, in the collection, analyses or interpretation of data and in the writing of the manuscript.
References
- Fischer, J.; Simon, N.; Vincent, J. The Red Book. Wildlife in Danger; Collins: London, UK, 1969; p. 368. [Google Scholar]
- Janssen, J.A.M.; Rodwell, J.S.; García, C.M.; Gubbay, S.; Haynes, T.; Nieto, A.; Sanders, N.; Landucci, F.; Loidi, J.; Ssymank, A.; et al. European Red List of Habitats—Part 2. Terrestrial and Freshwater Habitats; Publications Office of the European Union: Luxembourg, 2016; p. 38. ISBN 978-92-79-61588-7. [Google Scholar]
- IUCN. IUCN Red List Categories and Criteria. Version 3.1., 2nd ed.; IUCN Species Survival Commission: Gland, Switzerland, 2012; p. 32. ISBN 978-2-8317-1435-6. [Google Scholar]
- IUCN. Guidelines for the application of IUCN Red List of Ecosystems Categories and Criteria; Bland, L.M., Keith, D.A., Miller, R.M., Murray, N.J., Rodríguez, J.P., Eds.; Version 1.1; IUCN: Gland, Switzerland, 2017; p. 99. ISBN 978-2-8317-1769-2. [Google Scholar]
- IUCN. The IUCN Red List of Threatened Species. 2020. Available online: http://www.iucnredlist.org/ (accessed on 15 September 2008).
- Gärdenfors, U. Classifying Threatened Species at National versus Global Levels. Trends Ecol. Evol. 2001, 16, 511–516. [Google Scholar] [CrossRef]
- Gärdenfors, U.; Hilton-Taylor, C.; Mace, G.; Rodríguez, J.P. The Application of IUCN Redlist Criteria at Regional Levels. Conserv. Biol. 2001, 15, 1206–1212. [Google Scholar] [CrossRef]
- IUCN. Guidelines for Application of IUCN Red List Criteria at Regional and National Levels; Version 4.0; IUCN Species Survival Commission: Gland, Switzerland, 2012; p. 41. ISBN 978-2-8317-1247-5. [Google Scholar]
- Bilz, M.; Kell, S.P.; Maxted, N.; Lansdown, R.V. European Red List of Vascular Plants; Publications Office of the European Union: Luxembourg, 2011. [Google Scholar]
- Eliáš, P., Jr.; Dítě, D.; Kliment, J.; Hrivnák, R.; Feráková, V. Red List of Ferns and Flowering Plants of Slovakia, 5th ed. (October 2014). Biológia 2015, 70, 218–228. [Google Scholar]
- Kaźmierczakowa, R.; Bloch-Orłowska, J.; Celka, Z.; Cwener, A.; Dajdok, Z.; Michalska-Hejduk, D.; Pawlikowski, P.; Szczęśniak, E.; Ziarnek, K. Polska czerwona lista paprotników i roślin kwiatowych. Polish Red List of Pteridophytes and Flowering Plants; Instytut Ochrony Przyrody Polskiej Akademii Nauk: Kraków, Poland, 2016; p. 44. ISBN 978-83-61191-88-9. [Google Scholar]
- Király, G. (Ed.) Vöros Lista. A Magyarországi Edényes Flóra Veszélyeztetett Fajai (Red List of Vascular Flora of Hungary); Saját kiadás: Sopron, Hungary, 2007; p. 73. ISBN 978-963-06-2774-0. [Google Scholar]
- Oltean, M.; Negrean, G.; Popescu, A.; Roman, N.; Dihoru, G.; Sanda, V.; Mihailescu, S. Lista Rosie a Plantelor Superioare Din România (Red List of Higher Plants of Romania); Studii, Sinteze, Documentatjii de Ecologie; Institutul de Biologie: Bucharest, Romania, 1994; Volume 1, pp. 1–52. [Google Scholar]
- Schnittler, M.; Günther, K.-F. Central European Vascular Plants Requiring Priority Conservation Measures—An Analysis from National Red Lists and Distribution Maps. Biodivers. Conserv. 1999, 8, 891–925. [Google Scholar] [CrossRef]
- Turis, P.; Eliáš, P., Jr.; Schmotzer, A.; Király, G.; Schneider, E.; Kuciel, H.; Szewczyk, M.; Kozurak, A.; Antosyak, T.; Voloshchuk, M.; et al. Red List of Vascular Plants of the Carpathians. In Carpathian Red List of Forest Habitats and Species. Carpathian List of Invasive Alien Species (Draft); Kadlečík, J., Ed.; The State Nature Conservancy of the Slovak Republic: Banská Bystrica, Slovakia, 2014; pp. 44–105. ISBN 978-80-89310-81-4. [Google Scholar]
- Schippmann, U. Bibliography of National Red Lists for Vascular Plants; BfN-Skripten 547: Bonn, Germany, 2019; p. 30. ISBN 978-3-89624-285-3. [Google Scholar]
- Holub, J. Stupnice a kritéria ohrožení užívané v červených seznamech [Threat Scales and Criteria Used in the Red Lists]. In Červené seznamy ohrožené květeny České a Slovenské republiky; Kubát, K., Ed.; Severočes. Přír., Northern Bohemian Branch of the Czech Botanical Society: Litoměřice, Czech Republic, 1996; Volume 9, pp. 7–14. [Google Scholar]
- IUCN. IUCN Red List Categories and Criteria; Version 3.1; IUCN Species Survival Commision: Gland, Switzerland; Cambridge, UK, 2001; p. 30. ISBN 978-2-8317-0633-7. [Google Scholar]
- Holub, J.; Procházka, F.; Čeřovský, J. Seznam Vyhynulých, Endemických a Ohrožených Taxonů Vyšších Rostlin Květeny ČSR (1. verze) [List of Extinct, Endemic and Threatened Taxa of Vascular Plants of the Flora of the Czech Socialist Republic (First Draft)]. Preslia 1979, 51, 213–237. [Google Scholar]
- Holub, J.; Procházka, F. Red List of Vascular Plants of the Czech Republic—2000. Preslia 2000, 72, 187–230. [Google Scholar]
- Grulich, V. Red List of Vascular Plants of the Czech Republic: 3rd ed. Preslia 2012, 84, 631–645. [Google Scholar]
- Grulich, V. Červený seznam cévnatých rostlin ČR [The Red List of Vascular Plants of the Czech Republic]. In Červený seznam ohrožených druhů České republiky, Cévnaté rostliny; Grulich, V., Chobot, K., Eds.; Příroda, Agency of Nature Conservation and Landscape Protection of the Czech Republic: Prague, Czech Republic, 2017; Volume 35, pp. 75–132. [Google Scholar]
- Čeřovský, J. Zásady Výběru Druhů Pro Ochranu [Principles for Selection of Protected Species]. Studie ČSAV 1981, 20, 17–22. [Google Scholar]
- Camaclang, A.E.; Maron, M.; Martin, T.G.; Possingham, H.P. Current Practices in the Identification of Critical Habitat for Threatened Species. Conserv. Biol. 2015, 29, 482–492. [Google Scholar] [CrossRef] [Green Version]
- Machová, I.; Prchalová, J. Botanické hodnocení území za použití geografického informačního systému [Using GIS for the Botanical Assesment of an Area]. Příroda 2001, 19, 77–85. [Google Scholar]
- Krahulec, F. Zastoupení ohrožených druhů ve společenstvech: Srovnání červených seznamů druhů a společenstev [Representation of Endangered Species in Plant Communities: Comparison of Red Lists of Species and Communities]. In Červené Seznamy Ohrožené Květeny České a Slovenské Republiky; Kubát, K., Ed.; Severočes. Přír., Northern Bohemian Branch of the Czech Botanical Society: Litoměřice, Czech Republic, 1996; Volume 9, pp. 101–105. [Google Scholar]
- Moravec, J.; Balátová-Tuláčková, E.; Hadač, E.; Hejný, S.; Jeník, J.; Kolbek, J.; Kopecký, K.; Krahulec, F.; Kropáč, Z.; Neuhäusl, R.; et al. Rostlinná společenstva České socialistické republiky a jejich ohrožení (Red List of plant communities of the Czech Socialist Republic and Their Endangerment). Severočes. Přír. 1983, 1, 1–110. [Google Scholar]
- Blasi, C.; Marignani, M.; Copiz, R.; Fipaldini, M.; Bonacquisti, S.; Del Vico, E.; Rosati, L.; Zavattero, L. Important Plant Areas in Italy: From data to Mapping. Biol. Conserv. 2011, 144, 220–226. [Google Scholar] [CrossRef]
- AOPK ČR. Nálezová Databáze Ochrany Přírody [Species Occurrence Database], Online Database. Agency of Nature Conservation and Landscape Protection of the Czech Republic, Prague. 2019. Available online: https://portal.nature.cz/nd/ (accessed on 31 August 2020).
- PLADIAS. Databáze České Flóry a Vegetace [Pladias—Database of the Czech Flora and Vegetation]. 2019. Available online: http://pladias.cz/ (accessed on 31 August 2020).
- FiNDB. Nálezová Databáze Biotopů [Habitat Occurrence Database], Online Database. Agency of Nature Conservation and Land-scape Protection of the Czech Republic, Prague. 2019. Available online: https://portal.nature.cz/mb/mb_nalez.php?X=X (accessed on 31 August 2020).
- Chytrý, M.; Kučera, T.; Kočí, M.; Grulich, V.; Lustyk, P. (Eds.) Katalog biotopů České republiky (Habitat Catalogue of the Czech Republic), 2nd ed.; Agency of Nature Conservation and Landscape Protection: Prague, Czech Republic, 2010; p. 445. ISBN 978-80-87457-02-3. [Google Scholar]
- Härtel, H.; Lončáková, J.; Hošek, M. (Eds.) Mapování Biotopů v České Republice. In Východiska, Výsledky, Perspektivy [Habitat Mapping in the Czech Republic. Starting Points, Results, Perspectives]; Nature Conservation Agency of the Czech Republic: Praha, Czech Republic, 2009; p. 196. ISBN 978-80-87051-36-8. [Google Scholar]
- Guth, J.; Kučera, T. Natura 2000 Habitat Mapping in the Czech Republic: Methods and General Results. Ekológia 2005, 24, 39–51. [Google Scholar]
- Chytrý, M.; Hájek, M.; Kočí, M.; Pešout, P.; Roleček, J.; Sádlo, J.; Šumberová, K.; Sychra, J.; Boublík, K.; Douda, J.; et al. Red List of Habitats of the Czech Republic. Ecol. Indic. 2019, 106, 105446. [Google Scholar] [CrossRef]
- Pechanec, V.; Machar, I.; Sterbova, L.; Prokopova, M.; Kilianova, H.; Chobot, K.; Cudlin, P. Monetary Valuation of Natural Forest Habitats in Protected Areas. Forest 2017, 8, 427. [Google Scholar] [CrossRef] [Green Version]
- Nowotny, G.; Hinterstoisser, H. Biotopkartierung Salzburg: Kartierungsanleitung; Naturschutz-Beiträge 14/94; Referat 13/02; Naturschutz; Amt der Salzburger Landesregierung: Salzburg, Austria, 1994; p. 247. [Google Scholar]
- Nowotny, G. Praktische Anwendungen der Biotopkartierung in Salzburg (Österreich). Sauteria 1999, 10, 175–186. [Google Scholar]
- Keusch, C.; Kirchmeir, H.; Jungmeier, M. Terrestrial Habitat-Mapping within the Hohe Tauern National Park—Methods and results. In Proceedings of the 4th Symposium of the Hohe Tauern National Park, Kaprun, Austria, 17–19 September 2009; pp. 177–182. [Google Scholar]
- Hoffmann-Kroll, R.; Schäfer, D.; Seibel, S. Landscape Indicators from Ecological Area Sampling in Germany. Agric. Ecosyst. Environ. 2003, 98, 363–370. [Google Scholar] [CrossRef]
- Noss, R.F.; LaRoe, E.T.; Scott, J.M. Endangered Ecosystems of the United States: A Preliminary Assessment of Loss and Degradation; National Biological Service, US Department of the Interior: Washington, DC, USA, 1995; Volume 28, p. 58.
- Godefroid, S.; Koedam, N. Identifying Indicator Plant Species of Habitat Quality and Invasibility as a Guide for Peri-Urban Forest Management. Biodivers. Conserv. 2003, 12, 1699–1713. [Google Scholar] [CrossRef]
- Cousins, S.A.O.; Ihse, M. A Methodological Study for Biotope and Landscape Mapping Based on CIR Aerial Photographs. Landsc. Urban Plan. 1998, 41, 183–192. [Google Scholar] [CrossRef]
- Blab, J.; Riecken, U.; Ssymank, A. Proposal on a Criteria System for a National Red Data Book of Biotopes. Landsc. Ecol. 1995, 10, 41–50. [Google Scholar] [CrossRef]
- Ssymank, A.; Hauke, U.; Rückriem, C.H.; Schröder, E. Das Europäische Schutzgebietssystem Natura 2000: BfN-Handbuch zur Umsetzung der Fauna-Flora-Habitat-Richtlinie (92/43/EWG) und der Vogelschutzrichtlinie (79/409/EWG); Bundesamt für Naturschutz: Bonn-Bad Godesberg, Germany, 1998; p. 560. [Google Scholar]
- Stanová, V.; Valachovič, M. (Eds.) Katalóg Biotopov Slovenska [Habitat Catalogue of the Slovakia]; Daphne, Inštitut Aplikovanej Biológie: Bratislava, Slovakia, 2002; p. 225. ISBN 80-89133-00-2. [Google Scholar]
- Wotavová, K.; Balounová, Z.; Kindlmann, P. Factors Affecting Persistence of Terrestrial Orchids in Wet Meadows and Implications for Their Conservation in a Changing Agricultural Landscape. Biol. Conserv. 2004, 118, 271–279. [Google Scholar] [CrossRef]
- Sádlo, J.; Chytrý, M.; Pyšek, P. Regional Species Pools of Vascular Plants in Habitats of the Czech Republic. Preslia 2007, 79, 303–321. [Google Scholar]
- Zelený, D.; Chytrý, M. Ecological Specialization Indices for Species of the Czech Flora. Preslia 2019, 91, 93–116. [Google Scholar] [CrossRef]
- AOPK CR. Vrstva Mapování Biotopů. Rozšíření Biotopů na Území ČR [Habitat Mapping Layer. Distribution of Habitats in the Czech Republic]. Version 2019. Agency of Nature Conservation and Landscape Protection of the Czech Republic, Prague. 2019. Available online: https://data.nature.cz/ds/21 (accessed on 31 August 2020).
- Naiman, R.J.; Decamps, H.; Mc Clain, M.E. Riparia: Ecology, Conservation, and Management of Streamside Communities; Elsevier: Amsterdam, The Netherlands, 2005; p. 541. [Google Scholar]
- Salek, L.; Sivacioglu, A.; Topacoglu, O.; Zahradnik, D.; Jerabkova, L.; Machar, I. Crowns of Old Remnant Oak Standards. Fresenius Environ. Bulletin 2017, 26, 4023–4032. [Google Scholar]
- Ramsar Convention. Convention on Wetlands of Internationale Importance Especially as Waterfowl Habitat. Final Text Accepted. In Proceedings of the Internationale Conference on the Wertlands and Waterfowl, Ramsar, Iran, 2 February 1971; Available online: https://www.ramsar.org/sites/default/files/documents/library/current_convention_text_e.pdf (accessed on 31 August 2020).
- Huston, M.A. Biological Diversity: The Coexistence of Species on Changing Landscapes; Cambridge University Press: Cambridge, UK, 1995; p. 681. ISBN 0-521-360935. [Google Scholar]
- Měkotová, J.; Šarapatka, B.; Štěrba, O.; Harper, D.M. Restoration of a River Landscape: Biotopes as a Basis for Quantifi-Cation of Species Diversity and Evaluation of Landscape Quality. Ecohydrol. Hydrobiol. 2006, 6, 43–51. [Google Scholar] [CrossRef]
- Pyšek, P.; Prach, K. Plant Invasions and the Role of Riparian Habitats: A Comparison of Four Species Alien to Central Europe. J. Biogeogr. 1993, 20, 413. [Google Scholar] [CrossRef]
- Grootjans, A.P.; Alserda, A.; Bekker, R.E.M.; Janáková, M.; Kemmers, R.F.; Madaras, M.; Stanová, V.; Ripka, J.; van Delft, B.; Wołejko, L. Calcareous Spring Mires in Slovakia; Jewels in the Crown of the Mire Kingdom. In Moore–von Sibirien bis Feuerland (Mires—From Siberia to Tierra del Fuego); Steiner, G.M., Ed.; Stapfia: Linz, Austria, 2005; Volume 85, pp. 97–115. [Google Scholar]
- Hájek, M. Vascular Plants. In Ecology and Palaeoecology of Spring Fens in the Western Part of the Carpathians; Poulíčková, A., Hájek, M., Rybníček, K., Eds.; Palacký University Olomouc: Olomouc, Czech Republic, 2005; pp. 63–68. ISBN 80-244-1071-0. [Google Scholar]
- Wassen, M.J.; Olde Venterink, H.; Lapshina, E.D.; Tanneberger, F. Endangered Plants Persist under Phosphorus Limitation. Nature 2005, 437, 547–551. [Google Scholar] [CrossRef]
- Kollmann, J.; Poschlod, P. Population Processes at the Grassland-Scrub Interface. Phytocoenologia 1997, 27, 235–256. [Google Scholar] [CrossRef]
- Łuczaj, L.; Sadowska, B. Edge Effect in Different Gross of Organisms: Vascular Plants, Bryophyte and Fungi Species Richness across a Forest–Grassland Border. Folia Geobot. 1997, 32, 343–353. [Google Scholar] [CrossRef]
- Baba, W. The Species Composition and Dynamics in Well-Preserved and Restored Calcareous Xerothermic Grasslands (South Poland). Biologia 2004, 59, 447–456. [Google Scholar]
- Pykälä, J.; Luoto, M.; Heikkinen, R.K.; Kontula, T. Plant Species Richness and Persistence of Rare Plants in Abandoned Semi-natural Grasslands in Northern Europe. Basic Appl. Ecol. 2005, 6, 25–33. [Google Scholar] [CrossRef]
- Kahmen, S.; Poschlod, P.; Schreiber, K.F. Conservation Management of Calcareous Grasslands. Changes in Plant Species Composition and Response of Functional Traits during 25 Years. Biol. Conserv. 2002, 104, 319–328. [Google Scholar] [CrossRef]
- Jacquemyn, H.; Van Mechelen, C.; Brys, R.; Honnay, O. Management Effects on the Vegetation and Soil Seed Bank of Calcareous Grasslands: An 11-Year Experiment. Biol. Conserv. 2011, 144, 416–422. [Google Scholar] [CrossRef]
- Poschlod, P.; Hoffmann, J.; Bernhardt-Römermann, M. Effect of Grassland Management on the Age and Reproduction Structure of Helianthemum Nummularium and Lotus Corniculatus Populations. Preslia 2011, 83, 421–435. [Google Scholar]
- Vassilev, K.; Pedashenko, H.; Nikolov, S.C.; Apostolova, I.; Dengler, J. Effect of Land Abandonment on the Vegetation of Upland Semi-natural Grasslands in the Western Balkan Mts, Bulgaria. Plant Biosyst.—Int. J. Deal. Asp. Plant Biol. 2011, 145, 654–665. [Google Scholar] [CrossRef]
- Lustyk, P. Metodika Aktualizace Vrstvy Mapování Biotopů [Updates of the Habitat Mapping Layer Methodology]; Agency of Nature Conservation and Landscape Protection of the Czech Republic: Prague, Czech Republic, 2019; Available online: http://portal.nature.cz/ (accessed on 31 August 2020).
- Lustyk, P. (Ed.) Příručka Hodnocení Biotopů [Habitat Assessment Guide]; Agency of Nature Conservation and Landscape Protection: Prague, Czech Republic, 2019; p. 480. Available online: http://portal.nature.cz/ (accessed on 31 August 2020).
- Slavík, B. Metodika Síťového Mapování ve Vztahu k Připravovanému Fytogeografickému Atlasu ČSR [Methods of Grid Mapping in Relation to the Phytogeographical Atlas of the Czech Socialist Republic, Currently under Preparation]. Zprávy Čs. Bot. Společ. 1971, 6, 55–62. [Google Scholar]
- Lustyk, P.; Oušková, V. Vrstva mapování biotopů a její aktualizace—první možnosti srovnání dat [Habitat Mapping Layer and Its Updating—the First Possibilities of Data Comparison]. Ochrana Přírody 2011, 66, 20–22. [Google Scholar]
- Thiers, B. Index Herbariorum: A Global Directory of Public Herbaria and Associated Staff. New York Botanical Gar-den’s Virtual Herbarium. Available online: http://sweetgum.nybg.org/science/ih/ (accessed on 31 August 2020).
- Kaplan, Z.; Danihelka, J.; Štěpánková, J.; Bureš, P.; Zázvorka, J.; Hroudová, Z.; Ducháček, M.; Grulich, V.; Řepka, R.; Dančák, M.; et al. Distributions of Vascular Plants in the Czech Republic. Part 1. [Electronic Appendices 1–75, www.preslia.cz]. Preslia 2015, 87, 417–500. [Google Scholar]
- Kaplan, Z.; Danihelka, J.; Štěpánková, J.; Ekrt, L.; Chrtek, J., Jr.; Zázvorka, J.; Grulich, V.; Řepka, R.; Prančl, J.; Ducháček, M.; et al. Distributions of Vascular Plants in the Czech Republic. Part 2. Preslia 2016, 88, 229–322. [Google Scholar]
- Kaplan, Z.; Koutecký, P.; Danihelka, J.; Šumberová, K.; Ducháček, M.; Štěpánková, J.; Ekrt, L.; Grulich, V.; Řepka, R.; Kubát, K.; et al. Distributions of Vascular Plants in the Czech Republic. Part 6. Preslia 2018, 90, 235–346. [Google Scholar] [CrossRef]
- Kaplan, Z.; Danihelka, J.; Chrtek, J., Jr.; Kirschner, J.; Kubát, K.; Štech, M.; Štěpánek, J. (Eds.) The Czech Academy of Sciences. Klíč ke květeně České republiky (Key to the Flora of the Czech Republic), 2nd ed.; Academia, Praha: Prague, Czech Republic, 2019; p. 1168. [Google Scholar]
- IUCN. Guidelines for Using the IUCN Red List Categories and Criteria; Version 14; IUCN Standards and Petitions Committee: Gland, Switzerland, 2019; p. 113. Available online: http://www.iucnredlist.org/documents/RedListGuidelines.pdf (accessed on 31 August 2020).
- Fischer, M.; Stöcklin, J. Local Extinctions of Plants in Remnants of Extensively Used Calcareous Grasslands 1950–1985. Conserv. Biol. 1997, 11, 727–737. [Google Scholar] [CrossRef]
- Dostálek, T.; Münzbergová, Z. Habitat Requirements and Host Selectivity of Thesium Species (Santalaceae). Bot. J. Linn. Soc. 2010, 164, 394–408. [Google Scholar] [CrossRef]
- Hodgson, J. Commonness and Rarity in Plants with Special Reference to the Sheffield Flora Part I: The Identity, Distribution and Habitat Characteristics of the Common and Rare Species. Biol. Conserv. 1986, 36, 199–252. [Google Scholar] [CrossRef]
Figure 1.
Maps (A,C,E): number of occurrences (dot size) and knowledge level of habitat quality (brownish colour); empty circle (0 %) = occurrence of the species outside the habitat. Maps (B,D,F): habitat quality (1–4); the darker the green colour, the lower the values of quality are. Grid of 10 × 10 km.

Figure 2.
Maps (A,C,E): number of occurrences (dot size) and knowledge level of habitat quality (brownish colour); empty circle (0 %) = occurrence of the species outside the habitat. Maps (B,D,F): habitat quality (1–4); the darker the green colour, the lower the values of quality are. Grid of 10 × 10 km.

Figure 3.
Maps (A,C,E): number of occurrences (dot size) and knowledge level of habitat quality (brownish colour); empty circle (0%) = occurrence of the species outside the habitat. Maps (B,D,F): habitat quality (1–4); the darker the green colour, the lower the values of quality are. Grid of 10 × 10 km.

Figure 4.
Percentages of habitats’ quality with species occurrences.


Table 1.
Example of source data (sample) of Carex lepidocarpa for assessment of habitat quality. Darker colours indicate lower values of quality. FV = favourable, U1 = unfavourable—inadequate, U2 = unfavourable—bad but stable.
Table 1.
Example of source data (sample) of Carex lepidocarpa for assessment of habitat quality. Darker colours indicate lower values of quality. FV = favourable, U1 = unfavourable—inadequate, U2 = unfavourable—bad but stable.
| Village, Locality | GPS_X | GPS_Y | Quadrant | Polygon ID | Habitat Type | Habitat Degradation | Habitat Structure and Functions | Habitat Quality |
|---|---|---|---|---|---|---|---|---|
| Kostelecké Horky, Na Kadeřávkách | 50.058944 | 16.189667 | 5963a | outside the mapped area | – | – | – | unknown |
| Třeboc, Kočičí díra | 50.221389 | 13.773611 | 5748d | outside the mapped area | – | – | – | unknown |
| Malíkovice, Červený creek | 50.211791 | 13.95156 | 5749d | outside the mapped area | – | – | – | unknown |
| Vašírov, Tuchlovický creek | 50.137297 | 13.954587 | 5849d | outside the mapped area | – | – | – | unknown |
| Předonín | 50.438889 | 14.338333 | 5552c | outside the mapped area | – | – | – | unknown |
| Lysá nad Labem, Mlynařice | 50.200859 | 14.814483 | 5754d | outside the mapped area | – | – | – | unknown |
| Mravín, Mentourský creek | 49.938139 | 16.041528 | 6062c | outside the mapped area | – | – | – | unknown |
| Dražejov, Vrabcov valley | 50.520564 | 14.533362 | 5453c | outside the mapped area | – | – | – | unknown |
| Hutisko, Díly | 49.42172 | 18.18534 | 6575c | 14780208 | R2.1 | 0 | FV | 1 |
| Karlov pod Pradědem, Praděd, Malá kotlina | 50.039389 | 17.209556 | 5969c | 7820732 | R2.2 | 0 | FV | 1 |
| Mcely, Čtvrtě | 50.299941 | 15.068962 | 5758a | 29830106 | M1.1 | 1 | FV | 1 |
| Opatov, Pod Farským | 49.827639 | 16.488639 | 6164d | 23280308 | R2.1 | 1 | FV | 1 |
| Vidnava, Vidnavské mokřiny | 50.38581 | 17.20135 | 5669a | 29110100 | R2.2 | 1 | FV | 1 |
| Staré Splavy, Jestřebské slatiny | 50.6025 | 14.621944 | 5353d | 3490609 | R2.1 | 2 | FV | 2 |
| Rašovice, fishpond | 50.155564 | 16.127456 | 5862b | 27580012 | M1.1 | 2 | U1 | 2 |
| Hřibiny, Střezm | 50.146194 | 16.164722 | 5862d | 27430272 | T1.9 | 1 | U1 | 2 |
| Provodín, sand pit | 50.619247 | 14.598344 | 5353d | 3491082 | R2.3 | 2 | U1 | 2 |
| Bílá, Smutné valley | 49.414545 | 18.45132 | 6576d | 14770262 | R2.1 | 1 | U1 | 2 |
| Kněžičky, Dlouhopolsko | 50.168211 | 15.317271 | 5857b | 28140088 | R2.1 | 2 | U2 | 3 |
| Semanín, Semanínská střelnice | 49.8575 | 16.455278 | 6164b | 23050322 | T1.5 | 3 | U1 | 3 |
| Lysá nad Labem, Hrabanovská černava | 50.218485 | 14.839084 | 5755c | 8630037 | T1.5 | 3 | U2 | 4 |
| Bílichov, Smradovna | 50.262293 | 13.88649 | 5749a | 30910039 | R2.1 | 3 | U2 | 4 |
| Chudíř, Dubnický fishpond | 50.300981 | 15.008088 | 5656c | 1730106 | T1.9 | 3 | U2 | 4 |
Table 2.
Frequency of occurrence of the selected species in habitats of different quality.
| Species/Most Frequent Habitat [32] | Total Number of Occurrences | Quality | Group | Current Red List [22] | ||||
|---|---|---|---|---|---|---|---|---|
| Unknown | 1 | 2 | 3 | 4 | ||||
| Carex appropinquata | 786 | 215 | 148 | 304 | 45 | 74 | a | C3/NT |
| – | M1.7, T1.5, R2.2, T1.6 | T1.5, L2.2, M1.7, T1.6 | T1.5, M1.7, T1.9, L2.2 | M1.7, T1.5, L2.2, X7 | ||||
| Rosa agrestis | 391 | 171 | 37 | 94 | 25 | 64 | a | C4b/DD |
| – | K3, T3.3, T3.4 | K3, T3.4, T3.3, T5.5 | K3, L7.1 | K3, X9 | ||||
| Rosa spinosissima | 252 | 43 | 93 | 89 | 4 | 23 | a | C2b/VU |
| – | K4C, T3.3, K3, T4.1 | T3.4, T3.3, K3, T3.5 | T3.4 | T3.4, X9, K3 | ||||
| Carex lepidocarpa | 128 | 41 | 24 | 41 | 10 | 12 | a | C2t/EN |
| – | R2.2, R2.1, T1.9, L1 | R2.1, T1.9, R1.1, R2.2 | T1.9, R2.1 | R2.1, T1.5, T1.9 | ||||
| Teucrium scordium | 120 | 53 | 21 | 25 | 6 | 15 | a | C2b/EN |
| – | M1.1, M1.7, T1.9 | M1.7, M1.1 | M1.1 | X7, M1.7, T1.7 | ||||
| Cardamine matthioli | 206 | 61 | 14 | 54 | 12 | 65 | c | C4a/NT |
| – | T1.7, T1.4 | T1.7, T1.4, M1.7, T1.1 | T1.7, M1.7 | T1.7, X7, M1.7 | ||||
| Gratiola officinalis | 134 | 41 | 8 | 26 | 10 | 49 | c | C2t/EN |
| – | T1.7, M1.7 | T1.7, M1.7, T1.9 | T1.7, M1.7 | T1.7, M1.7, X7 | ||||
| Rosa micrantha | 49 | 13 | 12 | 20 | 0 | 4 | ab | C3/VU |
| – | K3, T3.3 | K3, L3.1 | – | K3 | ||||
| Carex cespitosa | 1145 | 268 | 108 | 506 | 81 | 182 | bc | C4a/NT |
| – | T1.5, M1.7, L2.2, T1.6 | T1.5, T1.6, M1.7, L2.2 | T1.5, T1.6, M1.7, L2.2 | T1.5, M1.7, T1.6, X7 | ||||
Habitats: K3—Tall mesic and xeric scrub; K4 (40A0)—Low xeric scrub; L1—Alder carrs; L2.2 (91E0)—Ash-alder alluvial forests; L3.1 (9170)—Hercynian oak-hornbeam forests; L7.1—Dry acidophilous oak forests; M1.1—Reed beds of eutrophic still waters; M1.7—Tall-sedge beds; R2.1 (7230)—Calcareous fens; R2.2 (7140)—Acidic moss-rich fens; T1.1 (6510)—Mesic Arrhenatherum meadows; T1.4—Alluvial Alopecurus meadows; T1.5—Wet Cirsium meadows; T1.6 (6430)—Wet Filipendula grasslands; T1.7 (6440)—Continental inundated meadows; T1.9 (6410)—Intermittently wet Molinia meadows; T3.3A (6240)—Sub-Pannonian stepic grasslands; T3.4 (6210)—Broad-leaved dry grasslands; T3.5 (6210)—Acidophilous dry grasslands; T4.1—Dry herbaceous fringes; T5.5—Acidophilous grasslands on shallow soils; X7—Herbaceous ruderal vegetation; X9—Forest plantations of allochtonous trees.
Publisher’s Note: MDPI stays neutral with regard to jurisdictional claims in published maps and institutional affiliations. |
© 2021 by the authors. Licensee MDPI, Basel, Switzerland. This article is an open access article distributed under the terms and conditions of the Creative Commons Attribution (CC BY) license (http://creativecommons.org/licenses/by/4.0/).
Share and Cite
MDPI and ACS Style
Lustyk, P.; Vahalík, P. Threat Degree Classification According to Habitat Quality: A Case Study from the Czech Republic. Forests 2021, 12, 85. https://0-doi-org.brum.beds.ac.uk/10.3390/f12010085
AMA Style
Lustyk P, Vahalík P. Threat Degree Classification According to Habitat Quality: A Case Study from the Czech Republic. Forests. 2021; 12(1):85. https://0-doi-org.brum.beds.ac.uk/10.3390/f12010085
Chicago/Turabian StyleLustyk, Pavel, and Petr Vahalík. 2021. "Threat Degree Classification According to Habitat Quality: A Case Study from the Czech Republic" Forests 12, no. 1: 85. https://0-doi-org.brum.beds.ac.uk/10.3390/f12010085
Note that from the first issue of 2016, this journal uses article numbers instead of page numbers. See further details here.