
Proteomic Analysis: Explosive Salt Accumulation in Leaves of Morus alba L. under Salt Stress

Collaborative Innovation Center of Sustainable Forestry in Southern China of Jiangsu Province College of Biology and the Environment, Nanjing Forestry University, Nanjing 210037, China
*
Author to whom correspondence should be addressed.
Forests 2021, 12(10), 1384; https://0-doi-org.brum.beds.ac.uk/10.3390/f12101384
Submission received: 2 September 2021
/
Revised: 27 September 2021
/
Accepted: 30 September 2021
/
Published: 11 October 2021
(This article belongs to the Section Forest Ecology and Management)
Abstract
:The salt tolerance of glycophytes is thought to be related to their ability to restrict sodium access to their aboveground parts. A previous study on the mulberry (Morus alba L.) revealed a phenomenon of explosive salt accumulation in the leaves after exceeding a certain treatment concentration. Here, we aim to observe the internal state of mulberry seedlings under salt stress by the proteomic method and to identify the possible inducements associated with salt bursts. In this study, the target treatments for TMT-label free quantitative analyses were determined by measuring the sodium content in the roots and leaves. The results showed that the expressions of proteins classified as “plant hormones”, “ion channels”, “REDOX homeostasis”, “cytoskeleton” and “cell wall” changed significantly after salt bursts. This phenotype is associated with the destruction of the apoplast, in which the assembly of the Casparian strip may be affected by the inhibition of some key proteins, indirectly increasing the rate of ion migration through the endodermis into the shoots.
Keywords:
salinity; mulberry; differential proteomics; ion migration; cytoskeleton; cell wall; Casparian strip1. Introduction
The damaging effects of salt stress on plants include osmotic pressure and ion toxicity. The dominance of these two aspects during salt stress is strongly influenced by the salinity gradient. Sodium can act as an osmoticum, like potassium. Therefore, the presence of sodium ions under low salinity may counteract the energy consumption of osmotic regulation, thus slightly promoting plant growth, which may explain why polyethylene glycol- (PEG) simulated drought stress is more harmful to plants than is isotonic salt stress, according to some reports [1]. Under a high-salinity condition, the potential osmotic shock and ion accumulation will undoubtedly cause more damage to plants [2]. On the other hand, the response behavior of plants to salt stress can be continuously adjusted due to the dynamic of the osmotic pressure and ion accumulation brought about by ion migration. In conclusion, in salt stress studies, the settings of gradient and duration (sampling timepoint) are crucial for the desired results and subsequent interpretation.
The Salt Overly Sensitive (SOS) signaling pathway was discovered as a conserved salt-tolerant mechanism that mediates salt adaptation in most plants. The pathway is mainly characterized by its use of calcium as a messenger and by sodium ions being discharged from cells or sequestrated into vacuoles by sodium–hydrogen exchange channels on the plasma membrane or vacuolar membrane so as to control the concentration of the cytoplasmic sodium to maintain the normal operation of physiological processes [3]. In recent years, as research has continued, more details related to salt adaptation have been discovered. It is now known that the adaptive reorganization of the cytoskeleton occurs in the early stages of salt stress, and that the inhibition of this process will affect the salt tolerance of cells [4] as well as that the channel protein AtHKT1;1, expressed in the endodermis, improves the salt tolerance of Arabidopsis by moving sodium ions from its shoots to its roots [5]. The salt tolerance of most glycophytes depends on the invocation of these mechanisms, but few past studies focused on their response interval to stress factors. Molecular-based studies usually limit treatment concentrations to a relatively mild range in order to exclude the non-adaptive noise generated by disorganized physiologies, resulting in little understanding of the internal states of these plants under severe situations.
This study focused on a native tree species with a high economic value—mulberry, which has a strong foliation ability and the leaf of which can be developed into high-quality feed. Mulberry shows a potential evolutionary advantage over other species, which would explain its wide distribution in diverse habitats [6,7,8]. Lu found a change in the survival rate of mulberry seedlings under salt gradients. His data also revealed another phenomenon—with the increase in salt concentration, there was a significant difference in the accumulation rates of sodium between the leaves and the roots, with an explosive increase of sodium ions in the leaves after the salt exceeded a certain concentration [9]. The excessive accumulation of salt in leaves usually means a loss of photosynthetic capacity. Glycophytes with a strong salt tolerance tend to have a strong ability to restrict sodium entry into their xylems [10]. We set up a salt stress experiment with multiple treatment concentrations and determined the target concentrations of salt burst through physiological indicators and then analyzed the intrinsic inducements of this phenotype by the proteomic method so as to screen the key proteins to provide new research ideas for salt transfer behavior in mulberry plants under high-salt stress.
2. Materials and Methods
2.1. Plant Material and Salt Treatments
One-year-old mulberry seedlings were trimmed to an equal length (30 cm) and sowed in pots filled with garden soil. The pots were large enough to ensure that rapid leakage does not occur after a adding fixed amount of solution. The seedlings were grown in a greenhouse with a 14 h/10 h (day/night) cycle, and a day/night temperature of 28/25 °C, with the relative humidity at 70%. The recovering stage lasted for two months; then, 80 mulberry seedlings were randomly divided into 8 groups. Each group represented a different salt concentration, with 0% (CK), 0.1%, 0.2%, 0.25%, 0.3%, 0.35%, 0.4% and 0.5% (based on the dry weight of the soil), respectively.
After the first salt treatment for the 8 groups, the salt injury characteristics of the mulberry leaves were observed, and the first sampling was carried out on the 7th day (the time points of the salt injury characteristics of the last four treatments were significantly different from those of the first four treatments), when the physiological indexes, such as the content of sodium ions, were determined. The first four treatment groups with intact leaves at the end of cycle 1 were given a second salt treatment, which was also for 7 days. We increased the treatment concentration for cycle 2, as shown in Table 1. The second treatment cycle was set to ensure that the occurrence of the leaf ion bursts was not accidental. At the end of the 14th day, tissue samples were collected for physiological and proteomic study.
2.2. Measurement of Physiological Indexes
Root and leaf samples were collected on the 7th and 14th days for the determination of the physiological indexes. Since it is difficult to obtain data from wilting leaves with a photosynthetic apparatus, the photosynthetic indexes were measured only for the treatment groups with intact leaf phenotypes.
A H2SO4 and H2O2 digestion system was used to digest the tissue samples [11], and the content of sodium in the digestive solution was determined by a flame spectrophotometer (BWB XP, Berkshire, UK). The Malondialdehyde (MDA) content was determined by thiobarbituric acid (TBA) colorimetry [12]. The leaf gas exchange parameters were measured using a portable LI-6800 system (LI-COR Biosciences, Lincoln, NE, USA). The net photosynthetic rate (Pn), transpiration rate (Tr), intercellular CO2 concentration (Ci) and stomatal conductance (Gs) were measured simultaneously with an internal light source (PAR = 800 µmol m−2 s−1). The ambient air CO2 concentration was approximately 400 µmol mol−1, and the relative humidity was controlled at 55%. Water-use efficiency (WUE) was calculated as WUE = Pn/Tr.
The differences in roots and leaves among the treatments were separately assessed by one-way ANOVA, Tukey’s multiple range test, using R 4.1.0 software.2.3. to identify target treatments for proteomic studies.
The physiological data of two treatment cycles showed that when soil salinity exceeded a certain threshold, an explosive accumulation of sodium ions in the leaves occurred, accompanied by rapid leaf wilt. We selected root samples of the initial concentration (0.4%) of the leaf salt burst in cycle 2 and the from one (0.3%) before it, along with from control group (0%), as the three treatments of the quantitative proteome analysis.
2.3. Protein Extraction, Digestion and TMT Labeling
Samples were stored at −80 °C, then ground into powder with liquid nitrogen and combined with 4 times its volume of phenol extraction buffer (including 1% TritonX-100, 10 mM dithiothreitol and 1% Protease Inhibitor Cocktail and 50 μM PR-619, 3 μM TSA, 50 mM NAM and 2 mM EDTA). A high-intensity ultrasonic processor (Scientz) was used to sonicate samples at a low temperature (3 times). An equal volume of Tris-saturated phenol (pH 8.0) was added. After centrifugation (4 °C, 5500× g, 10 min), the upper phenol phase was transferred to a new centrifuge tube. Proteins were then precipitated by adding 5 times the volume of ammonium sulfate-saturated methanol and incubated at −20 °C overnight. The supernatant was discarded after centrifugation the next day. The remaining precipitate was washed with ice-cold methanol once, followed by ice-cold acetone three times. The protein was redissolved in 8 M carbamide, and the protein concentration was determined with a BCA kit according to the manufacturer’s instructions.
The samples were taken in equal amounts for enzymatic hydrolysis, and the volume was adjusted to be the same with a lysis buffer. They were eddied to blend them evenly, precipitated for 2 h at 4 °C, then centrifuged at 4500× g for 5 min, after which the supernatant was discarded. The precipitate was washed 3 times with precooled acetone. After the precipitation was dried, TEAB with a final concentration of 200 mM was added. The precipitation was dispersed by ultrasound, and trypsin was added at a ratio of 1:50 (protease: protein, m/m) for overnight enzymatic hydrolysis. Dithiothreitol (DTT, 5 mM) was added for reduction for 30 min, and then iodoacetamide (IAA, 11 mM) was added for dark incubation for 15 min.
After trypsin digestion, peptide was desalted by a Strata X C18 SPE column (Phenomenex) and vacuum dried. The peptide was dissolved with 0.5 m TEAB and the peptide fragment was labeled according to the TMT kit instructions. Briefly, the thawed labeling reagent was dissolved in acetonitrile, mixed with the peptide and incubated at room temperature for 2 h. The labeled peptide was desalted and vacuum dried.
2.4. LC-MS Analysis
Solvent A (0.1% formic acid) was used to dissolve the tryptic peptides, and then to perform the separation with a Nano Elute ultra-high performance liquid system. The gradient was comprised of an increase of solvent B (0.1% formic acid in 98% acetonitrile) and controlled a constant flow rate of 450 nL/min. The separated peptides were subjected to Capillary source followed by tandem mass spectrometry (timsTOF Pro). The electrospray voltage applied was 2.0 kV. High-resolution TOF was used to detect and analyze the peptide parent ions and their secondary fragments. The scanning range of secondary mass spectrometry was set to 100–1700.The data acquisition mode uses the parallel accumulation–serial fragmentation (PASEF) mode.
The resulting MS/MS data were processed using Maxquant v1.6.6.0. The database Morus_alba (14,339 sequences) was used to concatenate with the reverse decoy database to calculate the false positive rate (FDR) caused by random matching. Trypsin/P was specified as a cleavage enzyme that allowed up to 2 missing cleavages. The minimum length of the peptide was set as 7 amino acid residues, and the maximum modification number of peptides was set to 5. The mass tolerance for precursor ions was set as 20 ppm in the first search and 20 ppm in the main search, and the mass tolerance for fragment ions was set as 20 ppm. The carbamidomethylation of cysteine was specified as a fixed modification, and the acetylation modification and oxidation of methionine were specified as variable modifications. The quantitative method was set as LFQ, and the PROTEIN identification and PSM identification FDR were set as 1%.
2.5. Bioinformatics Methods
The GO (Gene ontology) database provides annotation and classification services for proteins identified in this project [13]. The annotation of proteome results depends on the UniProt-GOA database (http://www.ebi.ac.uk/GOA/ (accessed on 30 September 2020)). Firstly, the identified protein ID was converted to its UniProt ID and then mapped to its GO ID by its protein ID. If some identified proteins could not be annotated by the UniProt-GOA database, the InterProScan software was used to annotate the proteins based on the sequence alignment method. Then, the proteins were classified by Gene Ontology annotation based on three categories: biological process, cellular component and molecular function. If there was no protein information queried in the UniProt-GOA database or InterProScan, an algorithm software based on protein sequences was used to predict the GO function of the protein, and then classify the protein according to the cell component, molecular function or physiological process (The results of “cell component” were not in good agreement with other traceable conclusions and were not presented or discussed in this paper).
In addition to GO, we annotated proteomic data using the KEGG (Kyoto Encyclopedia of Genes and Genomes) and COG (Clusters of Orthologous Groups of proteins) databases. KEGG connects known information on molecular interaction networks, such as pathways and complexes. First, the submitted proteins were annotated using the KEGG online tool KAAS, and then the annotated proteins were matched into the corresponding pathways in the database using the online service tool KEGG mapper [14].
The KEGG database was used to identify enriched pathways by a two-tailed Fisher’s exact test to test the enrichment of the differentially expressed proteins against all identified proteins. A pathway with a corrected p-value < 0.05 was considered significant. These pathways were classified into hierarchical categories according to the KEGG website.
2.6. Screening of Key Proteins
In this study, the analysis of DEPs was not entirely guided by the bioinformatic method. The screening of key proteins was based on the existing understanding of ion transfer mechanisms in plants, and five categories were artificially integrated according to the annotation provided by KEGG, GO and KOG; the specific functions of proteins were studied by functional annotation and literature index from uniport (https://www.uniprot.org/ (accessed on 30 September 2020)) to discuss their potential correlation with leaf salt accumulation.
3. Results
3.1. Morphological and Physiological Indexes
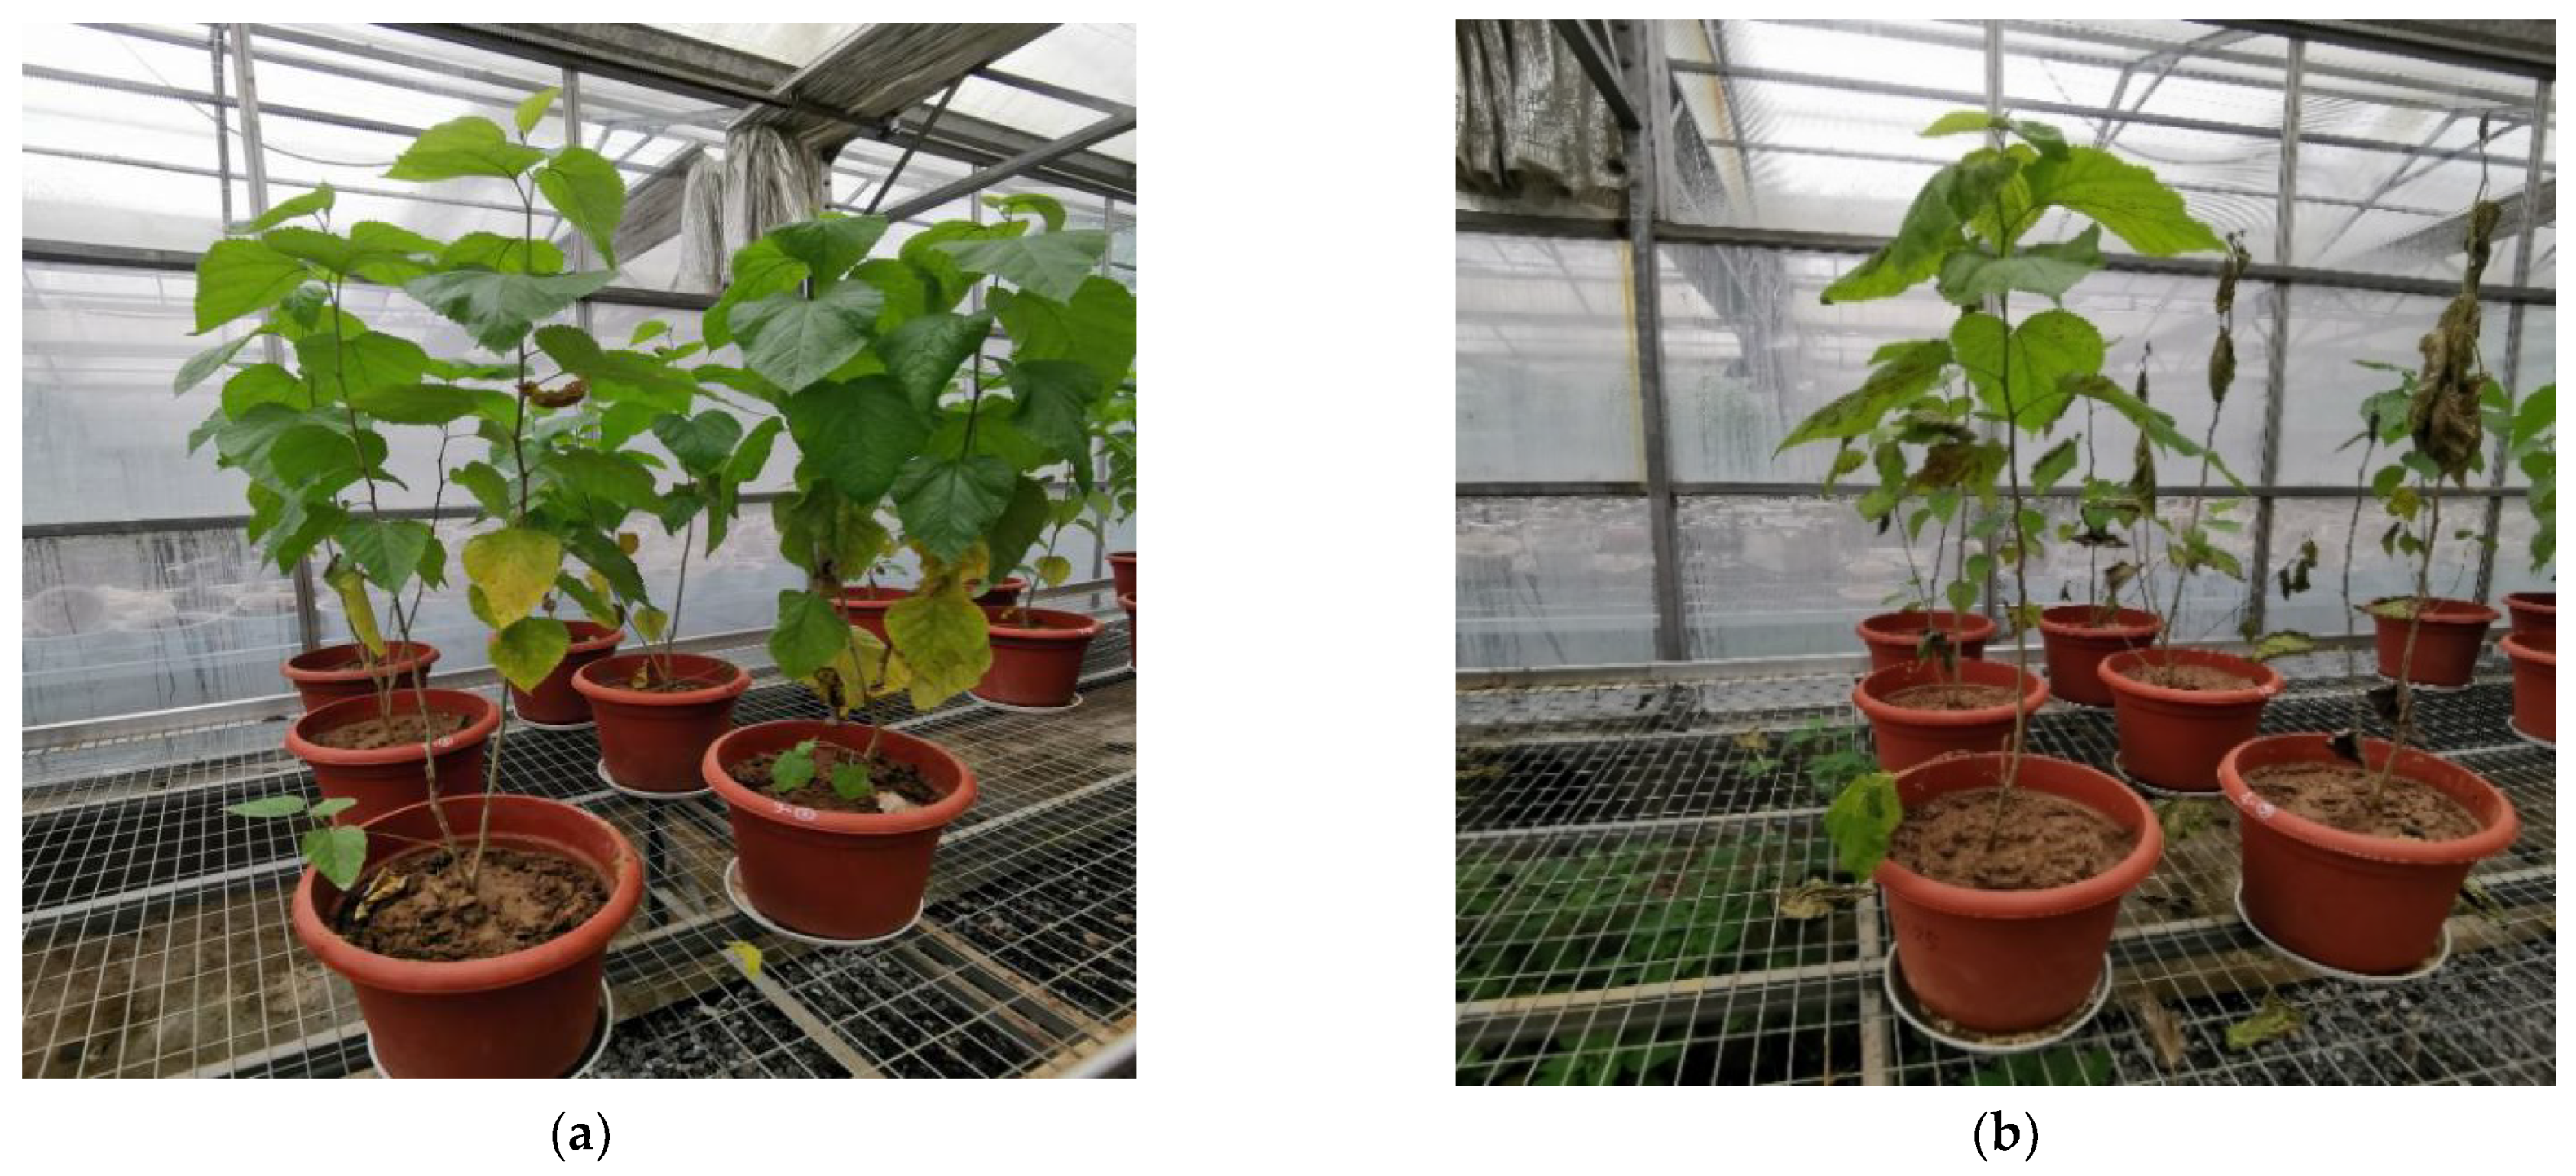
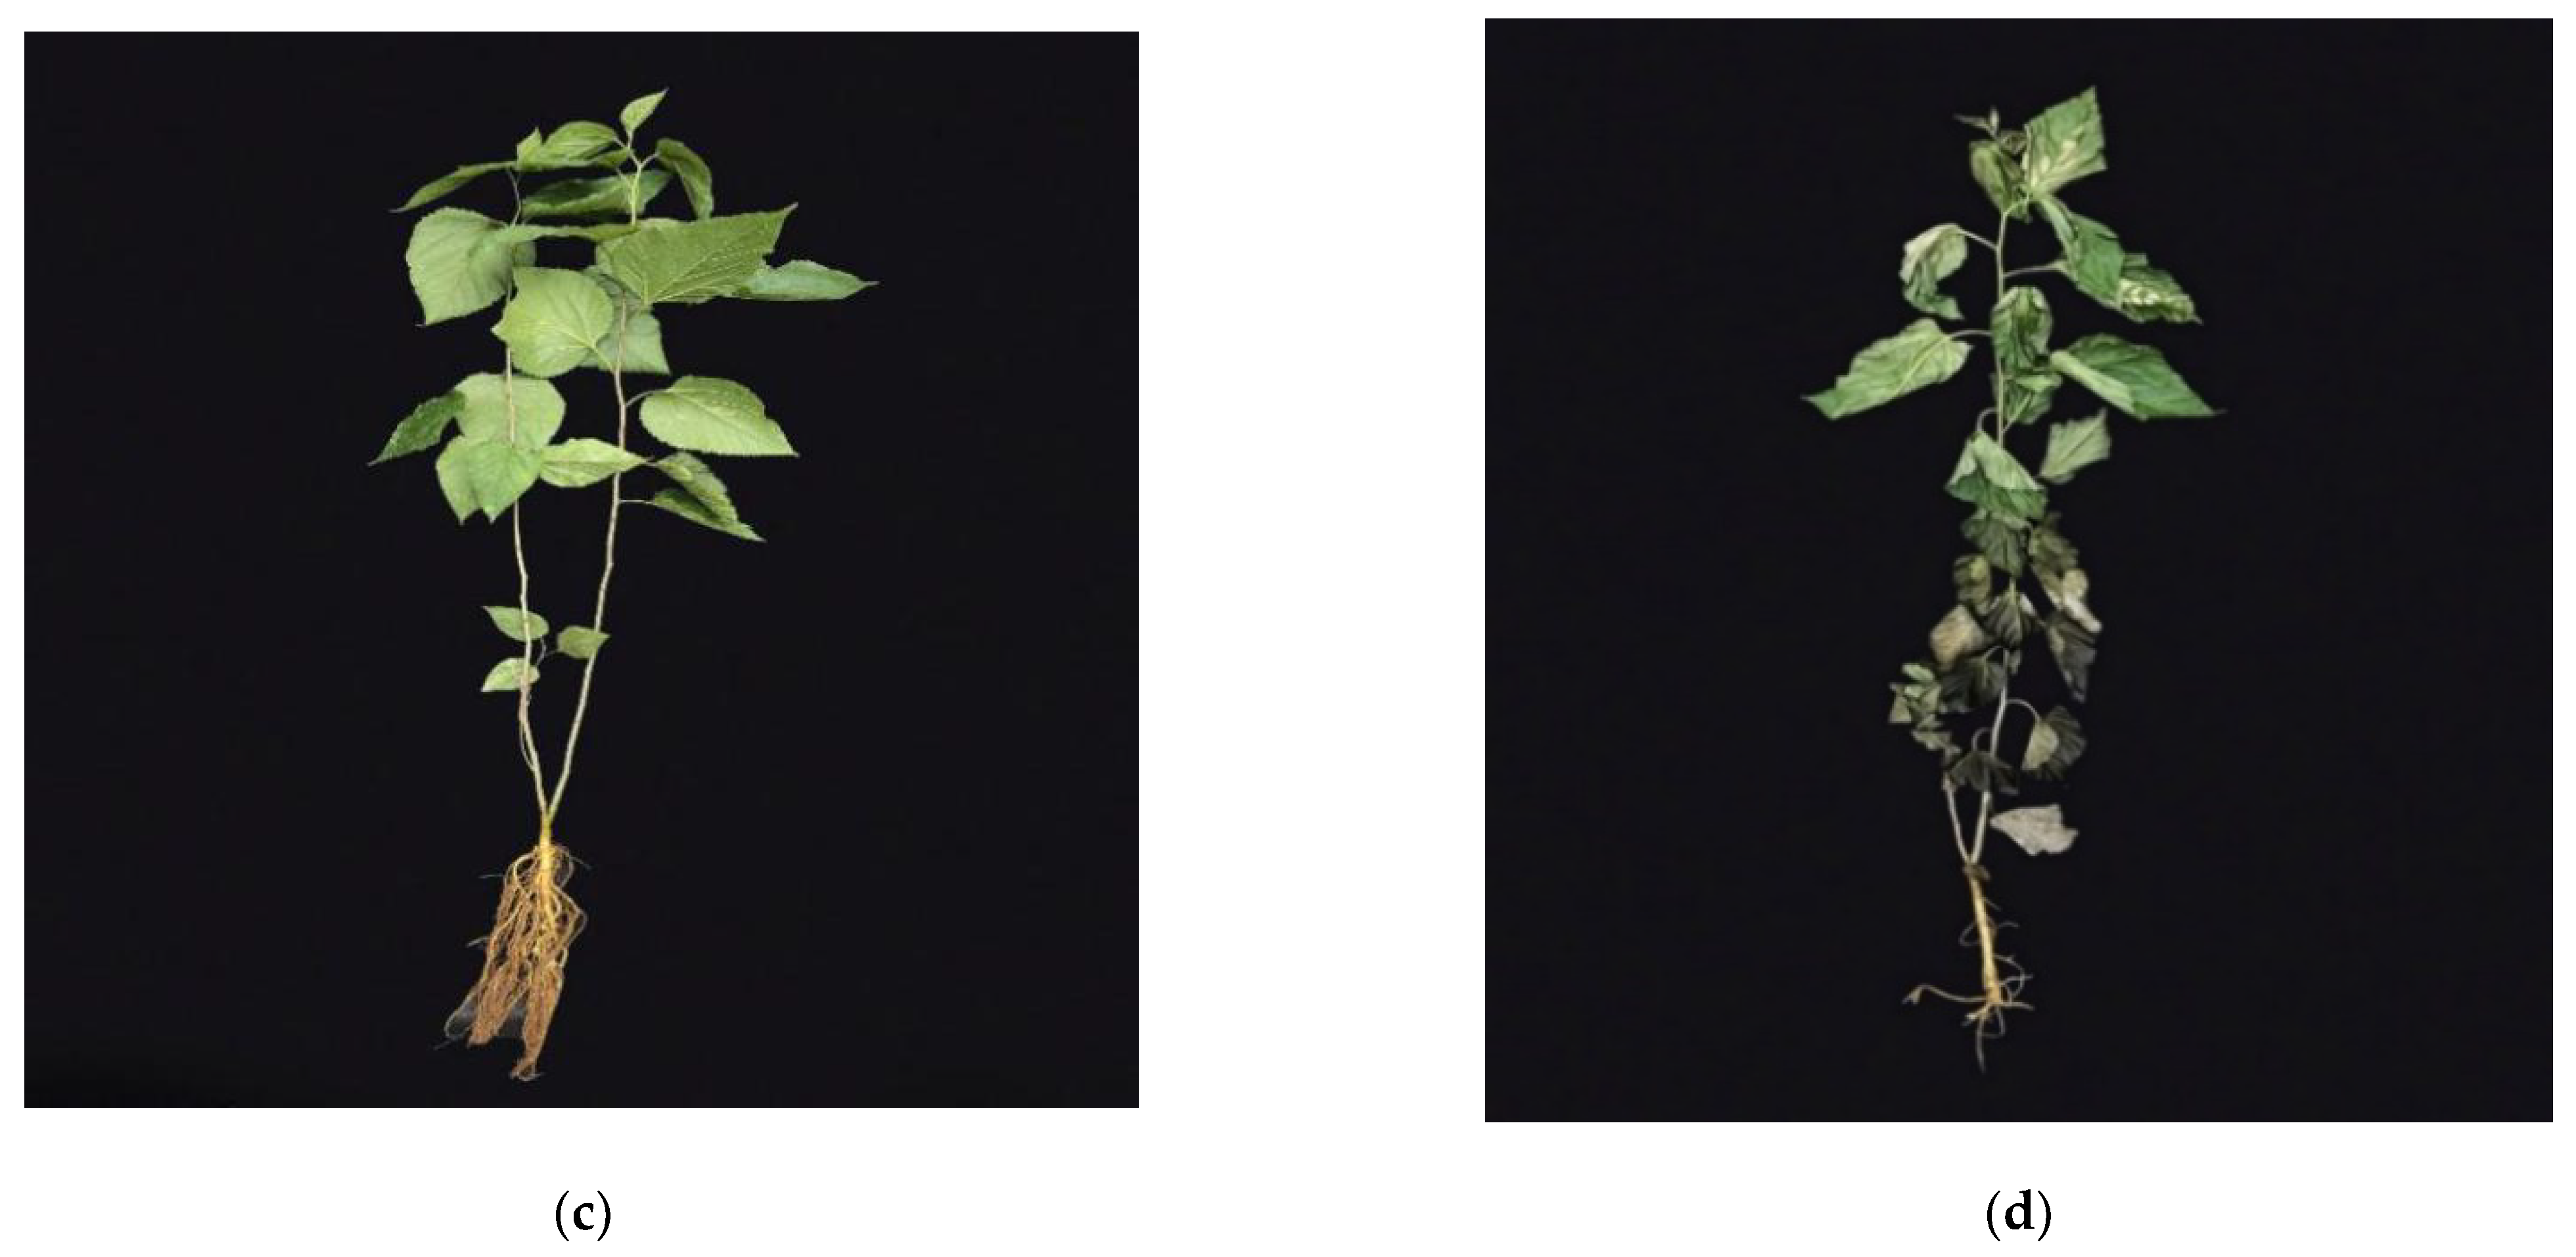
Starting the second day after the salt treatment, the leaves of the last four treatments (0.3–0.5%) began to wilt from bottom to top. By the end of treatment cycle 1 (Day 7), the top leaves were also seriously wilted, with blackened leaf margins and bleaching between the veins, while the leaves of the first four treatments (0–0.25%) showed no significant change during cycle 1. Treatment cycle 2 was only targeted at the first four treatments (0–0.25%) and resulted in normal leaf phenotypes at the end of cycle 1, so the stress intensity of each group was increased (Table 1). At the end of cycle 2 (Day 14), only 0.4% (up from 0.25% in C1) resulted in obvious wilting. The other three groups had normal leaf phenotypes (Figure 1).
By measuring the content of sodium ions in the roots and leaves in two treatment cycles, it was found that whether the leaves wilted under salt stress was highly correlated to the surge of sodium in the leaves. The content of sodium ions in the roots increased steadily with the increase of soil salinity, while it increased sharply in the leaves after reaching a certain concentration (Figure 2). In cycle 1, the explosive accumulation of sodium ions began with a concentration of 0.3%. The last three treatments under higher salt concentrations also showed rapid increases of sodium. Compared with 0.25%, the ion content in leaves of 0.3%~0.5% increased by 4.7, 3.2, 3.6 and 4.1 times, respectively (Figure 2a). In cycle 2, the rapid increase occurred at a treatment of 0.4% (up from 0.25% in cycle 1), and there was no significant difference among the first three treatments (Figure 2b). It should be noted that in cycle 1, the leaves’ ion content of 0.25% significantly increased compared with the first three treatments, but that the inducement may be different from the last four treatments (Figure 2a).
Malondialdehyde (MDA) is the product of membrane lipid peroxidation and is often used to evaluate the stability of the cell membrane under stress conditions. The results showed that the MDA levels in roots were relatively stable, while the MDA levels in leaves were significantly different. They reached a maximum at 0.4% in cycle 1, which is doubled compared with the control group (Figure 2c). In cycle 2, the MDA content the in leaves increased significantly at 0.4%, which was 1.5 times higher than that of the control (Figure 2d).
Photosynthesis was measured only on intact leaves, and it was more sensitive to salt stress than the other indexes. Data revealed that the treatment of 0.2% significantly inhibits leaf photosynthesis during cycle 1, as the net photosynthetic rate (Pn) was about 80% of the control, but still within a normal range. When the concentration increased by 0.05 percentage points to 0.25%, the Pn decreased sharply and was only 2% of that of the control. At this time, the photosynthetic capacity of leaves was basically lost, which corresponded to the significantly reduced Tr and significantly increased the Ci. During cycle 2, the inhibition happened at 0.3%, which is above the 0.2% from cycle 1. It is worth noting that the Pns of 0.3% in cycle 2 were improved compared with that of 0.25% in cycle 1, suggesting the potential effect of salt acclimation (Table 2).
3.2. Identification of Root Protein
We selected seedlings from treatment cycle 2 as the research samples. According to the results of physiological indexes, the salt burst occurred at 0.4% in cycle 2. In the following context, R1 refers to the control group, R3 refers to the 0.3% treatment concentration in which the sodium content was stable and R4 refers to 0.4% in which the explosive salt accumulation happened.
According to research articles in the field of salt stress, the key process of the regulation of ion migration occurs in the root, so we performed quantitative proteomic analyses on the root tissue samples to study the potential inducement of this phenotypic difference.
In this study, 2,019,154 secondary spectra were obtained by mass spectrometry. The number of available spectra was 400,922, and the utilization rate was 19.9% after searching the protein theoretical database. A total of 52,876 peptides were identified by spectrogram analysis. Of these, 50,896 were specific peptides, and 5075 distinct proteins were quantifiable, that is, quantitative information was contained in at least one comparison group. Additional information related to mass spectrometric identification is provided in Supplementary 1.
An expression ratio higher than 1.5 was defined as being the change threshold for significantly up-regulated proteins, and less than 1/1.5 was defined as being the change threshold for significantly down-regulated proteins. Three sets of DEPs, R3/R1, R4/R3 and R4/R1, were obtained. In the R3/R1 sets, the DEPs reflected the stress phenotype in which photosynthesis was inhibited but leaf sodium ions remained stable. DEPs in the R4/R3 set reflected the expressions of the proteins significantly changing from low-salt stress (0.3%) to high-salt stress (0.4%) accompanied by a sharp increase of sodium ions in the leaves. The distribution of the DEPs in the three comparison groups was shown in Figure 3a. In general, low-salt treatment induced more protein expression changes, and the number of down-regulated DEPs was slightly higher than the up-regulated DEPs (Figure 3b).
3.2.1. GO and COG Classification
In the GO annotation results, we found that there were many differences between the annotations of the Cell Components (CC) and the information obtained after the literature retrieval, so we did not discuss it. Here, we only provide the GO annotation results based on Biological Process (BP) and Molecular Function (MF). According to the classification of the BP, the top three up-regulated categories which contain the most DEPs of R3/R1 were “cellular process”, “metabolic process” and “response to stimulus”, and the same was true for down-regulated DEPs (Figure 4a). Under the classification of MF, the top three up-regulated categories were “catalytic activity”, “binding” and “antioxidant activity”. The top three categories in the number of down-regulated DEPs were “catalytic activity”, “binding” and “transporter activity” (Figure 4b). In the profile of R4/R3, which represents a more severe salt-damage state, the ranking situation under BP is similar to that of R3/R1 (Figure 4c). Under MF classification, the top three up-regulated DEPs were “catalytic activity”, “binding” and “catalytic activity, acting on a protein”. The top three types of down-regulated DEPs were “catalytic activity”, “binding” and “molecular function regulators” (Figure 4d).
COG annotated 558 DEPs in R3/R1, accounting for about 70% of the total DEPs. Among them, 225 were up-regulated, and 333 were down-regulated. The COG categories containing the most DEPs were “Posttranslational modification, protein turnover, chaperones”, “Signal transduction mechanisms” and “Carbohydrate transport and metabolism”. In the set R4/R3, COG provided annotations for a total of 434 DEPs, with the largest number classified as “Posttranslational modification, protein turnover, chaperones”, “RNA processing and modification” and “Secondary metabolites biosynthesis, transport and catabolism”.
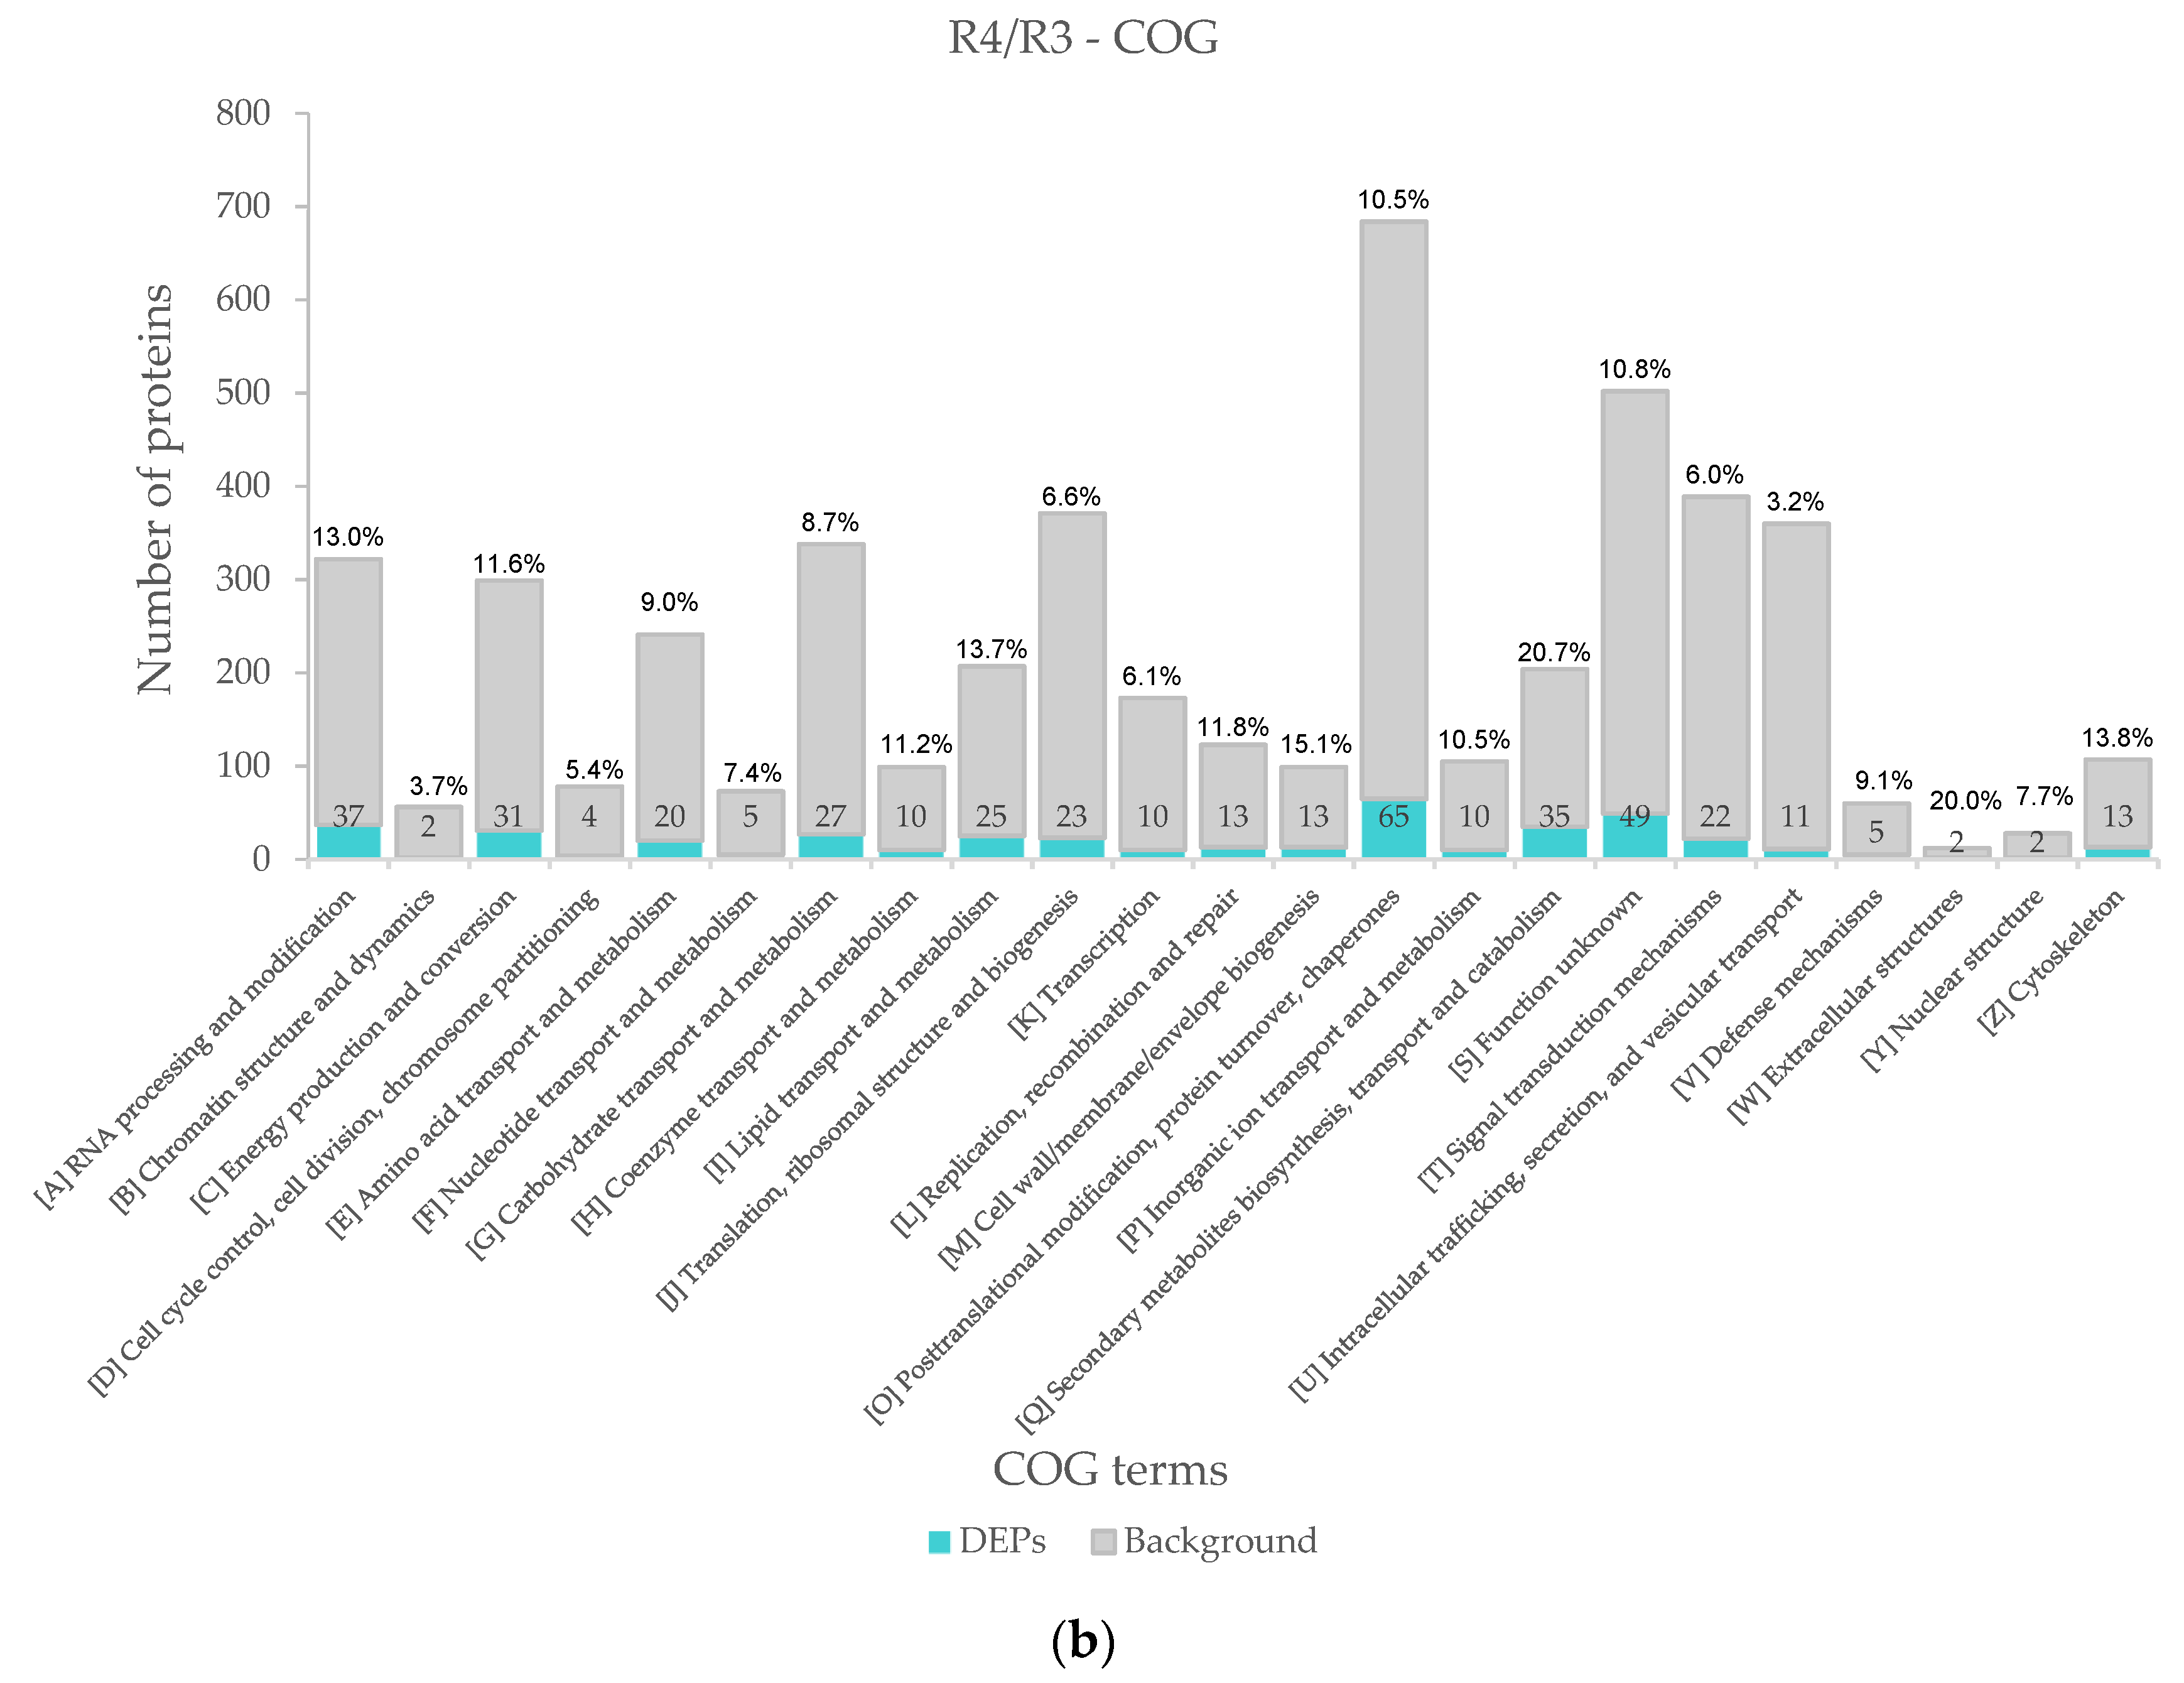
We found that the proportion of COG categories was greatly different after annotating all the identified proteins. For example, the number of non-differentially expressed proteins classified as “post-translational modification” or “signal transduction” was significantly higher than that of other categories, so we use the ratio of the number of DEPs to the total identified proteins to measure the response of the proteins in this category to salt stress. In R3/R1, the categories with the highest proportion were “cytoskeleton” (24.5%), “cell wall” (23.3%) and “secondary metabolites biosynthesis, transport and catabolism (21.9%)” (Figure 5a). After the transition from low salinity to high salinity, the highest proportion of the first three categories were “secondary metabolites biosynthesis, transport and catabolism” (20.7%), “cell wall, membrane, envelope biogenesis” (15.1%) and “cytoskeleton” (13.8%) (Figure 5b).
3.2.2. KEGG Enrichment Analysis
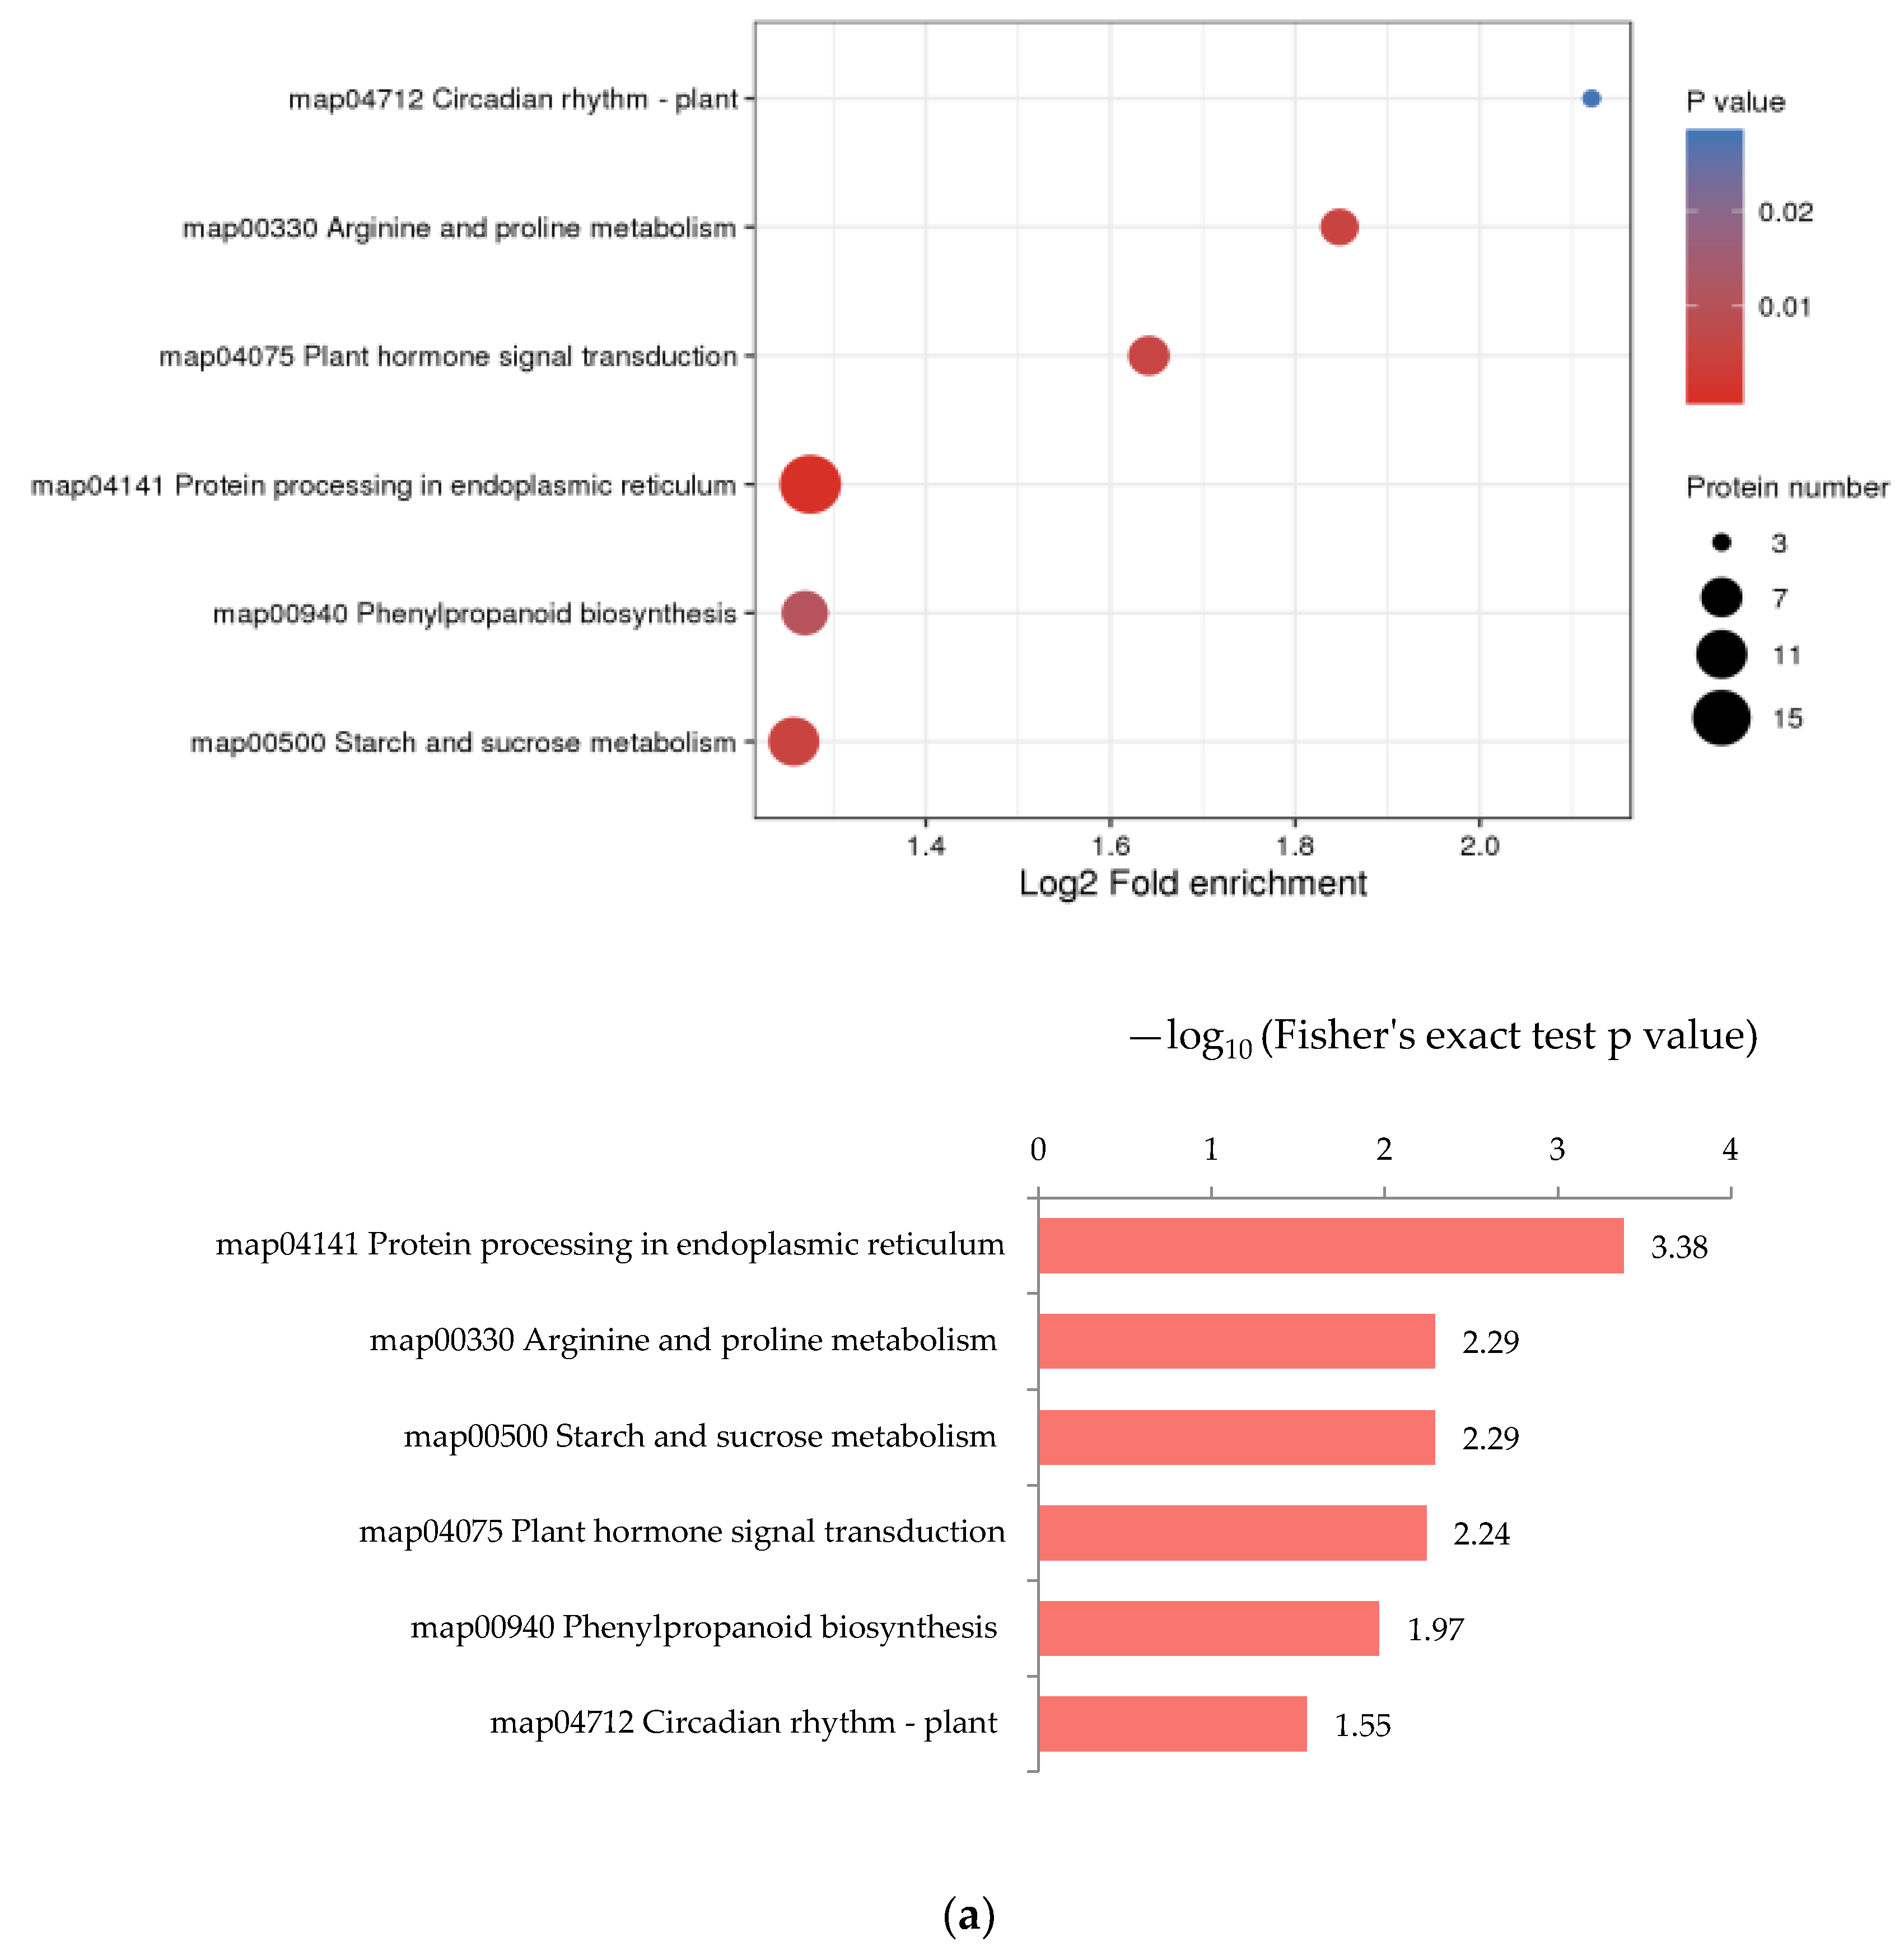
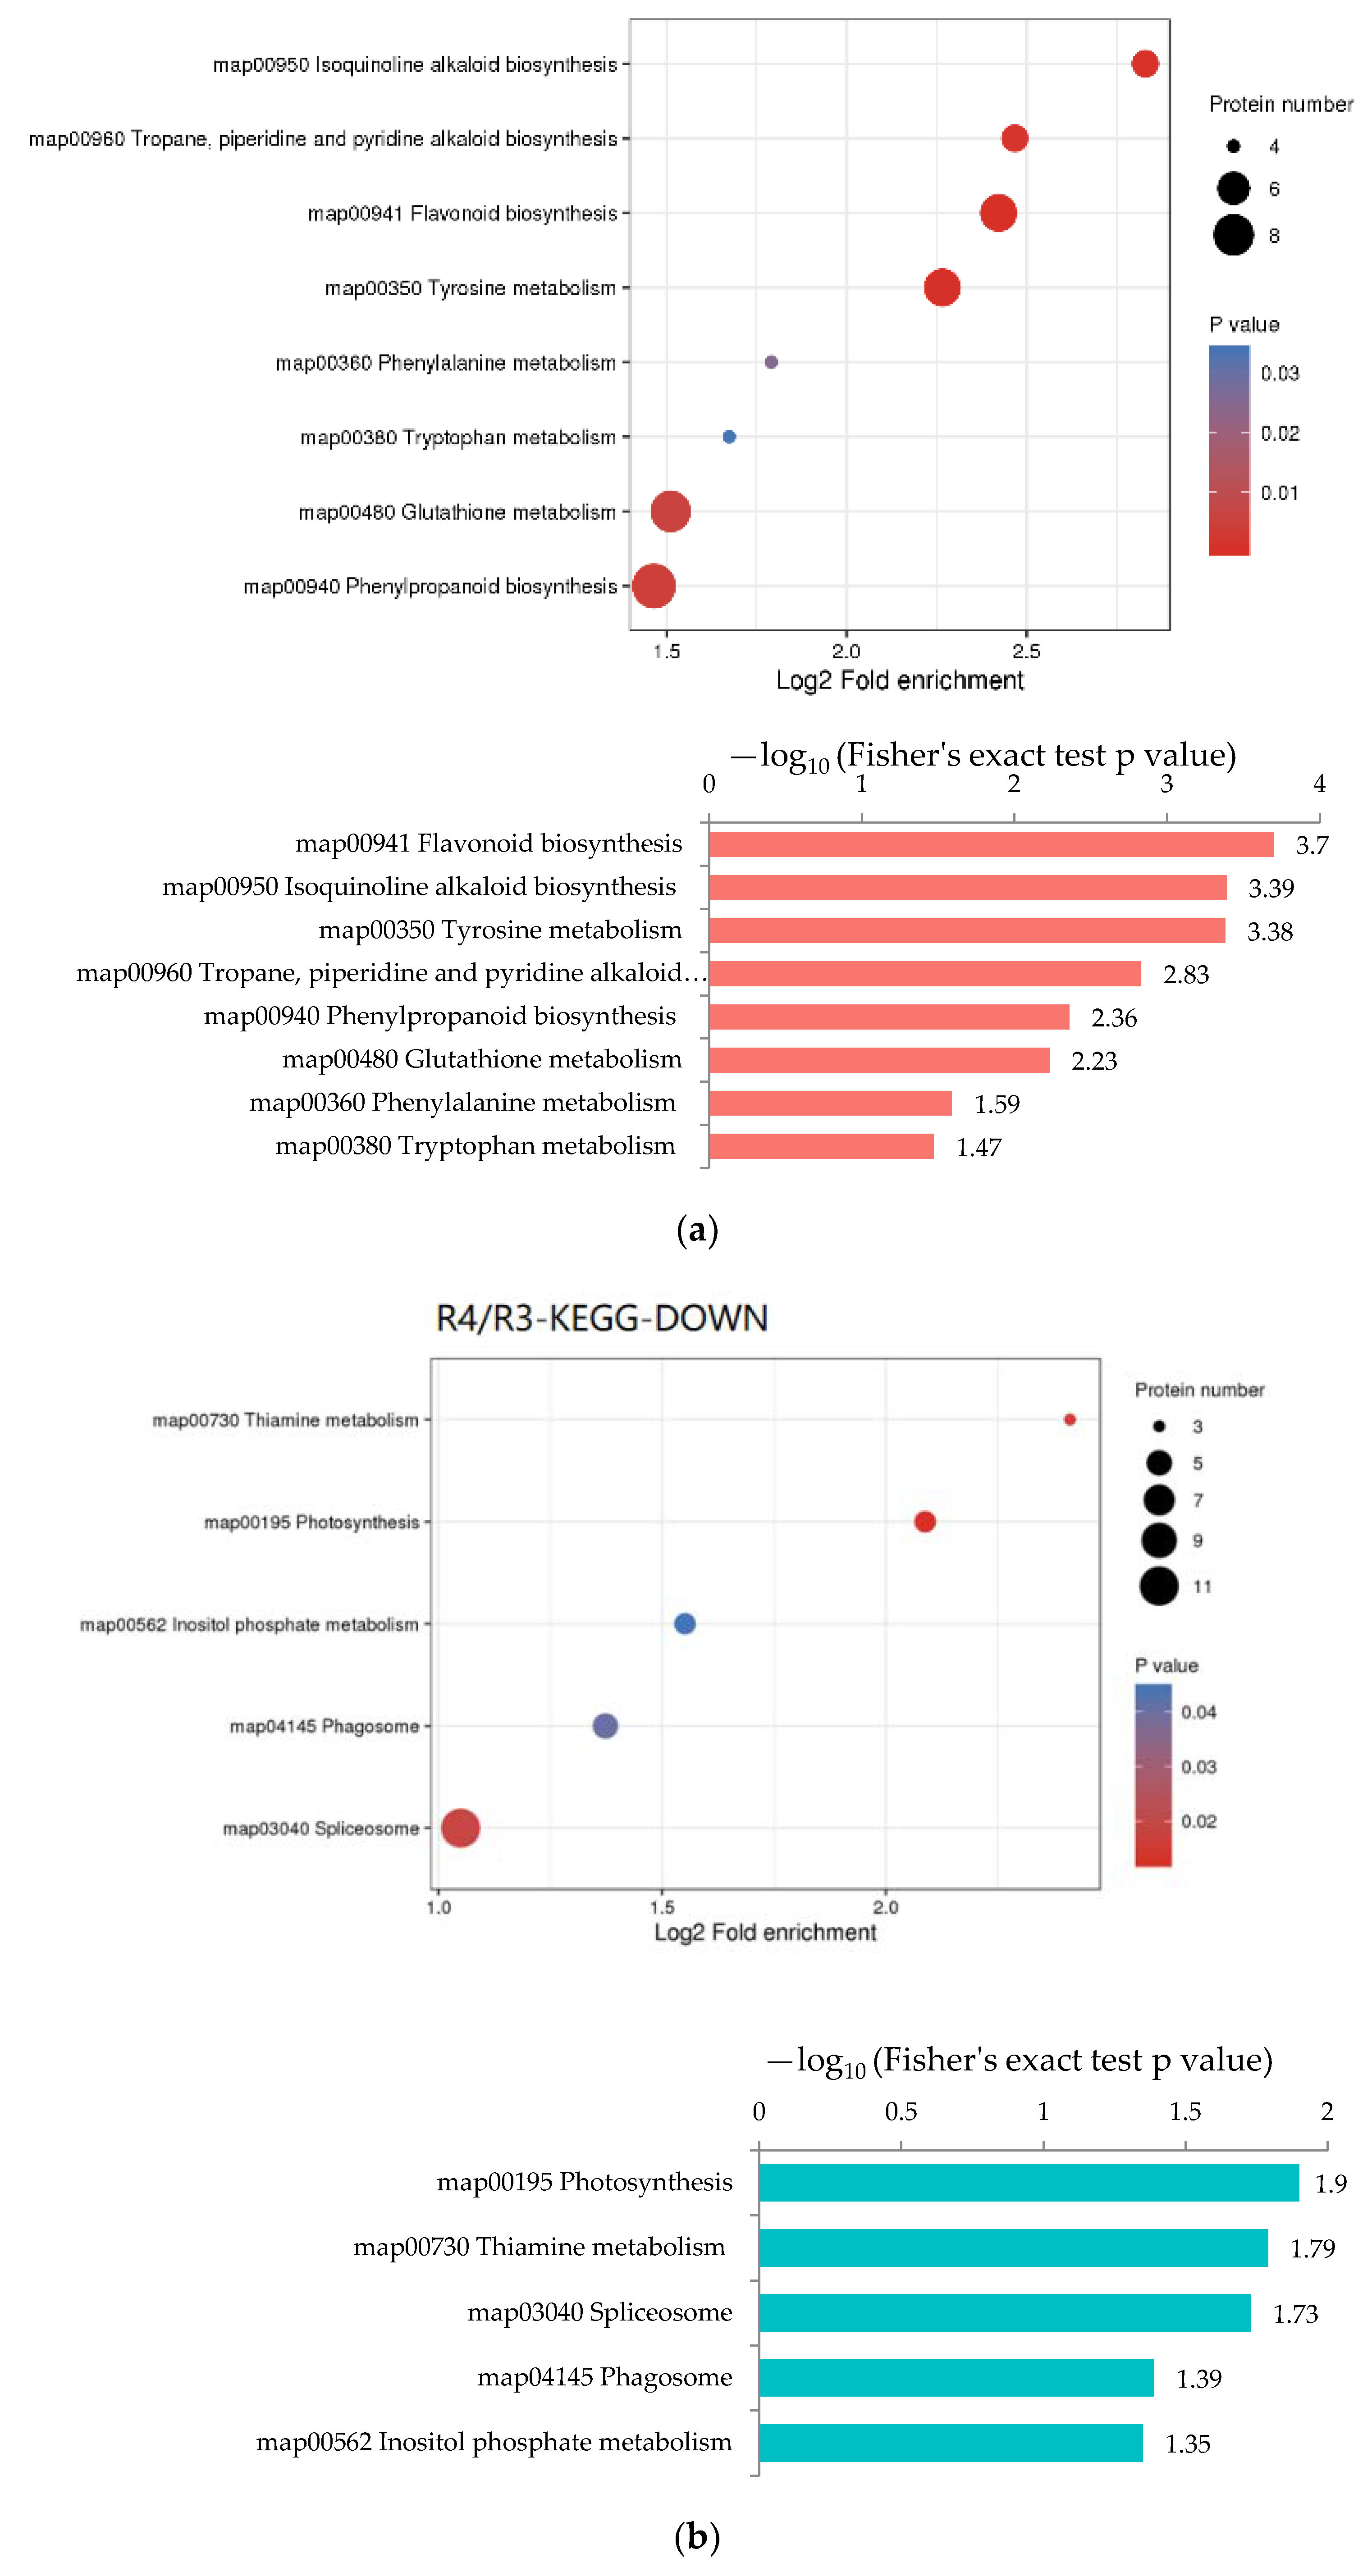
Enrichment analysis was performed on the annotation results of KEGG to study the enrichment of DEPs in different metabolic pathways. In R3/R1, “Protein processing in endoplasmic reticulum”, “Arginine and proline”, “Starch and sucrose metabolism”, “Plant hormone signal transduction” and “Phenylpropanoid biosynthesis” were the pathways that significantly up-regulated (Figure 6a). Metabolic pathways with the most down-regulated proteins were “Phenylpropanoid biosynthesis”, “Ribosome biogenesis in eukaryotes”, “Stilbenoid, diarylheptanoid and gingerol biosynthesis” and “Phagosome” (Figure 6b). In R4/R3, “flavonoid biosynthesis”, “Isoquinoline alkaloid biosynthesis”, “Tyrosine metabolism”, “Tropane, piperidine and pyridine alkaloid biosynthesis” and “Phenylpropanoid biosynthesis” were the pathways with significant up-regulated DEPs (Figure 7a). The down-regulated pathways with high enrichment degrees were “Photosynthesis”, “Thiamine metabolism”, “Spliceosome”, “Phagosome” and “Inositol phosphate metabolism” (Figure 7b).
3.2.3. Screening of Key DEPs
According to the treatment concentration and sampling time set in this study, we selectively ignored some categories containing more DEPs, such as carbohydrate catabolism, starch synthesis, signal transduction, etc. Finally, five categories of concern were determined and the related DEPs were artificially grouped: “Plant hormones”, ”REDOX homeostasis”, ”Ion channel and aquaporin”, ”Cytoskeleton and cell cycle” and ”Cell wall” (Figure 8). Through a literature search, the general functions of the DEPs contained in these categories were determined. Under the classifications of plant hormones, DEPs were mainly related to abscisic acid- (ABA) and cytokinin- (CK) signaling pathways (Figure 9). The DEPs in the ion channels mainly involved cation transport and calcium transport, and the expression of aquaporin changed between the low- and high- salt treatments (Figure 8b). DEPs in REDOX homeostasis mainly contain antioxidant enzymes and key enzymes in the GSH–ASC cycle (Figure 8a). In the cytoskeletal classification, the expressions of tubulin and MAP (microtubule associated proteins) changed significantly under salt stress (Figure 8c), and in the cell wall classification, proteins related to polysaccharide composition, lignin synthesis and the Casparian strip were disturbed by stress (Figure 8d). The expression information of the screened DEPs is shown in Supplementary 2, and the expression changes of some proteins are presented through the heat maps that follow. Their effects will be discussed in detail.
4. Discussion
4.1. Plant Hormones
The response modes of plant hormones to abiotic stress are closely related to their regulation functions upon growth and development. Abscisic acid (ABA) is regarded as a “stress hormone” due to its extensive association with plant adaptation to various stresses [15]. Its accumulation under drought or salt stress induces stomatal closure and growth inhibition. Our data revealed that the ABA receptor (PYL8/PYL9) and kinase (SRK2B) in the ABA signaling pathways were up-regulated under salt stress, but that there was no significant difference between R3 and R4. When stress occurs, ABA accumulates and binds to PYLs, which inhibits PP2C and releases SRK2B. SRK2B induces the expression of the downstream transcription factor, ABF (ABA-responsive element binding factor). The transcription network regulated by ABF contains several downstream responses related to stress adaptation. In this study, ABF increased to double in R3 and slightly decreased in R4, suggesting that the activation of ABA response peaked between the two treatments.
It has been reported that drought or osmotic stress can reduce the cytokinin content by inhibiting the synthesis (IPT) or increasing the degradation (CKX) of its precursor [16]. In this study, a key component of CK signaling, AHP1 (histamine phosphate transfer protein1), decreased first and then increased to a stable level close to R1. AHP1 activates RRBs, the nuclear-localized transcription factors which regulate the expression of CK response genes. The result revealed that the response network triggered by CK was significantly inhibited in R3, then restored in R4.
The antagonistic effect of ABA and CK in regulating physiological processes may be related to crosstalk between the two signaling pathways and is considered a trade-off between growth and resistance under adverse environments (Figure 9) [17,18]. Activated kinase SnRK2s phosphorylates RRAs (ARR5) to inhibit CK signaling in a negative way. On the other hand, RRBs inhibit the activity of SnRK2s under unstressed conditions, thus blocking ABA signals [17]. ABA is normally thought to have a positive regulation on stress adaptation, whereas genetic analysis shows that the regulatory mechanism of CK may be negative [19]. CK negatively regulates the elongation and branching of primary roots. Tissue-specific overexpression of CKX (CK degradation enzyme) enables a larger plant-root system, thus improving stress resistance [20,21]. CK also affects the upward transport of sodium under salt stress through its signal components, RRBs. RRBs negatively regulate the expression of HKT1;1, an important channel responsible for retrieving sodium ions from the xylem back to the root [22].
4.2. Redox State
Adverse environments can destroy the cellular REDOX homeostasis, resulting in the excessive accumulation of reactive oxygen species (ROS), which can destroy a variety of biological macromolecules in cells. ROS and antioxidants have been widely used as indicators to evaluate the stress resistance of plants in previous studies. However, a growing number of studies has shown that plants have developed different kinds of responses, with ROS as the initial signal during their evolutionary process. In some cases, the site-specific expression of certain oxidase increases the concentration of local ROS, which is an important mechanism of plant organ formation and stress adaptation [23,24]. RBOH (Respiratory burst oxidase homolog protein) is a group of calcium-dependent NADPH oxidase. In this study, RBOHH was up-regulated under R4. Activated by CDPK, this enzyme involved in ethylene induced aerenchyma formation under anoxic conditions [25], which may be consistent with the stagnant water uptake by roots under high salinity. ROS also act as a key factor in protein ubiquitination and senescence. The salt treatment of R4 did induce the expression of related proteins, such as STR15 and SAG101 [26,27].
Malondialdehyde (MDA) is the product of membrane lipid peroxidation. The data showed that oxidative stress in roots had no significant influence on the membrane lipids in any of the gradients. In general, the expression of antioxidant enzymes was relatively stable under the treatment of R3 but changed significantly under R4. The superoxide dismutase SODCC.2 doubled that of the control. Two kinds of FeSOD, FSD2 and FSD3, induced by salt stress and responsible for the stability of thylakoid were down-regulated with the aggravation of salt treatment [28]. Hydrogen peroxide isoenzymes CAT1 and catalase cta1 were mainly responsible for removing H2O2 from the peroxysome. Their expression did not change in R3 but upregulated 2 to 3 times of the control in R4. In addition to the response of antioxidant enzymes, changes of some proteins reveal that cells may reduce the production of ROS by maintaining the stability of electron transport chains or chelating free heavy metal ions in the cytoplasm. The oxidation of superoxide anions irreversibly inactivate proteins containing an iron–sulfur cluster, while the expressions of FH and At2g16710 maintain the assembly of iron–sulfur clusters in the mitochondria [29].
Non-enzymatic antioxidants also effectively eliminate ROS. Ascorbic acid (ASC) and glutathione (GSH) are two important non-enzymatic antioxidants [30]. The expressions of key enzymes in this cycle changed significantly between different salinities. APX uses ascorbic acid (AA) as a reductant to reduce H2O2 to H2O and DHA, and DHAR uses GSH as an electron donor to catalyze the DHA reduction to AA. In the proteome data, APX2 significantly increased in R3 and slightly down-regulated in R4, but was still higher than in the control. The expression of DHAR decreased first and then increased. In R3, it was about 0.6 of the control, while in R4 it increased to 1.2 times the control. We can infer that root cells tend to consume AA in order to maintain DHA content under R3. Under high salinity, GSH was consumed and more DHA was reduced to AA. Compared with CAT, APX is more widely distributed and has a stronger affinity for H2O2, which is considered to be a more effective ROS scavenging enzyme under severe stress [31]. An enrichment analysis of the KEGG pathway revealed that glutathione metabolism is strongly influenced by salt stress. APS1 and APS2, two types of sulfate assimilation, decreased with the intensification of salt stress, which may be partly responsible for the decrease of GSH content under stress [32]. Glutathione hydrolase GGT3 is down-regulated under R4, while glutathione S-transferase and glutathione reductase m.19878 were up-regulated in R4. Three enzymes mediate the reduction of NADP+, indirectly promoting the reduction of GSSG to GSH. These data suggest that, although the level of GSH synthesis may be inhibited, mulberry root cells actively reduce the hydrolysis of GSH and accelerate the GSSG–GSH cycle to maintain the GSH pool.
4.3. Ion Channels and Aquaporins
The results showed that the sodium content of leaves increased sharply when the treatment exceeded a certain concentration. A question arises as to whether the change in the accumulation pattern of sodium in leaves was actively regulated by plants or whether the normal ion transport is in a state of runaway due to salt damage. Munns proposed that osmotic shock caused by high salinity is a potential inducement for salt accumulation in shoots. The plasmolysis induced by osmotic shock forms an efficient path to transport ions between the cell wall and protoplasm also interferes with the normal function of ion channels [2]. If the salt burst in leaves is an active ion transport process, it may rely on the site-specific expression of some cation channels such as NSCCs and CHX in pericycle cells to increase the sodium content in the xylem fluid. The same effect can be achieved by closing channels such as AtHKT1;1 that retrieve sodium from the xylem. We identified a protein, CCC1, which functions to co-transport sodium and chloride ions and is predicted to retrieve sodium ions from the xylem in a manner similar to HKT1. CCC1 was down-regulated with the aggravation of salt stress in this study, which seemed to be consistent with the wilting phenotype. However, Henderson found that CCC1 tended to locate on the endoplasmic reticulum rather than the plasma membrane in grape and Arabidopsis, and its transcription level did not respond to salt stress. He proposed that CCC1 might indirectly mediate plant salt tolerance through vesicle transport [33,34].
Many ion channels have been reported to be involved in sodium uptake under salt stress. However, the proportion of these channels to the salt influx remains controversial [35]. Of the 57 cation channel genes in Arabidopsis thaliana, more than one-third encode cyclic nucleotide gating channels, a non-selective cation channel. An electrophysiological analysis in heterologous systems showed that most CNGCs characterized freely conduct K+ and Na+ [36]. The gating of CNGCs highly depends on the presence of cyclic nucleotides, while calmodulin can inhibit the transport of monovalent ions via CNGCs [37]. The CNGC3-null mutant was more resistant to an exogenous high sodium concentration than the wild-type [38]. The expression of CNGC1 identified in proteomic data was down-regulated under the R3 treatment, suggesting that plants may actively reduce the number of channels to cope with the external salty environment.
Based on salt-specific responses induced by the Salt Overly Sensitive (SOS) signaling pathway, most researchers believe that there are specialized sodium sensors mediating the perception of sodium and the subsequent increase of cytoplasmic calcium. Calcium functions as the second messenger and mediates the activation of vacuolar sequestration and ion efflux, which are essential for intracellular ion homeostasis. We identified three types of calcium ion transport, ATPase, ER-localized LCA1, which mediates ion entry into ER [39], and the outward channels ACA9 and ACA2 on the plasma membrane. The expression abundance of these proteins significantly decreased with the increase of salt, meaning that most calcium ions are confined in the cytoplasm. The process of ion efflux requires the activation of the NHA (Na+/H+ antiporters) protein and proton gradient established by the proton pump. Although plasma membrane-localized NHA proteins were not identified in root tissues, a significantly up-regulated proton pump AHA4 reveals extracellular acidification and an increased proton gradient under R4. Veronique found that the Na+/K+ of the aha4 mutant was four to five times higher than that of the wild-type [40]. However, the wilting phenotype in this study under R4 did not support the positive regulation of AHA4 with salt resistance.
It is worth noting that the expression of the aquaporins decreased in R3 and then levelled off to the level of the controls’ in R4. A study focusing on the early stages of salt stress (45 min) reported the downregulation of aquaporins (including the vacuolar aquaporins) and about a 50 percent decrement in water conductivity within a short time. By comparing the effects of sos2-1 knock out and mannitol on the expression of aquaporins, it was found that the decrease of water conductivity in early salt stress was more like a perception of osmotic pressure than a response to ionic stress [41]. Under the continuous two-cycle treatment, the expressions of aquaporins PIP1-1 and PIP2-7 in R3 were down-regulated 50% and 40%, respectively. However, under the high-salt treatment of R4, the expression returned to the level close to that of the control. The downward abundance of aquaporins indicated the decrease of intercellular water migration. It was speculated that mulberry seedlings tended to reduce water transfer to improve the water retention of root cells under a relative low-salt gradient [42]. The higher salt concentration of R4 undoubtedly caused more damage to the seedlings. The expression of aquaporins under R4 may be disturbed by a stronger osmotic pressure or hypoxic environment. Considering the important role of aquaporins in mass flow and the fact that the upward transport of salt depends on transpiration, further study on some possible correlation between the aquaporin and sodium content in leaves is necessary.
4.4. Cytoskeleton and Cell Cycle
Tubulin and actin form the basic constitutional units of the cytoskeleton—microtubule and microfilament, which then cross-link into a more stable structure with the help of MAP (Microtubule-Associated Protein) and ABP (Actin-Binding Protein). By analyzing the DEPs under the classification of the cytoskeleton, the significant downregulation of TUBBs revealed that the structure of the cytoskeleton was disturbed by salt stress. It has been reported that the decrease of tubulin may aggravate plant sensitivity to salt stress [43].
The cytoskeleton works in a process of continuous polymerization and depolymerization, which is called dynamic instability. This characteristic makes cytoskeleton play an important role in the regulation of cell morphology, wall deposition, cell division and differentiation, as well as organelle movement. The reorganization of cortical microtubules in a short period of time is considered an adaptation to salt stress. Using drug intervention in microtubule depolymerization disturbs salt tolerance of plants. The depolymerization of cortical microtubules activates calcium channels in the plasma membrane, so the enhancement of salt tolerance may be related to the increase in the intracellular calcium-ion concentration and the increase of the cytoplasmic calcium coupled with subsequent polymerization [44].
Microtubule-associated proteins(MAPs), which are involved in microtubule assembly and bundle formation and connection with organelles, are important components that assist microtubules in performing their cellular functions. The experimental data showed that MAP65-1 significantly decreased in R4. MAP65-1 mediated the rapid depolymerization of microtubules under salt stress through phosphorylation, and the microtubule reorganization of its mutant strain was also significantly inhibited [45,46]. MAP65-6 shares about 44% of its sequence identity with MAP65-1 and was significantly down-regulated under R4. The in vitro experiment showed that MAP65-6 tends to organize microtubules into a mesh-like network of crisscrosses rather than a conventional sarciniform, which is more stable under salt stress (there was no significant depolymerization under 500 mM salt stress) [47]. The plus-end-tracking protein EB1 binds to the plus ends of microtubules and later transfer them to the endomembrane system following microtubule shrinkage. The expression of EB1 is essential for cell polarity development [48]. Data showed that EB1B drops significantly in R3 and R4. Another MAP, MOR1, influences the binding of EB1 to the plus end of microtubules by altering the structure of the plus end or directly interacting with EB1. MOR1 mutants showed slowing down and even suspension of microtubule dynamics [49]. Proteome data showed a significant reduction in MOR1 under R4 treatment, and EB1 was down-regulated by R3.
Studies related to microfilaments were fewer compared with microtubules, but the existing experimental evidence shows that the enhancement of microfilaments assembly is positively correlated with salt stress. Wang found that the assembly of Arabidopsis microfilaments was enhanced under low-salt treatment, while it was strengthened accompanied by disintegrating under the high-salt treatment [50]. ADFs are important proteins that balance G-actin and F-actin in cells, and their deletion or overexpression will lead to defects in plant growth and development [51]. In this study, two ADFs, ADF1 and ADF6, were significantly reduced under the treatment of R4, indicating that the depolymerization rate of microfilaments was disturbed.
The integrity and dynamics of the cytoskeleton are important prerequisites for cell division. Examining the DEPs under cytoskeleton and cell-cycle classification is helpful in predicting the progress of cell division under salt stress. MOR1 regulates the length of microtubule assembly, thus affecting the distribution of chromosomes during mitosis [52]. Unphosphorylated MAP65-1 causes microtubules to gather in the middle area of the spindle and mitosis to stagnate [53]. Cdc25 directly affects cell G2/M conversion in yeast and animals in a dose-dependent manner [54,55]. The results showed that CDC25 presented a change pattern of up to down, indicating that it may have an important function between R3 and R4. Another protein associated with cell division, NASP-related protein Sim3, is involved in CenH3 (a variant of histone H3) deposition as a chaperone, thus causing centromeric formation and kinetochore assembly to ensure the uniform and equal distribution of genetic material to daughter cells [56]. It can be speculated that salt treatment of R4 might affect the mitotic process, which would make it difficult for plants to achieve normal growth and development under long-term stress.
4.5. Cell Wall and Casparian Strip
In the symplast pathway, plasmodesmata allow the rapid diffusion of ions into adjacent cells. Specialized secretory cells such as salt glands or nectaries usually possess more plasmodesmata. Studies have shown that the density of plasmodesmata between the endodermis and pericycle is higher than that of other tissues, thus increasing the flux of macromolecules and ions through the endodermis [57]. Callose is deposited in the neck of plasmodesmata, and the synthesis or degradation of callose is important for regulating the transmissibility of plasmodesmata [58]. In this study, proteins associated with callose synthesis were identified to be down-regulated; this downtrend seems to be in response to the low salinity treatment of R3.
The apoplast bypass transfers sodium ions to the shoot by passive diffusion. In this study, salt stress strongly altered the structure of the extracellular space and significantly suppressed the synthesis of cell wall components such as cellulose, hemicellulose and pectin. These polysaccharides are closely related to cell wall elongation, which directly affects cell expansion. On the other hand, the chemical properties of these components determine the electronegativity of extracellular space, so the reduction of polysaccharide synthesis affects the cationic retention of the cell wall [59]. The directed secretion of the cell wall components to the extracellular space is precisely regulated by the endoplasmic reticulum and vesicles. The expressions of four RABA GTPase involved in vesicle transport were sharply decreased under R3 treatment, which may affect the secretion of the cell wall components [60].
Cellulose synthesis is catalyzed by CSC (Cellulose Synthase Complex) on the plasma membrane. Six subunits of the complex are composed of cellulose synthase, which is encoded by the CesA (Cellulose Synthase A) gene family. In the study of AtrbohF mutant strains, the CesA7 mutation caused the xylem collapse and reduced the transpiration stream, indirectly reducing salt accumulation in the shoot [23]. In this study, three CesAs(1/3/4) were significantly down-regulated under R3 and were difficult to quantify in R4. Among them, CESA1/3 is mainly responsible for the deposition of cellulose in hte primary cell wall, and the cell expansion of the deletion mutant was inhibited [61]. CesA4 is responsible for cellulose deposition in secondary cell walls, and its downregulation has a more pronounced effect on the xylem and sclerenchyma [62]. STL1(Probable glycosyltransferase STELLO1) in the Golgi cavity was down-regulated with the increase of salinity; its role is to regulate the assembly and secretion of CSC in the intimal system [63]. In addition, proteome data showed that the expression level of CSI1 (Cellulose Synathase Interactive 1) was negatively correlated with salt stress intensity. Under non-stress conditions, CSI helps CSC move along cortical microtubules and produce cellulose. When salt stress occurs, cortical microtubules depolymerize, and CSC is transferred from the plasma membrane to the intracellular component of CSC(CC), which participates in the reorganization of the microtubule arrays in response to the salt stress; finally, CSC returns to the plasma membrane after the reorganization is accomplished [64].
Lignification and suberization of the cell wall affect the conductivity of water and ions in the apoplast path [65]. Krishnamurthy designed a comparison test between salt-tolerance exercise and direct salt stress and found that the exercise of resistance induced the deposition of suberin at an early stage of stress, compared with the salt treatment directly exposed to 200 mM NaCl without acclimation, while the aboveground sodium was significantly reduced [66]. According to the changes of DEPs in the “phenylpropanine biosynthesis” (KEGG pathway), the synthesis of the phenolic components, a precursor of lignin and suberin, was significantly inhibited, and the expressions of phenylalanine lyase (M. 1029), 4-coumarate coenzyme A ligase (4CL1) and trans-cinnamate monooxygenase (CYP73A16) were significantly down-regulated. In addition, the expression inhibition of cinnamyl alcohol dehydrogenase CAD1 (m. 16440) in the specific pathway of the lignin synthesis increased first and then decreased from R3 to R4. Peroxidase and laccase are responsible for the last step of lignin formation: the oxidative cross-linking of lignin monomers. Proteomic results showed that their expression was complex and varied. The expression of LAC7 remained stable in R3 but increased five times that of the control in R4. Arabidopsis LAC7 is the only laccase target for miRNA857, and its expression level is related to the formation of a secondary xylem [67], which reflects the research on poplar LAC2. The water transport capacity of Arabidopsis was significantly increased by overexpressing this laccase gene [68].
The Casparian strip (CS) is a layer of cells in the endodermis of primary roots adjacent to the vascular column and are banded and closely bound to the plasma membrane. The plasmolysis experiment showed that hyperosmotic treatment does not separate the CS and the plasma membrane [69]. Using mathematical modeling, Foster compared the effects of the CS and the suberin on the radial migration of ions, and the results showed that the presence of the CS was the key to restricting the excess sodium in the shoot, and, more importantly, its role could not be replaced by membrane transporters [70]. The formation of the CS is precisely regulated by the SGN signaling pathway. The CIF (Casparian Strip Integrity Factor) peptide produced in the stele is the ligand of SGN3. After binding with SGN3, it phosphorylates SGN1, and then activates RBOHF to induce the production of local reactive oxygen species. The oxidative cross-linking of the lignin monomer is mediated by peroxidase [71,72,73]. In this study, the expression patterns of PERs were different, which may be due to the tissue-specific lignification under salt stress. The precise localization of the CS in endodermal cells depends on the initial interval determined by CASP, while EXO70A1, a component of the exocyst, is responsible for guiding the localization of CASP. Distribution of CASPs in EXO70A1 mutant strains tends to be randomized. At the same time, LAC3 and UCC1 were located at the boundary and central microregion of the CS formation area, respectively, guiding the fixed-point deposition of the lignin [74]. The expression of EXO70B1 was down-regulated with the increase of salt stress, and the expression of UCC1 remained stable under R3 but fell by about 80% in R4. The absence of UCC1 lead to a decrease in lignin deposition in the central microregion of CS and an increase in ion transmissivity from the roots to the shoots (Figure 10) [75].
5. Conclusions
We determined the initial concentration of salt burst in mulberry leaves by physiological indicators, established differential proteome sets associated with this phenotype and screened five categories though bioinformatic analysis and literature search. The original intention of this experiment was to observe the invocation of known salt-tolerance mechanisms in mulberry under high-salt stress and to determine its main adaptation mode. However, as the experiment progressed, the more pressing question was whether these mechanisms function properly after a salt burst occurred in the leaves. The proteomic data did not provide the expected sufficient support, but they revealed some interesting results. There were significant changes in the expressions of some DEPs between low- and high- salt treatments, such as in the aquaporins, cytokinin-mediated transcription factors and key enzymes in the GSH–ASC cycle. The regulation of these DEPs is very important in salt-stress adaptation, and the driving factors and subsequent effects of their expression changes are worthy of further study. Combined with the observations of the experimental process and the analysis of the data, it is noteworthy that the high-salt stress obviously destroyed the extracellular space of the mulberry root. However, the transport of sodium and water related to the apoplast has always been the weak point and difficulty in salt-stress studies. The changes in the cell wall components, including the decrease of lignification and suberization, will affect the water conductivity of apoplast, and the absence of the Casparian strip will greatly increase the load of sodium ions in the transpiration stream. The expression changes of these DEPs may be closely related to the phenotype we were concerned with and independent of the intracellular ion regulation mechanisms. Further experiments are needed to demonstrate the relationship between the two.
This paper provides a new breakthrough point for the study of mulberry under high-salt stress by means of omics. It should be emphasized that the proteomic is still in an incomplete stage of development, and its disadvantages should not be ignored. On one hand, compared with the transcriptome, the proteomic is closer to the plant phenotype, and the explanation of response mechanisms is more direct. On the other hand, restricted by experimental method, the proteome cannot reach the information coverage at the level of the transcriptome. In this study, the method of proteome analysis is undoubtedly missing a lot of valuable information, so a multi-omics study would still add to the argument. Another problem is how to effectively study the water–salt balance between the roots and leaves on a time scale to give strong theoretical support for the selection of the sampling time points. We may need more real-time visual experimental means to observe the dynamics of water and salt in tissues under salt stress and, on this basis, carry out omics sampling so as to analyze the whole process on the level of the whole plant.
Supplementary Materials
The following are available online at https://0-www-mdpi-com.brum.beds.ac.uk/article/10.3390/f12101384/s1: Supplementary 1: Quality control of MS; Differential expressed proteins, Supplementary 2: Screened key DEPs.
Author Contributions
Y.W. and J.Y. conceived and designed the experiments; J.Y. performed the experiments and analyzed the data; J.Y. wrote the paper. All authors have read and agreed to the published version of the manuscript.
Funding
This work was financially supported by the National Key R&D Program of China (2016YFC0502704).
Conflicts of Interest
The authors declare no conflict of interest.
References
- Luo, J.; Tang, S.; Peng, X.; Yan, X.; Zeng, X.; Li, J.; Li, X.; Wu, G. Elucidation of Cross-Talk and Specificity of Early Response Mechanisms to Salt and PEG-Simulated Drought Stresses in Brassica napus Using Comparative Proteomic Analysis. PLoS ONE 2015, 10, e0138974. [Google Scholar] [CrossRef] [PubMed]
- Munns, R. Comparative physiology of salt and water stress. Plant Cell Environ. 2002, 25, 239–250. [Google Scholar] [CrossRef]
- Zhu, J.-K. Abiotic Stress Signaling and Responses in Plants. Cell 2016, 167, 313–324. [Google Scholar] [CrossRef] [PubMed] [Green Version]
- Wang, C.; Li, J.; Yuan, M. Salt tolerance requires cortical microtubule reorganization in Arabidopsis. Plant Cell Physiol. 2007, 48, 1534–1547. [Google Scholar] [CrossRef] [Green Version]
- Hauser, F.; Horie, T. A conserved primary salt tolerance mechanism mediated by HKT transporters: A mechanism for sodium exclusion and maintenance of high K(+)/Na(+) ratio in leaves during salinity stress. Plant Cell Environ. 2010, 33, 552–565. [Google Scholar] [CrossRef]
- Huang, X.; Liu, Y.; Li, J.; Xiong, X.; Yin, X.; Chen, Y.; Feng, D.; Li, S. Effects of simulated soil drought on physiological characteristics of young Mulber-ry (Morus alba L.) Trees in the Hydro-fluctuation Belt of the Three Gorges Reservoir Area. J. Sounthw. Univ. (Natl. Sci. Ed.) 2013, 35, 127–132. [Google Scholar]
- Yin, C.; Fang, R.; Shang, C.; Shen, Q.; Cao, X.; Cheng, J. Salt-tolerance Related Physiological and Biochemical Characteristics and Salt Tolerance Evaluation of Three Practical Mulberry Varieties. Sci. Seric. 2018, 44, 359–366. [Google Scholar]
- He, N.; Zhang, C.; Qi, X.; Zhao, S.; Tao, Y.; Yang, G.; Lee, T.-H.; Wang, X.; Cai, Q.; Li, D.; et al. Draft genome sequence of the mulberry tree Morus notabilis. Nat. Commun. 2013, 4, 2445. [Google Scholar] [CrossRef] [Green Version]
- Lu, N.; Luo, Z.; Ke, Y.; Dai, L.; Duan, H.; Hou, R.; Cui, B.; Dou, S.; Zhang, Y.; Sun, Y.; et al. Growth, Physiological, Biochemical, and Ionic Responses of Morus alba L. Seedlings to Various Salinity Levels. Forests 2017, 8, 488. [Google Scholar] [CrossRef] [Green Version]
- Hasegawa, P.M. Sodium (Na+) homeostasis and salt tolerance of plants. Environ. Exp. Bot. 2013, 92, 19–31. [Google Scholar] [CrossRef]
- Lu, R. Methods for Soil Agrochemical Analysis; China Agricultural Science and Technology Press: Beijing, China, 2010; pp. 310–311. [Google Scholar]
- Hou, F. Plant Physiology Experiment, 3rd ed.; China Science Publishing & Media Ltd.: Beijing, China, 2015. [Google Scholar]
- Barrell, D.; Dimmer, E.; Huntley, R.P.; Binns, D.; O’Donovan, C.; Apweiler, R. The GOA database in 2009—An integrated Gene Ontology Annotation resource. Nucleic Acids Res. 2009, 37, 396–403. [Google Scholar] [CrossRef] [Green Version]
- Kanehisa, M.; Sato, Y. KEGG Mapper for inferring cellular functions from protein sequences. Protein Sci. 2020, 29, 28–35. [Google Scholar] [CrossRef] [Green Version]
- Sharma, A.; Shahzad, B.; Kumar, V.; Kohli, S.K.; Sidhu, G.P.S.; Bali, A.S.; Handa, N.; Kapoor, D.; Bhardwaj, R.; Zheng, B. Phytohormones Regulate Accumulation of Osmolytes Under Abiotic Stress. Biomolecules 2019, 9, 285. [Google Scholar] [CrossRef] [Green Version]
- Černý, M.; Kuklová, A.; Hoehenwarter, W.; Fragner, L.; Novák, O.; Rotková, G.; Jedelsky, P.L.; Žáková, K.; Šmehilová, M.; Strnad, M.; et al. Proteome and metabolome profiling of cytokinin action in Arabidopsis identifying both distinct and similar responses to cytokinin down- and up-regulation. J. Exp. Bot. 2013, 64, 4193–4206. [Google Scholar] [CrossRef] [PubMed] [Green Version]
- Huang, X.; Hou, L.; Meng, J.; You, H.; Li, Z.; Gong, Z.; Yang, S.; Shi, Y. The Antagonistic Action of Abscisic Acid and Cytokinin Signaling Mediates Drought Stress Response in Arabidopsis. Mol. Plant 2018, 11, 970–982. [Google Scholar] [CrossRef] [PubMed] [Green Version]
- Guo, Y.; Gan, S. AtMYB2 regulates whole plant senescence by inhibiting cytokinin-mediated branching at late stages of development in Arabidopsis. Plant Physiol. 2011, 156, 1612–1619. [Google Scholar] [CrossRef] [Green Version]
- Cortleven, A.; Leuendorf, J.E.; Frank, M.; Pezzetta, D.; Bolt, S.; Schmülling, T. Cytokinin action in response to abiotic and biotic stresses in plants. Plant Cell Environ. 2019, 42, 998–1018. [Google Scholar] [CrossRef]
- Ramireddy, E.; Chang, L.; Schmülling, T. Cytokinin as a mediator for regulating root system architecture in response to environmental cues. Plant Signal. Behav. 2014, 9, e27771. [Google Scholar] [CrossRef] [Green Version]
- Ramireddy, E.; Hosseini, S.A.; Eggert, K.; Gillandt, S.; Gnad, H.; von Wirén, N.; Schmülling, T. Root Engineering in Barley: Increasing Cytokinin Degradation Produces a Larger Root System, Mineral Enrichment in the Shoot and Improved Drought Tolerance. Plant Physiol. 2018, 177, 1078–1095. [Google Scholar] [CrossRef] [Green Version]
- Mason, M.G.; Jha, D.; Salt, D.E.; Tester, M.; Hill, K.; Kieber, J.J.; Schaller, G.E. Type-B response regulators ARR1 and ARR12 regulate expression of AtHKT1;1 and accumulation of sodium in Arabidopsis shoots. Plant J. 2010, 64, 753–763. [Google Scholar] [CrossRef] [PubMed]
- Jiang, C.; Belfield, E.J.; Mithani, A.; Visscher, A.; Ragoussis, J.; Mott, R.; Smith, J.A.; Harberd, N.P. ROS-mediated vascular homeostatic control of root-to-shoot soil Na delivery in Arabidopsis. EMBO J. 2012, 31, 4359–4370. [Google Scholar] [CrossRef] [Green Version]
- Marino, D.; Dunand, C.; Puppo, A.; Pauly, N. A burst of plant NADPH oxidases. Trends Plant Sci. 2012, 17, 9–15. [Google Scholar] [CrossRef] [PubMed]
- Yamauchi, T.; Yoshioka, M.; Fukazawa, A.; Mori, H.; Nishizawa, N.K.; Tsutsumi, N.; Yoshioka, H.; Nakazono, M. An NADPH Oxidase RBOH Functions in Rice Roots during Lysigenous Aerenchyma Formation under Oxygen-Deficient Conditions. Plant Cell 2017, 29, 775–790. [Google Scholar] [CrossRef] [Green Version]
- Sung, A.O.; Sang, Y.L.; Il, K.C.; Choon-Hwan, L.; Hong, G.N. A senescence-associated gene of Arabidopsis thalina is distinctively regulated during natural and artificially induced leaf senescence. Plant Mol. Biol. 1996, 30, 739–754. [Google Scholar]
- Hye, R.W.; Jin, H.K.; Hong, G.N.; Pyung, O.L. The Delayed Leaf Senescence Mutants of Arabidopsis, ore1, ore3, and ore9 are Tolerant to Oxidative Stress. Plant Cell Physiol. 2004, 45, 923–932. [Google Scholar]
- Xing, Y.; Chen, W.; Jia, W.; Zhang, J. Mitogen-activated protein kinase kinase 5 (MKK5)-mediated signalling cascade regulates expression of iron superoxide dismutase gene in Arabidopsis under salinity stress. J. Exp. Bot. 2015, 66, 5971–5981. [Google Scholar] [CrossRef] [Green Version]
- Turowski, V.R.; Aknin, C.; Maliandi, M.V.; Buchensky, C.; Leaden, L.; Peralta, D.A.; Busi, M.V.; Araya, A.; Gomez-Casati, D.F. Frataxin Is Localized to Both the Chloroplast and Mitochondrion and Is Involved in Chloroplast Fe-S Protein Function in Arabidopsis. PLoS ONE 2015, 10, e0141443. [Google Scholar] [CrossRef] [Green Version]
- Ball, L.; Accotto, G.-P.; Bechtold, U.; Creissen, G.; Funck, D.; Jimenez, A.; Kular, B.; Leyland, N.; Mejia-Carranza, J.; Reynolds, H.; et al. Evidence for a direct link between glutathione biosynthesis and stress defense gene expression in Arabidopsis. Plant Cell 2004, 16, 2448–2462. [Google Scholar] [CrossRef] [PubMed] [Green Version]
- Das, K.; Roychoudhury, A. Reactive oxygen species (ROS) and response of antioxidants as ROS-scavengers during environmental stress in plants. Front. Environ. Sci. 2014, 2, 67. [Google Scholar] [CrossRef] [Green Version]
- Nazar, R.; Iqbal, N.; Syeed, S.; Khan, N.A. Salicylic acid alleviates decreases in photosynthesis under salt stress by enhancing nitrogen and sulfur assimilation and antioxidant metabolism differentially in two mungbean cultivars. J. Plant Physiol. 2011, 168, 807–815. [Google Scholar] [CrossRef]
- Henderson, S.W.; Wege, S.; Gilliham, M. Plant Cation-Chloride Cotransporters (CCC): Evolutionary Origins and Functional Insights. Int. J. Mol. Sci. 2018, 19, 492. [Google Scholar] [CrossRef] [Green Version]
- Henderson, S.W.; Wege, S.; Qiu, J.; Blackmore, D.H.; Walker, A.R.; Tyerman, S.D.; Walker, R.R.; Gilliham, M. Grapevine and Arabidopsis Cation-Chloride Cotransporters Localize to the Golgi and Trans-Golgi Network and Indirectly Influence Long-Distance Ion Transport and Plant Salt Tolerance. Plant Physiol. 2015, 169, 2215–2229. [Google Scholar]
- Isayenkov, S.V.; Maathuis, F.J.M. Plant Salinity Stress: Many Unanswered Questions Remain. Front. Plant Sci. 2019, 10, 80. [Google Scholar] [CrossRef] [Green Version]
- Leng, Q.; Mercier, R.W.; Hua, B.-G.; Fromm, H.; Berkowitz, G.A. Electrophysiological analysis of cloned cyclic nucleotide-gated ion channels. Plant Physiol. 2002, 128, 400–410. [Google Scholar] [CrossRef] [PubMed]
- Hua, B.-G.; Mercier, R.W.; Zielinski, R.E.; Berkowitz, G.A. Functional interaction of calmodulin with a plant cyclic nucleotide gated cation channel. Plant Physiol. Biochem. 2003, 41, 945–954. [Google Scholar] [CrossRef]
- Gobert, A.; Park, G.; Amtmann, A.; Sanders, D.; Maathuis, F.J.M. Arabidopsis thaliana cyclic nucleotide gated channel 3 forms a non-selective ion transporter involved in germination and cation transport. J. Exp. Bot. 2006, 57, 791–800. [Google Scholar] [CrossRef] [PubMed]
- Larry, E.W.; Nicholas, N.E.; Alan, B.B. Higher plant Ca2+-ATPase: Primary structure and regulation of mRNA abundance by salt. Proc. Natl. Acad. Sci. USA 1992, 89, 9205–9209. [Google Scholar]
- Vitart, V.; Baxter, I.; Doerner, P.; Harper, J.F. Evidence for a role in growth and salt resistance of a plasma membrane H+-ATPase in the root endodermis. Plant J. 2001, 27, 191–201. [Google Scholar] [CrossRef] [PubMed] [Green Version]
- Boursiac, Y.; Chen, S.; Luu, D.-T.; Sorieul, M.; van den Dries, N.; Maurel, C. Early effects of salinity on water transport in Arabidopsis roots. Molecular and cellular features of aquaporin expression. Plant Physiol. 2005, 139, 790–805. [Google Scholar] [CrossRef] [PubMed] [Green Version]
- Martre, P.; Morillon, R.; Barrieu, F.; North, G.B.; Nobel, P.S.; Chrispeels, M.J. Plasma membrane aquaporins play a significant role during recovery from water deficit. Plant Physiol. 2002, 130, 2101–2110. [Google Scholar] [CrossRef] [Green Version]
- Rodríguez-Milla, M.A.; Salinas, J. Prefoldins 3 and 5 play an essential role in Arabidopsis tolerance to salt stress. Mol. Plant 2009, 2, 526–534. [Google Scholar] [CrossRef] [Green Version]
- Laurence, T.; Christian, M.; Patrice, T.; Annick, G.; Nichel, R.; Marc, M.; Raoul, R. Activation of plasma membrane voltage-dependent calcium-permeable channels by disruption of microtubules in carrot cells. FEBS Lett. 1996, 393, 13–18. [Google Scholar]
- Zhou, S.; Chen, Q.; Li, X.; Li, Y. MAP65-1 is required for the depolymerization and reorganization of cortical microtubules in the response to salt stress in Arabidopsis. Plant Sci. 2017, 264, 112–121. [Google Scholar] [CrossRef]
- Zhang, Q.; Lin, F.; Mao, T.; Nie, J.; Yan, M.; Yuan, M.; Zhang, W. Phosphatidic acid regulates microtubule organization by interacting with MAP65-1 in response to salt stress in Arabidopsis. Plant Cell 2012, 24, 4555–4576. [Google Scholar] [CrossRef] [Green Version]
- Mao, T.; Jin, L.; Li, H.; Liu, B.; Yuan, M. Two microtubule-associated proteins of the Arabidopsis MAP65 family function differently on microtubules. Plant Physiol. 2005, 138, 654–662. [Google Scholar] [CrossRef] [Green Version]
- Mathur, J.; Mathur, N.; Kernebeck, B.; Srinivas, B.P.; Hülskamp, M. A novel localization pattern for an EB1-like protein links microtubule dynamics to endomembrane organization. Curr. Biol. 2003, 13, 1991–1997. [Google Scholar] [CrossRef] [PubMed] [Green Version]
- Kawamura, E.; Wasteneys, G.O. MOR1, the Arabidopsis thaliana homologue of Xenopus MAP215, promotes rapid growth and shrinkage, and suppresses the pausing of microtubules in vivo. J. Cell Sci. 2008, 121, 4114–4123. [Google Scholar] [CrossRef] [PubMed] [Green Version]
- Wang, C.; Zhang, L.; Yuan, M.; Ge, Y.; Liu, Y.; Fan, J.; Ruan, Y.; Cui, Z.; Tong, S.; Zhang, S. The microfilament cytoskeleton plays a vital role in salt and osmotic stress tolerance in Arabidopsis. Plant Biol. 2010, 12, 70–78. [Google Scholar] [CrossRef] [PubMed]
- Nan, Q.; Qian, D.; Niu, Y.; He, Y.; Tong, S.; Niu, Z.; Ma, J.; Yang, Y.; An, L.; Wan, D.; et al. Plant Actin-Depolymerizing Factors Possess Opposing Biochemical Properties Arising from Key Amino Acid Changes throughout Evolution. Plant Cell 2017, 29, 395–408. [Google Scholar] [CrossRef] [Green Version]
- Kawamura, E.; Himmelspach, R.; Rashbrooke, M.C.; Whittington, A.T.; Gale, K.R.; Collings, D.A.; Wasteneys, G.O. MICROTUBULE ORGANIZATION 1 regulates structure and function of microtubule arrays during mitosis and cytokinesis in the Arabidopsis root. Plant Physiol. 2006, 140, 102–114. [Google Scholar] [CrossRef] [Green Version]
- Smertenko, A.P.; Chang, H.-Y.; Sonobe, S.; Fenyk, S.I.; Weingartner, M.; Bögre, L.; Hussey, P.J. Control of the AtMAP65-1 interaction with microtubules through the cell cycle. J. Cell Sci. 2006, 119, 3227–3237. [Google Scholar] [CrossRef] [Green Version]
- Spadafora, N.D.; Doonan, J.H.; Herbert, R.J.; Bitonti, M.B.; Wallace, E.; Rogers, H.J.; Francis, D. Arabidopsis T-DNA insertional lines for CDC25 are hypersensitive to hydroxyurea but not to zeocin or salt stress. Ann. Bot. 2011, 107, 1183–1192. [Google Scholar] [CrossRef] [PubMed] [Green Version]
- Francis, D. A commentary on the G₂/M transition of the plant cell cycle. Ann. Bot. 2011, 107, 1065–1070. [Google Scholar] [CrossRef] [Green Version]
- Le Goff, S.; Keçeli, B.N.; Jeřábková, H.; Heckmann, S.; Rutten, T.; Cotterell, S.; Schubert, V.; Roitinger, E.; Mechtler, K.; Franklin, F.C.H.; et al. The H3 histone chaperone NASP SIM3 escorts CenH3 in Arabidopsis. Plant J. 2020, 101, 71–86. [Google Scholar] [CrossRef] [Green Version]
- Barberon, M.; Vermeer, J.E.M.; de Bellis, D.; Wang, P.; Naseer, S.; Andersen, T.G.; Humbel, B.M.; Nawrath, C.; Takano, J.; Salt, D.E.; et al. Adaptation of Root Function by Nutrient-Induced Plasticity of Endodermal Differentiation. Cell 2016, 164, 447–459. [Google Scholar] [CrossRef] [Green Version]
- Zavaliev, R.; Ueki, S.; Epel, B.L.; Citovsky, V. Biology of callose (β-1,3-glucan) turnover at plasmodesmata. Protoplasma 2011, 248, 117–130. [Google Scholar] [CrossRef] [PubMed]
- Byrt, C.S.; Munns, R.; Burton, R.A.; Gilliham, M.; Wege, S. Root cell wall solutions for crop plants in saline soils. Plant Sci. 2018, 269, 47–55. [Google Scholar] [CrossRef] [PubMed]
- Lunn, D.; Gaddipati, S.R.; Tucker, G.A.; Lycett, G.W. Null mutants of individual RABA genes impact the proportion of different cell wall components in stem tissue of Arabidopsis thaliana. PLoS ONE 2013, 8, e75724. [Google Scholar] [CrossRef] [Green Version]
- Burn, J.E.; Hocart, C.H.; Birch, R.J.; Cork, A.C.; Williamson, R.E. Functional analysis of the cellulose synthase genes CesA1, CesA2, and CesA3 in Arabidopsis. Plant Physiol. 2002, 129, 797–807. [Google Scholar] [CrossRef] [PubMed] [Green Version]
- Pubudu, P.H.; Dominick, A.M.; Karen, S.O.; Michael, J.H.; Kyuyoung, H.; Kabindra, K.; Seong, H.K.; Tobias, I.B.; Samuel, P.H. Perturbation of Brachypodium distachyon CELLULOSE SYNTHASE A4 or 7 results in abnormal cell walls. BMC Plant Biol. 2013, 13, 131. [Google Scholar]
- Zhang, Y.; Nikolovski, N.; Sorieul, M.; Vellosillo, T.; McFarlane, H.E.; Dupree, R.; Kesten, C.; Schneider, R.; Driemeier, C.; Lathe, R.; et al. Golgi-localized STELLO proteins regulate the assembly and trafficking of cellulose synthase complexes in Arabidopsis. Nat. Commun. 2016, 7, 11656. [Google Scholar] [CrossRef] [Green Version]
- Endler, A.; Kesten, C.; Schneider, R.; Zhang, Y.; Ivakov, A.; Froehlich, A.; Funke, N.; Persson, S. A Mechanism for Sustained Cellulose Synthesis during Salt Stress. Cell 2015, 162, 1353–1364. [Google Scholar] [CrossRef] [Green Version]
- Han, X.; Mao, L. Research Progress on Constituents, Histochemical Characteristics and Biosynthesis of Suberin. Chin. Bull. Bot. 2017, 52, 358–374. [Google Scholar]
- Krishnamurthy, P.; Ranathunge, K.; Nayak, S.; Schreiber, L.; Mathew, M.K. Root apoplastic barriers block Na+ transport to shoots in rice (Oryza sativa L.). J. Exp. Bot. 2011, 62, 4215–4228. [Google Scholar] [CrossRef]
- Zhao, Y.; Lin, S.; Qiu, Z.; Cao, D.; Wen, J.; Deng, X.; Wang, X.; LIN, J.; Li, X. MicroRNA857 Is Involved in the Regulation of Secondary Growth of Vascular Tissues in Arabidopsis. Plant Physiol. 2015, 169, 2539–2552. [Google Scholar] [CrossRef] [Green Version]
- Niu, Z.; Li, G.; Hu, H.; Lv, J.; Zheng, Q.; Liu, J.; Wan, D. A gene that underwent adaptive evolution, LAC2 (LACCASE), in Populus euphratica improves drought tolerance by improving water transport capacity. Hortic. Res. 2021, 8, 88. [Google Scholar] [CrossRef] [PubMed]
- CUI, Y.; ZHANG, X.; SONG, C.; LIN, J.; MAN, Y.; QIAN, H. Chemical components, physiological functions and regulation mechanism of plant Casparian strips. Sci. Vitae 2020, 50, 102–110. [Google Scholar] [CrossRef]
- Foster, K.J.; Miklavcic, S.J. A Comprehensive Biophysical Model of Ion and Water Transport in Plant Roots. I. Clarifying the Roles of Endodermal Barriers in the Salt Stress Response. Front. Plant Sci. 2017, 8, 1326. [Google Scholar] [CrossRef] [PubMed] [Green Version]
- Okuda, S.; Fujita, S.; Moretti, A.; Hohmann, U.; Doblas, V.G.; Ma, Y.; Pfister, A.; Brandt, B.; Geldner, N.; Hothorn, M. Molecular mechanism for the recognition of sequence-divergent CIF peptides by the plant receptor kinases GSO1/SGN3 and GSO2. Proc. Natl. Acad. Sci. USA 2020, 117, 2693–2703. [Google Scholar] [CrossRef] [Green Version]
- Fujita, S.; de Bellis, D.; Edel, K.H.; Köster, P.; Andersen, T.G.; Schmid-Siegert, E.; Dénervaud Tendon, V.; Pfister, A.; Marhavý, P.; Ursache, R.; et al. SCHENGEN receptor module drives localized ROS production and lignification in plant roots. EMBO J. 2020, 39, e103894. [Google Scholar] [CrossRef]
- Rojas-Murcia, N.; Hématy, K.; Lee, Y.; Emonet, A.; Ursache, R.; Fujita, S.; de Bellis, D.; Geldner, N. High-order mutants reveal an essential requirement for peroxidases but not laccases in Casparian strip lignification. Proc. Natl. Acad. Sci. USA 2020, 117, 29166–29177. [Google Scholar] [CrossRef] [PubMed]
- Zhuang, Y.; Li, L. Are cuproproteins part of the multi-protein framework for making the Casparian strip? Plant Signal. Behav. 2020, 15, 1798605. [Google Scholar] [CrossRef] [PubMed]
- Reyt, G.; Chao, Z.; Flis, P.; Salas-González, I.; Castrillo, G.; Chao, D.-Y.; Salt, D.E. Uclacyanin Proteins Are Required for Lignified Nanodomain Formation within Casparian Strips. Curr. Biol. 2020, 30, 4103–4111. [Google Scholar] [CrossRef] [PubMed]
Figure 1.
Injury phenotypes of salt stress in cycle 2. (a) Growing status of 0.3% on the 12th day. (b) Growing status of 0.4% on the 12th day. (c) Growing status of 0.3% on the 14th day. (d) Growing status of 0.4% on the 14th day.
Figure 1.
Injury phenotypes of salt stress in cycle 2. (a) Growing status of 0.3% on the 12th day. (b) Growing status of 0.4% on the 12th day. (c) Growing status of 0.3% on the 14th day. (d) Growing status of 0.4% on the 14th day.


Figure 2.
Sodium and MDA content in leaves and roots. Statistical analyses of roots and leaves were performed separately. Means with different letters indicate significant differences at the 0.05 level among the treatments. (a) Sodium content in leaves and roots of mulberry seedlings in C1. (b) Sodium content in leaves and roots of mulberry seedlings in C2. (c) MDA content in leaves and roots of mulberry seedlings in C1. (d) MDA content in leaves and roots of mulberry seedlings in C2.


Figure 3.
Distribution of DEPs in three comparison groups. (a) Distribution of DEPs in three comparison groups. (b) Expression trends of DEPs in three comparison groups.
Figure 3.
Distribution of DEPs in three comparison groups. (a) Distribution of DEPs in three comparison groups. (b) Expression trends of DEPs in three comparison groups.

Figure 4.
GO classification. (a) GO (Biological Process) classification of DEPS in R3/R1. (b) GO (Molecular Function) classification of DEPS in R3/R1. (c) GO (Biological Process) classification of DEPS in R4/R3. (d) GO (Molecular Function) classification of DEPS in R4/R3.
Figure 4.
GO classification. (a) GO (Biological Process) classification of DEPS in R3/R1. (b) GO (Molecular Function) classification of DEPS in R3/R1. (c) GO (Biological Process) classification of DEPS in R4/R3. (d) GO (Molecular Function) classification of DEPS in R4/R3.

Figure 5.
COG classification. The gray part of the bar chart represents all proteins identified under this COG category (including non-differential proteins and DEPs). (a) COG classification of DEPS in R3/R1. (b) COG classification of DEPS in R4/R3.
Figure 5.
COG classification. The gray part of the bar chart represents all proteins identified under this COG category (including non-differential proteins and DEPs). (a) COG classification of DEPS in R3/R1. (b) COG classification of DEPS in R4/R3.


Figure 6.
KEGG enrichment analysis of DEPs in R3/R1. In the bubble diagram, the redder the color, the more significant the enrichment of categories. (a) KEGG enrichment analysis of up-regulated DEPs in R3/R1. (b) KEGG enrichment analysis of down-regulated DEPs in R3/R1.
Figure 6.
KEGG enrichment analysis of DEPs in R3/R1. In the bubble diagram, the redder the color, the more significant the enrichment of categories. (a) KEGG enrichment analysis of up-regulated DEPs in R3/R1. (b) KEGG enrichment analysis of down-regulated DEPs in R3/R1.


Figure 7.
KEGG enrichment analysis of DEPs in R4/R3. In the bubble diagram, the redder the color, the more significant the enrichment of categories. (a) KEGG enrichment analysis of up-regulated DEPs in R4/R3. (b) KEGG enrichment analysis of down-regulated DEPs in R4/R3.
Figure 7.
KEGG enrichment analysis of DEPs in R4/R3. In the bubble diagram, the redder the color, the more significant the enrichment of categories. (a) KEGG enrichment analysis of up-regulated DEPs in R4/R3. (b) KEGG enrichment analysis of down-regulated DEPs in R4/R3.

Figure 8.
Heatmap of key DEPs. The shades of blue reflect the degree of decrease in protein expression (−ve), while the shades of red reflect the degree of increase in protein expression (+ve). (a) REDOX related DEPs. (b) Ion channel-related DEPs. (c) Cell skeleton-related DEPs. (d) Cell wall-related DEPs.


Figure 9.
Crosstalk between ABA and CK signaling pathways. The left half of the protein (cube) represents R3/R1, and the right half represents R4/R3. Blue represents significantly down-regulated (<0.67), red represents significantly up-regulated (>1.5), and gray represents unidentified or non-DEPs. The predicted content changes of CK and ABA are marked by triangles.

Figure 10.
Assembly of Casparian strip under salt stress. Protein stained green indicate stable expression compared with the control, while red indicates significantly down-regulated expression compared with the control. The down-regulation of UCC1 in R4 decreased lignin deposition in the central microregion of the Casparian strip.


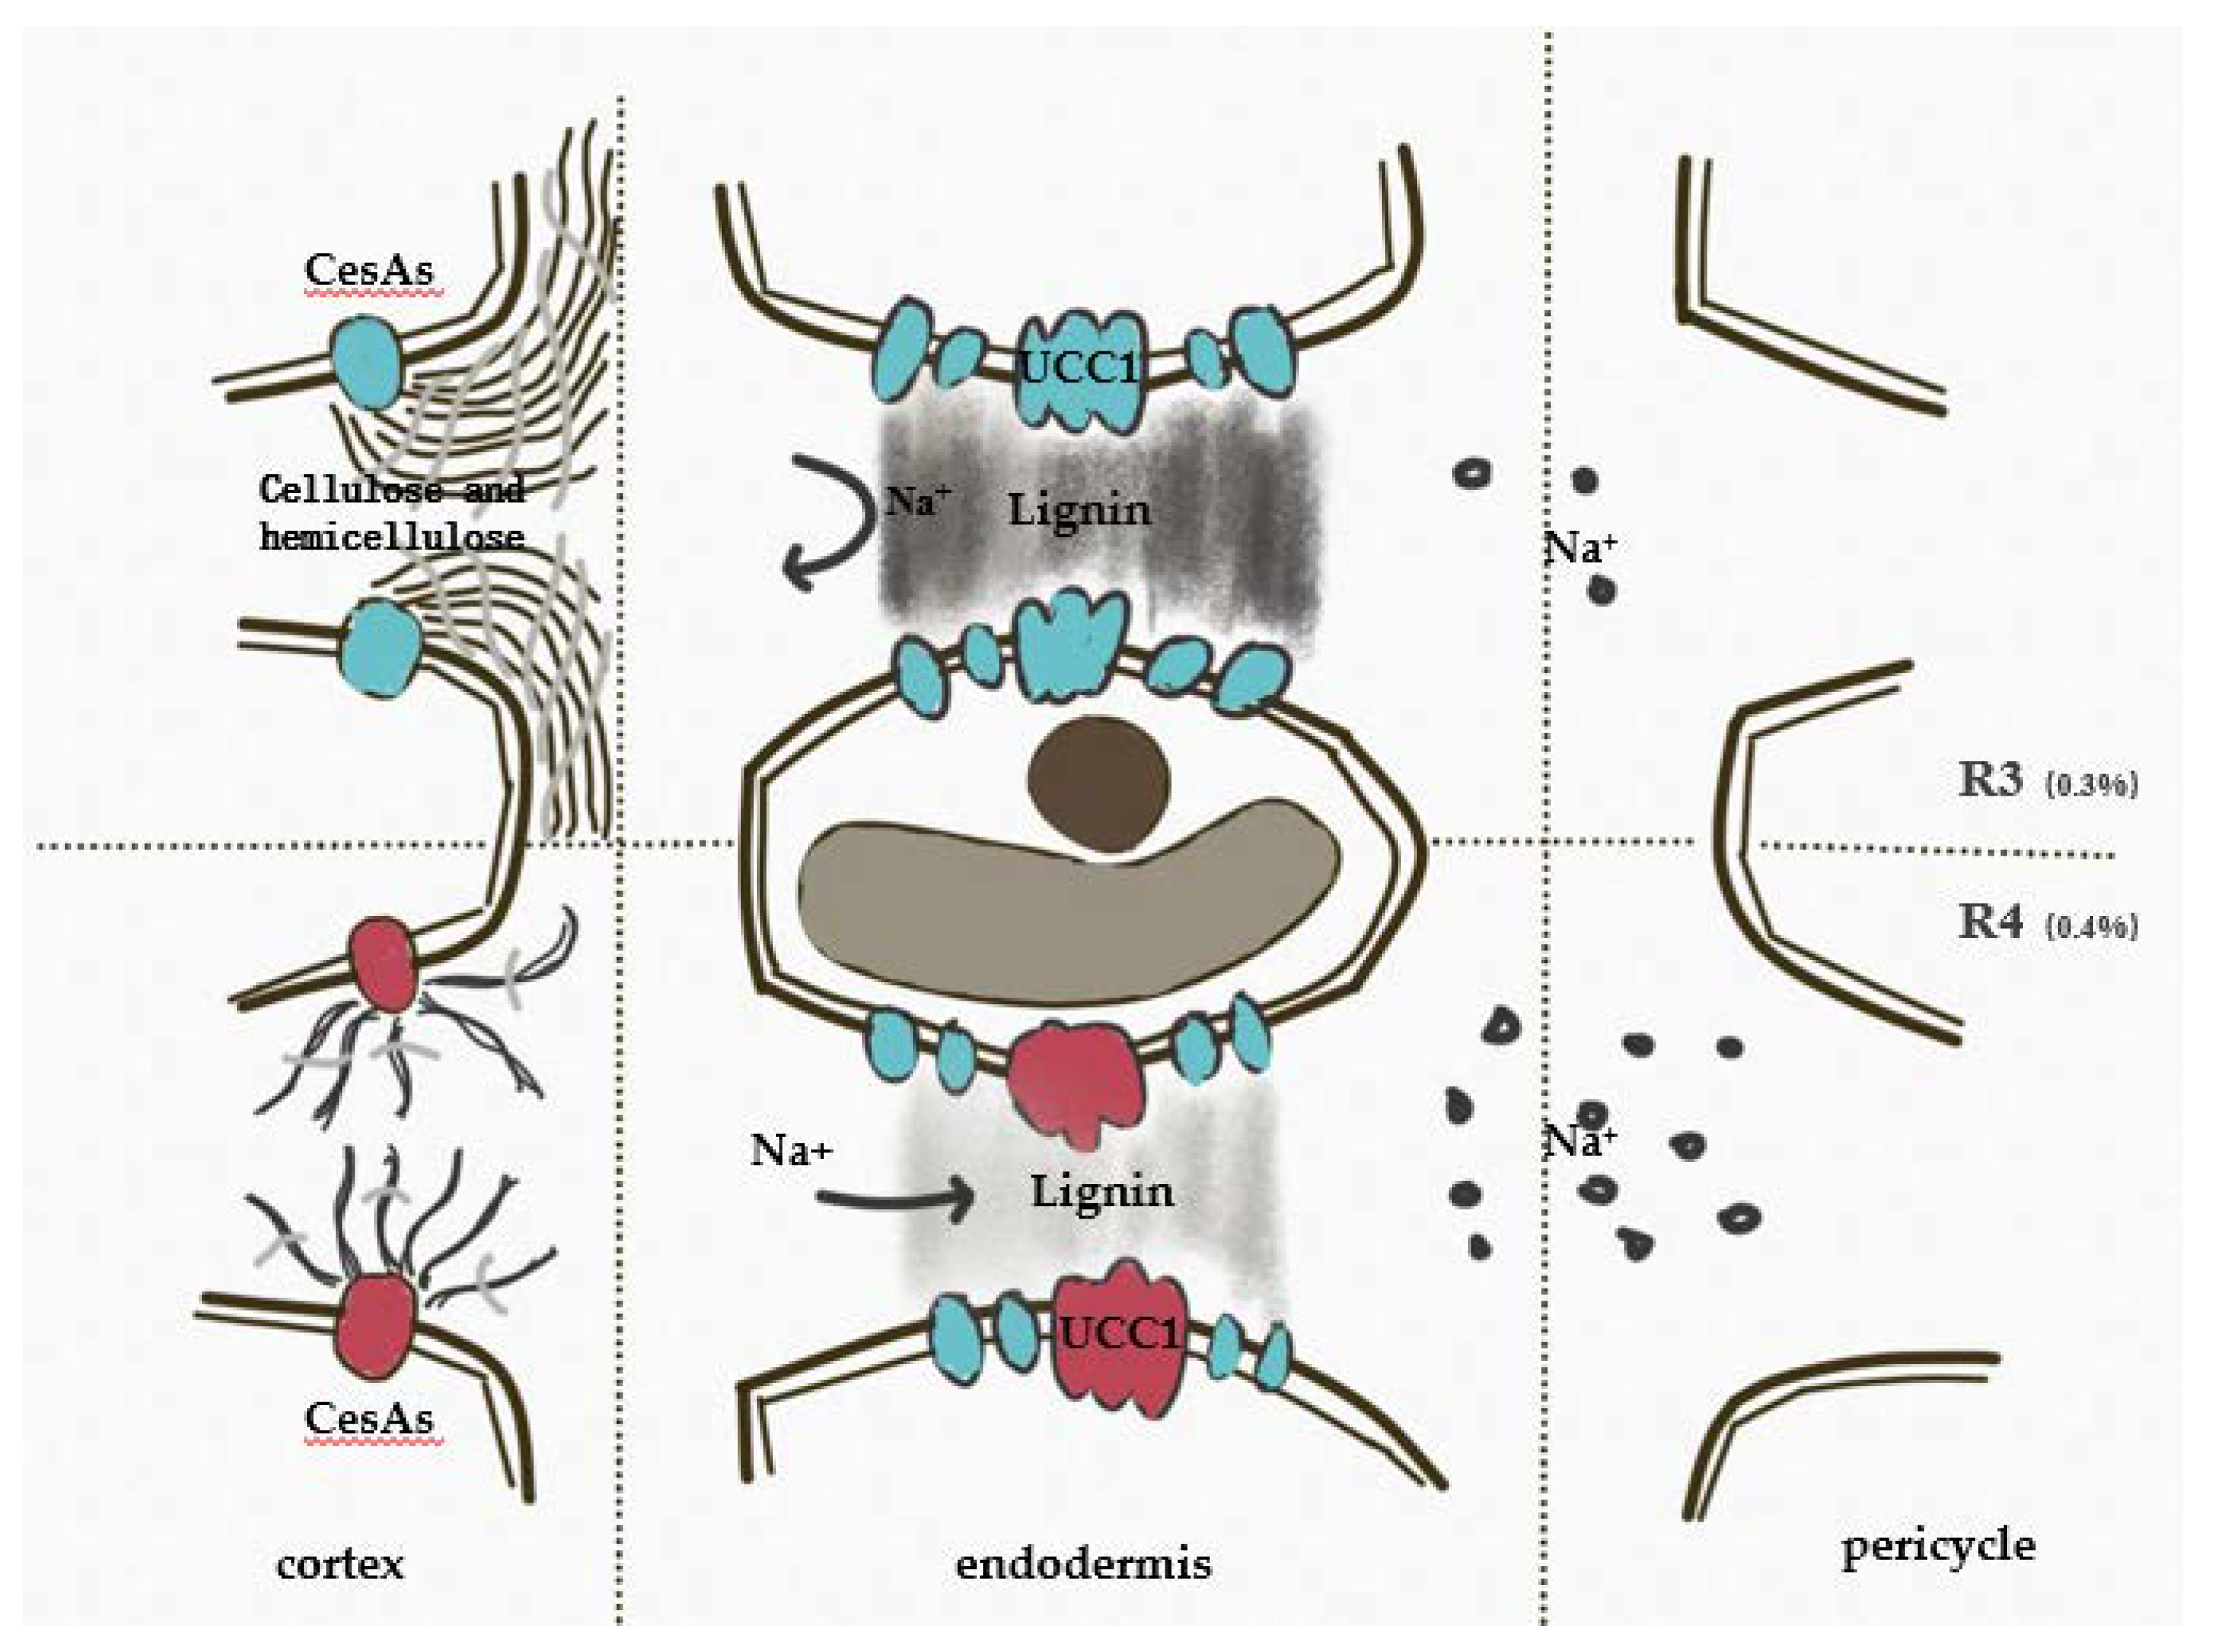
Table 1.
Concentration setting of two-cycle experiment.
| Group | 1 | 2 | 3 | 4 | 5 | 6 | 7 | 8 |
|---|---|---|---|---|---|---|---|---|
| Salinity (cycle 1) | 0% | 0.1% | 0.2% | 0.25% | 0.3% | 0.35% | 0.4% | 0.5% |
| Salinity | (R1) | (R3) | (R4) | |||||
| (cycle 2) | 0% | 0.15% | 0.3% | 0.4% |
Table 2.
Photosynthetic parameters of mulberry seedlings under salt stress. Means with different letters indicate significant differences below 0.05.
Table 2.
Photosynthetic parameters of mulberry seedlings under salt stress. Means with different letters indicate significant differences below 0.05.
| Salinity/% | Pn/µmol·m−2·s−1 | Tr/mol·m−2·s−1 | Gs/mmol·m−2·s−1 | Ci/µmol·mol−1 | WUE |
|---|---|---|---|---|---|
| C1 | |||||
| 0 | 10.027 ± 0.234 c | 4.986 ± 0.453 d | 0.217 ± 0.021 d | 306.717 ± 9.070 c | 2.065 ± 0.212 b |
| 0.1 | 10.266 ± 0.216 c | 3.372 ± 0.191 c | 0.137 ± 0.011 c | 261.761 ± 7.170 b | 3.062 ± 0.105 c |
| 0.2 | 8.353 ± 0.211 b | 2.365 ± 0.178 b | 0.090 ± 0.007 b | 233.678 ± 8.333 a | 3.578 ± 0.205 d |
| 0.25 | 0.223 ± 0.016 a | 0.198 ± 0.010 a | 0.007 ± 0.000 a | 330.231 ± 4.537 d | 1.137 ± 0.103 a |
| C2 | |||||
| 0 | 8.516 ± 0.505 b | 3.254 ± 0.346 c | 0.161 ± 0.020 b | 297.607 ± 10.275 b | 2.691 ± 0.295 a |
| 0.15 | 8.089 ± 0.757 b | 2.312 ± 0.220 b | 0.109 ± 0.012 a | 265.996 ± 2.625 a | 3.500 ± 0.066 b |
| 0.3 | 6.331 ± 0.756 a | 1.829 ± 0.274 a | 0.087 ± 0.013 a | 268.154 ± 5.720 a | 3.524 ± 0.192 b |
Publisher’s Note: MDPI stays neutral with regard to jurisdictional claims in published maps and institutional affiliations. |
© 2021 by the authors. Licensee MDPI, Basel, Switzerland. This article is an open access article distributed under the terms and conditions of the Creative Commons Attribution (CC BY) license (https://creativecommons.org/licenses/by/4.0/).
Share and Cite
MDPI and ACS Style
Yang, J.; Wu, Y. Proteomic Analysis: Explosive Salt Accumulation in Leaves of Morus alba L. under Salt Stress. Forests 2021, 12, 1384. https://0-doi-org.brum.beds.ac.uk/10.3390/f12101384
AMA Style
Yang J, Wu Y. Proteomic Analysis: Explosive Salt Accumulation in Leaves of Morus alba L. under Salt Stress. Forests. 2021; 12(10):1384. https://0-doi-org.brum.beds.ac.uk/10.3390/f12101384
Chicago/Turabian StyleYang, Jiajun, and Yongbo Wu. 2021. "Proteomic Analysis: Explosive Salt Accumulation in Leaves of Morus alba L. under Salt Stress" Forests 12, no. 10: 1384. https://0-doi-org.brum.beds.ac.uk/10.3390/f12101384
Note that from the first issue of 2016, this journal uses article numbers instead of page numbers. See further details here.