Article

A Nonlinear Mixed-Effects Height-Diameter Model with Interaction Effects of Stand Density and Site Index for Larix olgensis in Northeast China

1
Research Institute of Forest Resource Information Techniques, Chinese Academy of Forestry, Beijing 100091, China
2
Key Laboratory of Forest Management and Growth Modeling, National Forestry and Grassland Administration, Beijing 100091, China
3
Institute of Forestry, Tribhuwan University, Kathmandu 44600, Nepal
4
Experimental Center of Forestry in North China, Chinese Academy of Forestry, No.1 Shuizha West Road, Mentougou District, Beijing 102300, China
*
Author to whom correspondence should be addressed.
Submission received: 13 September 2021 / Revised: 19 October 2021 / Accepted: 19 October 2021 / Published: 26 October 2021
(This article belongs to the Special Issue Advances in Forest Growth and Site Productivity Modeling)

Abstract

:
Tree height is a basic input variable in various forest models, such as growth and yield models, biomass models, and carbon budget models, which serve as very important tools for the informed decision-making in forestry. The height-diameter model is the most important component of the growth and yield models and forest simulators. We developed the nonlinear mixed-effects height-diameter model with the interaction effects of stand density and site index introduced using data from 765 Larix olgensis trees in Jingouling forest farm of the Wangqing Forest Bureau in northeast China. Among the various basic versatile functions evaluated, a simple exponential growth function fitted the data adequately well, and this was then expanded through the introduction of the variables describing the interaction effects of the stand density and site index on the height-diameter relationship. Sample plot-level random effects were included into this model through mixed-effects modeling. The results showed that the random effect of the stand density on the height-diameter relationship was substantially different at different classes of the site index, and the random effect of the site index was different for the different stand density classes. The nonlinear mixed-effects (NLME) height-diameter model coping with the interaction effects of the stand density and site index had a better performance than those of the NLME models with the random effect of the single variable of stand density or site index. To conclude, the inclusion of the interaction effects of stand density and site index could significantly improve the prediction accuracy of the height-diameter model for Larix olgensis Henry. The proposed model with the interactive random effects included can be applied for the accurate prediction of Larix olgensis tree height in northeast China.

1. Introduction

The height-diameter model is the most important component of the growth and yield models [1] and forest simulators as tree height, which is usually estimated from the height-diameter model, is a basic input variable for a variety of forest models, such as growth and yield models, biomass models, and carbon budget models [2]. Relative to the diameter at breast height (DBH), the measurement of the tree height is time-consuming and laborious. Therefore, in forest inventory, only a part of the sample trees have their heights measured in the sample plot, and the heights of all the other trees from the same species are predicted with the established diameter–height model [3].
Stand density is an important factor affecting tree growth [4]. Low stand density may reduce the competition impact, increase soil moisture availability, and produce favorable physiological responses, thereby significantly affecting tree growth [5]. Various studies have shown a significant influence of the stand density on the height-diameter relationship. For example, Zeide and Vanderschaaf [6] documented that Pinus taeda L. in higher density stands were taller than those in lower density stands. Thanh and Dinh [7] documented that the height-diameter relationship of Pinus koraiensis appears to differ between stand density classes. In addition, the authors of these studies [8,9,10,11] used stand density as an independent variable to construct the height-diameter models and were able to significantly improve the prediction accuracy.
The height-diameter relationship varies from one site type to another, and, even within the same site type, the relationship would not remain the same over time [12]. Feldpausch and Banin [13] documented that these differences in site equality in different seasons would effectively amplify the dry season effect, and may cause the forests in the Amazon to have larger tree height and diameter. According to Krisnawati [8], the individual tree growth in a stand may take longer on a poorer site than in a site with a higher index class. In addition, the site index can improve the prediction accuracy of the height-diameter model when it is included as an independent variable; for example, Krisnawati [8] and Missanjo [9] included the site index as an independent variable to establish the height-diameter model.
Summing up, the height-diameter relationship is significantly influenced by the stand density and site index. However, there may be interaction effects of the stand density and site index, which has been disregarded in the previous height-diameter modeling studies. When the density remains the same, the better the site quality, the better the tree growth [14]. When the site index remains the same, the kurtosis and peak value of the small-diameter timber yield could decrease with an increase of the stand density [14]. Therefore, exploring the methods of quantifying the impact of the interaction effects of stand density and site index on the tree height-diameter relationship is very important.
Stand density and site index are random factors that produce random effects on tree height. The nonlinear mixed-effects model (NLMEM) can adequately describe the influence of the random effects on the height-diameter relationship. In addition, forestry data are generally characterized by hierarchical structures (multiple measurements within the same subject, such as sample plots within the same site); the NLMEM can effectively deal with the observation dependence and correlations generated by hierarchical data structure [11,15,16,17]. Therefore, the NLME modeling is very popular in forestry; for example, many modelers have applied NLME modeling to develop height-diameter models [2,15,18,19], height to crown base models [10], and other applications [20]. All these studies show that the accuracy of the NLMEM is remarkably higher than any other modeling approach, such as ordinary least squares regression. However, as mentioned earlier, the existing NLME height-diameter models do not cope with the interaction effects of stand density and site index. In this study, the NLME height-diameter model was developed through the inclusion of the interaction effects of stand density and site index. The parameter values of this model were obtained by using the linearization approximation-sequential quadratic algorithm proposed by Fu [21,22] and implemented on Forstat2.2 [23].
Larix olgensis Henry, also known as Changbai larch in China, has economic and ecological values, such as fast growth, most desirable wood properties, and strong resistance to diseases and insect pests. Larix olgensis is widely distributed in Northern China, North Korea, Russia, and other places [16]. Larix sp. is of a great interest to foresters because they vary greatly, grow rapidly, produce high-quality wood for many purposes, and provide exciting opportunities for short rotation forestation [24]. Obtaining a series of tree or stand attribute data in a timely and effective manner is essential for the reasonable management of larch forests [16]. Therefore, it is of a great significance to establish a high precision height-diameter model for Larix olgensis Henry.
With reference to the points above, this study aims to:
  • Quantify the interaction effects of the stand density and site index on the tree height of Larix olgensis Henry.
  • Determine whether there would be significant interaction effects of the stand density and site index on the height-diameter relationship.
  • Establish the nonlinear mixed-effects height-diameter model with the interaction effects of stand density and site index included for Larix olgensis in northeast China.

2. Materials and Methods

2.1. Study Area and Data

We used the data acquired from twenty permanent sample plots (PSPs) established in Larix olgensis plantations located in the Jingouling forest farm of Wangqing Forest Bureau of northeast China (Figure 1 and Table 1). Sample plot sizes vary from 775 m2 to 2500 m2 and represent a large within-sample plot variation of the height-diameter relationship. Twenty sample plots were nested within the five blocks (Block) with different site qualities, and each block contained four sample plots (Plot). PSPs were established in years between 1961 to 1964. Most of the sample plots were in the forest stands with different site conditions (Table 1). Within each of the sample plots, all standing and living trees (total height, H > 1.3 m and diameter at breast height, D > 5 cm) were measured. The Research Institute of Forest Resources Information Techniques, Chinese Academy of Forestry established the PSPs and maintained the database.
Table 1. A total of 765 Larix olgensis trees in 20 PSPs with 14 types of M ∗ S and 2 altitude levels. Number of Larix olgensis trees (Numbers), stand density class (M), and site index class (S) of each sample plot in model fitting data and model testing data can be seen in this table. (Note: A = altitude of the sample plot; A = 1 when the altitude of the sample plot is higher than 700 m; A = 2 when the altitude of the sample plot is less than 700 m. M = stand density class of the sample plot; S = stand index class of the sample plot. The ranges of M and S are shown in Table 2).
AModel Fitting Data Model Testing Data
Sample PlotMSNumberSample PlotMSNumber
130132303013215
130261303026115
130342303034215
130433303043315
1305,3074130305,3074115
130663303066315
130815303081515
230955303095515
2310,311,3182330310,311,3182315
231234303123415
231314303131415
231421303142115
231561303156115
231641303164115
231752303175215
231924303192415
232063303206315
A total of 765 observations of height-diameter pairs of Larix olgensis were used in this study. Each observation point contained five variables, such as D, H, altitude (A), stand density class (M), and site index class (S). The environmental factors, such as A, M, and S are categorical variables. As altitude ranges from 600 m to 780 m, we divided this into two levels: >700 m and <700 m, denoted as level 1 and level 2, respectively.
Different stand density levels significantly differently affect the tree growth [25,26,27]. Thus, it was necessary to divide stand density into 6 classes (denoted as 1, 2, …, 6) called stand density classes (M) according to the interval of 150 trees ha−1. The effect of Meyer’s site index (Meyer’s SI) on tree height was analyzed by Du [28]. The Meyer’s SI was estimated by equation supplied by Du [28]. The site index with 15.5 m as the starting point and 0.5 m as the interval was divided into 5 classes (denoted as 1, 2, …, 5), termed site index class (S). Out of 765 Larix olgensis trees, data from 510 trees was used as model fitting data and data from 255 trees used as model testing data. Data partition was done randomly; we randomly split the model fitting data and model testing data from the sample plots with same M ∗ S according to the proportion 2:1. Summary of statistics is presented in Table 3, and height-diameter relationship plotted against D is shown in Figure 2.

2.2. Base Models

Since Figure 2 shows a strong nonlinear relationship of height with diameter, we considered nine basic versatile nonlinear functions (Table 4) to describe such a relationship. We fitted these functions to the entire data set and selected the best performing one according to the AIC (Akaike information criterion, Equation (1) [29] and BIC (Bayesian information criteria, Equation (2) [30]. As the BIC is slightly more stringent for the number of parameters, we prefer choosing the model with the lowest BIC as the best model. We used the R-nls function to estimate the basic height-diameter models. The best fitting model was then expanded with introduction of the interactive effects of stand density and site index, and the sample plot-level random effects.
A I C = 2 k ln ( L )
B I C = k ln ( N ) 2 ln ( L )
where k is the number of model parameters, n is the number of samples, L is the likelihood function value.
Table 4. Candidate base models we considered.
Basic ModelFunction ExpressionFunction FormSource
M1 H = 1.3 + ϕ 1 D ϕ 2 Power function[31]
M2 H = 1.3 + exp ( ϕ 1 + ϕ 2 D ) Growth[32]
M3 H = 1.3 + ϕ 1 ( 1 exp ( ϕ 2 D ϕ 3 ) ) Weibull[33]
M4 H = 1.3 + ϕ 1 ( 1 exp ( ϕ 2 D ) ) ϕ 3 Chapman-Richards[34]
M5 H = 1.3 + ϕ 1 + ϕ 2 D + ϕ 3 Richards[35]
M6 H = 1.3 + ϕ 1 exp ( ϕ 2 exp ( ϕ 3 D ) ) Gompertz[36]
M7 H = 1.3 + ϕ 1 1 + 1 ϕ 2 D ϕ 3 Hossfeld IV[37]
M8 H = 1.3 + ϕ 1 exp ( ϕ 2 D ϕ 3 ) Korf[38]
M9 H = 1.3 + ϕ 1 1 + ϕ 2 exp ( ϕ 3 D ) Logistic[39]
Note: H = tree height (m); D = diameter at breast height (cm). ϕ 1 , ϕ 2 , and ϕ 3 are the formal parameters to be estimated.

2.3. The NLME Models

For the parameters with fixed effects in the nonlinear mixed-effects model, the most important thing is to determine what random effects each parameter needs to include. There are two ways to achieve this [40]. One method is to add all random effects for each parameter with AIC and BIC as main criteria to evaluate the fitting performance. Another method is to judge whether the mixed-effects model is properly parameterized based on the correlation between the estimated random effects. In this paper, we used the former method to choose the random effects for each parameter. There were six combinations of the random factors M, S, and M ∗ S for each parameter. However, we excluded the random factor M + S because model did not converge when we added this to the model.

2.4. Parameter Estimation

The parameters of the NLME models were estimated by “nonlinear mixed-effects” module in Forstat2.2 [23]. A general NLME model was defined as:
H i j = f ( ϕ i , x i j )
with
ϕ i = A i β + Z i u i ,
where ϕ i is formal parameter vector and includes the fixed effect parameter vector β and random effect parameter vector u i of the ith sample plot; symbols A i and Z i are the design matrices for β and u i , respectively. H i j and x i j are total height and the predictor vector of the jth tree on the ith sample plot, respectively. The estimated random effect parameter vector u i would be:
u ^ i = ψ ^ Z ^ i T ( Z ^ i ψ Z ^ i T + R ^ i ) 1 ( y i f ( β ^ , u i * , x i ) + Z ^ i u ^ i )
where ψ ^ is the estimated variance–covariance for the random effects, R ^ i is the estimated variance–covariance for the error term within the sample plot i. In this study, no structure covariance type BD (b) [41] was selected as the covariance type of ψ , and R ( ψ = L Τ L , L is an upper triangular matrix). We assumed that the variances of random effects produced by structural variables were independent equal variances and there was no heteroscedasticity in our model; therefore, variance–covariance of sample plot i is R ^ i = σ 2 I ( σ 2 is the variance of the residual; I is the identity matrix.). The value of variance matrix ψ ^ or covariance matrix R ^ i was calculated by restricted maximum likelihood with the sequential quadratic algorithm [21]. The f ( · ) is an interactive NLME model, and Z ^ i is an estimated design matrix:
Z ^ i = f ( β , u i , x i ) u i
where x i is a vector of the predictor on the sample plot i.

2.5. Model Evaluation

We used five statistical indicators to evaluate the performance of the interactive NLME height-diameter models such as M P S E , R M S E , and R 2 calculated by Equations (6)–(9) using both the model fitting and model testing data sets.
M P S E = k = 1 N | ( H k H ^ k ) / H ^ k | N × 100
R M S E = k = 1 N ( H k H ^ k ) 2 N
H ¯ = 1 N k = 1 N H k
R 2 = k = 1 N ( H ^ k H ¯ ) k = 1 N ( H k H ¯ )
where H k and H ^ k are the observed and estimated values of total height of the k th tree, respectively; H ¯ is the average value of the observed tree height; n is the total number of trees; MPSE is the mean percent standard error and it is a precision index reflecting the estimated value of individual tree height; RMSE is root mean squared error and it is used to measure the deviation between the estimated value and the observed value; and R 2 was used as a main criterion for model evaluation.
All the random effects of site index and stand density of the interactive NLME height-diameter model were estimated using the Forstat software of the 2.2 version. All the interactive random effects of site index and stand density for each sample plot were used to evaluate the performance of the interactive NLME model using both the model fitting and model testing data sets.

3. Results

3.1. Base Models

Nine basic diameter–height models were used as candidate base models (Table 4). The entire data of 765 larch plants were used to fit the base models. According to the fit statistics produced by fitting nine candidate models (Table 5), the BIC of M2 was the lowest and the AIC of M2 was in the middle; therefore, M2 in Table 4 (Equation (10) was selected as the best base model in this study.
H ( i j ) k = 1.3 + exp [ ϕ 1 + ϕ 2 D ( i j ) k ] + ε ( i j ) k
where H is the total height of Larix olgensis, D is the diameter at breast height of Larix olgensis, ϕ 1 and ϕ 2 are the formal parameters of this model. ε ( i j ) k is the error term of kth tree on the sample plot (ij).

3.2. The NLME Models

A total of 36 combinations of the random effects (Table 6) were derived from the formal parameters ( ϕ 1 and ϕ 2 of the base model Equation (10) affected by the random variables M (stand density class), S (site index class), and the crossed random effect of the stand density and site index (M ∗ S). All the possible combinations of the random effects were applied using model fitting data. The best performing combination was then selected based on the AIC and BIC scores.
Both the AIC and BIC of the interactive NLME model 15 are the smallest (Table 7). Therefore, the random effects constructions M ∗ S and M ∗ S were selected as the random variables on ϕ 1 and ϕ 2 , respectively. The AIC and BIC of the single effect model (model 1,2,3, and 4) were lower than those of the interactive effects model (model 15), which indicated that a substantial proportion of the tree height variations was better explained by the crossed random effects of the stand density and site index than the random effects of the stand density alone or a single site index alone.

3.3. The Interactive NLME Height-Diameter Model

Model 15 (Table 7) with the random construction variables [M ∗ S, M ∗ S] that had the best performance (AIC = 1771.64, BIC = 1797.02) was chosen as a final model. Model 15 with the random effects were the interaction effects of M and S and was defined as the interactive NLME height-diameter model in this article. The expression of the best interactive NLEM height-diameter model for further analysis is shown in Equation (11).
{ H ( i j ) k = 1.3 + exp [ β 1 + u 1 ( i j ) ( M * S ) + β 2 + u 2 ( i j ) ( M * S ) D ( i j ) k ] + ε ( i j ) k u ( i j ) ~ N ( 0 , ψ ) , ε ( i j ) ~ N ( 0 , R ( i j ) )   i = 1 , , M 1 ,   j = 1 , , M 2 ,   k = 1 , , n ( i j )
where M1 (in this study, M1 = 6) is the total classes of stand density, M2 (in this study, M2 = 5) is the total classes of site index, n i j is the number of observation points contained in the ith stand density class and the jth site index class. (ij) is the sample plot with the ith stand density class and the jth site index class. The ε ( i j ) k is the error term of the kth tree in sample plot (ij), which we assumed as R ( i j ) = σ 2 I ( σ 2 ( σ 2 > 0 ) is the variance of the residual). H is the tree height measurement value.

3.4. Parameter Estimates

All the parameter estimates of the basic model and interactive NLME model were significant (p < 0.05). The parameter estimates of the basic model obtained by an ordinary nonlinear least square (ONLS) function are as Equation (12), which we termed as the NLS model.
H ^ = 1.3 + exp [ 3 . 1194 + 6 . 9169 D ] + ε
where D is the measured value of DBH, H ^ is the estimated total tree height with the NLS model, ε N ( 0 , 1.952 I ) .
The interactive NLEM height-diameter model with the estimated parameters obtained with the linearization approximation-sequential quadratic algorithm implemented in the “nonlinear nixed-effects” module of the Forstat software of the 2.2 version is given by:
H ^ ( i j ) k = 1.3 + exp [ 3 . 1138 + u 1 ( i j ) ( M * S ) + 6 . 8180 + u 2 ( i j ) ( M * S ) D ( i j ) k ] + ε ( i j ) k
with
u i j = [ u 1 i j u 2 i j ] { [ 0 0 ] , ψ = ( 0.0053     0.0981 0.0981       1.9956 ) } ,   ε i j N ( 0 , 1.6996 I ) ,
where (ij) is the sample plot with the ith stand density class and the jth site index class, and k is the kth observation on the (ij) sample plot. D ( i j ) k is the measured value of the DBH of tree k on (ij) sample plot, while H ^ ( i j ) k is the estimated H of tree k on (ij) sample plot with the interactive NLME model.
The fixed effect parameter estimates for the interactive NLME model are: β 1 = 3.1138 , β 2 = 6.8180 . The fixed effect parameter estimates of the NLME model were different from the parameter estimates of the NLS model (Equation (12), which also showed that different stand density classes and site index classes resulted in the different parameter estimates of the height-diameter model.
In addition, in order to compare the performance of the single-level mixed-effects model and the interactive mixed-effects model, we established a single-level mixed-effects model based on Model 2 with the best performance (with the smallest AIC and BIC) among the four single-level NLME models (Table 7). The single-level NLME height-diameter model with the estimated parameters obtained with the linearization approximation-sequential quadratic algorithm implemented in the “nonlinear mixed-effects” module of the Forstat software of the 2.2 version is given by:
H ^ ( i j ) k = 1.3 + exp [   3.1165 + u ( i ) ( S ) + 6.8545 + u ( j ) ( M ) D ( i j ) k ] + ε ( i j ) k
with
u ( i ) ~ N ( 0 , 0.0003 ) , u ( j ) ~ N ( 0 , 0.1216 ) , ε i j ~ N ( 0 , 1 . 8505 I ) ,
where i is the sample plot with the ith stand density class and the j is the sample plot with the jth site index class, and k is the kth observation on the sample plot with the ith stand density class and the jth site index class. D ( i j ) k is the measured DBH of tree k on the (ij) sample plot, while H ^ ( i j ) k is the estimated H of tree k on the (ij) sample plot with a single-level NLME model.

3.5. Random Effects of the Interactive NLME Height-Diameter Model

The interactive random effects estimates obtained by fitting the NLME height-diameter model using the model fitting data are presented in Table 8. For two sample plots with the same M (stand density class) and altitude but different S (site index class), the estimated value of u1 and u2 of the interactive NLME height-diameter model Equation (13) are different. In addition, as for two sample plots with the same S and A but different M, the value of u1 and u2 of the interactive NLME height-diameter model Equation (13) are also different. This indicated that the random effect of the stand density on the Larix olgensis tree height was different at the different classes of site index, and the random effect of the site index on the Larix olgensis tree height was different at the different classes of stand density. Hence, there were strong interaction effects of the stand density and site index on the height-diameter relationship.

3.6. Model Evaluation

We used the likelihood ratio test to test the significant difference between the different models. Specifically, we compared a complex model with a simple model to test whether the complex model can significantly fit our data. If the difference between them is significant, the complex model could be used in future data analysis. The formula for the likelihood ratio test is:
L R = 2 ( ln L 1 ln L 2 ) ~ χ 2 ( d f 1 d f 2 )
where LR is the likelihood ratio, L1 is the maximum likelihood value of the complex model, L2 is the maximum likelihood value of the simple model, d f 1 is the degree of freedom of the complex model, and d f 2 is the freedom of the simple model.
The likelihood ratio test results are shown in Table 9 The difference between the interactive NLME model and the NLS model was significant. The difference between the interactive NLME model and the single-level NLME model was also significant. Therefore, the interactive NLME model we developed could be used for further data analysis.
The estimated random effects of the interactive NLME height-diameter model (Equation (13)) in Table 8 were used for further evaluation. The height-diameter curves produced corresponding to different M ∗ S are shown in Figure 3. We compared the statistical indicators, such as MPSE, RMSE and R 2 (Equations (6)–(9)), of three height-diameter models (Equations (12)–(14)) (Table 10). Regardless of whether the model was used to predict the model testing data or model fitting data, the indicator values of the interactive NLME model were lower than those obtained for the NLS model and also lower than those of the single-level NLME model, which indicated that the crossed random effect of the stand density and site index could significantly improve the prediction accuracy of the model. Figure 4 shows the random distributions of the residuals produced with the three models.

4. Discussion

We evaluated nine basic nonlinear functions of different forms proposed in the previous height-diameter modeling studies to identify the most suitable for our data. Based on the best-fitted base model (M2-Table 4), the interactive NLME height-diameter model for Larix olgensis Henry was established through the integration of the variables describing the effects of the stand density and site quality on the height-diameter relationship. This expanded model described significantly larger variations of the height-diameter relationship than its base model counterpart did. When we tested the effect of the model with the model testing data, the R2 of the interactive NLME height-diameter model increased by 5.2% compared with that of the base model. The interaction random effects of the stand density and site index were thus able to improve the prediction accuracy of the height-diameter model for Larix olgensis.
The height-diameter relationship can be influenced by the stand density [5,6,7,42], site index [8,13], and the interaction effect of the stand density and site index [14]. In our study, we assumed that the substantial proportion of the tree height variations was better explained by the interaction effect of the stand density and site index than the random effects of single stand density or single site index. This may be because there are interaction effects between the stand density and site index. In the previous model establishment [8,9], it is usually assumed that the stand density and site index are independent of each other; however, Ritchie [43] documented that the stand density affected the dominant height (the site index is estimated using dominant height and stand age). Under the assumption that the estimated value of the site index is indeed affected by density management, Ritchie [43] proposed a conjecture that, if the site index is used to drive the growth model, it may lead to the underestimation of the height growth. This conjecture was proved to be correct by our study as the AIC and BIC scores of the interactive NLME model (model 15 in Table 7) were higher than the single variable-based random effect models (model 1, 2, 3, and 4 in Table 7).
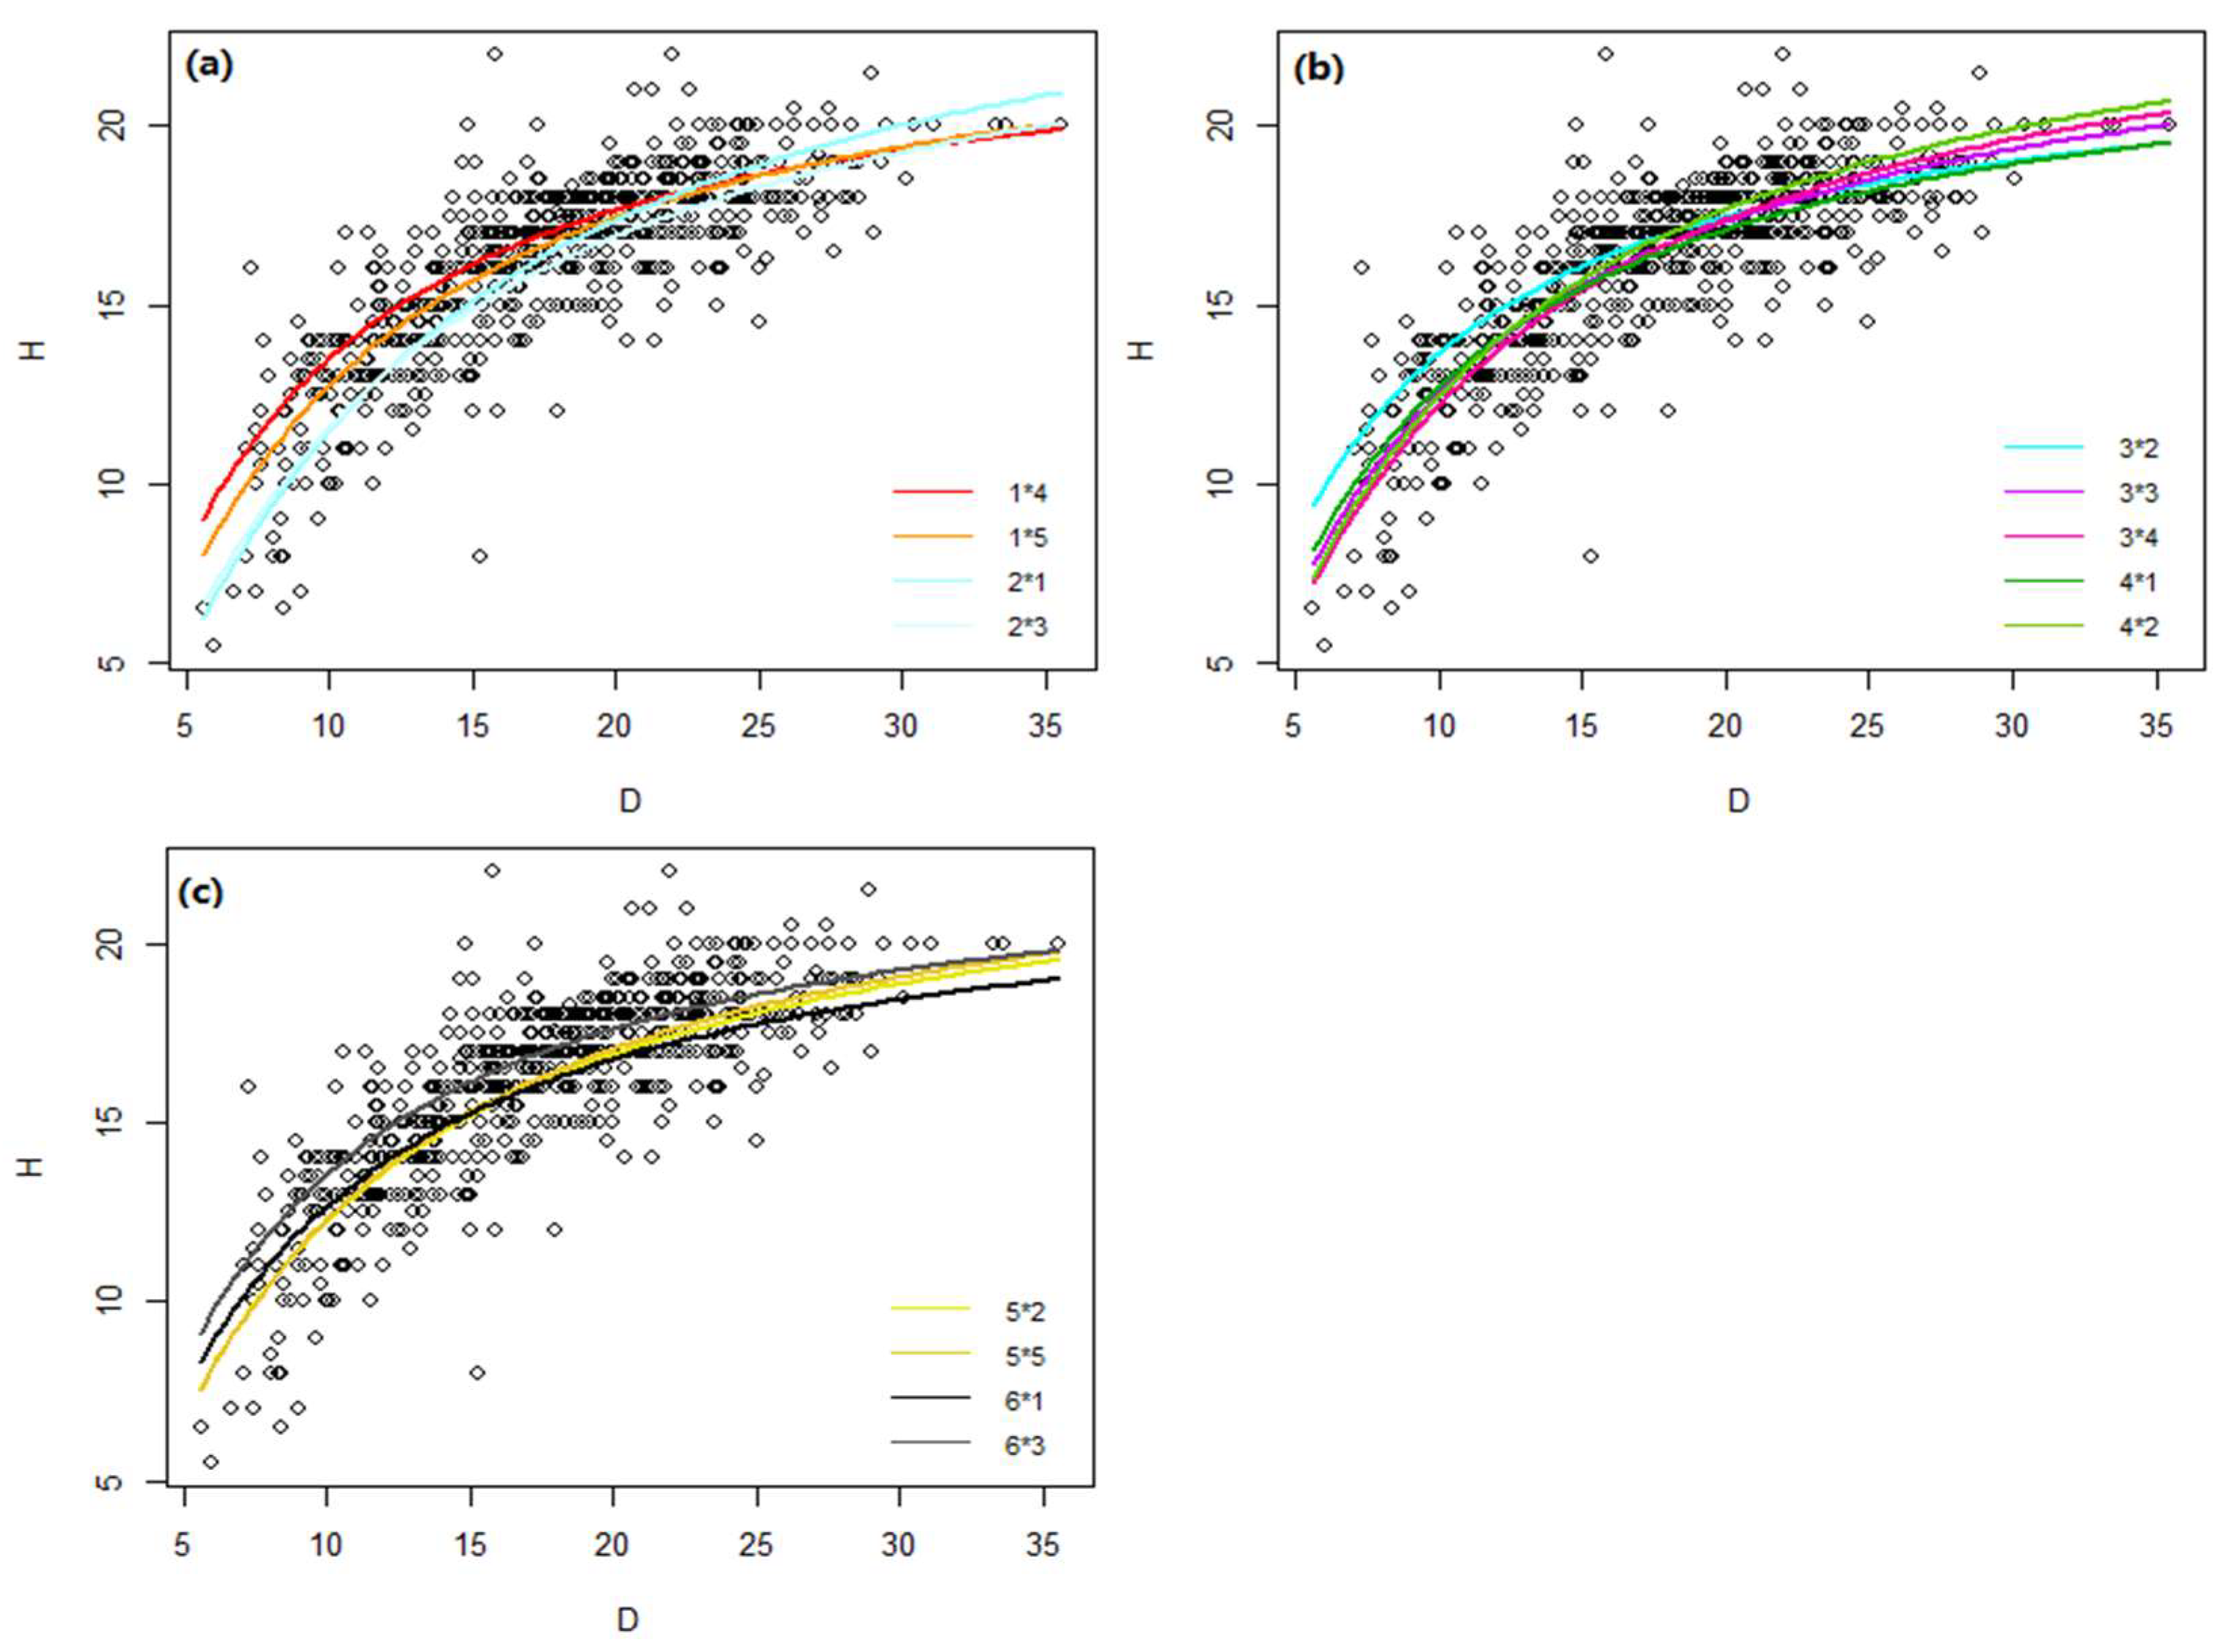
In addition, the random effect of the stand density on the tree height is different at different classes of the site index, and the random effect of the site index on the tree height is different at different classes of the stand density (
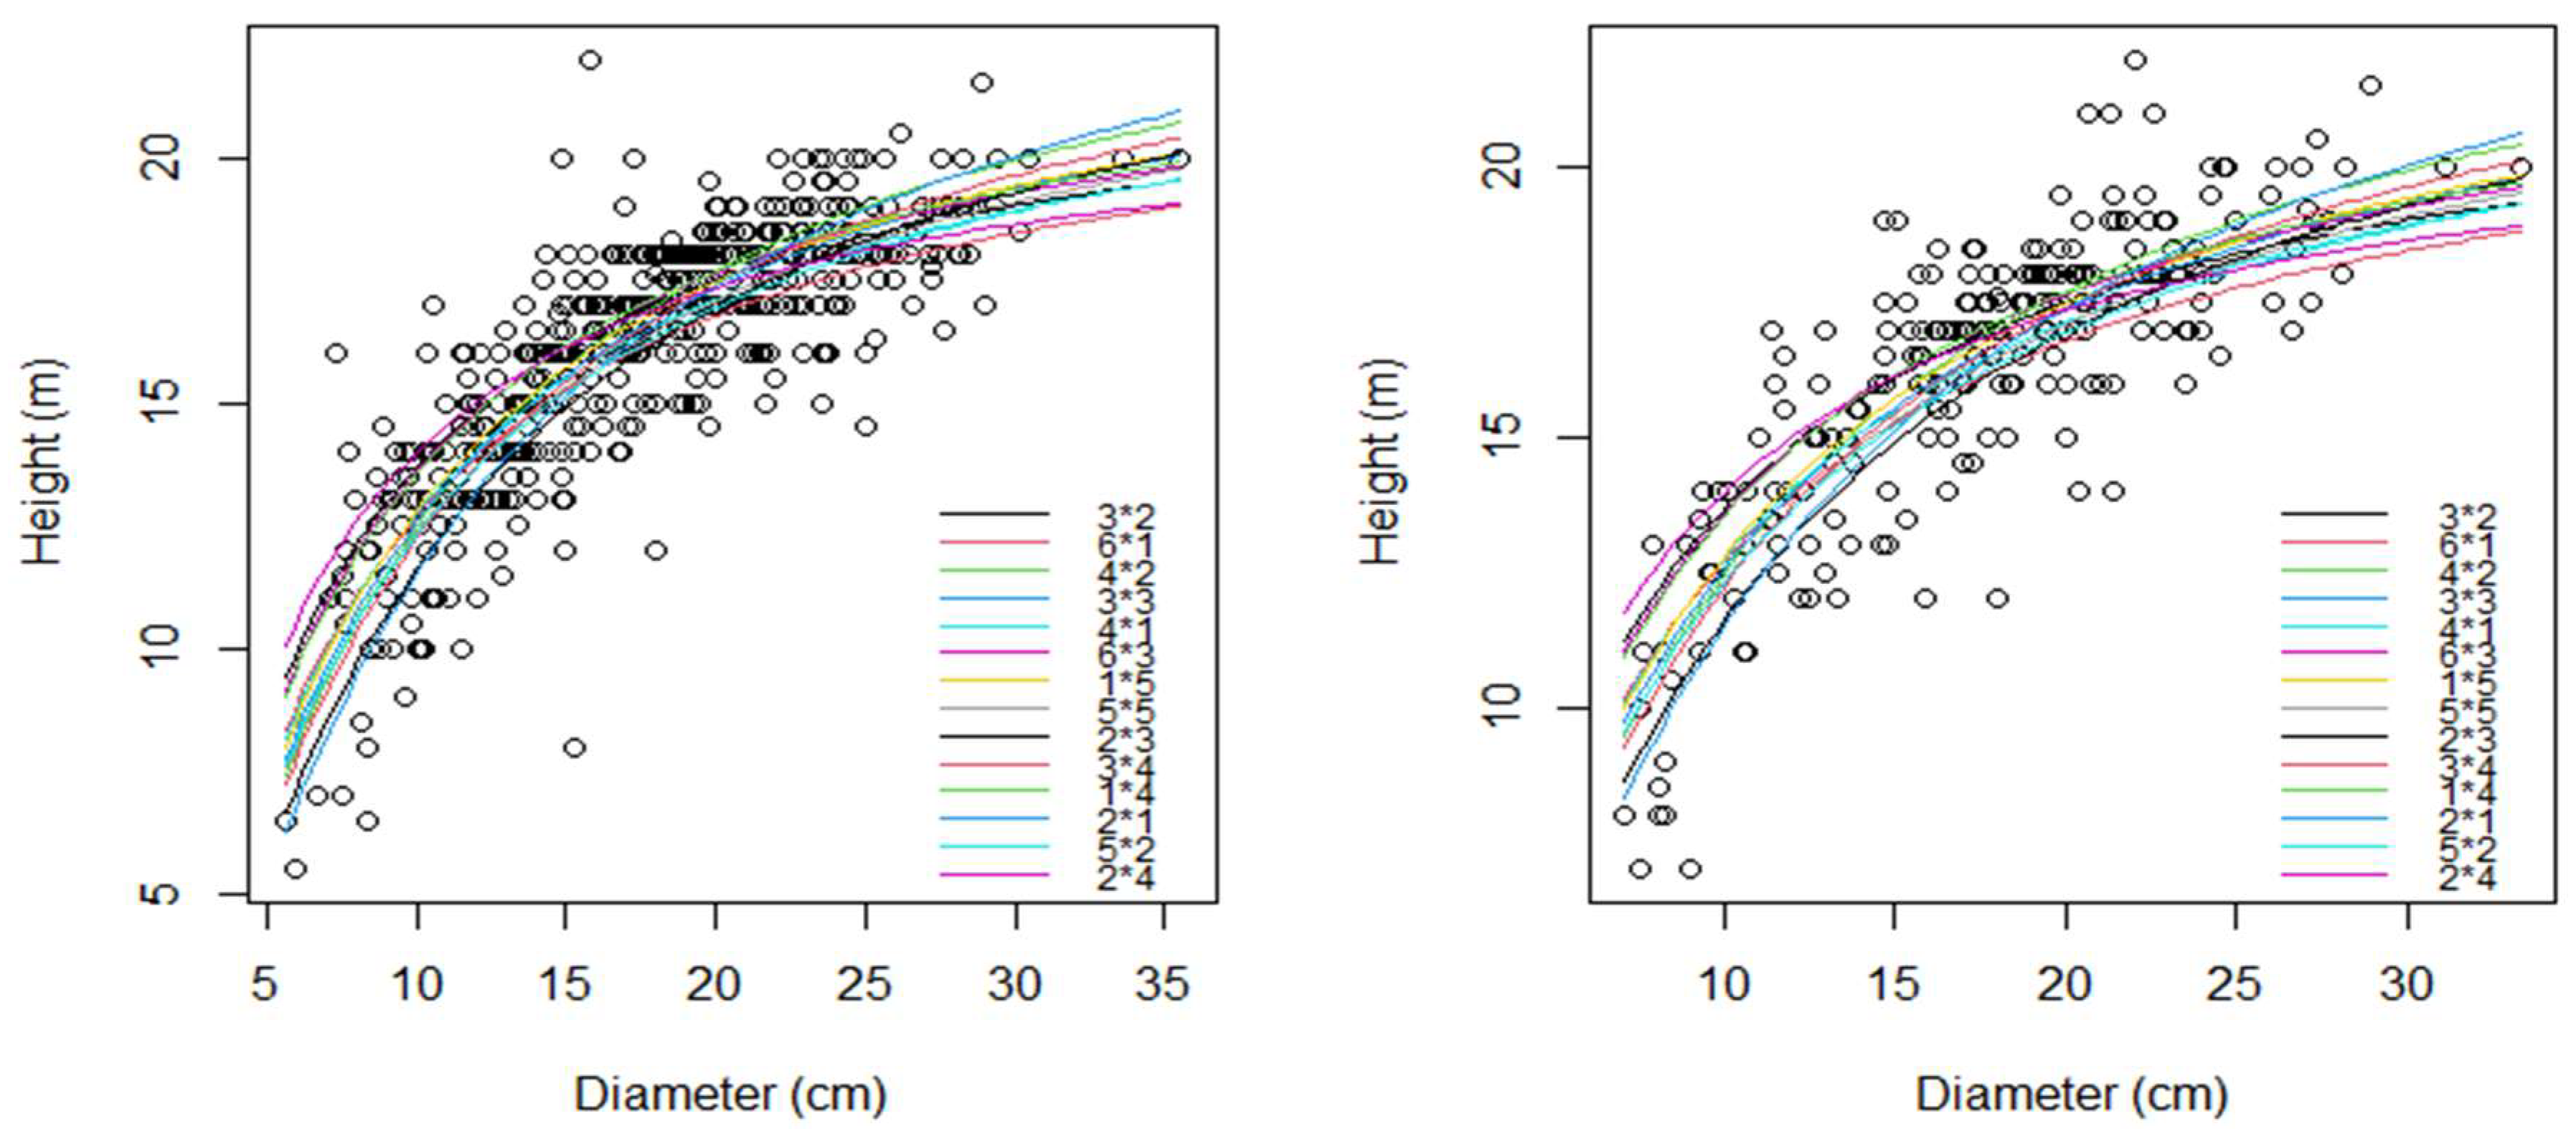
Table 8). Hence, the data we analyzed further confirmed that there are significant interaction effects of stand density and site index on the height-diameter relationship. Moreover, in the low-density forest stands (in the forest stand with M = 1 and M = 2, respectively (Figure 5a), trees mainly grew radially and the DBH of the tree was larger with the increased site index of the stand. In the early development of the medium-density stands (in the forest stand with M = 3 and M = 4, respectively (Figure 5b), the higher the site index of the stand was, the larger the DBH of the tree in the stand was. After the canopy of the forest was closed, trees began to grow vertically due to resources constraint. It can be seen from the second half of Figure 5b that the height of the tree was taller with the increased site index of the stand. In high-density forest stands (in the forest stand with M = 5 and M = 6, respectively (Figure 5c), tree growth occurred vertically due to the fierce competition among the trees and resource constraints, so the higher the site index of the stand forest was, the taller the tree in the stand was. Our opinions were consistent with Xiang’s conclusions [14] that they thought that the larger the initial planting density of the forest, the slower the growth of the DBH, and the better the site quality is, the faster the trees grow.
The interaction effects of the stand density and site index can significantly improve the prediction accuracy of the height-diameter model as the predicted performance of interactive NLEM height-diameter model (Equation (13) with R 2 = 0.6234) was better than the NLS model (Equation (12) with R 2 = 0.5717). In practical application, it is usually necessary to consider the impact of the interaction effects between the predictors on the estimated variable. Therefore, researchers in other disciplines can refer to the interactive NLME height-diameter model presented in this article to build the interactive NLME model.
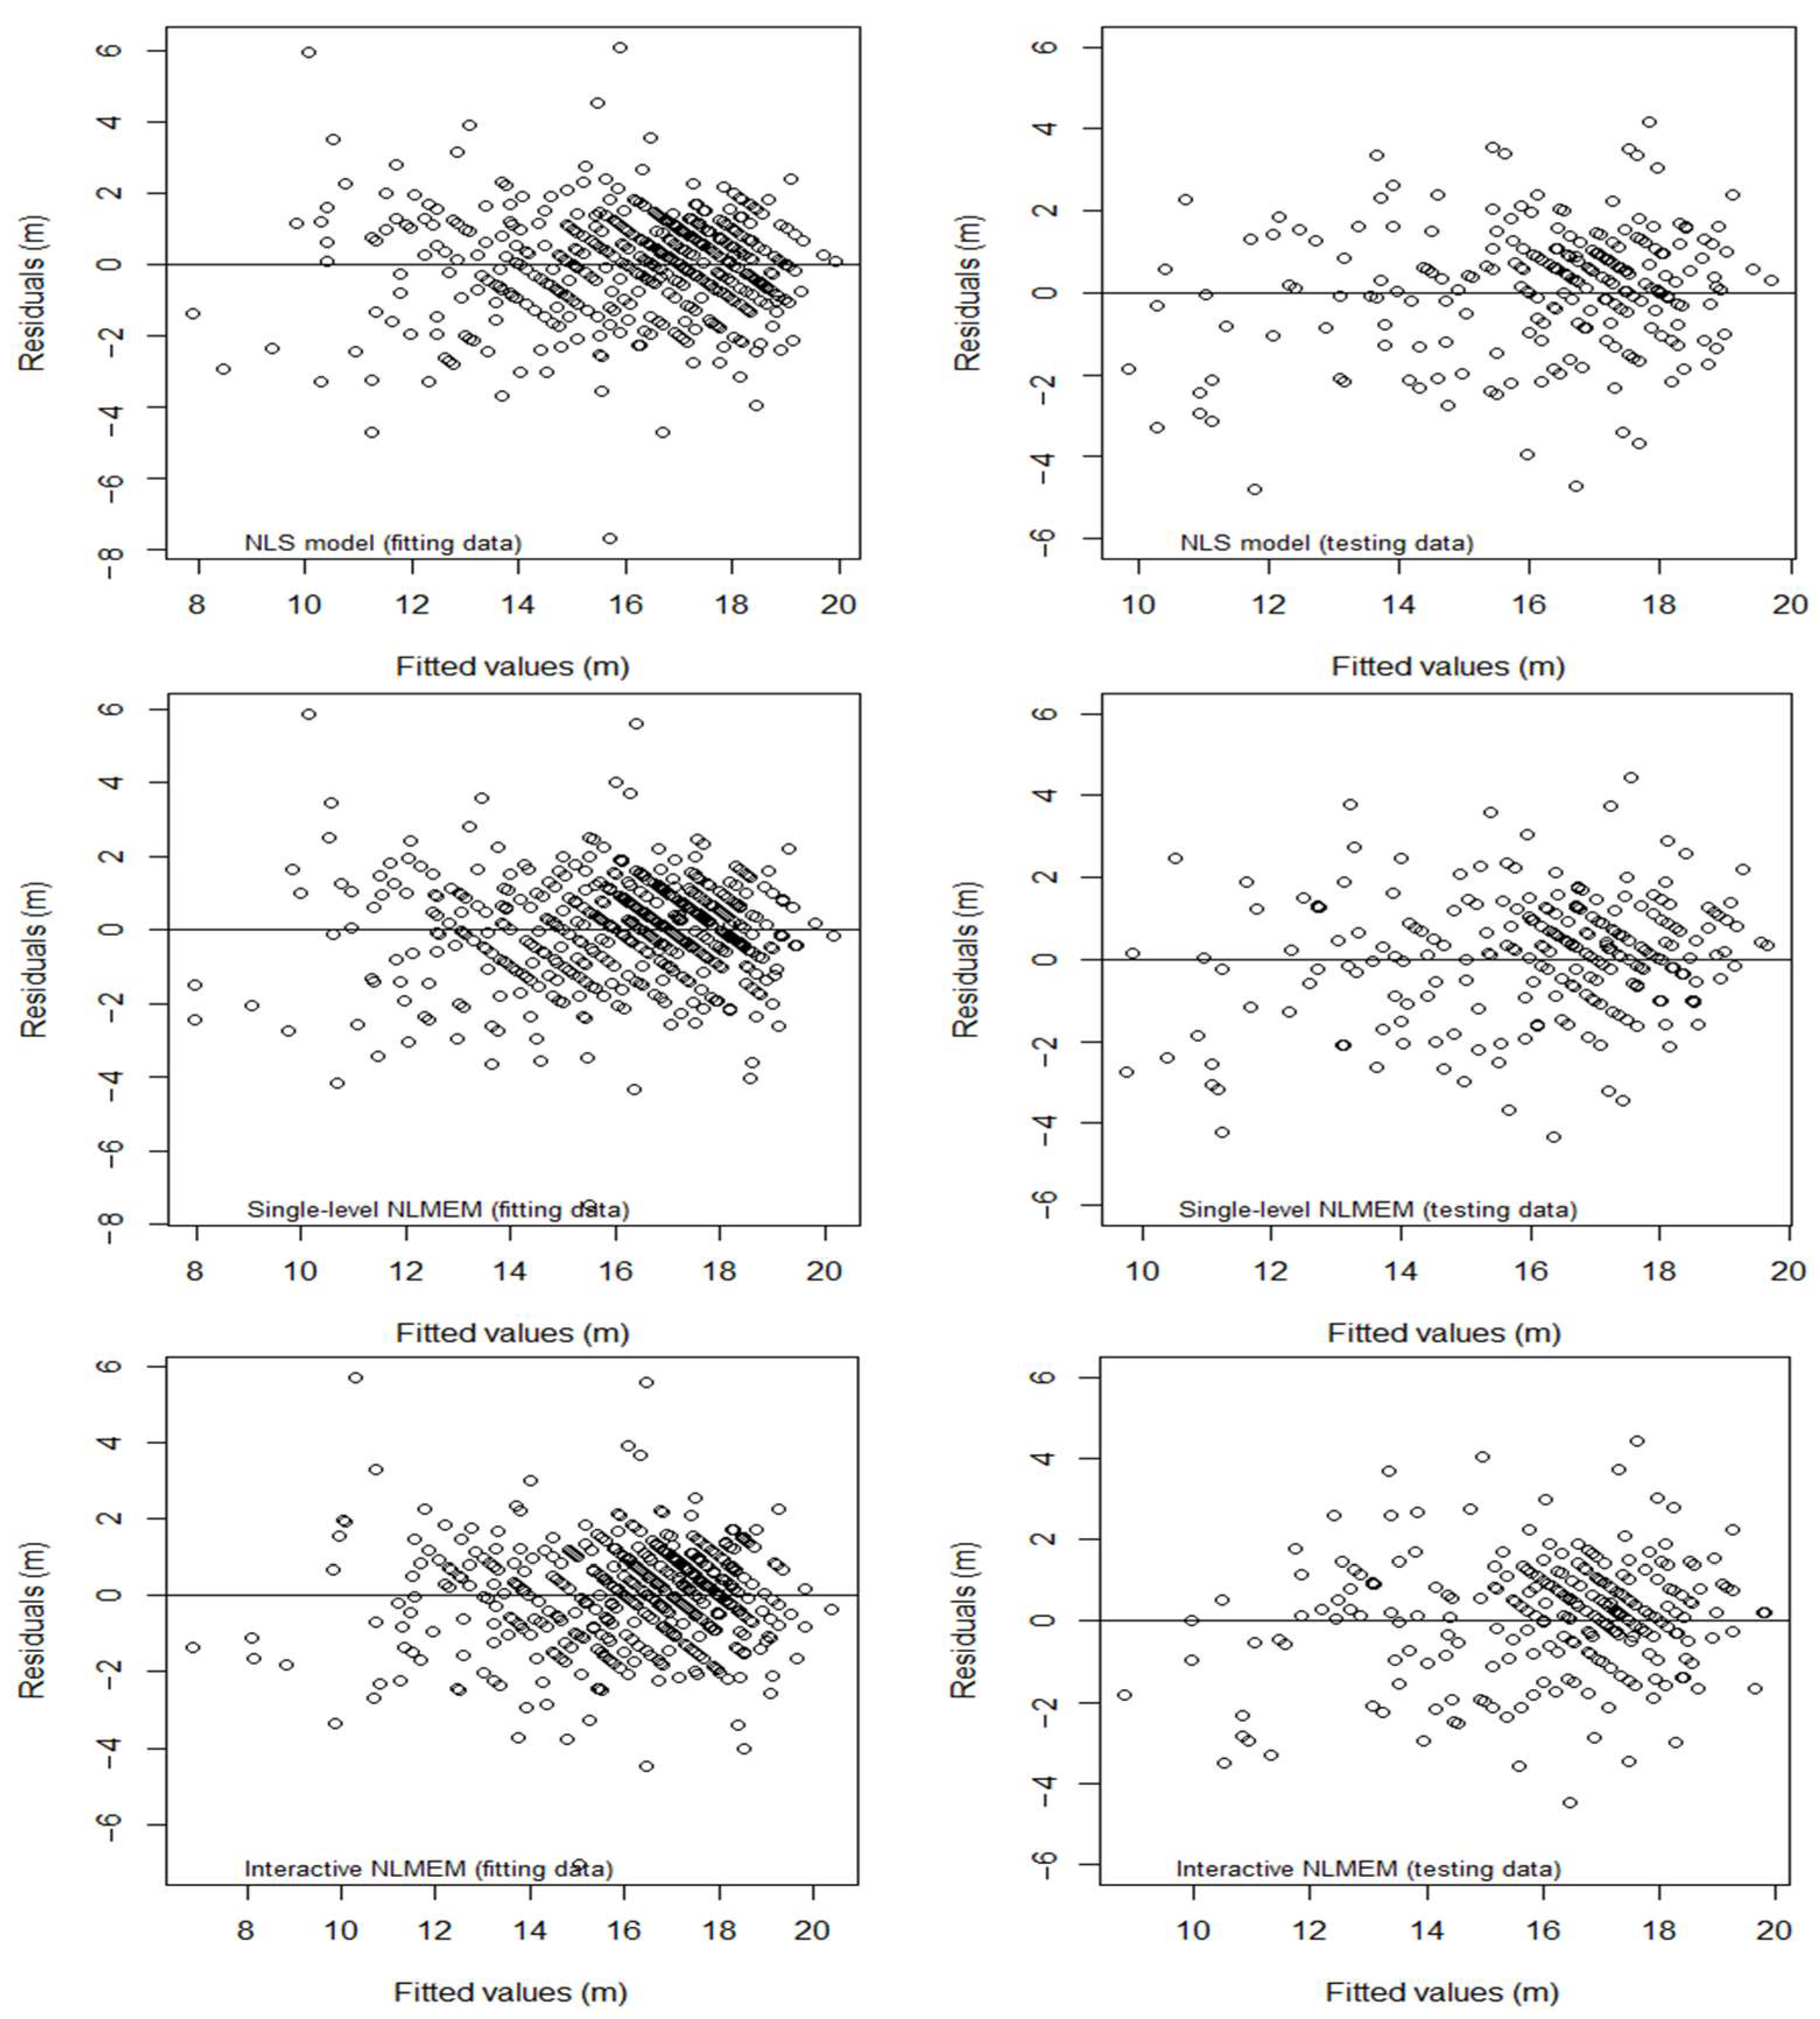
However, it can be seen from the residual plots (Figure 4) of the interactive NLME height-diameter model that, compared with large-diameter trees, the height of small-diameter trees varies largely, which may be because the trees first focus on the height growth to win glory and then use their resources to increase the diameter [7]. To a certain extent, the altitude may affect the impact of the interaction effects between the stand density and site index on tree height, which requires further experiments to prove. In our data, the fitted height curves of Larix olgensis were obviously different at different altitudes (Figure 6), and this indicates that the altitude could affect the parameter estimates of the height-diameter model to a certain extent. In order to further improve the accuracy of the height-diameter model of Larix olgensis, based on the interactive NLME height-diameter model presented in this article, an interactive NLME height-diameter model considering the group variable altitude could be further developed.
In addition, there should be 30 types of M ∗ S in the cross combination of six stand density levels and five site index levels, but our data only contained 14 types of M ∗ S. Therefore, we planned the study to validate and verify the current results with more sample plots with extra M ∗ S types and an increased amount of data in the future.

5. Conclusions

Through the height-diameter modeling with the two random components introduced in the model, it is concluded that there were strong interaction effects of the stand density and site index on the height-diameter relationship for Larix olgensis Henry. Furthermore, the random effects of the stand density on the Larix olgensis tree height were substantively significant at the different classes of site index. In addition, the interaction between the stand density and site index significantly improved the prediction accuracy of the height-diameter model when such an effect was included in the model. In practical forestry application, it is usually necessary to consider the impact of the interaction effects between the predictors on the estimated response variable. Researchers in other disciplines can refer to the interactive nonlinear mixed-effects height-diameter model presented in this article to build the interactive nonlinear mixed-effects models for other tree species.

Author Contributions

Methodology, L.F. (Liyong Fu); formal analysis, X.Z.; resources H.Z.; data curation H.Z.; writing—original draft preparation, X.Z.; writing—review and editing, R.P.S., L.F. (Liyong Fu), X.H. and H.Z.; visualization, L.F. (Linyan Feng) and Z.Z.; supervision, L.F. (Liyong Fu) and H.Z. All authors have read and agreed to the published version of the manuscript.

Funding

This research was funded by Thirteenth Five-year Plan Pioneering Project of High Technology Plan of the National Department of Technology (No.2017YFC0504101).

Data Availability Statement

Not applicable.

Conflicts of Interest

The authors declare no conflict of interest.

References

  1. Özçelik, R.; Cao, Q.V.; Trincado, G.; Göçer, N. Predicting tree height from tree diameter and dominant height using mixedeffects and quantile regression models for two species in Turkey. For. Ecol. Manag. 2018, 419, 240–248. [Google Scholar] [CrossRef]
  2. Sharma, R.P.; Vacek, Z.; Vacek, S. Nonlinear mixed effect height-diameter model for mixed species forests in the central part of the Czech Republic. J. For. Sci. 2016, 62, 470–484. [Google Scholar] [CrossRef] [Green Version]
  3. Zang, H.; Lei, X.; Zhang, H.; Li, C.; Lu, J. Nonlinear mixed-effects height-diameter model of Pinus koraiensis. J. Beijing For. Univ. 2016, 38, 8–16. [Google Scholar] [CrossRef]
  4. Mäkinen, H.; Isomäki, A. Thinning intensity and growth of Scots pine stands in Finland. For. Ecol. Manag. 2004, 201, 311–325. [Google Scholar] [CrossRef]
  5. Woodruff, D.; Bond, B.; Ritchie, G.; Scott, W. Effects of stand density on the growth of young Douglas-fir trees. Can. J. For. Res. 2011, 32, 420–427. [Google Scholar] [CrossRef] [Green Version]
  6. Zeide, B.; Vanderschaaf, C. The Effect of Density on the Height-Diameter Relationship; USDA: Asheville, NC, USA, 2002.
  7. Thanh Tuan, N.; Dinh, T.T.; Shen, H. Height-diameter relationship for Pinus koraiensis in Mengjiagang Forest Farm of Northeast China using nonlinear regressions and artificial neural network models. J. For. Sci. 2019, 65, 134–143. [Google Scholar] [CrossRef] [Green Version]
  8. Krisnawati, H.; Wang, Y.; Ades, P.K. Generalized Height-Diameter Models for Acacia mangium willd. Plantations In South Sumatra. Indones. J. For. Res. 2010, 7, 1–19. [Google Scholar] [CrossRef] [Green Version]
  9. Missanjo, E.; Mwale, G. A Mixed-effects Height-Diameter Model for Pinus kesiya in Malawi. J. Biodivers. Manag. For. 2014, 3, 7. [Google Scholar] [CrossRef]
  10. Fu, L.; Zhang, H.; Sharma, R.P.; Pang, L.; Wang, G. A generalized nonlinear mixed-effects height to crown base model for Mongolian oak in northeast China. For. Ecol. Manag. 2017, 384, 34–43. [Google Scholar] [CrossRef]
  11. Sharma, R.P.; Vacek, Z.; Vacek, S.; Kučera, M. Modelling individual tree height–diameter relationships for multi-layered and multi-species forests in central Europe. Trees 2019, 33, 103–119. [Google Scholar] [CrossRef]
  12. Duan, G.; Gao, Z.; Wang, Q.; Fu, L. Comparison of Different Height–Diameter Modelling Techniques for Prediction of Site Productivity in Natural Uneven-Aged Pure Stands. Forests 2018, 9, 63. [Google Scholar] [CrossRef] [Green Version]
  13. Feldpausch, T.R.; Banin, L.; Phillips, O.L.; Baker, T.R.; Lewis, S.L.; Quesada, C.A.; Affum-Baffoe, K.; Arets, E.; Berry, N.; Bird, M. Height-diameter allometry of tropical forest trees. Biogeosciences 2011, 8, 1081–1106. [Google Scholar] [CrossRef] [Green Version]
  14. Xiang, C.; Zhang, J.; Duan, A.; Zhang, X. Effects of Site Quality and Planting Density on Wood Assortment Rate in Chinese Fir Plantation. For. Res. 2015, 28, 654–659. (In Chinese) [Google Scholar] [CrossRef]
  15. Temesgen, H.; Zhang, C.; Zhao, X. Modelling tree height–diameter relationships in multi-species and multi-layered forests: A large observational study from Northeast China. For. Ecol. Manag. 2014, 316, 78–89. [Google Scholar] [CrossRef]
  16. Liu, X.; Hao, Y.; Widagdo, F.; Xie, L.; Dong, L.; Li, F. Predicting Height to Crown Base of Larix olgensis in Northeast China Using UAV-LiDAR Data and Nonlinear Mixed Effects Models. Remote Sens. 2021, 13, 1834. [Google Scholar] [CrossRef]
  17. Miao, Z.; Widagdo, F.; Dong, L.; Li, F. Prediction of branch growth using quantile regression and mixed-effects models: An example with planted Larix olgensis Henry trees in Northeast China. For. Ecol. Manag. 2021, 496, 119407. [Google Scholar] [CrossRef]
  18. Xie, L.; Widagdo, F.; Dong, L.; Li, F. Modeling Height–Diameter Relationships for Mixed-Species Plantations of Fraxinus mandshurica Rupr. and Larix olgensis Henry in Northeastern China. Forests 2020, 11, 610. [Google Scholar] [CrossRef]
  19. Chenge, I.B. Height–diameter relationship of trees in Omo strict nature forest reserve, Nigeria. Trees For. People 2021, 3, 100051. [Google Scholar] [CrossRef]
  20. Sharma, R.P.; Štefančík, I.; Vacek, Z.; Vacek, S. Generalized Nonlinear Mixed-Effects Individual Tree Diameter Increment Models for Beech Forests in Slovakia. Forests 2019, 10, 451. [Google Scholar] [CrossRef] [Green Version]
  21. Fu, L.; Tang, S. A general formulation of nonlinear mixed effect models and it’s application. Sin. Math. 2020, 50, 15–30. (In Chinese) [Google Scholar] [CrossRef] [Green Version]
  22. Fu, L.; Wang, M.; Wang, Z.; Song, X.; Tang, S. Maximum likelihood estimation of nonlinear mixed-effects models with crossed random effects by combining first order conditional linearization and sequential quadratic programming. Int. J. Biomath. 2019, 12, 1950040. [Google Scholar] [CrossRef]
  23. Tang, S.Z.; Li, Y.; Fu, L.Y. Statistical Foundation for Biomathematical Models, 2nd ed.; Forest Manager and Forestry Statistics Research Office; Higher Education Press: Beijing, China, 2015. (In Chinese) [Google Scholar]
  24. Karnosky, D.F. Micropropagation of Larches (Larix spp.). In Micropropagation of Larches (Larix spp.); Springer: Berlin/Heidelberg, Germany, 1992; Volume 18, pp. 123–135. [Google Scholar]
  25. Popoola, F.S.; Adesoye, P.O. Crown Ratio Models for Tectona grandis (Linn. f) Stands in Osho Forest Reserve, Oyo State, Nigeria. J. For. Environ. Sci. 2012, 28, 63–67. [Google Scholar] [CrossRef]
  26. O’Hara, K.L.; Valappil, N.I. MASAM—a flexible stand density management model for meeting diverse structural objectives in multiaged stands. For. Ecol. Manag. 1999, 118, 57–71. [Google Scholar] [CrossRef]
  27. Sharma, M.; Parton, J. Modeling Stand Density Effects on Taper for Jack Pine and Black Spruce Plantations Using Dimensional Analysis. For. Sci. 2009, 55, 268–282. [Google Scholar] [CrossRef]
  28. Du, J.; Tang, S.; Wang, H. UPDATE MODELS OF FOREST RESOURCE DATA FOR SUBCOMPARTMENTS IN NATURAL FOREST. Sci. Silvae Sin. 2000, 36, 26–32. [Google Scholar] [CrossRef]
  29. Brooks, D.G. Akaike Information Criterion Statistics. Technometrics 2012, 31, 270–271. [Google Scholar] [CrossRef]
  30. Cavanaugh, J.E. Model Selection: Bayesian Information Criterion; Wiley Online Library: Hoboken, NJ, USA, 2016; p. 3. [Google Scholar]
  31. Sánchez-González, M.; Cañellas, I.; González, G. Generalized height-diameter and crown diameter prediction models for cork oak forests in Spain. For. Syst. 2007, 16, 76–88. [Google Scholar] [CrossRef] [Green Version]
  32. Staudhammer, C.L.; LeMay, V. Height prediction equations using diameter and stand density measures. For. Chron. 2000, 76, 303–309. [Google Scholar] [CrossRef] [Green Version]
  33. Yang, R.C.; Kozak, A.; Smith, J.H.G. The potential of Weibull-type functions as flexible growth curves. Can. J. For. Res. 1978, 8, 424–431. [Google Scholar] [CrossRef]
  34. Chapman, D.G. Statistical Problems in Dynamics of Exploited Fisheries Populations. In Proceedings of the 4th Berkeley Symposium on Mathematics, Statistics and Probability, Berkeley, CA, USA, 20 June–30 July 1960; University of California Press: Berkeley, CA, USA, 1961; Volume 4. [Google Scholar]
  35. Richards, F.J. A Flexible Growth Function for Empirical Use. J. Exp. Bot. 1959, 10, 290–301. [Google Scholar] [CrossRef]
  36. Winsor, C.P. The Gompertz curve as a growth equation. Proc. Natl. Acad. Sci. USA 1932, 18, 1–8. [Google Scholar] [CrossRef] [Green Version]
  37. Boris, Z. Analysis of Growth Equations. For. Sci. 1993, 39, 594–616. [Google Scholar] [CrossRef]
  38. Flewelling, J.W.; Jong, R.D. Considerations in simultaneous curve fitting for repeated height–diameter measurements. Rev. Can. De Rech. For. 1994, 24, 1408–1414. [Google Scholar] [CrossRef]
  39. Pearl, R.; Reed, L.J. On the Rate of Growth of the Population of the United States since 1790 and Its Mathematical Representation. Proc. Natl. Acad. Sci. USA 1920, 6, 275–288. [Google Scholar] [CrossRef] [PubMed] [Green Version]
  40. Yang, Z.; Liu, Q.; Luo, P.; Ye, Q.; Sharma, R.P.; Duan, G.; Zhang, H.; Fu, L. Nonlinear mixed-effects height to crown base model based on both airborne LiDAR and field datasets for Picea crassifolia Kom trees in northwest China. For. Ecol. Manag. 2020, 474, 118323. [Google Scholar] [CrossRef]
  41. Fu, L.Y. Nonlinear Mixed Effects Model and Its Application in Forestry. Ph.D. Thesis, Chinese Academy of Forestry, Beijing, China, 2012. [Google Scholar]
  42. Thanh Tuan, N.; Dinh, T.T.; Zhang, P.; Razaq, M.; Shen, H. Effect of thinning intensity on tree growth and temporal variation of seed and cone production in a Pinus koraiensis plantation. J. For. Res. 2018, 30, 835–845. [Google Scholar] [CrossRef]
  43. Ritchie, M.; Zhang, J.; Hamilton, T. Effects of Stand Density on Top Height Estimation for Ponderosa Pine. West. J. Appl. For. 2012, 27, 18–24. [Google Scholar] [CrossRef] [Green Version]
Figure 1. Location (upper left) of study area: Wangqing Forest Bureau (upper right) in northeast China and spatial distribution of 5 blocks and 20 sample plots (bottom).
Forests 12 01460 g001
Figure 2. Total tree height plotted against diameter at breast height.
Forests 12 01460 g002
Figure 3. Height-diameter curves produced with Equation (13) corresponding to 14 combinations of M ∗ S (stand density ∗ site index; 3 ∗ 2 = stand density is class 3 and site index is class 2). The left is the height-diameter curves superimposed on the model fitting data, and the right is the height-diameter curves superimposed on the model testing data.
Forests 12 01460 g003
Figure 4. Residual distributions of NLS model (Equation (12)), the single-level NLME model (Equation (14)), and the interactive NLME model (Equation (13)) for both the model fitting data and model testing data, respectively.
Forests 12 01460 g004
Figure 5. The height-diameter curves produced with Equation (13) corresponding to the different M ∗ S superimposed on full data set. Plot (a) described the height-diameter relationship in low-density stands, plot (b) described the height-diameter relationship in medium-density stands, and plot (c) described the height-diameter relationship in high-density forest stands. (Symbol M ∗ S means stand density ∗ site index; 1 ∗ 4= stand density of the stand is class 1 and site index of the stand is class 4). H= tree height (m); D = diameter at breast height (cm).
Forests 12 01460 g005
Figure 6. The fitting curves of height-diameter relationship at different altitude levels. The left plot is the fitting curve of height-diameter relationship of 300 observations at altitude higher than 700 m (A = 1). The right is the fitting curve of height-diameter relationship of 465 observations at altitude less than 700 m (A = 2). H= tree height (m); D = diameter at breast height (cm).
Forests 12 01460 g006
Table 2. Range of stand density class and site index class for Larix olgensis. SD is stand density; SI is site index.
VariableClassClass Range
M (Stand density class)1SD < 700
trees ha−12700 ≤ SD < 850
3850 ≤ SD < 1000
41000 ≤ SD < 1150
51150 ≤ SD < 1300
6≥1300
S (Site index class)1SI < 15.5
m 215.5 ≤ SI < 16.0
316.0 ≤ SI < 16.5
416.5 ≤ SI < 17.0
5SI ≥ 17.0
Table 3. Summary statistics of stand variables from sample plots used for model fitting and model validation, respectively. D= diameter at breast height (cm); H = tree height (m); SD = stand density (tree ha−1); SI = site index (m); STD = Standard deviation of the variable.
DataVariableMinMaxMeanSTD
Model fitting data
Area (m2)77525001500600
D (cm)5.6035.5017.695.30
H (m)5.5022.0016.132.52
SD (trees ha−1)64018191048266
SI (m)15.0317.3016.040.67
Model testing data
D (cm)7.1033.3017.615.18
H (m)7.0022.0016.252.79
SD (trees ha−1)64014901031277
SI (m)15.0217.3016.090.69
Table 5. AIC (Akaike information criterion) score and BIC (Bayesian Information Criterion) score of the base models (Table 4).
ModelAICBIC
M12818.652832.57
M22721.782735.70
M32721.782737.93
M42718.632737.19
M52718.852737.41
M62720.332738.89
M72718.052736.61
M82718.292736.85
M92723.982742.54
Table 6. Thirty-six alternatives of the random effect constructions in the nonlinear mixed-effects models.
Model ϕ 1 ϕ 2 Model ϕ 1 ϕ 2
1MM19M + M ∗ S M
2MS20M + M ∗ S S
3SM21M + M ∗ S M ∗ S
4SS22M + M ∗ S M + M ∗ S
5MM ∗ S23M + M ∗ S S + M ∗ S
6MM + M ∗ S24M + M ∗ S M + S + M ∗ S
7MS + M ∗ S25S + M ∗ S M
8MM + S + M ∗ S26S + M ∗ S S
9SM ∗ S27S + M ∗ S M ∗ S
10SM + M ∗ S 28S + M ∗ S M + M ∗ S
11SS + M ∗ S29S + M ∗ S S + M ∗ S
12SM + S + M ∗ S30S + M ∗ S M + S + M ∗ S
13M ∗ SM31M + S + M ∗ S M
14M ∗ S S32M + S + M ∗ S S
15M ∗ S M ∗ S 33M + S + M ∗ S M ∗ S
16M ∗ S M + M ∗ S 34M + S + M ∗ S M + M ∗ S
17M ∗ S S + M ∗ S 35M + S + M ∗ S S + M ∗ S
18M ∗ S M + S + M ∗ S 36M + S + M ∗ S M + S + M ∗ S
Note: columns ϕ 1 and ϕ 2 show the random effects formulation variables that are acting on parameter ϕ 1 and parameter ϕ 2 , respectively. M ∗ S denotes the crossed random effects of M (stand density) and S (site index). Symbol ∗ is not a simple multiplication; it means the crossed effects of variables.
Table 7. AIC (Akaike information criterion) score and BIC (Bayesian Information Criterion) score of 36 models derived from the base model.
ModelAICBICModelAICBIC
11798.341823.72191787.531817.14
21796.581817.73201792.201817.58
31793.001814.15211773.641803.25
41804.011829.34221777.641815.71
51783.411804.56231789.411823.26
61785.131814.74241779.641821.94
71785.411810.80251789.221814.61
81787.121820.97261794.211823.82
91783.411804.57271773.641803.25
101785.371810.76281775.641809.48
111787.411817.03291777.641815.71
121789.371823.22301779.641821.94
131787.231808.39311789.531823.37
141790.221811.37321796.191830.03
151771.641797.02331775.641809.48
161773.641803.25341779.641821.94
171773.641803.25351779.641821.94
181775.641809.48361783.641834.40
Table 8. Estimated values of the random effects.
AM ∗ Su1u2AM ∗ Su1u2
13 ∗ 2−0.05921.418923∗ 40.05440.9706
16 ∗ 1−0.06660.665221∗ 40.02610.9751
14 ∗ 20.0679−0.877022 ∗ 10.1206−2.3081
13∗ 30.0161−0.274726 ∗ 1−0.06660.6652
14 ∗ 1−0.02740.319124 ∗ 1−0.02740.3191
16 ∗ 3−0.03491.110825 ∗ 2−0.0111−0.2363
11 ∗ 50.0118−0.032822 ∗ 4−0.10432.1220
25 ∗ 50.0044−0.366326 ∗ 3−0.03491.1108
22 ∗ 30.0543−1.5452
Note: M ∗ S means the type of stand density and site index for a sample plot (e.g., M ∗ S = 3 ∗ 2 means a sample plot with stand density class = 3 and site index class = 2). The u1 and u2 are the random effects on the parameters ϕ 1 and ϕ 2 of the interactive NLME height-diameter model (Equation (13)), respectively.
Table 9. Results of likelihood ratio test. LR is the likelihood ratio.
Complex Model vs. Simple ModelLR p-Value
Interactive NLMEM (Equation (13)) vs. NLS (Equation (12))27.81p < 0.001
Interactive NLMEM (Equation (13)) vs. Single-level NLMEM (Equation (14))23.36p < 0.001
Table 10. Evaluation indicators for the NLS model (Equation (12)), which is a non-random effect or fixed effect model, the single-level NLME model (Equation (14)), and the interactive NLME model (Equation (13)).
Data SetModelMPSERMSE R 2
Model fitting dataNLS model6.86181.18200.6880
Single-level NLMEM6.60371.34500.6991
Interactive NLMEM6.30761.13060.7189
Model testing dataNLS model7.47931.23060.5717
Single-level NLMEM7.28961.45910.5799
Interactive NLMEM6.82341.18030.6234
Publisher’s Note: MDPI stays neutral with regard to jurisdictional claims in published maps and institutional affiliations.

