Article

Combining Landscape Fire Simulations with Stand-Level Growth Simulations to Assist Landowners in Building Wildfire-Resilient Landscapes

Centro de Estudos Florestais, Instituto Superior de Agronomia, Universidade de Lisboa, Tapada da Ajuda, 1349-017 Lisboa, Portugal
*
Author to whom correspondence should be addressed.
Submission received: 16 September 2021 / Revised: 12 October 2021 / Accepted: 20 October 2021 / Published: 29 October 2021
(This article belongs to the Special Issue Engaging Land Owners to Reduce Wildfire Risk at Landscape Level)

Abstract

:
The wildfire regime in Portugal has been responsible for millions of hectares of burnt area, and Alvares parish is no exception. In 2017, a severe wildfire burnt 60% of its area. Land abandonment has been increasing since the mid 20th century, and a large fraction of the forest area belongs to quasi-absent landowners. This has given rise to large, almost unbroken expanses of undermanaged forests that, in combination with rugged topography, originates a landscape prone to large, intense wildfires. Thus, a change in landscape composition and structure capable of reducing flammability and promoting fuel discontinuity is urgently needed. A fire spread simulator and a forest growth simulator were combined to show the impact of improving management at landscape level. It was assumed that the probability of large wildfires may be reduced by setting aside forest area for the implementation of a fuel break network (FBN) and increasing the area under sustainable forest management. Three levels of management intensity were simulated by restricting the area of Quasi-absent non-industrial owners to 34.5%, 20.1%, and 8.5% of the Alvares forest area, in favor of increasing the area of active and semi-active non-industrial owners (current, moderate, and high management scenarios). Different FBN extents, representing four levels of network implementation priority were combined with the management levels, resulting in 12 scenarios. To evaluate the impact of fire, simulations assuming no-fire, no-FBN, and current management intensity were performed, whereas the impact of operation costs was assessed assuming reduced costs for silvicultural operations. Per hectare simulations were then scaled up to the parish level and volume harvested and net present values were used to compare the management improvement scenarios. Results showed that fire has major repercussions on forest income, but these impacts can be minimized. Intensifying forest management and implementing the first priority FBN segments originated substantial improvements in financial outcome from timber production, close to those obtained for the full FBN implementation. Results also evidenced contrasting contributions from industrial and non-industrial owners with the later evidencing unbalanced cash-flows derailing the possibility for interesting forest incomes. The coupling of fire and forest growth simulations can be an interesting approach to assess the impact of different management and policy scenarios and inform policies.

1. Introduction

Wildfires are one of the most important threats to lives and assets in Southern Europe, and particularly relevant in Portugal. These disturbance events ultimately lead to land abandonment and forest degradation, jeopardizing the provision of goods and services and impacting on the subsistence of the populations remaining in these areas [1]. Under changing climate, weather conditions are likely to favor the occurrence of extreme fire events such as those from 2017, in Portugal [2]. In order to reduce the area affected by wildfires in Portugal wildfire suppression measures should be combined with mitigation measures, such as silvicultural practices that reduce fuel accumulation [3,4,5].
Forests cover 36.2% of the area of Portugal [6]. Eucalyptus spp. (mostly E. globulus Labil) and maritime pine (Pinus pinaster Aiton) plantations respectively account for 26% and 22% of this area [6]. However, this has not always been the case and back in 1875 Portugal’s mainland had a forest cover of about 7% [7]. In 30 years, forest area increased by 22% [8]. Until 1955, both private and public agents supported afforestation programs, mainly with maritime pine, leading to a continuous increase in forest area. Nevertheless, since the 1960s, the transfer of labor force from agriculture to other sectors, nationally and abroad, in rugged terrain mostly unfit to mechanization, led to farmland abandonment. This, along with a number of other factors including the international demand for wood fiber and the construction of several pulp mills in Portugal triggered the expansion of eucalypt plantations. In this context, public funded afforestation programs did not fully compensate for the extensive area annually lost to fire. In addition, forest expansion policies did not invest enough in programs to promote fuel management and natural regeneration [9]. The increase in fire frequency affected the survival rate of maritime pine stands, which often burned repeatedly before reaching reproductive maturity and were unable to regenerate. Adding to this, pine wilt nematode (Bursaphelenchus xylophilus (Steiner and Buhrer) Nickle) outbreaks led to the premature harvest of many maritime pine stands, further jeopardizing the future of this forest species in Portugal. Over the years, the area of eucalypt plantations increased, to match the demand for pulp, from a 13% cover in 1985 [10] to 26% in 2015 [6], while the areas of maritime pine decreased from 45% in 1985 [10] to 22% in 2015 [6]. One of the reasons behind this reduction is the set of severe restrictions to commercialization of pine timber affected by the wilt nematode [11], along with the high recurrence of wildfires. The short wildfire cycles compromise the longevity of pine forests, traditionally managed by private owners in 35-year rotations [12], producing low-value salvage wood that usually supplies local timber markets. Conversely, eucalypt, a fast-growing species with resprouting ability, usually managed in three consecutive 10- to 12-year rotations, and having a secure market, became the landowner’s choice. Nevertheless, land abandonment and fire occurrence led to shrubland expansion followed by unmanaged natural regeneration of forests, resulting in overly dense eucalypt and pine stands with high fuel loads [13].
In a recent study, eucalypt plantations were considered a relatively stable financial investment, capable of providing considerable return in medium to high productivity sites, whereas investments in pine stands only become attractive if supported by public subsidies [14]. However, that study did not consider the impact of fire on the attractiveness of investments. Despite being managed in shorter rotations, it is common to find landowners selling burnt eucalypt wood, due to the even shorter fire cycle observed in many areas of Portugal. Recurrent wildfires lead to very low stumpage prices because of massive timber supply from burnt forests, which is aggravated by expensive debarking to avoid charcoal contamination in pulp mills [15].
The forestland ownership structure, characterized by small-sized fragmented properties, several belonging to the same owner, adds complexity and hampers effective forest management and landowner investment capacity [16]. Mere awareness of the high fire risk prevailing in the area contributes to anticipating final harvest, requiring additional investment for site re-installation operations, which in turn represents the most costly set of silvicultural operations. This negatively affects non-industrial private owners, who are left with no option but to reduce forest management to a minimum, inevitably leading to the accumulation of surface fuel loadings and reduced stand productivity (e.g., competition with shrubs, inexistent or reduced fertilization and pest and disease control).
All-embracing measures at different scales are required to address the threats and drivers of forest economic losses. At a local scale, it is recommended to promote forest management and planning among landowners as a means to reduce fire risk [17], and providing easy access to forest management rural extension services is essential. At a landscape level, better planning can be achieved through the implementation of a suitable network of roads and/or fuel-breaks [18] and by reducing fuel loads [19]. This will not only enable creating heterogeneous mosaics (in terms of composition and/or structure) of forest stands, contributing to landscape diversity, but it will also reduce the spread and intensity of upcoming large wildfires and facilitate suppression strategies. Therefore, successful forest management and planning requires mobilizing landowners toward cooperative management based on joint decision-making, shared responsibilities, and shared revenues [20,21,22].
Alvares parish (municipality of Góis), located in central Portugal, gathered the ideal characteristics to constitute a case study: high forest area and high fuel loads, low population density, small-sized ownership, and rugged terrain that hinder forest management. The high fire recurrence in Alvares led to some areas within the parish to burn six times over the past six decades. After the most recent and destructive large wildfire, in 2017, which burned 60% of the parish area, a group of landowners requested support from the Forest Research Centre (University of Lisbon) to develop a plan with the aim of reducing the parish vulnerability to large wildfires [16].
In Alvares, the establishment of a collaborative joint forest management initiative is expected to create opportunities to lower the costs of silvicultural operations, increase stumpage prices, and improve stand-level management and landscape planning with the aim of promoting wildfire risk reduction and higher forest income. This joint management can be achieved, for example, by the creation of a “forest intervention zone” (ZIF)—a legal framework that provides for the joint design of a common forest management plan, which is meant to promote sustainable management and reduced fire risk [20]. Alternatively, the implementation of forest-aggregated areas—pilot forest management projects implemented by a forest owners’ association, which gather contiguous holdings from different owners where joint management is carried out under private quota-based investments and revenues. However, mobilizing forest landowners is a challenging and often long-lasting process because despite them knowing that forest management could contribute to reduce fire occurrence and severity, they need to be shown that investing in forest management will actually compensate economically.
The main objective of the present work is to understand and quantify how much medium-term forest productivity and profitability can be increased in a fire-prone area through improved management and planning and showing local landowners these results.
In Europe, the probability and severity of wildfires are increasing. A recent overview focusing on the diversity of fire patterns and challenges across Europe has evidenced the lack of harmonized wildfire data to allow comparable analysis [23]. The growing importance of wildfire has driven the desire to better understanding ignitions and fire spread to support the simulation of these events. At the same time, it has urged the need for quantifying the economic and environmental impacts resulting from wildfire occurrence. The development of individual tools for simulation of fires across the landscape and for the simulation of the undisturbed growth of forests over time have long been tackled by research. However, combining fire and growth simulations within the same tool has proven a complex and challenging process. Many studies have tried to assess fire risk using, for example, fire behavior models mostly if not exclusively developed in the USA (e.g., NEXUS [24], FARSITE [25], FlamMap [26], BehavePlus [27], and FSIM [28]. These models require as input both constant and changing variables (e.g., topography and wind speed, respectively) that either cannot be controlled by managers or be accurately taken into account in forest growth simulations, which has led some authors to use other approaches such as running growth simulators and using the output runs to estimate fire-risk indicators [29]. More ambitious attempts have tried to couple fire models with forest growth models to be run in parallel (e.g., FVS-FFE [30], RODAL [31]). Nevertheless, few studies have focused on the viability of economic investments in the Mediterranean area [14]. In Quebec, Canada, a study including a cost–benefit analysis for nine fire management scenarios showed that the expenditure of fire management economically compensated the expenditure resulting of fire suppression strategies [32]. To our knowledge, hardly any studies have tried to integrate the impact of fire occurrence on forest stand dynamics and on its economic sustainability.
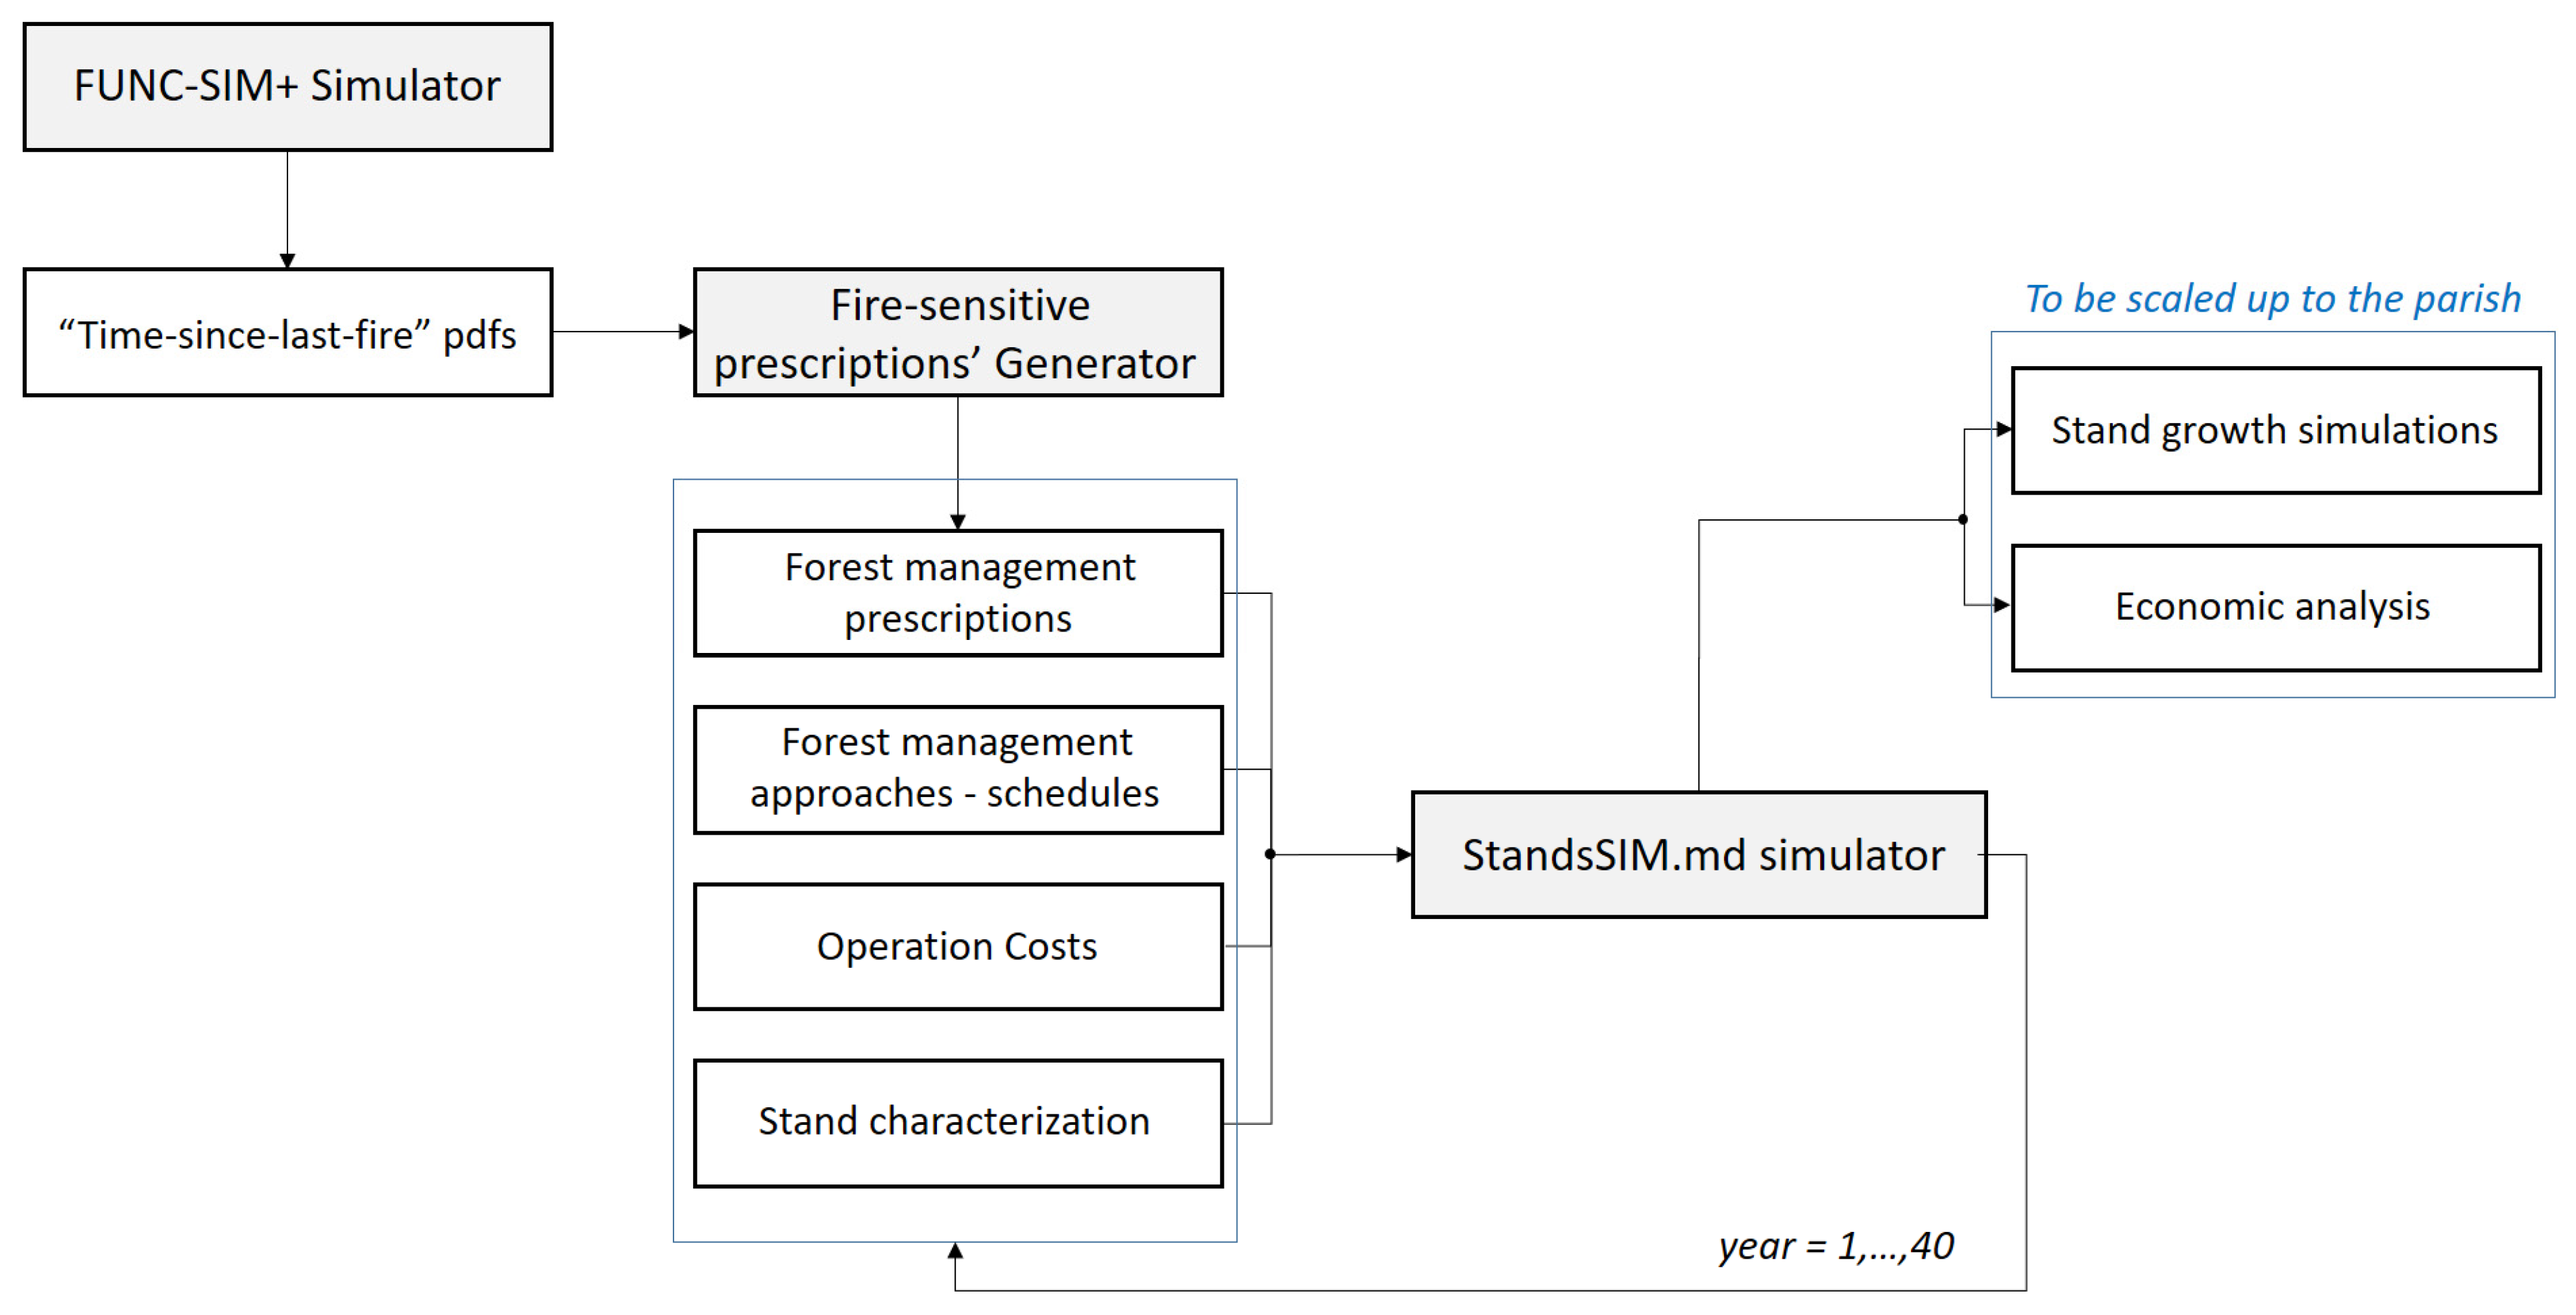
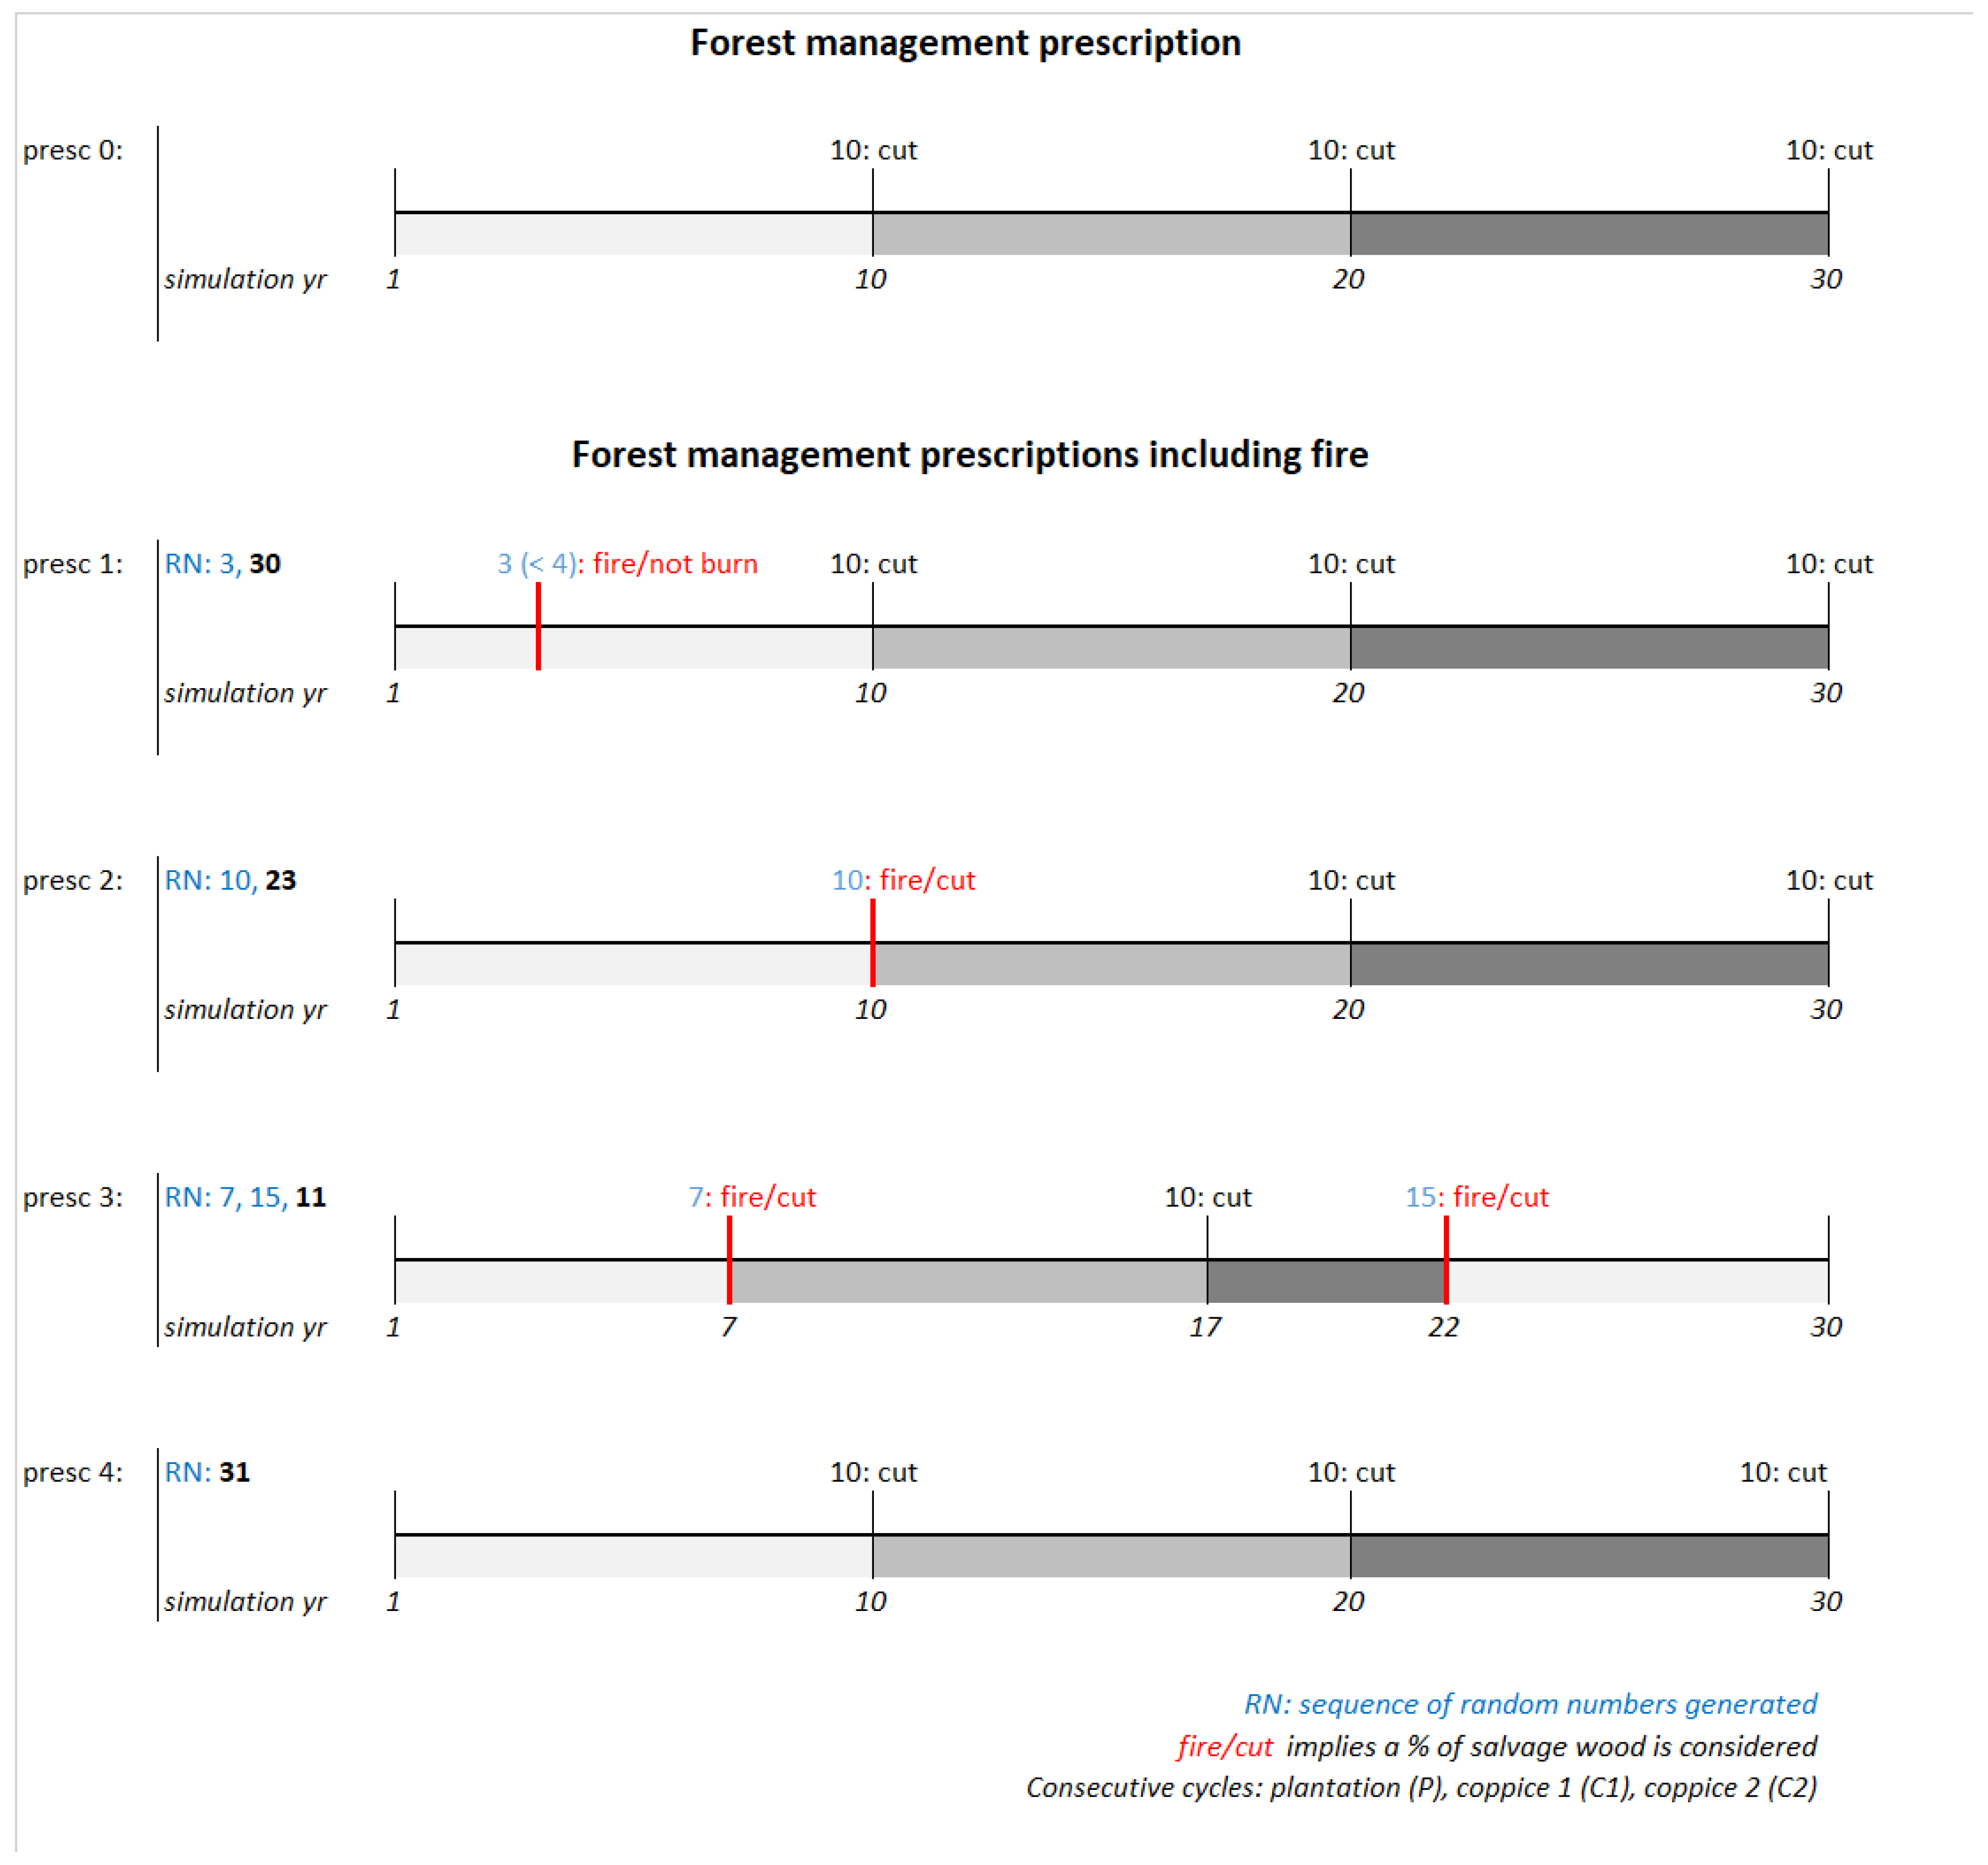
In this study, a simple methodology based on the use of the same suite of management scenarios by both a fire simulator and a forest growth simulator was designed. StandsSIM.md is a management-driven forest simulator that predicts the growth of stands according to a predefined management prescription describing the silvicultural operations to be performed throughout the life of the stand and the stand harvest age [33]. The approach was based on the premise that whenever severe wildfire occurs, final harvest is anticipated. Being able to determine the wildfire recurrence for different management scenarios, fire-sensitive management prescriptions could be generated. Fire simulations were carried out providing a set of probability mass distributions of “time-since-last-fire” (one by scenario). Then, an algorithm using Monte Carlo Simulation and the “time-since-last-fire” distributions was developed to create fire-sensitive prescriptions reflecting the anticipated harvest occurring for each scenario. The set of fire-sensitive prescriptions were used as input by StandsSIM.md forest simulator to predict the growth and simultaneously conduct an economic analysis for a period of 40 years using net present value (NPV) and harvested volume as indicators. The challenge and novelty of this study lies in developing a methodology for combining short-term landscape fire simulations with medium-term stand-level growth simulations allowing for the integration of wildfire disturbance in growth simulations.

2. Materials and Methods

2.1. Study Area Characterization and the Participatory Approach

Alvares is a 10,000 ha parish located in a mountainous area in central Portugal, with altitude varying between 297 and 1170 m a.s.l. Schist soils predominate in the area [34], generally shallow, especially in steep slopes, requiring deep ripping and/or terracing. Mean annual precipitation ranges from 1100 to 1700 mm, July and August being the driest months [35].
The situation in Alvares is similar to that found in the central and north of Portugal, where private property fragmentation and small-sized properties are scattered across a rugged landscape intersected by deep valleys that make forest management an expensive challenge. The high level of fire hazard is not surprising given the ownership size and structure: 42% of forest landowners have less than 4 ha and 33% own more than 10 ha, not necessarily in a single land parcel [36]. Almost all (96%) of this area is privately owned, belonging to over 3000 owners, including two large pulp and paper companies [19].
Prior to the 2017 wildfire, the parish had very extensive forest coverage (90%), mostly composed by eucalypt (53%) and maritime pine (29%) plantations. Small patches of Quercus robur L., Acacia spp., Pseudotsuga menziesii (Mirbel) Franco, and riparian species of the genus Alnus spp., Salix spp., and Betula spp. were also present. In 2017, the few National Forest Inventory plots located in Alvares were neither sufficient nor updated (inventory reference year was 2005) for a proper characterization of the forest stands. Bearing this in mind, a group of local forest landowners, including the pulp and paper industries, was invited to join the research team. In several meetings, they described the current state of their forest areas after the 2017 fire, their current management practices, and additional information relevant for the simulation of alternative ways to plan land use and forest management for the future. The information collected during several meetings was used to identify five forest owner types: one industrial and four non-industrial (Table 1). The meetings produced additional information that allowed characterizing understory fuels (see [19] and post-fire stand conditions. All collected information was complemented with the Portuguese 2015 land cover map [37].

2.2. Key Forest Management Concepts

The StandsSIM.md simulator was used to predict the evolution of forest dynamics over consecutive management cycles [33]. Before moving forward, a few important concepts must be introduced. Considering a cycle as the period under which a stand is managed according to a certain forest management approach, in plantations, a cycle is defined as the period from stand regeneration (planting or coppicing) until final harvest. StandsSIM.md requires identifying the list of silvicultural operations to be carried out in each cycle. The number and frequency of silvicultural operations within a cycle determine the management intensity (Figure 1). The set of silvicultural operations characterizing the level of management intensity within a cycle is called the “forest management approach” (FMA). In order to take topographic and physiographic conditions into account, changes to the list of silvicultural operations within an FMA (e.g., terracing operations in steep terrain) can be considered and are referred to as “FMA variants”. Forest simulations can comprise several cycles within a simulation period. The sequence of “FMA variants” that characterize the consecutive cycles considered in a simulation is called “forest prescription”. A “forest prescription” can be composed of several FMAs or only one. The duration of each cycle, i.e., the time during which an FMA or “FMA variant” is applied (e.g., age of final harvest), is defined in the “forest prescription”.
In this study, the description of the different owner types reflects a gradient in terms of forest management, ranging from intensive sustainable forest management (professional industrial owners) to no management whatsoever (absent private owners). Thus, an FMA reflecting a different management intensity level [38] was assigned to each owner type except for the absent owners type (Figure 1).
Located in a mountainous region, the study area includes a broad range of distinct topography and altitude conditions affecting the silvicultural operations required, namely the preparation of soil in terraces in steep slopes and the application of insecticide to control eucalyptus weevil (defoliator), at altitudes higher than 450 m a.s.l. (below this altitude, biological control is effective). Consequently, four “FMA variants” covering the possible situations were considered: no terraces required, but insecticide needed (1); no terraces or insecticide required (2); terraces and insecticide required (3); and terraces required, but no insecticide needed (4). The second variant was the only one considered for quasi-absent owners, given the low-intensity management that characterizes them.
In these simulations, the same “FMA variant” was maintained for all the cycles in each prescription.

2.3. The Improved Forest Management Scenarios

In Alvares, the extensive forest cover and recurrent large wildfires demand urgent changes. To minimize the impact of wildfires and build more resilient, productive, and profitable forests, two different actions were hypothesized to have a positive effect in reducing fire hazard: (i) the improvement of stand-level forest management, and (ii) the implementation of a fuel-break network. A set of 12 forest management scenarios were built, resulting from the combination of three levels of improved stand management with four priority levels for the fuel-break network (FBN) implementation.
The FBN is implemented at the expense of reducing forest area. It ranges from no implementation (FBN0/3) to full FBN implementation (FBN3/3). The first priority level (FBN1/3) corresponds to implementing one third of the FBN in the locations deemed as most relevant to reduce surface fire spread, whereas the second priority level (FBN2/3) integrates the first and second thirds (details on the location of the different priority levels can be found in Benali et al. [19]).
The improved stand-level management strategy was composed of three levels: current, moderate, and High. The participatory approach allowed assigning different shares of area to each FMA for the current situation, evidencing the under-managed conditions of forests in Alvares, given that the absent and quasi-absent private owners represent almost 50% of the forest area. The approach followed for building the scenarios was conservative and assumed that the area managed by professional industrial and absent private owners would remain unchanged, considering that it will be impossible to motivate the latter to activate management practices. Thus, forest management improvement was simulated through shifts in the areas managed by the remaining owner types. For the moderate scenario, an approximately balanced share of area among all owner types was considered. For the high scenario, the area managed by the quasi-absent owners was reduced in 26%, increasing the area managed by active and semi-active owners by 13% each (Table 2).
A total of 12 scenarios, combining the 4 FBN levels (FBN0/3, FBN1/3, FBN2/3, and FBN3/3) with the 3 management improvement levels (MCur, MMod, and MHgh) under the occurrence of fire (F1) considering currently practiced costs (C0) were considered. Out of these, the one representing current management and no-FBN implementation represents the business-as-usual (FBN0/3_MCur_F1_C0~BAU) conditions. A benchmark scenario without fire was also considered (FBN0/3_MCur_F0_C0), to allow the impact of wildfires on medium-term forest productivity and profitability to be assessed. Finally, the 12 scenarios were run a second time for the active and semi-active private owners, assuming reduced unit area costs for silvicultural operations. These could result from coordinated management of more extensive tracts of forest than those currently dealt with by individual non-industrial landowners. Table A1Appendix A provides a description of each scenario and corresponding forest areas by owner type/FMA.

2.4. Forest Growth and Wildfire Simulations

A simple approach was taken based on the premise that fire occurrence anticipates the final harvest of eucalypt stands. It consisted of improving and linking a fire and a forest growth (with an economic module integrated). In both cases, the same suite of alternative forest management scenarios combining different levels of management improvement and FBN implementation were used. The first simulator was used to run fire spread simulations at the landscape level for a given point in time, assuming certain fuel distributions (scenario) in the area [19]. The output was a set of probability mass distribution function (PDF) of “time-since-last-fire”, one for each forest management scenario. An algorithm was developed to include fire occurrence into the “forest prescriptions” using Monte Carlo Simulation and the “time-since-last-fire” PDFs. In each fire-sensitive prescription, the length of each cycle was defined by the minimum of the pair final harvest age and time-since-last-fire. The latter was randomly defined according to the “time-since-last-fire” PDF characterizing the scenario. Using the set of fire-sensitive “forest prescriptions” as the input, StandsSIM.md was run at stand-level to predict the dynamics of forest growth for a 40-year period, with an annual time-step. The simulations took into account the schedule of operations (and corresponding costs) and produced volume-harvested estimates. An economic analysis comparing the different scenarios based on net present value (NPV) was carried out. Finally, simulations were scaled up to parish level by multiplying stand-level estimates by the respective forest area (Figure 2).

2.4.1. Wildfire Simulation and Input Data

To integrate the impact of wildfires in the assessment of medium-term productivity and profitability, a modeling approach to simulate the “time-since-last-fire” in a 40-years time horizon was used. Benali et al. [19] developed FUNC-SIM to simulate some 28,000 hypothetical wildfires with random ignitions sampled from an ignition probability surface map and driven by weather data associated with very large (>1000 ha) historical wildfires. Fuel data were based on the Portuguese national land cover map, expert knowledge, and information provided by local stakeholders, integrating fuel dynamics and associated uncertainties. The more intensive the management level (e.g., industrial FMA), the smaller the proportion of hazardous fuel models. The rate of spread, fireline intensity, and burned area of each individual wildfire were simulated using FARSITE [25]. Each wildfire was simulated using a 100-m resolution grid.
The simulations were useful to estimate wildfire hazard, but did not characterize the temporal dimension of wildfires, required to couple fire with StandsSIM.md (Section 2.4.3). To tackle this limitation, a simple model was developed on top of FUNC-SIM (hereafter FUNC-SIM+) to simulate the spatio-temporal distribution of wildfires in the study region. The model simulates the occurrence of very large wildfires (≥1000 ha) in a 40-year time period, considering N time trajectories (i.e., iterations). The simulation procedure is explained in 10 steps in Appendix A. FUNC-SIM+ calculations were made at a pixel level (grid resolution 100 m). The main output of the model was the distribution of the “time-since-last-fire”, i.e., wildfires burning the same pixel in different years in a given time trajectory. The results of all iterations were combined to create a PDF of “time-since-last-fire”. Values above 40 years (the maximum simulation period) were reclassified as “not burned” (NB).
For the calibration, FUNC-SIM+ was run for the historical period of 1975 to 2017 and its parameters (fp, m, and β, explained in detail in Appendix A) were adjusted using discrete values in fixed intervals, and the estimated and observed “time-since-last-fire” PDF were compared, the latter based on historic fire data [39]. A more sophisticated calibration procedure was not feasible due to computational constraints. The stochastic simulation set used for calibration corresponded to the BAU conditions. It was assumed that the model produced acceptable results if the estimated “time-since-last-fire” PDF and the “total burnt area extent” agreed with the observed historical data.
The calibrated FUNC-SIM+ model was run for all forest management scenarios for a 40-year period starting in the year 2017. The fuel models covering the landscape were considered to change for each scenario depending on the stand management improvement and the FBN implementation level (see [19] for more details). For example, increasing stand management intensity increases the frequency of understory shrub-clearing, decreasing the probability of occurrence of hazardous fuels. Thus, increasing the share of higher intensity FMAs in Alvares contributes to an overall decrease in wildfire hazard. In order to determine the impact of each forest management scenario on the “time-since-last-fire” PDF, the FUNC-SIM+ model was run, changing only the individual simulated burned area selected from the spatial simulation database (using the list of indexes previously saved). Each wildfire was simulated using the same ignition and weather conditions, changing only the fuel distribution across the landscape. The spatial distribution of non-industrial owners was unknown and therefore it was randomly distributed across the corresponding forest area [19].

2.4.2. Forest Growth Simulation and Economic Analysis

StandsSIM.md is organized in several modules. The “growth module”, which comprises the Globulus3.0 and the 3PGOut+ models, is the core module, but two other modules run in parallel with the previous: the “management module” that drives growth predictions through the application of the “forest prescription” and its corresponding “FMA variants”, and the “economic module” that calculates the costs of the silvicultural operations that characterize the “FMA variants” as well as the revenues from timber harvest. The latter is based on net present value (NPV) that was computed as the sum over the whole planning period of the present value of the difference between the revenues and costs in each year, as follows:
NPV = t = 1 T CF t 1 + i t C 0
where CFt is the cash flow (positive or negative balance of costs and revenues) incurred during the simulation year (t), T is the planning horizon, in the same units as t, i is the interest rate, and C0 is the initial investment. The calculation and interpretation of NPV can be found in forest economics manuals and textbooks (e.g., [40,41,42,43,44]).
Typically, NPV is used to determine which investments or projects should be funded. If NPV is positive, the investment might be acceptable, depending on the NPV of other alternative investments. However, when it is negative, it should probably be rejected, because the future cash flows will not cover the periodic costs [41]. Finally, if the NPV is zero, the investment can be considered neutral for the interest rate (i) applied.
Both harvested volume and NPV were used to compare the different management improvement scenarios.

2.4.3. Linking the Fire and Forest Growth Simulators

The integration of wildfire occurrence in the StandsSIM.md was achieved by building fire-sensitive prescriptions in which stands were harvested before their prescribed harvest age, whenever a wildfire occurred. The Monte Carlo Simulation method (described for instance in [45]) was used to randomly sample the occurrence of wildfire in time from the simulated “time-since-last-fire” PDFs for each one of the 12 forest management scenarios (Section 2.4.1). Wildfires were integrated into the fire-sensitive “forest prescriptions” by anticipating the age of final harvest and therefore reducing the length of the cycle (Appendix A, Figure A1). Thus, a fire-sensitive “forest prescription” will have the same or higher number of cycles than an ordinary “forest prescription” (no fire included). The prescription generator requires several user-defined inputs to run, which include: the length of the simulation period, information about the “FMA variant” to apply in each cycle, and the number of prescriptions to be generated.
The harvested volume and NPV characterizing each “FMA variant” under the different scenarios were obtained by averaging the estimates for the 400 simulations.
Burnt wood resulting from wildfires is an important source of fiber for the pulp and paper industries. For this reason, StandsSIM.md considers an amount of salvaged wood determined based on stand age and mean annual volume increment. The reduction in stumpage prices for burnt wood was also considered, based on information obtained from stakeholders.

2.4.4. Running the “Fire-Sensitive” Forest Growth Simulations

The abovementioned meetings allowed characterizing the state of forests after the 2017 fire and detailing forest management operations and costs, to build the simulation inputs.
Stand inputs: Several assumptions were made based on the information provided:
(i)
All stands were pure even-aged;
(ii)
All stands were harvested after the fire;
(iii)
Some stands were replanted, while other entered coppice rotation;
(iv)
Stands of the different owner types/FMA were assigned different average site indices (S): SIndustrial = 19 m; SActive = 17 m, SSemi-active = 15 m and SQuasi-absent = 9 m).
When empirical growth models are used, site index is an essential input to simulate a new plantation. Site index (S) is defined as the average height of the 100 thickest trees per hectare at a species-specific standard age (10 years for eucalypt). The higher the S, the more productive the site. Thus, a participatory approach was used for assigning an average S value to each owner type/FMA.
Based on this information, 8 stands, 2 by each owner type (a plantation and a coppice at age zero), were simulated according to the “FMA variants” and “forest prescriptions” (see Figure A2Appendix A).
FMA inputs: During the meetings with stakeholders, the set of silvicultural operations characterizing the different management intensity levels and the different site conditions present in Alvares were prepared (see Figure A2Appendix A). Each “FMA variant” corresponded to an input file.
Prescription inputs: The fire-sensitive “forest prescription” for the different scenarios and “FMA variants” were saved in individual input files.
For the “no fire occurrence” scenario, a total of 26 prescriptions were prepared. Two of these to be applied to the “FMA variants” characterizing quasi-absent owners, one for the stands in the first rotation (plantation, P) and the second for stands in the second rotation (first coppice, C1). Both considered the “FMA variant” that assumes no terracing or insecticide spraying. The remaining prescriptions (24) were applied to the first and second rotation stands of Industrial, Active and Semi-active owners, assuming each will be managed under the four “FMA variants”. For the “fire occurrence” scenarios, instead of one prescription by “FMA variant”, a total of 400 fire-sensitive prescriptions were generated (see Figure A2Appendix A).
Operation costs inputs: The costs for the silvicultural operations practiced for non-industrial private owners were obtained from the available official statistics [46,47]. The costs of operations for the industrial owner type, as well as all stumpage prices considered, were provided by stakeholders. The pulp and paper companies have their own tables of costs, because the size of the areas they manage allows economies of scale. Stumpage prices for industrial and active owners, the ones producing certified wood, were assumed to be 29 €m−3, whereas for semi-active and quasi-absent owners’ lower prices were considered, respectively, as 21 and 17 €m−3. The reduced costs scenarios, which tried to reflect the impact of a potential joint management and consequent establishment of economies of scale, used the average of costs practiced for industrial and non-industrial owners. An interest rate of 4% was considered for the economic analysis.
The simulations of the 10,400 prescriptions for each scenario were carried out for a period of 40 years. Volume-harvested (m3ha−1) overbark and NPV (€ha−1) estimates for each set of 400 prescriptions were averaged and scaled up to the parish level using the areas described in Table A1Appendix A.

3. Results

3.1. Fire Simulation

3.1.1. Calibration

The model parameters that better reproduced the historical distribution of “time-since-last-fire” were fp = 0.90, β = 10, m = 0.01, yielding a r2 = 0.63 (Figure 3) which was considered a reasonable agreement. The model reproduced well the main peak between 12 and 18 years, and slightly over- and underestimated up to 12 and greater than 18 years, respectively. The estimated total burned area extent was 18,401 ha (Table 3), and was very similar to the 17,946 ha that actually burned over the last 40 years because of very large wildfires (>1000 ha).

3.1.2. Estimated “Time-Since-Last-Fire” Distributions for the Different Scenarios

Changes in the landscape had impacts on the estimated “time-since-last-fire” PDF, generally increasing the frequency of higher intervals and decreasing the frequency of lower intervals (Figure 4). The effect was particularly pronounced on the percentage of area that did not burn during the 40-years period. Burned area extent decreased to 14,786 ha for the scenario combining the high management intensity level with the no-FBN implementation, and to 13,369 ha for the scenario combining the high management intensity level with the full priority FBN implementation scenario (FBN3/3). These values corresponded to average annual decreases of 90.4 and 125.8 ha burned, respectively.

3.2. Forest Growth Simulation

Several factors affect forest income at parish level. The simultaneous decrease in exposure to wildfire, which results in higher availability of timber, decrease in productive forest area due to implementation of the FBN, and the reallocation of areas between non-industrial forest owners, introduce complexity in the interpretation of results. In order to isolate the impact of fire occurrence and costs, different sets of scenarios were compared.

3.2.1. The Impact of Wildfire Occurrence

The simulation runs performed for the BAU scenario with and without fire occurrence were compared (FBN0/3_MCur_F0_C0 vs. FBN0/3_MCur_F1_C0) (Table 4). Results showed that wildfires in Alvares are responsible for negative-to-neutral investments and harvested volume reductions of 266 × 103m3 if current management is maintained and no FBN is implemented. On the other hand, investments can become profitable and losses in harvested volume less pronounced if stand-level management is combined with the full implementation of the FBN (FBN3/3_MHgh_F1_C0).
At the parish level, very large wildfires result in NPV losses of about 70% (from 4481 × 103€ to −28 × 103€), while for harvested volume, losses are less expressive (about 20%).
A more detailed analysis highlighted the differences among owner types. Figure 5 shows the relation between losses in volume harvested and NPV due to fire for the BAU (FBN0/3_MCur_F1_C0) and the most intensive management scenario (FBN3/3_MHgh_F1_C0), using the no-fire hypothetical scenario as benchmark.
Wildfire-related losses are more evident for NPV than for volume harvested, which has identical amounts for all owner types. The more an owner type invests in their forest, the more they have to lose when wildfire occurs and NPV losses are closely related to the investment made in management. Thus, wildfire induces greater losses on active and industrial owners, who practice intensive management. Associated silvicultural operations costs escalate, mostly due to site establishment operations that are particularly expensive for non-industrial private owners, and are more often because of wildfire occurrence. Industrial owners have the largest losses in NPV (−1804 × 103€) and harvested volume (−92 × 103m3), followed by active owners with −1288 × 103€ and −60 × 103m3, respectively. However, active owners evidence the greatest losses on a per hectare basis.
Nevertheless, results also indicate that the negative impacts of wildfire can be minimized if the FBN network is fully implemented and stand-level management is improved (FBN3/3_MHgh_F1_C0). In fact, smaller losses in volume harvested per hectare can be expected for all owner types, while the volume harvested for active and semi-active owners even surpasses the amounts harvested under the hypothetical no-fire scenario, also as a result of the shift in areas from quasi-absent owners to both these types (Table 4).

3.2.2. Isolating the Impact of Improved Management

In the first stage, to evaluate the impact of the different management levels, the three scenarios with no-FBN implementation were compared (FBN0/3_MCur_F1_C0, FBN0/3_MMod_F1_C0, FBN0/3_MHgh_F1_C0). Table 5 shows that as management was improved, NPV at parish level went from negative (−28 × 103€) to positive (614 × 103€). The same trend was observed for NPV per hectare. Industrial owners were responsible for the biggest contribution to forest income in the parish. NPV per hectare showed a consistent increasing trend for all owner types as stand-level management was improved, despite the negative values evidenced by non-industrial owners. Overall, the improvement in management was more pronounced from current to moderate management than from moderate to high. Active owners had the largest increase (180 €ha−1 from current to moderate and 19 €ha−1 from moderate to high).
The analysis by owner type showed a slight increase in volume harvested per hectare as management was improved. However, when scaled up to the parish level the impact of improving management upon total volume harvested became evident, showing an increasing trend for active and semi-active owners. In particular, active owners increased harvested volume from 300 to ca. 450 × 103m3 (moderate) and to ca. 570 × 103m3 (high). Conversely, quasi-absent owners contributed progressively less to total harvested volume in the parish as management was improved.
Assuming no-FBN implementation, improving management from current to moderate had a greater impact than from moderate to high for all owner types and indicators considered in the analysis, with the exception of total NPV. Moderate management resulted in the highest total NPV for active owners, while for semi-active owners improving management seemed to reduce total NPV (despite NPV per hectare always improving with management).
In a second stage, to better assess the individual impact of improving stand-level management, the scenarios for the three priority levels of FBN implementation (FBN0/3) were averaged and compared against the no-FBN scenario (Figure 6). At parish level, as the management level increased, a similar positive trend was found for both the average FBN and the no-FBN implementation, although the averages evidenced higher absolute values for aggregated NPV and lower absolute values for aggregated harvested volume than the values of no FBN. These figures highlight the gain in income for the parish resulting from stand-level management improvement and FBN implementation, despite the decrease in volume harvested (comparison between benchmark and corresponding average scenarios). Only industrial owners seemed to decrease their NPV with the FBN implementation (average of FBN1/3, FBN2/3, and FBN1/3), in particular for moderate- and high-management scenarios.
Nevertheless, improving stand-level management, regardless of whether the FBN is implemented, is not sufficient to generate a positive NPV for the non-industrial owners, who always face cash flow problems (NPV < 0). However, the impact appears to be mitigated if the FBN is implemented.

3.2.3. Isolating the Impact of FBN Implementation

The analysis in the previous section already indicated the combined benefit of implementing the FBN along with increasing stand-level management. In this section, to isolate the impact of the FBN implementation, the scenarios assuming current management were combined with the progressive implementation of the four FBN priority levels (Table 6). With increasing levels of FBN implementation, aggregated volume harvested decreased due to reductions in the forest production area. However, increasing FBN implementation increased harvest volume per hectare (242 × 103m3 to 251 × 103m3) as well as NPV per hectare (−6 × 10³€ to 153 × 103€).
Under the current management level, implementing the first priority FBN produced the highest NPV (1966 × 103€) for industrial owners, whereas for active and semi-active owners, the implementation of the increasing FBN levels resulted in a progressive increase in total NPV. For both owner types, the implementation of the first priority level of the FBN results in the greatest increments in aggregated NPV (139 × 103m3 and 99 × 103m3, respectively), while the implementation of the second priority level produces a much milder impact (31 × 103m3 and 33 × 103m3, respectively). If only the first priority FBN was implemented and stand-management was held at its current level, a similar increasing trend was found for NPV per hectare, for all owner types. As the different priority levels of FBN were implemented, light increases in harvested volume per ha were observed for all owner types. The opposite was observed for total volume harvested for which the full FBN implementation results in the biggest losses: 27 × 103€, 14 × 103€, 8 × 10³€, and 5 × 10³m3 for industrial, active, semi-active, and quasi-absent owners, respectively.
On the one hand, implementing the full priority FBN resulted in an average decrease in harvested volume at the parish level of 151 × 103m3, at the expense of a reduction in planted forest area. However, volume harvested per hectare showed the opposite trend with the full FBN implementation allowing increases (no FBN as benchmark) of 10 × 103€, 10 × 103€, and 18 × 103€ for the current, moderate, and high stand-level management improvement scenarios, respectively. On the other hand, the full FBN implementation also yielded an increase in NPV, with substantial positive NPVs of industrial owners contrasting with negative NPVs of non-industrial owners (see Table A2 and Table A3Appendix B).
The impact of implementing the different priority FBN levels, using the no-FBN situation as benchmark and the marginal impact of implementing the FBN showed additional differences (Figure 7). Under current management, the gains increased with the FBN implementation. However, for moderate management, implementing the second priority level resulted in an almost null gain (108 and 107 €ha−1 for FBN2/3 and FBN0/3, respectively), but when scaled up to the parish a more substantial difference is found 45 × 103€. If high management was considered, the difference between the benchmark (FBN0/3) and implementing the second priority level of the FBN (FBN2/3) was slightly bigger (161 and 132 €ha−1, respectively), but still highlighted the bigger gain in implementing only the first priority FBN (Figure 7).
Of all owner types, active owners showed the biggest increments in NPV for any level of FBN implementation in comparison with no FBN. Quasi-absent owners benefit from indirect wildfire hazard reduction in the parish and end up improving their NPV, although their forest area, and consequently volume harvested, decreased with FBN implementation. The same applies when analyzing the results scaled up to the parish level (414 × 103€ and 476 × 103€, respectively).

3.2.4. The Impact of Reducing Silvicultural Operation Costs

If the CAOF costs associated with non-industrial owners were assumed, the average NPV at parish level was 572 103€. Assuming reduced costs, the NPV increased to 2320 103€, roughly four times more than the current setting (Figure 8). Active and semi-active owners had average increases of around 1200 × 103€ and 400 × 103€, respectively. Reducing costs allowed active owners to obtain positive NPV for all management and FBN levels; however, semi-active owners were still unable to have positive NPV. Increasing FBN priority levels led to the same trend in NPV values as previously observed, with the implementation of the second priority level evidencing lower marginal gains. The aggregated and per hectare net present values (NPV) for Active owners and Semi-active owners, as well as for the parish, obtained under CAOF and Reduced costs can be found in Table A4 (Appendix B) for all the fire scenarios.

4. Discussion

Local biophysical and structural features such as steep slopes and small-scale ownership constrain silvicultural operations and increase their costs, leading to low levels of forest income and management. For example, only 29% of the forest owners admitted having carried out fuel reduction operations in all their parcels during the past decade [36]. In Alvares, change towards flammability reduction, fuel discontinuity, and profitability improvements is urgent, but it is also challenging, because the decline of the number of inhabitants by 15.9% during the last decade [48] has led to generalized land abandonment, which is reflected in a currently high share of quasi-absent owners.
Over the 40-year simulation period, wildfires led to substantial losses in forest income, in particular among industrial and active owners (over 1287 × 103€).
Given the many assumptions made and the several sources of uncertainty in the data input and model estimations, the results should be discussed with an open mind. Some aspects regarding the forest growth simulations that support the economic analysis and the data available for the study require detailed discussion.
The parish had no prior forest inventory and, by the time the study was initiated, a considerable number of burnt stands had already been harvested. Several simplifications and assumptions have been made to deal with the lack of data, including forest inventory, to characterize the individual stands in the parish. The survey results presented in a companion article in this issue [36] indicate that close to 90% of the respondents stated to have been hit by the 2017 wildfire. Meanwhile, many of them would have harvested or reforested their parcels and, thus, it was assumed that all stands had been harvested after 2017 wildfire, which led to the simulation of new plantations or coppices. Notwithstanding, in other situations low severity fires or prescribed burns occurring in relatively mature stands might have positive effects in reducing fuel loads instead of resulting in the death of all the trees in the stands [49]. The lack of data to run simulations for each individual stand in the parish determined the choice for Globulus 3.0 [50]. This empirical growth model was used to estimate harvested wood for the average stands of each owner type, by assigning them a single site index (S) value that reflects the average management intensity (number and timing of the operations, Figure 1). If data had not been a limitation, the 3PG+ growth model, also implemented in StandsSIM.md, could have been chosen instead. Based on eco-physiological processes, the 3PG+ model would have allowed growth predictions to reflect the impact of silvicultural operations that directly interfere with growth, such as fuel control and fertilization, which varied across owner types. Thus, the impact of different management intensities across owner types was only reflected in costs. However, the close collaboration with stakeholders allowed to define penalties that reflect the amounts of industrial salvage wood that is used, which if left unaccounted for, would have led to overestimating harvested volumes.
In the economic analysis, additional simplifications were made. First, the small share of private owners that admitted to carrying out management interventions based on family work alone (26%, [36]) allowed opportunity costs (used family labor and capital) to be ignored and only direct costs without significant bias to be considered. Transaction costs (time to negotiate and supervise contracted services) were also ignored for being difficult to quantify with the existing data. Second, although the CAOF national tables provide higher cost figures for silvicultural operations carried out in hilly and steep areas, it was decided to base the economic analysis on CAOF average costs, because the assignment of different slope conditions to owner types was not possible with the available data. Third, while planted forests also contribute to biodiversity conservation, climate change mitigation, and water provision, only wood production for pulp was considered in the analysis. It is true that environmental benefits are perceived by European citizens, who largely live in (peri)urban areas, as the most important services of forests [51]. Notwithstanding, the valuation of and payment for ecosystem services are still complex processes, often being left unaccounted for, both in research and in practice. Overcoming this limitation could contribute to balance the clash-flow by offsetting the direct costs of forest operations that support those environmental services.
The economic analysis showed that, even in the improved management scenarios, investment should often be disregarded by non-industrial owners because the future cash flows are unable to cover periodic costs (NPV < 0). The impact of currently high operation costs is clearly seen when comparing “CAOF costs’” (C0) with “reduced costs’” (C1) scenarios. The worse NPV values of non-industrial owners when compared to industrial owners also highlight the weight of operational costs. Another aspect not tackled in this study relates to the low stumpage prices that, combined with high costs, lead to non-profitable investments. No scenarios were considered to assess the impact of increasing stumpage prices. Portuguese pulp and paper companies should consider the need to increase stumpage prices paid to forest owners with a good management, to help them covering their periodic costs.
The weight of operation costs is particularly clear when comparing industrial with active owner types, who have similar harvested volumes but different operation costs. On the other hand, the importance of stumpage prices is revealed by comparing active with semi-active owners, both under CAOF prices, but having different stumpage prices, because the latter do not produce certified wood. This contributes to their lower profitability level. Finally, the comparison between semi-active and quasi-absent owners suggests that the latter benefit from their very low level of management, which translates into lower direct costs, while the former are penalized for managing more intensively.
Despite the limitations that result from using a very simple fire model, the total simulated burned area and the distribution of the “number of years between fires” were similar to the historical data for the Alvares parish, which constitutes an element of validation. The latter metric would benefit from improvements in the fire model. For example, the occurrence of wildfire was limited to one event per year, while historical data shows that, in 40 years, ten years had between two and four very large wildfires in the same year. In addition, estimates would benefit from exploring other mathematical forms for Equation (1) (Appendix A), which are expected to decrease the probability of selecting a wildfire with a low number of years since the last wildfire. This would likely reduce the overestimation of short fire intervals (Figure 5). Finally, results would also have benefited from a more extensive model calibration procedure, which would have required larger computation resources.
StandsSIM.md was adapted to account for the average amount of salvage wood for each owner type, estimated based on information provided by stakeholders and implemented through the S figure assigned to each type. These estimates require additional research to corroborate our figures on timber usage reduction. Moreover, the impact that fuel reduction treatments have on wildfire risk reduction is scarce in Europe and the existing studies have focused on other species rather than eucalypt [4]. Therefore, additional research is also needed to integrate shrub growth models, so that the impact of fuel treatments and interspecific competition can be taken into account. One key advantage will be coupling StandsSIM.md with an understory growth module, which, run using the 3PG+ as the selected growth model, will allow exploring ideal fuel treatment cycles that take into account the combined impact of silvicultural operations and climate change. Such improved simulations will widen the application of such an approach by enabling to prioritize fuel treatments in future scenarios when incomes will become negative and fire risks higher.
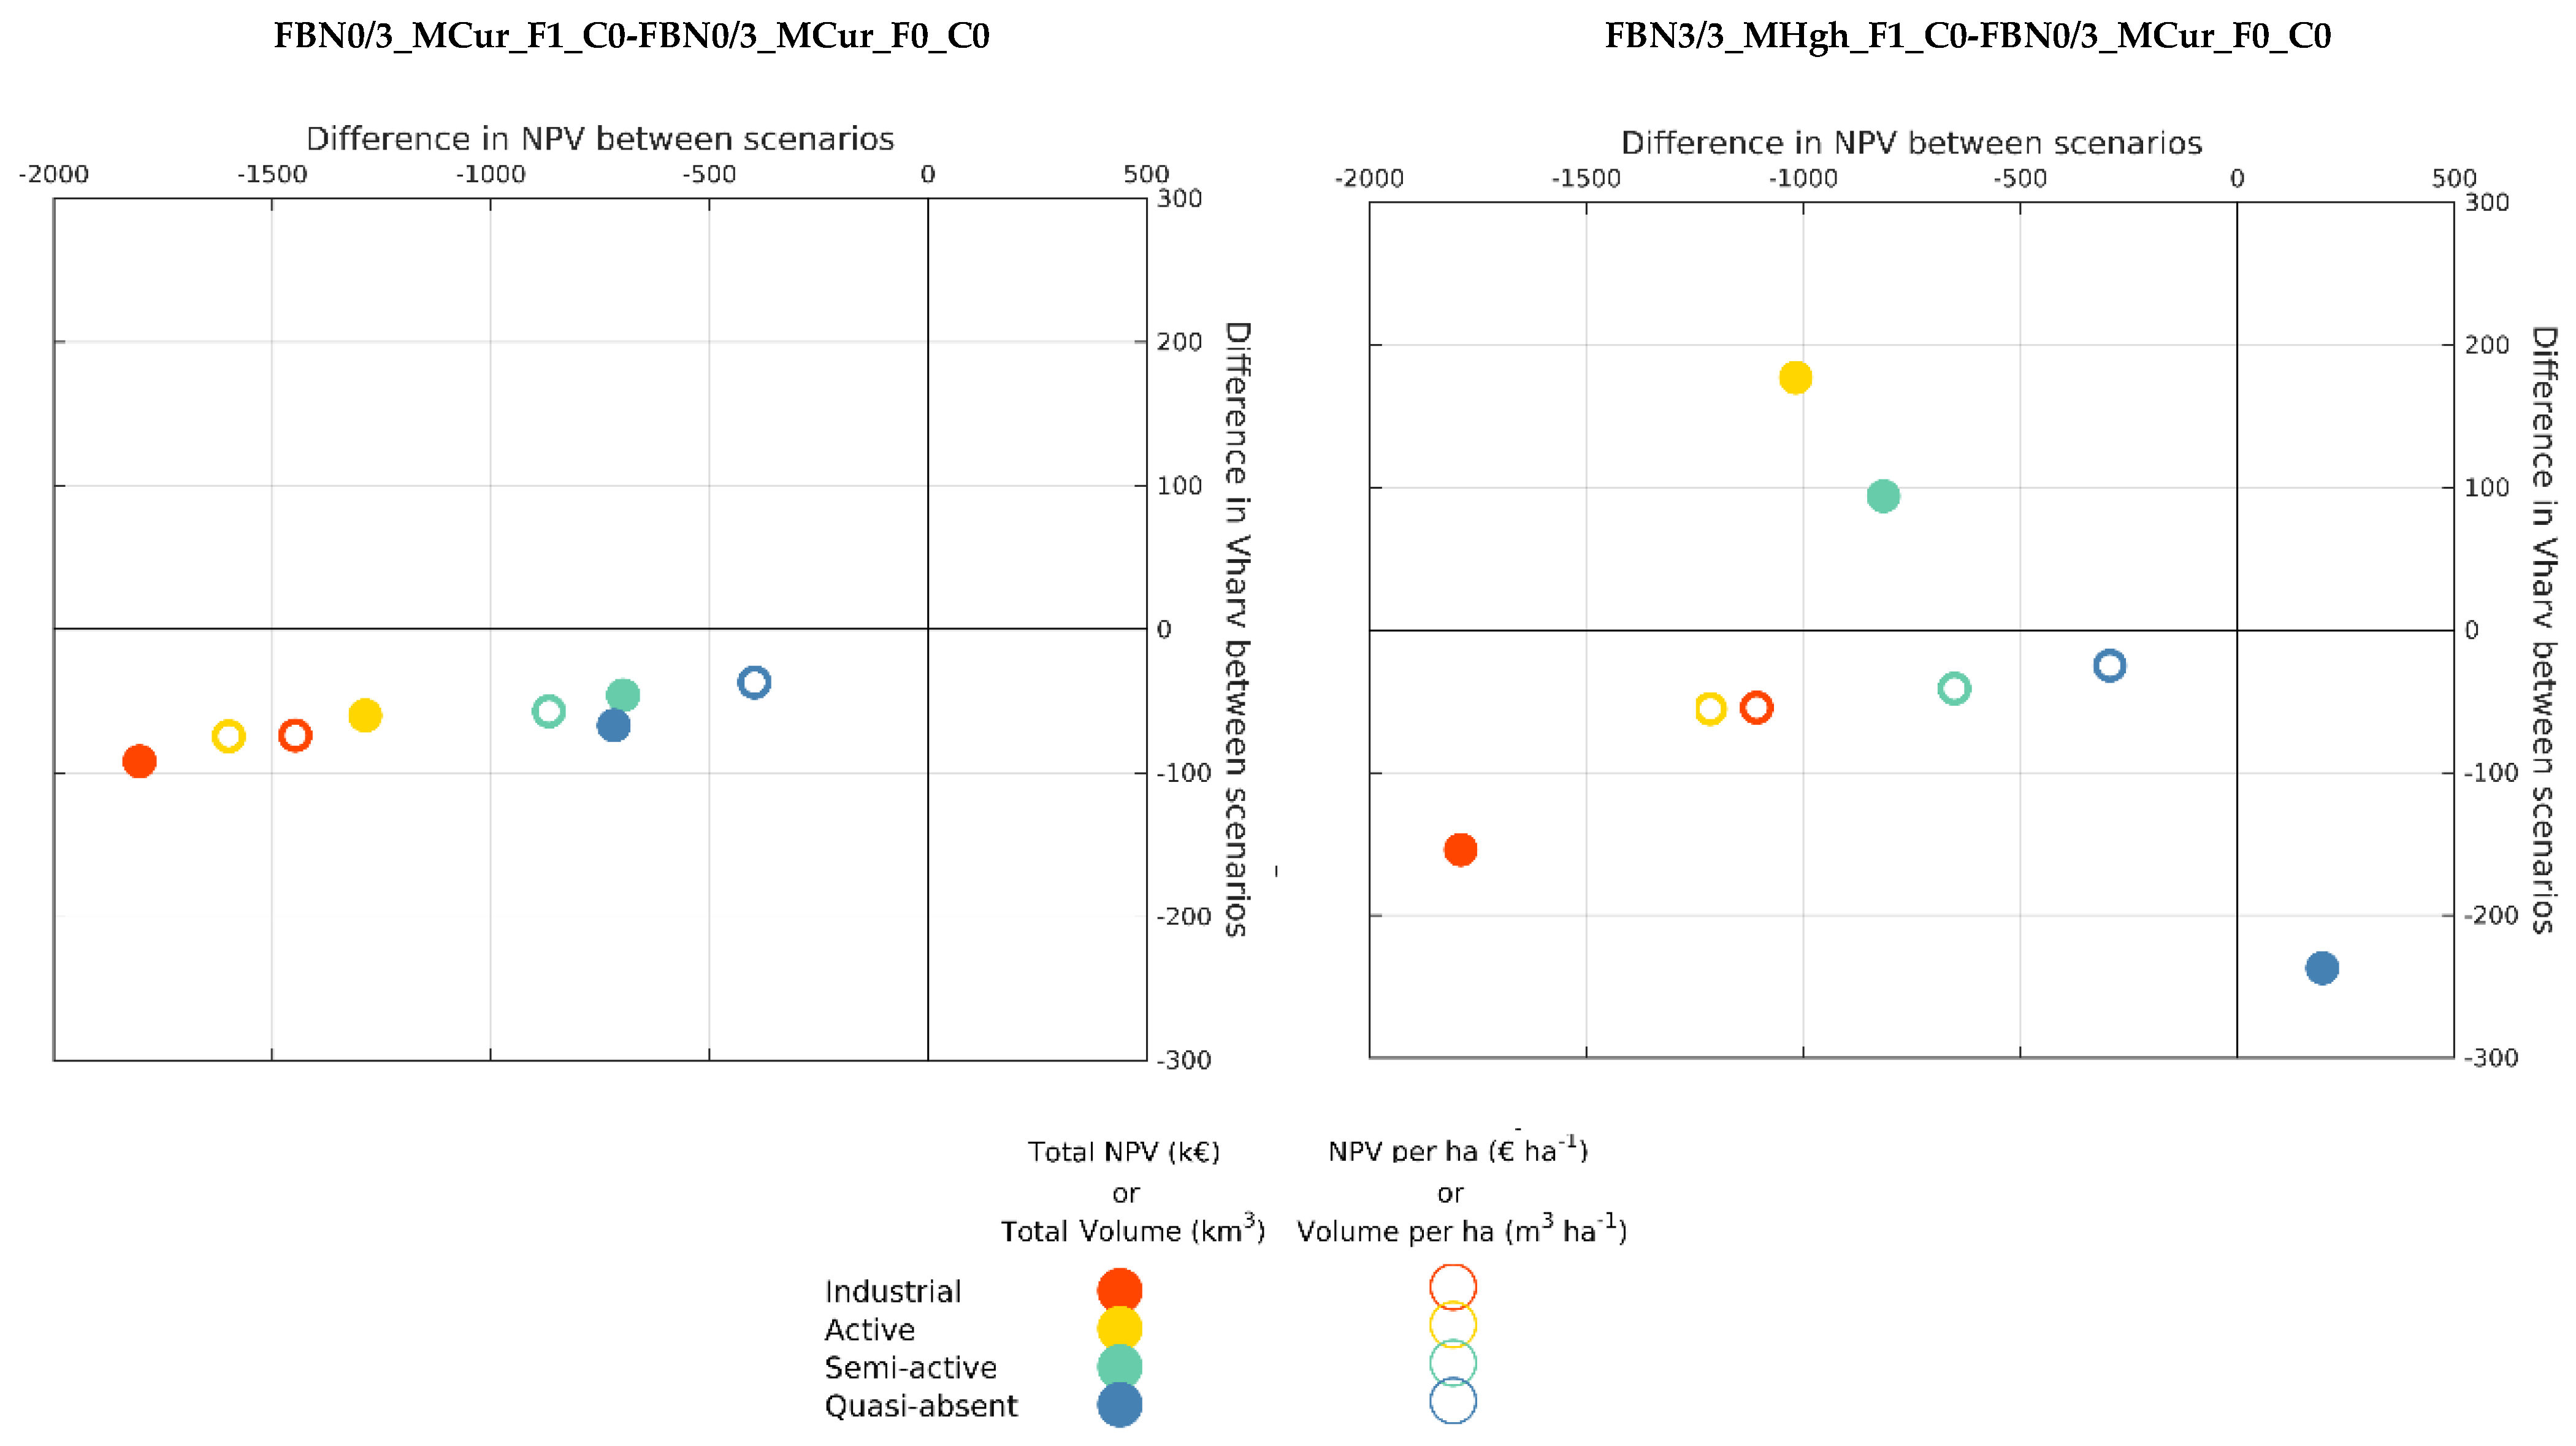
The definition of the management levels of improved management scenarios as shifts of areas among owner types might have had substantial impacts on results. For example, for non-industrial owners, the impact of area loss to the FBN is camouflaged by the impact of area shifts from quasi-absent to active and semi-active owners, which reflect management intensification. The slight increase in harvested volume per hectare under the second priority of FBN is not enough to fully compensate for the decrease in area, leading to a decrease in NPV and harvested volume when compared to the implementation of the first priority of FBN. Industrial owners lose 75, 139, and 218 ha of productive area as the FBN implementation moves from the first to the full priority, corresponding to losses of 6%, 11%, and 17% in productive areas. In fact, the interpretation of results at the overall parish level is less straightforward, because estimates are highly dependent on the areas assigned to each owner type under the different scenarios (Table 2). For industrial and active owners, the highest NPV was reached in scenarios that assign them the most intensive management (MHgh) combined with the largest forest areas (2129 × 103m3 and −91 × 103m3 for FBN0/3_MHgh_F1_C0 and FBN3/3_MHgh_F1_C0, respectively). For semi-active and quasi-absent owners, the scenarios yielding the highest NPV are those with the full FBN implementation combined with the smallest areas (FBN3/3_MCur_F1_C0 and FBN 3/3_MHgh_F1_C0, respectively). For the parish as a whole, the most favorable situation is the scenario combining the most intensive management with the full FBN, although this is the one with the smallest forest area: FBN 3/3_MHgh_F1_C0. Our results indicate a reduction in total burned area for the 40-year period as management is improved when compared to BAU (Table 3). The low effectiveness in reducing burnt area in another fuel treatment study was ascribed to the restrictions to mechanized fuel reduction operations in State forests, which represent 60% of the forest [52]. Considering these restrictions comparable to the lack of fuel reduction operations characterizing Quasi-absent owners, the significant marginal gain in burnt area reduction observed for FBN0/0_MHgh is justified by the increase of the level of fuel treatment at the parish level that is achieved by reducing the area of quasi-absent owners from 34.5% (MCur~BAU) to 8.5% (MHgh).
Climate change (long-lasting severe droughts and high temperatures) is aggravating the combination of factors favorable to the occurrence of severe wildfires. Although it is not easy to prevent them, it is possible to mitigate their impacts. Many defend to shift the focus from fire suppression to preventive and mitigating actions [3,36]. Within the scope of the “National Forest Defense System against Fires” and after the 2017 wildfires, the Law Decree 10/2018 [53] brought important changes to the original Law Decree on fuel management (Law Decree 124/2006, of June 28). With the new law, the implementation of fuel control measures that include cleaning shrubs higher than 50 cm and ensuring a minimum canopy distance of 10 m, as well as 50-m-wide buffers around settlements, which might require thinning operations, became mandatory for forest owners. The short deadlines and the lack of skilled personal and machines for these jobs led to rampant costs of operations and left forest owners struggling with their already poor incomes. The results of this research suggest that eucalypt plantations are only profitable for industrial owners, which leads to almost no investment (−28 × 103€) at the parish level. Thus, policies to promote fire hazard reduction through forest management are urgently needed. The results of these simulations might help outlining context-specific policies to address stand-level management (including fuel reduction operations) and the implementation of FBN, in particular if the latter becomes compulsory.
Management improvement only focused on increasing stand-level forest management (Table 5) seems to work better. Higher NPV and harvested volumes would be obtained if stand-level forest management was preferred over the FBN implementation (NPV increased from −28 × 103m3 (BAU) to 614 × 103€ and harvested volume from 1127 × 103m3 to 1423 × 103m3).
These results have also highlighted the differences between industrial and non-industrial owners with the latter struggling to obtain an income from their forest. The scarce number of existing economic studies for eucalypt in Portugal ignore the impact of fire occurrence, and only consider growth rates and stumpage prices as the main factors affecting investment returns [14,54]. In fact, the lower growth rates of semi-active owners’, which generate lower harvested volumes, combined with non-certified management, which leads to lower stumpage prices, do not allow their revenues to offset direct costs. In comparison, active owners secure the highest forest income among all non-industrial owners. According to Santos et al. [36], different owner types in Alvares have different rationalities and thus different responses to policy. Active owners used to carry out silvicultural operations, have higher opportunity costs for setting aside forest area to implement the FBN, but require lower policy payments for active management. On the other hand, quasi-absent owners, with much lower expectations concerning forest income, have lower opportunity costs for giving up area or delivering management to a third party, but require higher payments to carry out silvicultural operations. Therefore, policies addressing stand-level management improvement should consider the prevailing owner types because their management intensity determines their willingness to accept one or the other type of policy payment [36]. Furthermore, the approach proposed in this study can be further developed if the knowledge concerning the spatial distribution of owner types and their corresponding fuel models is improved. This information would allow quantifying the impact of fuel treatment in areas managed under different intensities and improve the understanding of fire behavior in order to spatially target fuel control operations and avoid the development of counterproductive policies.
By choosing to implement the full priority FBN while keeping stand management at the Current level (Table 6), the improvement in NPV would be similar to that found for FBN0/3_MHgh (increasing from −28 × 103m3 (BAU) to 603 × 103€). However, the impact on harvested volume would be negative (1127 × 103m3 to 989 × 103m3) as a consequence of area reduction. Moreover, results showed that implementing the second priority level represents a small gain in NPV when compared to implementing the first priority level (328 × 103€ and 371 × 103€, respectively), but small losses in harvested volume (1089 × 103m3 and 1043 × 103€, respectively) as well as an increase in burnt area (ca. 400 ha).
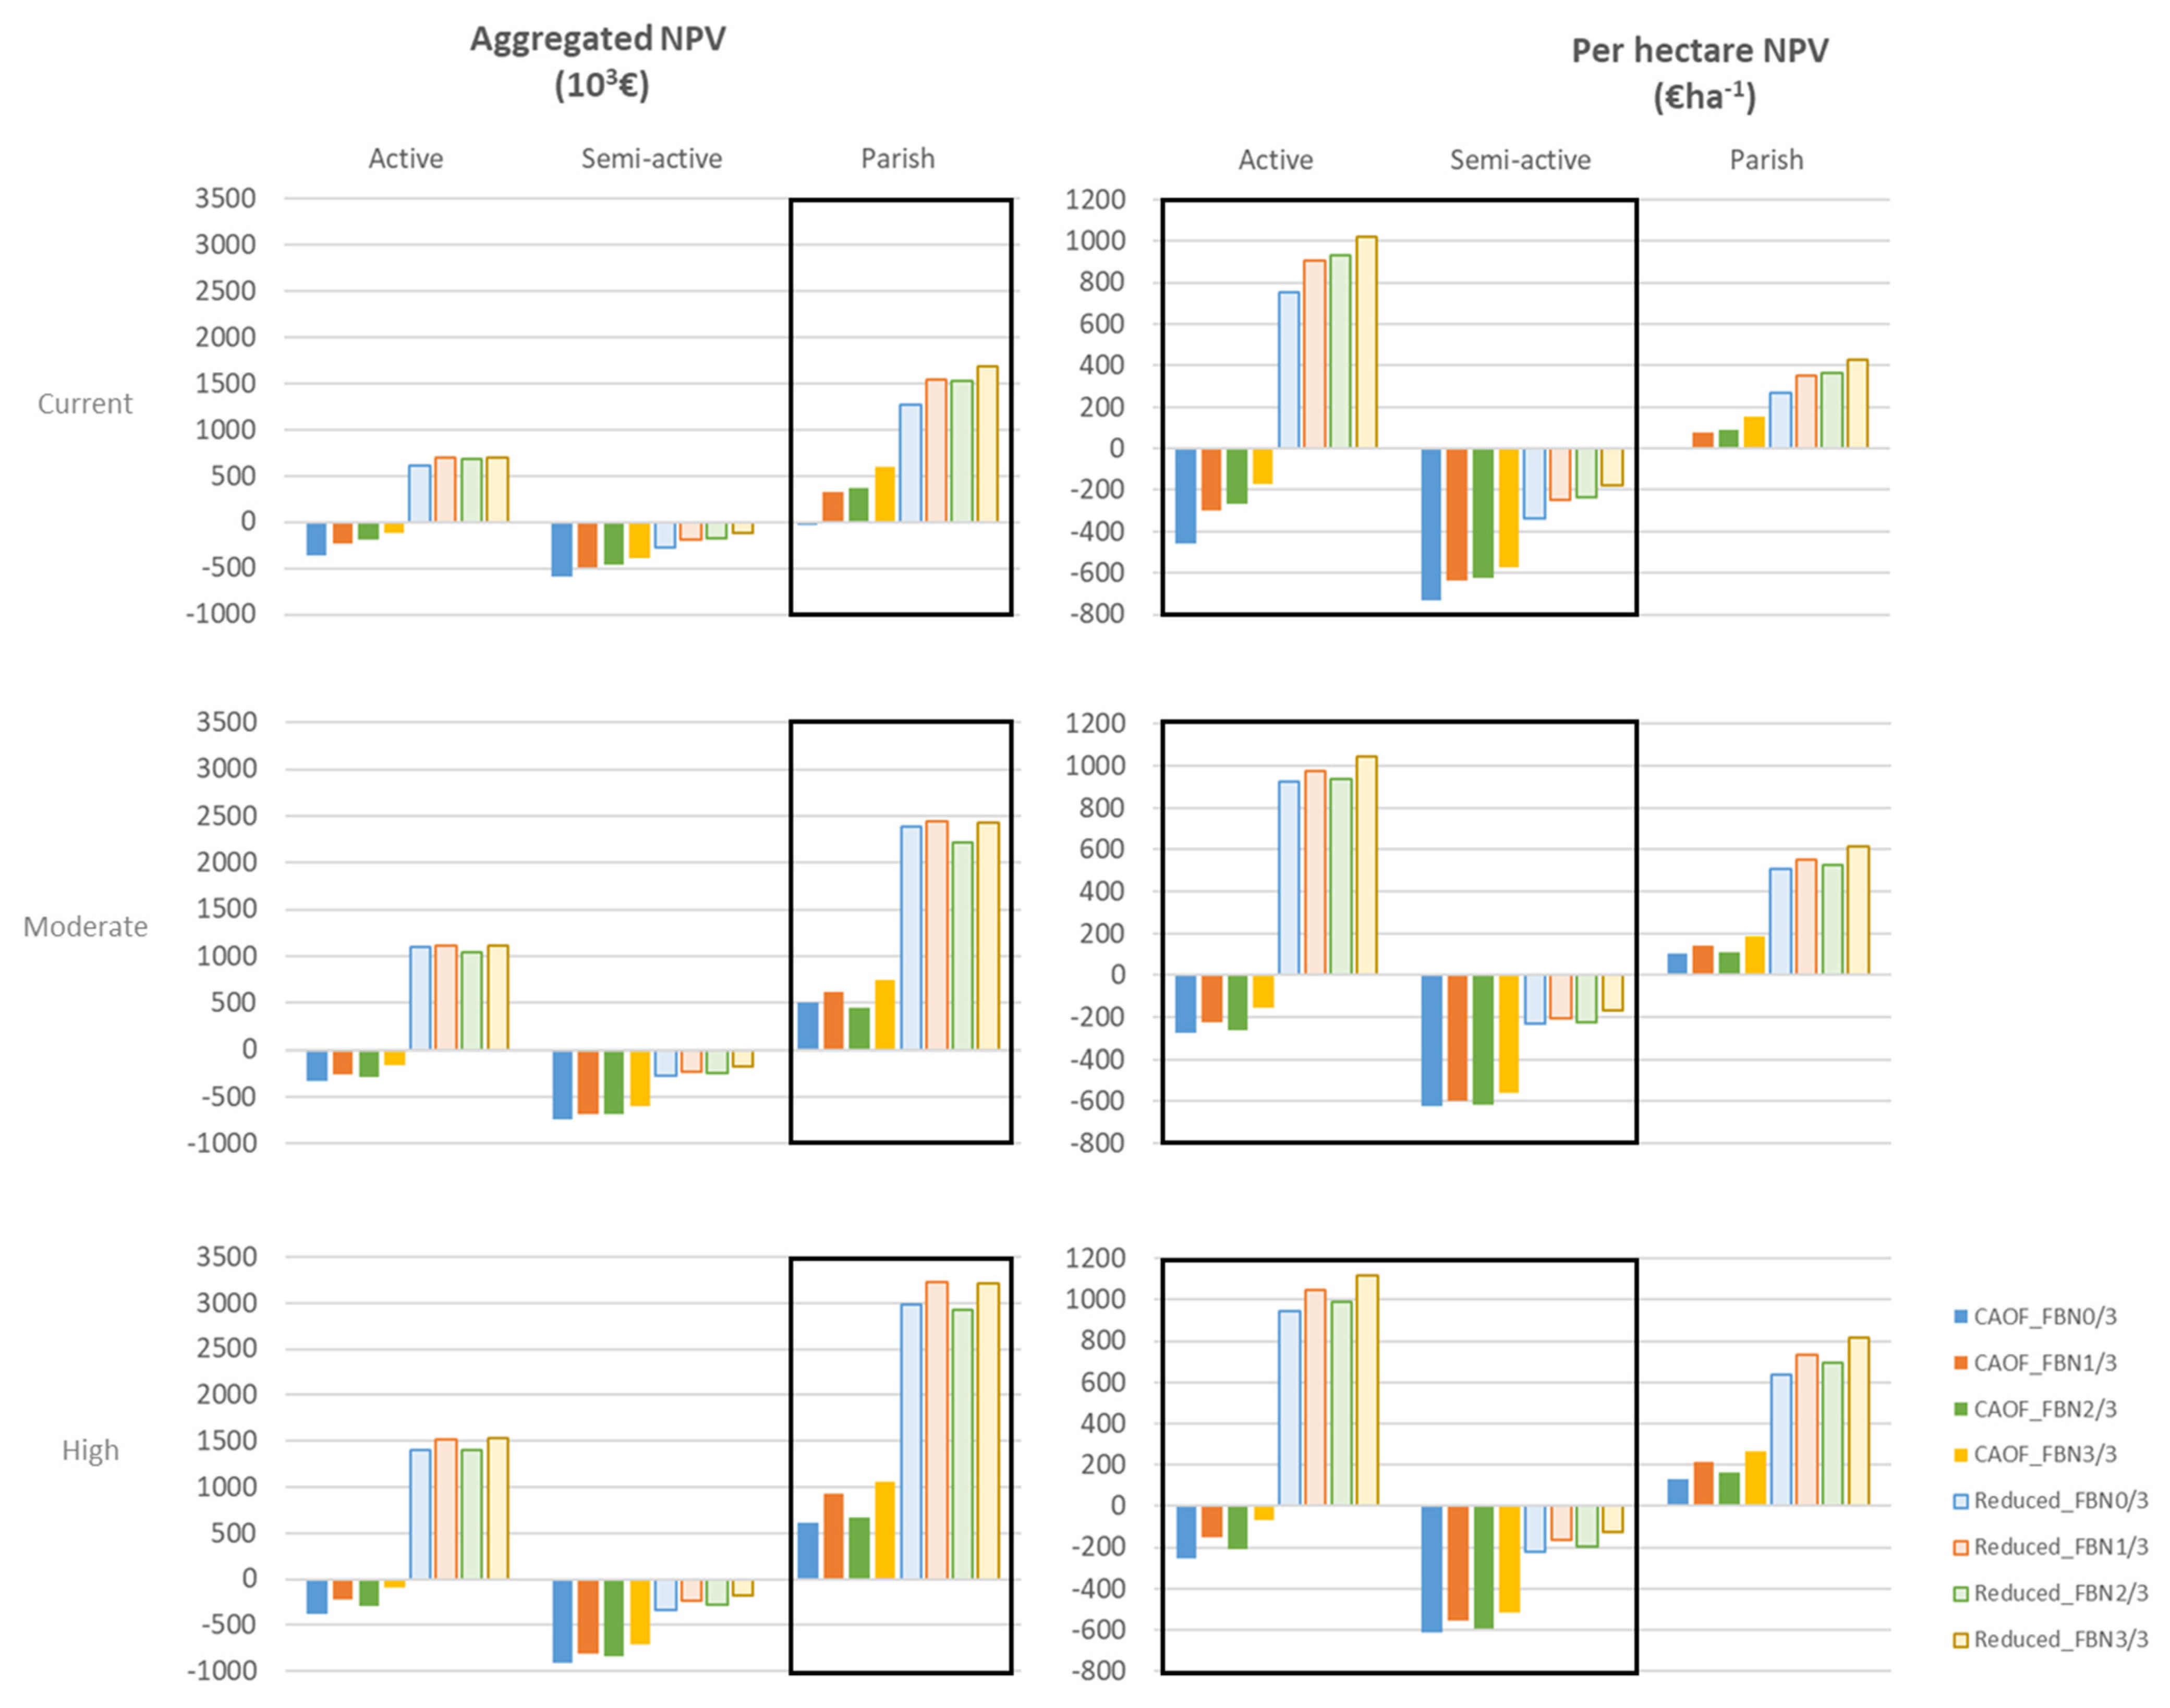
In general, improving stand-level management and implementing the FBN clearly improved eucalypt profitability in the parish, with the scenario reflecting the highest management improvement (high management and full FBN implementation—FBN3/3_MHgh) resulting in the highest aggregated NPV for the parish (Table A3Appendix B). These results are in line with those of similar research where increased revenues from wood sells were obtained as a consequence of burnt rate reduction achieved as fuel management was increased [32]. On the other hand, aggregated harvested volume decreases with planted forest area set aside for FBN implementation; this is not necessarily negative for owners, since both per ha harvested volume and NPV increase (see Table A2 and Table A3Appendix B). Even industrial and quasi-absent owner types, who lose forest area for the implementation of the FBN and as a result of area shifts to more active owner types (only the latter) end up benefiting from spillover effects (unmanaged areas benefiting from the intensive management practiced in neighboring areas). The second best scenario is the one combining high management with the implementation of the first priority FBN (FBN1/3_MHgh). Because improvements are not proportional to the amount of FBN implemented, assessing the impacts of implementing the different levels requires deeper research. The current study highlights the need to develop support and regulative mechanisms that somehow control, compensate and subsidize the extremely high costs of silvicultural operations not compensated by the present stumpage prices in order to increase forest income. However, a marginal cost–benefit analysis to determine whether the full implementation of the FBN is worth should be carried out to inform the definition of an efficient FBN compensation policy. This could be possible combining this approach with others based on multi-criteria decision methods, such as the Pareto frontier, which will allow determining when gains resulting from improved management will outweigh fuel management cost. This information will be extremely useful in the design of fire-sensitive management prescriptions that can be integrated in practical forest management planning at the landscape level [29]. Small-sized fragmented ownership structure has been pointed out as the most critical barrier for investments [54]. This study’s results have shown that operation costs are a fundamental pillar of profitable management. Reducing unitary costs at the parish level implies being able to establish scale economies that can only be achieved through the implementation of alternative management programs. An innovative approach to mitigate the impact of small-sized fragmented forest ownership is being coordinated by a forest owners’ association (FOA), the “Associação Florestal do Baixo Vouga”, not far from Alvares. The forest area aggregation program promotes the grouping of contiguous areas under a common management plan. The FOA is responsible for providing all technical support, from plantation to wood selling, with the aim of facilitating management operations and reaching economies of scale. The program relies on quota-based investments and revenues that are distributed among members. At the same time, the program increases wood availability and forest income mitigates the impact of wildfire and pest while promoting the engagement, motivation, and appreciation of all the agents involved.
The effort to implement this type of initiatives, if combined with the development of informed policies to support forest management, focused exclusively on fuel reduction operation or with a more extensive focus, would allow planted forests to become a source of income, instead of a heritage, with all the resulting benefits to ecosystem services and society in general.

5. Conclusions

The simple approach used in this study addressed a major research gap: The absence of knowledge about to what extent improving forest management affects forest income and timber availability in a fire-prone landscape. There are several factors affecting forest income and volume harvested at the parish level. Results have shown that improving management can positively affect forest income in the parish and increase stand-level productivity.
Simulation results at the parish level underlined the impact of wildfires on NPV (70% loss), while the impact is much lower on aggregated harvested volume (BAU hypothetical scenario assuming no fire occurrence versus BAU scenario). The simulations for the improved management scenarios showed that combining the highest level of stand management with the full FBN implementation produced the biggest gains in forest income at parish level (1128 × 103€), although aggregated harvest volumes decrease as the FBN is implemented. However, the overall improvement in forest income conceals differences among forest owner types, as industrial and non-industrial owners show contrasting contributions. The burden of periodic costs, combined with low stumpage prices paid to non-industrial owners undermines the possibility of attractive incomes from the forest, which discourage investment in non-industrial forest and leads to further abandonment of land management and the consequent increase of wildfire hazard.
Several alternatives to balance the cash flow could be considered. The implementation of public funding mechanisms and forest policies to promote sustainable forest management, which comprise fuel-load control measures and compensation schemes for forest income losses resulting from fuel-break network implementation [36], could be part of the solution. Such measures could be complemented through the establishment of joint management programs capable of merging small-sized odd-shaped properties belonging to several owners scattered across the landscape under a single forest management unit grounded on quota-based investments and revenues.
Despite the limitations and uncertainties in this study, these results highlight the potential to improve forest condition, increasing stand productivity and reducing fire hazard, as well as adding economic value to rural areas where forest prevails. The authors acknowledge the downsides of an approach that is based on the simple development of a linking tool that couples a fire simulator to a forest simulator. Other tools, where fire and forest growth simulations are run in parallel, can produce more valid and precise quantifications of the impacts of management intensification allowing re-assessing risk along the simulation period and adjusting management accordingly. However, the upside of this simple approach lies in the possibility of performing economic analysis for different scenarios of management improvement, considering fire risk—a task that has never been tried before. This approach can be enhanced to improve the assessment of combined impacts of forest management, wildfire risk, and climate change to better assist forest management, guide decision-making processes, and the definition of context-specific, cost-effective forest policies. Moreover, future research may expand beyond the assessment of fire probability and area burned to focus on fire intensity, severity and effects, which will allow for a tighter coupling with forest and fuel management options.

Author Contributions

Conceptualization, S.B., A.B., J.C.P.R. and J.M.C.P.; methodology, S.B., A.B., J.M.C.P. and M.T.; software, S.B., A.B. and J.C.P.R.; formal analysis, S.B. and A.B.; investigation, S.B. and A.B.; writing—original draft preparation, S.B., A.B. and J.C.P.R.; writing—review & editing, S.B., A.B., J.M.C.P., M.T. and J.L.S.; funding acquisition, J.M.C.P. All authors have read and agreed to the published version of the manuscript.

Funding

This research was funded by the “Observador” newspaper and by ROSEWOOD4.0—Sustainable Wood for Europe (H2020 grant agreement No. 862681). FCT—Fundação para a Ciência e Tecnologia has also supported the research through J.C.P.R. Ph.D. fellowship (PDBD/113930/2015), S.B. framework contract nr 1382 (DL57/2016/CP1382/CT0026) and A.B. contract (CEECIND/03799/2018/CP1563/CT0003).

Institutional Review Board Statement

Not applicable.

Informed Consent Statement

Not applicable.

Data Availability Statement

Data used in this study can be requested to the corresponding author via email. However, some data might not be available due to confidentiality and privacy issues given the small size of the study area, and relatively small number of forest owners involved.

Acknowledgments

This research was supported by the Forest Research Centre, a research unit funded by Fundação para a Ciência e a Tecnologia I.P. (FCT), Portugal (UIDB/00239/2020), and by the Associated Laboratory TERRA (LA/P/0092/2020). The authors would like to thank Yannick Le Page, from the Agência para a Gestão Integrada de Fogos Rurais (AGIF) for providing support to the design of the fuel break network; Carla Duarte (Associação Florestal do Concelho de Góis), João Melo Bandeira (The Navigator Company), Henk Feith (ALTRI Florestal), João Baeta Henriques, António Arnaut, Carlos Pires and Manuel Barata (Núcleo Fundador da ZIF Ribeira Sinhel), for the support and detailed information on forest management practices in Alvares.

Conflicts of Interest

The authors declare no conflict of interest. The funders had no role in the design of the study; in data collection, analyses, or interpretation of results; in the writing of the manuscript, or in the decision to publish the results.

Appendix A

The appendix describes additional information regarding the methodologies used.
Landscape fire simulation over space and time details.
FUNC-SIM+ simulates fire occurrence in the landscape over space and time, with the following steps:
1. Each iteration (i) corresponds to a 40-year trajectory. For each iteration, the model was initialized with the “time-since-last-fire” map either set to zero (calibration) or derived from historic data of Portuguese wildfires from 1975 to 2017 [39] (future scenarios);
2. The number of years when a fire occurs in each 40-year trajectory were randomly sorted based on a probability value (fp). The higher the fp, the higher the number of years with fire occurrence. It was assumed that a maximum of one wildfire occurred in each year;
3. For each year (y) when a fire occurred (defined in step 2), a simulated burned area was selected from the spatial simulation database described in Benali et al. [19]. The selection is detailed in steps 4 to 7;
4. For each wildfire (w), the corresponding burned area was overlapped with the simulated “time-since-last-fire” map (updated up to year y, see step 9). This resulted in a distribution of “time-since-last-fire” associated with the burned area of wildfire w, hereafter defined has tw,y;
5. For each wildfire (w), a given percentile β of the tw,y values was calculated, hereafter defined as percentile(tw,y,β);
6. The probability of wildfire w, and its corresponding burned area, being assigned to year y (pw,y), was determined based on the following equation:
pw,y = m × percentile(tw,y,β)
where m is the slope parameter that determines the rate at which the “time-since-last-fire” increases the probability of wildfire w occurring in year y. For wildfires occurring less than 3 years after the last fire, pw,y was set to zero;
7. All available wildfires in the database have a pw,y value associated. The wildfire with the largest pw,y was selected to burn in year y and removed from the database for iteration i. When several wildfires had the maximum pw,y, the wildfire was randomly chosen;
8. When the wildfire was chosen, the “time-since-last-fire” map was set to zero in the corresponding burned area;
9. At the beginning of each year y, the “time-since-last-fire” map was updated adding the value 1;
10. The model was run for 100 iterations (N = 100) the value above which the output simulated PDFs stabilized.
The variable tw,y was calculated by FUNC-SIM+ at each time-step within each model iteration whereas pw,y depended exclusively on percentile(tw,y,β) and m. Therefore, fp, m and β were the only parameters available for tuning and calibrating the model.

Prescription Generation Details

The fire-sensitive prescription generation procedure was based on the following assumptions:
(i)
A wildfire occurring before the age of 4 years was assumed not to damage the stand, which will continue to grow until the prescribed harvest age is reached (presc 1 in Figure A1);
(ii)
A wildfire occurring at or before the age of prescribed harvest is assumed to produce salvaged wood (presc 2 and 3 in Figure A1);
(iii)
If no wildfire occurs during the simulation period, the stand is always harvested at the prescribed age (presc 4), Figure A1.
Figure A1. Examples of forest management prescriptions for a simulation period of 30 years, where the various prescriptions illustrate the following cases: no fire and a prescribed harvest age of 10 years (presc 0); a fire that does not damage the stand (presc 1); fire at a prescribed harvest age (% of salvage wood considered) (presc 2); fires in more than one cycle anticipating harvest age and forcing the simulation into the next cycle (% of salvage wood considered) (presc 3); and no fire occurring during the simulation period (presc 4).
Forests 12 01498 g0a1
Figure A2 synthetizes the fire-sensitive prescriptions generated to reflect the different stand types and “FMA variants”. Four “FMA variant” were considered for each owner type except Quasi-absent owners, for whom only “FMA variant” 2 was applied assuming that their limited management would keep them from establishing terraces and applying insecticide, even if recommended or needed.
Figure A2. Description of the FMAs and management prescriptions considered for the simulations with fire (having the randomness of fire occurrence illustrated in Figure A1 in each set of 400 prescriptions) and without fire.
Forests 12 01498 g0a2
Table A1. Description of the scenarios in terms of areas assigned by owner type/FMA and area allocated to the fuel break network.
Eucalypt Area by Owner Type and Area Allocated to the Fuel-Break Network (ha)
FireFBN PriorityManagement LevelOperations’ CostsAcronymIndustrialActiveSemi-ActiveQuasi-AbsentAbsentFBN
No (F0)No fuel-break (FBN 0/3)Current(MCur)CAOF (C0)FBN0/3_MCur_F0_C0124680580518116040
Yes (F1)No fuel-break (FBN 0/3)Current(MCur)~BAUCAOF (C0)FBN0/3_MCur_F1_C0124680580518116040
Reduced (C1)FBN0/3_MCur_F1_C1
Moderate(MMod)CAOF (C0)FBN0/3_MMod_F1_C012461182118210576040
Reduced (C1)FBN0/3_MMod_F1_C1
High(MHgh)CAOF (C0)FBN0/3_MHgh_F1_C01246149014904416040
Reduced (C1)FBN0/3_MHgh_F1_C1
1st priority (FBN 1/3)Current(MCur)CAOF (C0)FBN1/3_MCur_F1_C011697637631716572287
Reduced (C1)FBN1/3_MCur_F1_C1
Moderate(MMod)CAOF (C0)FBN1/3_MMod_F1_C0116911401140963572287
Reduced (C1)FBN1/3_MMod_F1_C1
High(MHgh)CAOF (C0)FBN1/3_MHgh_F1_C0116914481448346572287
Reduced (C1)FBN1/3_MHgh_F1_C1
2nd priority (FBN 2/3)Current(MCur)CAOF (C0)FBN2/3_MCur_F1_C011077297291639546520
Reduced (C1)FBN2/3_MCur_F1_C1
Moderate(MMod)CAOF (C0)FBN2/3_MMod_F1_C0110711051105886546520
Reduced (C1)FBN2/3_MMod_F1_C1
High(MHgh)CAOF (C0)FBN 2/3_MHgh_F1_C0110714141414269546520
Reduced (C1)FBN 2/3_MHgh_F1_C1
Full priority (FBN 3/3)Current(MCur)CAOF (C0)FBN 3/3_MCur_F1_C010286856851542514816
Reduced (C1)FBN 3/3_MCur_F1_C1
Moderate(MMod)CAOF (C0)FBN3/3_MMod_F1_C0102810621062788514816
Reduced (C1)FBN3/3_MMod_F1_C1
High(MHgh)CAOF (C0)FBN 3/3_MHgh_F1_C0102813701370171514816
Reduced (C1)FBN 3/3_MHgh_F1_C1

Appendix B

Appendix B describes additional results for the 12 scenarios resulting of combining the three management levels and the four FBN priority levels highlighting the best scenarios in terms of higher harvested volume and forest income.
Table A2. Aggregated and per ha harvested volume for all the fire scenarios and owner types; the best and second best scenarios by owner type/parish are marked with (++) and (+), respectively.
Aggregated Harvested Volume (103m3) Harvested Volume Per Hectare (m3ha−1)
Forest Owner TypeFuel-Break Network PrioritiesManagement LevelFuel-Break Network Priorities
No FBN (FBN 0/3)1st Priority (FBN 1/3)2nd Priority (FBN 2/3)Full Priority (FBN 3/3) No FBN (FBN 0/3)1st Priority (FBN 1/3)2nd Priority (FBN 2/3)Full Priority (FBN 3/3)
Industrial469449427400Current377384386389
480 (+)452426402Moderate385386385391
480 (++)457428407High385391 (+)387396 (++)
Active300290279264Current372381382386
451437422411Moderate382383382387
569 (++)561 (+)542537High382388 (+)384392 (++)
Semi-active168165159151Current209216218220
257249240236Moderate217219218222
325 (++)322 (+)310308High218222 (+)219225 (++)
Quasi-absent190 (++)184 (+)179174Current105107109113
1141069789Moderate108110109113
49393020High110113 (+)111115 (++)
Parish112710891043989Current242247248251
1302124311851138Moderate279282282289
1423 (++)1379 (+)13101271High305313 (+)312323 (++)
Table A3. Aggregated and per ha net present value (NPV) for all the fire scenarios and owner types; the best and second best scenarios by owner type/parish are marked with (++) and (+), respectively.
Aggregated NPV (103€) NPV Per Hectare (€ha−1)
Forest Owner TypeFuel-Break Network PrioritiesManagement LevelFuel-Break Network Priorities
No FBN (FBN 0/3)1st Priority (FBN 1/3)2nd Priority (FBN 2/3)Full Priority (FBN 3/3)No FBN (FBN 0/3)1st Priority (FBN 1/3)2nd Priority (FBN 2/3)Full Priority (FBN 3/3)
Industrial1917196618781833Current1539168116971784
2118 (+)203718831855Moderate1700174317021805
2129 (++)211219351931High17091807 (+)17481879 (++)
Active−367−228−197−117 (+)Current−456−298−270−171
−325−255−287−162Moderate−275−223−260−153
−382−219−296−97 (++)High−256−151 (+)−210−70 (++)
Semi-active−587−488−455 (+)−391 (++)Current−730−640−625−570
−738−679−682−593Moderate−624−596−617−558
−915−803−833−705High−614−555 (+)−589−515 (++)
Quasi-absent−991−921−855−723Current−547−537−522−469
−556−479−462−361Moderate−526−498−522−458
−218−158−130 (+)−76 (++)High−495−456 (+)−484−443 (++)
Parish−28328371603Current−67488153
498624453739Moderate107142108188
614932 (+)6761054 (++)High132211 (+)161267 (++)
Table A4. Aggregated and per ha net present value (NPV) for all the fire scenarios for Active, Semi-active and parish under CAOF and reduced costs; the best and second best scenarios by owner type/parish are marked with (++) and (+), respectively.
Aggregated NPV (103€) NPV Per Hectare (€ha−1)
Costs’ ScenarioForest Owner TypeFuel-Break Network PrioritiesManagement LevelFuel-Break Network Priorities
No FBN (FBN 0/3)1st Priority (FBN 1/3)2nd Priority (FBN 2/3)Full Priority (FBN 3/3)No FBN (FBN 0/3)1st Priority (FBN 1/3)2nd Priority (FBN 2/3)Full Priority (FBN 3/3)
CAOFActive−367−228−197−117 (+)Current−456−298−270−171
−325−255−287−162Moderate−275−223−260−153
−382−219−296−97 (++)High−256−151 (+)−210−70 (++)
Semi-active−587−488−455 (+)−391 (++)Current−730−640−625−570
−738−679−682−593Moderate−624−596−617−558
−915−803−833−705High−614−555 (+)−589−515 (++)
Parish−28328371603Current−67488153
498624453739Moderate107142108188
614932 (+)6761054 (++)High132211 (+)161267 (++)
ReducedActive607690678702Current7549059301024
1094111210391107Moderate9269769401042
14061512 (+)13961534 (++)High9441044 (+)9881119 (++)
Semi-active−269−188−169 (+)−123 (++)Current−334−247−232−180
−274−233−248−178Moderate−232−204−224−168
−330−238−280−174High−221−165 (+)−198−127 (++)
Parish1264154615321689Current271350364429
2381243822132423Moderate510553526615
29873228 (++)29213216 (++)High640732 (+)695816 (++)

References

  1. FAO and Plan Bleu. State of Mediterranean Forests 2018; Food and Agriculture Organization of the United Nations, Rome and Plan Bleu: Marseille, France, 2018. [Google Scholar]
  2. Turco, M.; Rosa-Cánovas, J.J.; Bedia, J.; Jerez, S.; Montávez, J.P.; Llasat, M.C.; Provenzale, A. Exacerbated fires in Mediterranean Europe due to anthropogenic warming projected with non-stationary climate-fire models. Nat. Commun. 2018, 9, 1–9. [Google Scholar] [CrossRef] [PubMed]
  3. Moreira, F.; Ascoli, D.; Safford, H.; Adams, M.A.; Moreno, J.M.; Pereira, J.C.; Catry, F.; Armesto, J.; Bond, W.J.; González, M.E.; et al. Wildfire management in Mediterranean-type regions: Paradigm change needed. Environ. Res. Lett. 2019, 15, 011001. [Google Scholar] [CrossRef]
  4. Mirra, I.M.; Oliveira, T.M.; Barros, A.M.; Fernandes, P. Fuel dynamics following fire hazard reduction treatments in blue gum (Eucalyptus globulus) plantations in Portugal. For. Ecol. Manag. 2017, 398, 185–195. [Google Scholar] [CrossRef]
  5. Fernandes, P.A.; Loureiro, C.A. Fire behaviour and severity in a maritime pine stand under differing fuel conditions. Ann. For. Sci. 2004, 61, 537–544. [Google Scholar] [CrossRef] [Green Version]
  6. ICNF: Instituto Conservação da Natureza e Florestas. 6° Inventário Florestal Nacional, 2015, Relatório Final. Instituto da Conservação da Natureza e das Florestas: Lisboa, Portugal, 2019. Available online: http://www2.icnf.pt/portal/florestas/ifn/ifn6 (accessed on 5 October 2021). (In Portuguese).
  7. Pery, G. Geografia e Estatistica Geral de Portugal e Colonias - com um Atlas; Direcção Geral dos Trabalhos Geodésicos, Imprensa Nacional: Lisboa, Portugal, 1875; 457p. (In Portuguese) [Google Scholar]
  8. D’Almeida, A. O Problema Florestal Português, Boletim da Associação Central de Agricultura Portuguesa; Associação Central de Agricultura Portuguesa: Lisboa, Portugal, 1918. (In Portuguese) [Google Scholar]
  9. Fernandes, P. Fire-smart management of forest landscapes in the Mediterranean basin under global change. Landsc. Urban Plan. 2013, 110, 175–182. [Google Scholar] [CrossRef] [Green Version]
  10. Direcção Geral das Florestas and Associação da Industria Papeleira. Inventario Florestal Nacional—Áreas Florestais, foto de 1985; Actualização expedita do IFN; Direcção Geral das Florestas (DGF) and Associação da Industria Papeleira (ACEL): Lisboa, Portugal, 1985. (In Portuguese) [Google Scholar]
  11. Rodrigues, J.M. National eradication programme for the pinewood nematode. In Pine Wilt Disease: A Worldwide Threat to Forest Ecosystems; Mota, M.M., Vieira, P., Eds.; Springer: Dordrecht, The Netherlands, 2008. [Google Scholar]
  12. Centro PINUS: Associação para a valorização da floresta de pinho. Manual de boas práticas florestais para o Pinheiro bravo, Centro Pinus. 1999; 42p, (In Portuguese). Available online: https://www.centropinus.org/files/upload/edicoes_tecnicas/silvicultura-centro-pinus-digital.pdf (accessed on 5 October 2021).
  13. Comissão Técnica Independente. Análise e apuramento dos factos relativos aos incêndios que ocorreram em Pedrogão Grande, Castanheira de Pera, Ansião, Alvaiázere, Figueiró dos Vinhos, Arganil, Góis, Penela, Pampilhosa da Serra, Oleiros e Sertã, entre 17 e 24 de Junho de. 2017. Available online: www.parlamento.pt/Documents/2017/Outubro/Relat%C3%B3rioCTI_VF%20.pdf (accessed on 5 October 2021). (In Portuguese).
  14. Pra, A.; Masiero, M.; Barreiro, S.; Tomé, M.; De Arano, I.M.; Orradre, G.; Onaindia, A.; Brotto, L.; Pettenella, D. Forest plantations in Southwestern Europe: A comparative trend analysis on investment returns, markets and policies. For. Policy Econ. 2019, 109, 102000. [Google Scholar] [CrossRef]
  15. Watson, P.; Potter, S. Burned wood in the pulp and paper industry: A literature review. For. Chron. 2004, 80, 473–477. [Google Scholar] [CrossRef] [Green Version]
  16. Pereira, J.M.; Benali, A.; Sá, A.; Le Page, Y.; Barreiro, S.; Rua, J.; Tomé, M.; Santos, J.L.; Canadas, M.J.; Martins, A.; et al. Alvares - um caso de Resiliência ao Fogo, Technical Report; Instituto Superior de Agronomia: Lisbon, Portugal, 2019; (In Portuguese). Available online: https://d1a66e9e-856c-40a6-96c3-7678ffab648d.filesusr.com/ugd/9ed9f5_3535f0175cc64ffbab5eb26f70363265.pdf (accessed on 5 October 2021).
  17. Cheney, N.P.; Richmond, R.R. The impact of extensive forest management on fire protection with special regard to plantations of eucalypts. In Proceedings of the Eleventh Commonwealth Forestry Conference, Port of Spain, Trinidad and Tobago, 7–25 September 1980. [Google Scholar]
  18. Oliveira, T.M.; Barros, A.M.G.; Ager, A.A.; Fernandes, P.M. Assessing the effect of a fuel break network to reduce burnt area and wildfire risk transmission. Int. J. Wildl. Fire 2016, 25, 619–632. [Google Scholar] [CrossRef]
  19. Benali, A.; Sá, A.C.L.; Pinho, J.; Fernandes, P.M.; Pereira, J.M.C. Understanding the Impact of Different Landscape-Level Fuel Management Strategies on Wildfire Hazard in Central Portugal. Forests 2021, 12, 522. [Google Scholar] [CrossRef]
  20. Canadas, M.J.; Novais, A.; Marques, M. Wildfires, forest management and landowners’ collective action: A comparative approach at the local level. Land Use Policy 2016, 56, 179–188. [Google Scholar] [CrossRef]
  21. Canadas, M.J.; Novais, A.; Marques, M. Proprietários florestais, políticas e Territórios: Incêndios e a gestão do Espaço Rural. In Forest Owners, Policies and Territories: Wildfires and Rural Areas Management; ANIMAR: Lisboa, Portugal, 2014. (In Portuguese) [Google Scholar]
  22. Novais, A.; Canadas, M.J. Understanding the management logic of private forest owners: A new approach. For. Policy Econ. 2010, 12, 173–180. [Google Scholar] [CrossRef]
  23. Fernandez-Anez, N.; Krasovskiy, A.; Müller, M.; Vacik, H.; Baetens, J.; Hukić, E.; Solomun, M.K.; Atanassova, I.; Glushkova, M.; Bogunović, I.; et al. Current Wildland Fire Patterns and Challenges in Europe: A Synthesis of National Perspectives. Air Soil Water Res. 2021, 14, e117862212110281. [Google Scholar] [CrossRef]
  24. Scott, J.H. NEXUS: A system for assessing crown fire hazard. Fire Manag. Notes 1999, 59, 21–24. [Google Scholar]
  25. Finney, M.A. FARSITE: Fire Area Simulator—Model Development and Evaluation; U.S. Department of Agriculture, Forest Service, Rocky Mountain Forest and Range Experiment Station: Ogden, UT, USA, 1998. [Google Scholar]
  26. Finney, M.A. An overview of FlamMap fire modeling capabilities. In Proceedings of the Fuels Management-How to Measure Success, Portland, OR, USA, 28–30 March 2006; pp. 213–220. [Google Scholar]
  27. Andrews, P.L. BehavePlus fire modeling system: Past, present, and future. In Proceedings of the 7th Symposium on Fire and Forest Meteorological Society, Bar Harbor, ME, USA, 23–25 October 2007; pp. 1–13. [Google Scholar]
  28. Finney, M.A.; Grenfell, I.C.; McHugh, C.W.; Seli, R.C.; Trethewey, D.; Stratton, R.D.; Brittain, S. A Method for Ensemble Wildland Fire Simulation. Environ. Model. Assess. 2010, 16, 153–167. [Google Scholar] [CrossRef]
  29. Marques, S.; Marto, M.; Bushenkov, V.; McDill, M.; Borges, J.G. Addressing Wildfire Risk in Forest Management Planning with Multiple Criteria Decision Making Methods. Sustainability 2017, 9, 298. [Google Scholar] [CrossRef] [Green Version]
  30. Rebain, S.A. The Fire and Fuels Extension to the Forest Vegetation Simulator: Updated Model Documentation; U.S. Department of Agriculture, Forest Service, Forest Management Service Center: Fort Collins, CO, USA, 2010. [Google Scholar]
  31. Gonzalez, J.R.; Palahi, M.; Pukkala, T. Integrating fire risk considerations in forest management planning in Spain—A land-scape level perspective. Landsc. Ecol. 2005, 20, 957–970. [Google Scholar] [CrossRef]
  32. Rijal, B.; Raulier, F.; Martell, D.L.; Gauthier, S. The economic impact of fire management on timber production in the boreal forest region of Quebec, Canada. Int. J. Wildland Fire 2018, 27, 831–844. [Google Scholar] [CrossRef]
  33. Barreiro, S.; Rua, J.; Tomé, M. StandsSIM-MD: A management driven forest simulator. For. Syst. 2016, 25, eRC07. [Google Scholar] [CrossRef] [Green Version]
  34. Soils and Land Suitability Map of Central Interior Portugal, Directorate-General for Agriculture and Rural Development. Available online: https://snisolos.dgadr.gov.pt/ (accessed on 5 October 2021).
  35. Worldclim. Available online: https://www.worldclim.org/ (accessed on 5 October 2021).
  36. Santos, J.L.; Martins, A.; Novais, A.; Canadas, M.J. A Choice-Modelling Approach to Inform Policies Aimed at Reducing Wildfire Hazard through the Promotion of Fuel Management by Forest Owners. Forests 2021, 12, 403. [Google Scholar] [CrossRef]
  37. DGT: Direção-Geral do Território. Cartografia de Uso e Ocupação do Solo/Portuguese Land Cover Map 2015: COS2015. Available online: https://www.dgterritorio.gov.pt/cartografia/cartografia-tematica/COS-CLC-COPERNICUS (accessed on 28 August 2021).
  38. Duncker, P.S.; Barreiro, S.M.; Hengeveld, G.M.; Lind, T.; Mason, W.L.; Ambrozy, S.; Spiecker, H. Classification of Forest Management Approaches: A new methodological framework and its applicability to European forestry. Ecol. Soc. 2012, 17, 51. [Google Scholar] [CrossRef]
  39. Oliveira, S.L.; Pereira, J.M.; Carreiras, J.M. Fire frequency analysis in Portugal (1975–2005), using Landsat-based burnt area maps. Int. J. Wildland Fire 2011, 21, 48–60. [Google Scholar] [CrossRef]
  40. Klemperer, D. Forest Resource Economics and Finance; McGraw-Hill Education: New York, NY, USA, 2003; 551p. [Google Scholar]
  41. Bettinger, P.; Boston, K.; Siry, J.P.; Grebner, D.L. Forest Management and Planning; Academic Press: New York, NY, USA, 2009; 342p. [Google Scholar]
  42. Solberg, B. Economics of forest resources. Eur. Rev. Agric. Econ. 2010, 37, 423–426. [Google Scholar] [CrossRef]
  43. Wegner, J.E. Forestry Economics: A Managerial Approach; Routledge: New York, NY, USA, 2012; 377p. [Google Scholar]
  44. Cubbage, F.; Mac Donagh, P.; Sawinski Júnior, J.; Rubilar, R.; Donoso, P.; Ferreira, A.; Hoeflich, V.; Olmos, V.M.; Ferreira, G.; Balmelli, G.; et al. Timber investment returns for selected plantations and native forests in South America and the southern United States. New For. 2007, 33, 237–255. [Google Scholar] [CrossRef]
  45. Shamblin, J.E.; Stevens, G.T. OPERATIONS RESEARCH: A Fundamental Approach; McGraw-Hill Education: New York, NY, USA, 1974; 416p. [Google Scholar]
  46. Comissão de Acompanhamento para as Operações Florestais (CAOF). Matriz de beneficiação 2016: Direção-Geral de Agricultura e Desenvolvimento Rural. DGADR: Lisboa, Portugal, 2021. Available online: https://www.dgadr.gov.pt/mecanizacao/caof (accessed on 28 August 2021). (In Portuguese)
  47. Comissão de Acompanhamento para as Operações Florestais (CAOF). Matriz de (re) Arborização 2016: Direção-Geral de Agricultura e Desenvolvimento Rural. DGADR: Lisboa, Portugal, 2021. Available online: https://www.dgadr.gov.pt/mecanizacao/caof (accessed on 28 August 2021). (In Portuguese)
  48. INE: Instituto Nacional de Estatística. Censos de 2011 Resultados Definitivos-Portugal; Instituto Nacional de Estatística: Lisbon, Portugal, 2021; Available online: https://ine.pt/scripts/db_censos_2021.html (accessed on 5 October 2021). (In Portuguese)
  49. Fernandes, P.M. Empirical support for the use of prescribed burning as a fuel treatment. Curr. For. Rep. 2015, 1, 118–127. [Google Scholar] [CrossRef] [Green Version]
  50. Tomé, M.; Oliveira, T.; Soares, P. O modelo GLOBULUS 3.0. Dados e equações. Publicações GIMREF RC2/2006; Universidade Técnica de Lisboa, Instituto Superior de Agronomia, Centro de Estudos Florestais: Lisboa, Portugal, 2006. (In Portuguese) [Google Scholar]
  51. Mauser, H. Key Questions on Forests in the EU. Knowledge to Action 4; European Forest Institute: Joensuu, Finland, 2021; 62p. [Google Scholar] [CrossRef]
  52. Ager, A.A.; Barros, A.M.G.; Houtman, R.; Seli, R.; Day, M.A. Modelling the effect of accelerated forest management on long-term wildfire activity. Ecol. Modell. 2020, 421, 108962. [Google Scholar] [CrossRef]
  53. DRE: Diário da Républica Electronico, Decreto-Lei n.° 10/2018. Available online: https://dre.pt/home/-/dre/114685734/details/maximized (accessed on 28 August 2021).
  54. Kling, C. Analysis of Eucalyptus Plantations on the Iberian Peninsula; Department of Forest Products, SLU: Uppsala, Sweden, 2012; 80p. [Google Scholar]
Figure 1. Illustration of the management intensity for the FMA corresponding to each owner type (without detailing the “FMA variants” considered), with the dark gray cells representing the frequency and timing of silvicultural operations.
Forests 12 01498 g001
Figure 2. Outline for the integrated approach used consisting of developing a prescription generating tool to link the fire simulator outputs and the forest growth simulator inputs.
Forests 12 01498 g002
Figure 3. Observed overestimated distribution of the time between consecutive wildfires; NB—the dots represent fire frequencies for pixels that never burned.
Forests 12 01498 g003
Figure 4. Simulated distribution of the number of years between wildfires, for the different fuel management scenarios; NB—the dots represent “not burned”.
Forests 12 01498 g004
Figure 5. Net present value and volume harvested losses by owner type when comparing the BAU (FBN0/3_MCur_F1_C0) and the improved management scenario (FBN3/3_MHgh_F1_C0) with the hypothetical scenario with no fire (FBN0/3_MCur_F0_C0); where the full circles represent differences in “103m3/ 103€” and bordered circles “m3ha−1 / €ha−1” losses.
Forests 12 01498 g005
Figure 6. Comparison of aggregated and per hectare NPV and harvested volume for no FBN and the average of the FBN priorities for the three management levels by owner type and at parish level using.
Forests 12 01498 g006
Figure 7. Absolute and marginal impact of FBN implementation on NPV per hectare by owner type and management level.
Forests 12 01498 g007
Figure 8. Aggregates and per ha NPV considering CAOF and reduced operations’ prices for all the fire scenarios.
Forests 12 01498 g008
Table 1. Forest owner type and management description.
Type of OwnerForest Management Description
Professional industrialIntensive sustainable management; carry out proper site establishment (1250/1100 trees ha−1); use genetically improved material; fertilize; perform intensive fuel and pest control operations. Usual rotation length of 12 years, with one plantation followed by two coppices; average volume by harvest time is 185 m3ha−1. Share of plantations versus coppice was 50/50.
Active privateTry to mimic the management practiced by the pulp and paper companies, managing slightly less intensively than industrial forest owners do. Planting densities of 1350/1150 trees ha−1; use genetically improved material only in about 80% of the area. Usual rotation length of 12-years, with one plantation followed by two coppices; average volume by harvest time of 140 m3ha−1. Share of plantations versus coppice of 50/50.
Semi-active privateFocus on site establishment operations; have no access to genetically improved material; perform fewer to no fertilizations and/or fuel control operations. Planting densities of 1350/1150 trees ha−1. Usual rotation length of 12-years, with one plantation followed by two coppices, average volume by harvest time is 100 m3ha−1. Share of plantations versus coppice of 35/65.
Quasi-absent privateFocus only on final harvest (usually premature) and benefit from eucalypt resprouting ability for site establishment. When planting cannot be avoided, planting densities are of 1450 trees ha−1. Usual rotation length of 10-years, with one plantation followed by two coppices, average volume by harvest time is 50 m3ha−1. Share of plantations versus coppice of 20/80.
Absent privateDo not explore their unmanaged forests.
Table 2. Management improvement levels expressed by forest area percentages by owner type.
Management Improvement Levels
Current (%)Moderate (%)High (%)
Professional industrial23.423.423.4
Active private15.322.528.3
Semi-active private15.322.528.3
Quasi-absent private34.520.18.5
Absent private11.511.511.5
Total100100100
Table 3. Total simulated burned area for the 40-year period, and annual average decrease in estimated burned area (ha), when compared with the BAU scenario (inside brackets).
Total Burnt Area by Scenario
Management Improvement Levels
CurrentModerateHigh
FBN priority levelsFBN0/018,401 (BAU)15,996 (60.1)14,786 (90.4)
FBN1/316,050 (58.8)14,460 (98.5)13,405 (124.9)
FBN2/315,207 (79.9)14,867 (88.3)13,906 (112.4)
FBN3/313,369 (125.8)13,152 (131.2)12,406 (149.9)
Table 4. Total and per hectare values for NPV and volume harvested by owner type for the BAU (FBN0/3_MCur_F1_C0), the improved management (FBN3/3_MHgh_F1_C0), and the hypothetical no-fire scenario (FBN0/3_MCur_F0_C0).
ScenariosUnitsOwner Type
Professional IndustrialActiveSemi-ActiveQuasi-AbsentParish
Forest area:
FBN0/3_MCur_F0_C0(ha)124680580518114667
FBN0/3_MCur_F1_C0124680580518114667
FBN3/3_MHgh_F1_C01028137013701713940
Net Present Value:
FBN0/3_MCur_F0_C0(×103€)3721921111−2724481
FBN0/3_MCur_F1_C01917−367−587−991−28
FBN3/3_MHgh_F1_C01931−97−705−761054
FBN0/3_MCur_F0_C0(€ha−1)29871144138−150960
FBN0/3_MCur_F1_C01539−456−730−547−6
FBN3/3_MHgh_F1_C01879−70−515−443267
Volume harvested:
FBN0/3_MCur_F0_C0(×103m3)5613602142571393
FBN0/3_MCur_F1_C04693001681901127
FBN3/3_MHgh_F1_C0407537308201271
FBN0/3_MCur_F0_C0(m3ha−1)451447266142299
FBN0/3_MCur_F1_C0377372209105242
FBN3/3_MHgh_F1_C0396392225115323
Table 5. NPV (€ and €ha−1) and volume harvested (m3 and m3ha−1) by owner type and at parish level for the management improvement scenarios considering no-FBN implementation.
ScenariosUnitsOwner Type
Professional IndustrialActiveSemi-ActiveQuasi-AbsentParish
Forest area:
FBN0/3_MCur_F1_C0(ha)124680580518114667
FBN0/3_MMod_F1_C012461182118210574667
FBN0/3_MHgh_F1_C01028149014904413940
Net Present Value:
FBN0/3_MCur_F1_C0(×103€)1917−367−587−991−28
FBN0/3_MMod_F1_C02118−325−738−556498
FBN0/3_MHgh_F1_C02129−382−915−218614
FBN0/3_MCur_F1_C0(€ha−1)1539−456−730−547−6
FBN0/3_MMod_F1_C01700−275−624−526107
FBN0/3_MHgh_F1_C01709−256−614−495132
Volume harvested:
FBN0/3_MCur_F1_C0(×103m3)4693001681901127
FBN0/3_MMod_F1_C04804512571141302
FBN0/3_MHgh_F1_C0480569325491423
FBN0/3_MCur_F1_C0(m3ha−1)377372209105242
FBN0/3_MMod_F1_C0385382217108279
FBN0/3_MHgh_F1_C0385382218110305
Table 6. Total and per hectare values for NPV and volume harvested by owner type for the BAU (FBN0/3_MCur_F1_C0) and for the scenarios reflecting the three FBN priority levels (FBN1/3_MCur_F1_C0, FBN2/3_MCur_F1_C0, and FBN3/3_MCur_F1_C0).
ScenariosUnitsOwner Type
Professional IndustrialActiveSemi-ActiveQuasi-AbsentParish
Forest area:
FBN0/3_MCur_F1_C0(ha)124680580518114667
FBN1/3_MCur_F1_C0116976376317164411
FBN2/3_MCur_F1_C0110772972916394203
FBN3/3_MCur_F1_C0102868568515423940
Net Present Value:
FBN0/3_MCur_F1_C0(×103€)1917−367−587−991−28
FBN1/3_MCur_F1_C01966−228−488−921328
FBN2/3_MCur_F1_C01878−197−455−855371
FBN3/3_MCur_F1_C01833−117−391−723603
FBN0/3_MCur_F1_C0(€ha−1)1539−456−730−547−6
FBN1/3_MCur_F1_C01681−298−640−53774
FBN2/3_MCur_F1_C01697−270−625−52288
FBN3/3_MCur_F1_C01784−171−570−469153
Volume harvested:
FBN0/3_MCur_F1_C0(×103m3)4693001681901127
FBN1/3_MCur_F1_C04492901651841089
FBN2/3_MCur_F1_C04272791591791043
FBN3/3_MCur_F1_C0400264151174989
FBN0/3_MCur_F1_C0(m3ha−1)377372209105242
FBN1/3_MCur_F1_C0384381216107247
FBN2/3_MCur_F1_C0386382218109248
FBN3/3_MCur_F1_C0389386220113251
Publisher’s Note: MDPI stays neutral with regard to jurisdictional claims in published maps and institutional affiliations.

