
Temperature Characteristics of Two Fomitiporia Fungi Determine Their Geographical Distributions in Japan

1
Department of Mushroom Science and Forest Microbiology, Forestry and Forest Products Research Institute, 1 Matsunosato, Tsukuba 305-8687, Japan
2
Principal Research Director, Forestry and Forest Products Research Institute, 1 Matsunosato, Tsukuba 305-8687, Japan
*
Author to whom correspondence should be addressed.
Forests 2021, 12(11), 1580; https://0-doi-org.brum.beds.ac.uk/10.3390/f12111580
Submission received: 21 October 2021
/
Revised: 13 November 2021
/
Accepted: 15 November 2021
/
Published: 17 November 2021
(This article belongs to the Section Forest Health)
Abstract
:Two morphologically similar fungi, Fomitiporia torreyae and Fomitiporia punctata, are causal fungi of various tree diseases in Japan and are speculated to be distributed in different climatic zones. Clarifying their distribution ranges and climatic preferences would contribute to the prediction of disease occurrences and consideration of controls. In this study, we predicted the present geographical distributions of F. torreyae and F. punctata in Japan using a Maxent species distribution model to analyze our data and previously published collection records. In addition, we examined the importance of temperature on these predictions via jackknife analysis and evaluated the effects of temperature on mycelial growth and survival to elucidate determinants of their distribution. The predicted potential distributions showed that F. torreyae is mainly distributed in warmer areas compared to F. punctata. Jackknife analysis indicated the high importance of temperature variables for each fungal prediction. The two fungi were usually found at locations within upper or lower temperature limits for the growth and survival of each species. These results suggest that temperature is a key determinant of their distributions in Japan. This is the first report to predict fungal distribution based on species distribution modeling and evaluation of fungal physiological characteristics. This study indicates that the projected global warming will influence the future ranges of the two fungal species.
1. Introduction
Fomitiporia torreyae Y.C. Dai & B.K. Cui is a wood-decay fungus that belongs to Hymenochaetaceae, Hymenochaetales, Basidiomycota. This species causes various tree diseases in Japan, including stem rot on Japanese cedar (Cryptomeria japonica) and Sawara cypress (Chamaecyparis pisifera) [1,2,3], Japanese pear (Pyrus pyrifolia var. culta) dwarf [4,5], and dieback of Japanese umbrella pine (Sciadopitys verticillata) [6]. Since these tree species are economically important for forestry and fruit farming, F. torreyae is considered a serious tree pathogen in Japan. Nevertheless, F. torreyae had been confused with Fomitiporia punctata (Pilát) Murrill until recently [7], and the causative agent of Japanese cedar stem rot was first misidentified as ‘Fuscoporia punctata (Fr.) G. Cunn.’ (=Fomitiporia punctata) [2]. Fomitiporia punctata has also been reported to be associated with some tree diseases, and it also can cause Japanese pear dwarf [8]. In addition, Yamaguchi [9] reported that F. punctata caused trunk rot and the death of Cerasus sargentii after an inoculation test, though this disease has not yet been recorded in the field.
Since the macro-morphologies of F. torreyae and F. punctata are very similar, these species are discriminated mainly by their micro-morphological characteristics, including the presence of hymenial setae and the size of basidiospores [7]. However, careful observation is needed because the size ranges of basidiospores are partially overlapped, and the abundance of hymenial setae varies according to the specimen [7]. Host ranges are not well differentiated between these species; F. torreyae is found on various conifer and broadleaf tree species, and F. punctata is observed on several broadleaf tree species [7,10,11]. However, their geographical distribution ranges are speculated to differ on the basis of the collection locations of their basidiocarps in eastern Asia; that is, F. punctata is widely collected in cool temperate to boreal areas, whereas F. torreyae is collected in warm temperate to subtropical areas [7]. Therefore, distribution ranges and climatic preferences—especially temperature preferences—may differ between these fungi, but their geographical distributions and their determinants have not yet been addressed. Terashima [12] reported the effect of temperature on the mycelial growth of F. torreyae (as Fomitiporia sp.), but the temperature range for survival was not examined. No similar study of F. punctata, including the mycelial growth rate in different temperature regimes, has been conducted. Thus, the environmental conditions for the optimal growth and survival of these two fungi, including the temperature characteristics of cultures, have not been fully examined.
Species distribution models are mathematical models to relate species occurrence or abundance with environmental and spatial characteristics of particular sites [13]. These models have been widely used to predict current and future potential distributions of various organisms, including fungi, e.g., [14,15]. Among species distribution models, maximum entropy modeling (Maxent) [16] is one of the commonly used methods with higher-performance approaches [16,17]. Maxent requires only the presence data of particular species [16], and its performance can be higher compared to other methods, even with low numbers of samples [18]. It is difficult to acquire absence data for fungi due to the limited detectability of their basidiocarps; it is also difficult to collect a large quantity of presence data due to the limited number of experts on fungi. Therefore, Maxent is considered one of the best methods for predicting geographical distributions and elucidating determinants for fungal distribution.
Considering that F. torreyae and F. punctata have been associated with tree diseases, clarifying their ecological and physiological characteristics, such as distribution ranges and climatic preferences, would contribute to the prediction of disease occurrences by these fungi and consideration of their controls. The objectives of this study were to estimate the geographical distributions of F. torreyae and F. punctata in Japan, and to elucidate the determinants of their distribution. Since these two species are considered to be distributed in different climatic zones [7], this study focused on temperature as a determinant of their distributions. To relate temperature with their geographical distributions, we predicted the potential distribution areas of the two fungi and examined the importance of temperature on these predictions using Maxent. Moreover, we examined the effects of temperature on their mycelial growth to estimate the temperature range for their growth and survival.
2. Materials and Methods
2.1. Species Record
For Maxent analyses, we used datasets on F. torreyae and F. punctata collections that were previously published with discrimination of these species. These datasets included F. torreyae collection records by Kaneko et al. [19] identified by species-selective primers [20], those by Ota et al. [7] identified morphologically and phylogenetically, and those by Nakamura and Hattori [11] identified morphologically. We also added the herbarium records of basidiocarp specimens in the Mycological Herbarium of the Forestry and Forest Products Research Institute (TFM), and culture stock data in the Microbial Genetic Resources of the Forestry and Forest Products Research Institute Genebank (FFPRI) and the Laboratory of Microbial Ecology, Forestry and Forest Products Research Institute (WD). The fungal species of the additional data were identified by the rDNA sequences of the internal transcribed spacer (ITS) region. Newly generated sequences were deposited in GenBank (Table S1).
The published collection data often lacked detailed locality names or latitude and longitude data to indicate the exact point of collection. Of these cases, the specimens deposited in TFM were re-examined by investigating the herbarium records to provide more detailed geographical ranges of the collection sites. The latitude and longitude data were lacking for most samples, but we successfully restricted most of the collection sites into areas narrower than 1 × 1 km. The collection data of duplicate localities were removed from the analysis. Later, the latitude and longitude near the center of each collection site were recorded on Google Maps because exact collection points were unknown. For ten sites of F. torreyae and seven sites of F. punctata, we failed to restrict the collection sites into areas narrower than 1 × 1 km but succeeded in restricting them to areas narrower than 5 × 5 km. These collection data were also included in the analysis due to the low number of samples used for the analysis, especially for F. punctata. In total, we prepared 73 and 14 presence data of F. torreyae and F. punctata, respectively (Figure S1 and Table S1).
2.2. Environmental Variables and Maxent Analyses
As environmental variables for Maxent analyses, we prepared 52 climatic variables: monthly and annual average, maximum and minimum temperature, and monthly and annual precipitation. The climatic data were obtained from National Land Numerical Information (average data from 1981 to 2010, 1 km resolution; https://nlftp.mlit.go.jp/ksj/gml/datalist/KsjTmplt-G02.html, accessed on 6 June 2021) provided by the Ministry of Land, Infrastructure, Transport and Tourism, Japan. Shapefiles of each climatic variable were transformed to the ASCII files required by Maxent software using QGIS ver. 3.10.12. [21]. We found high correlations among most environmental variables, with Pearson’s correlation coefficients of ≥0.8. Recent studies have shown that Maxent is robust to collinearity among variables [22,23], but its model performance can be affected by increasing model complexity, such as an increasing number of variables [24]. Therefore, we chose monthly and annual average temperatures among the temperature data to reduce the number of variables and used 26 climatic variables for Maxent analyses.
The potential distributions of F. torreyae and F. punctata in Japan were predicted with Maxent ver. 3.4.4. [25] using the presence data (latitude and longitude) of these fungi and the environmental data mentioned above. We ran Maxent analyses with default settings, except for using 100 bootstrap replicates by sampling replaced with random seeds. In the analysis of F. torreyae, 68 presence data were used because the default setting “remove duplicate presence records” excluded five records. The model performances were evaluated based on the area under the receiver operating characteristic curve (AUC). AUC values ranged from 0 to 1, and values > 0.5 indicated that the resulting model was better than random [17]. In addition, variable importance to the model was evaluated by jackknife analysis, which is an optional analysis in Maxent. A jackknife test outputs the gain in models only with or only without each variable. Since we found higher correlations among most environmental variables, the gain in models only with each variable was used for the evaluation of variable importance. To determine how the presence probability was influenced by changes in different variables, Maxent response curves in models using only each variable were generated. To detect temperature ranges at the sampling locations of the two fungi, the temperature data at each location were extracted from the climatic data via Maxent.
2.3. Growth Experiment
We measured the mycelial growth rates of F. torreyae and F. punctata under various temperatures to estimate the effects of temperature on their growth rates. All isolates used in this experiment were preserved in FFPRI (Table 1). The sampling information of each isolate was included in Maxent analyses. Each isolate was precultured on potato dextrose agar (PDA; Nissui Pharmaceutical, Tokyo, Japan) medium in the dark for 8 days at 25 °C. A disk of mycelia was cut from the edge of the precultured plates using a 6 mm cork borer and transferred to 9 cm plastic culture plates, each containing 15 mL of PDA medium. The inoculated plates were incubated in the dark for up to 7 weeks at eight different temperatures, namely, 5, 10, 15, 20, 25, 30, 35, and 40 °C. Since the colonies reached the edges of the plates, incubation was terminated after approximately 2 to 3 weeks for 20, 25, and 30 °C, and after 6 weeks for 15 and 35 °C. Each isolate had three replicates for each temperature. Following the incubation period, the radius of each fungal colony was measured in two perpendicular directions. Mycelial growth (mm/day) was calculated as the average radius at specific time intervals.
To determine the vitality of these fungal colonies incubated at low temperatures, six isolates were precultured on PDA medium in the dark for 1 month at 25 °C. All plates were transferred and incubated at −5 °C or 0 °C. Each isolate had three replicates for each temperature. Vitality tests were conducted after 1, 2, 3, 4, and 8 weeks for 0 °C incubation and weekly for −5 °C incubation throughout the 8-week experiment. To examine the vitality, three ca. 5 × 5 mm pieces of mycelium per plate were randomly excised from the margins of the colonies and transferred to new PDA plates. In the −5 °C incubation, each plate was stored at room temperature, ca. 20 °C, for a few hours before transfer because the colonies were frozen. The transferred plates were incubated for a maximum of 1 month at room temperature. The transferred piece was considered alive when newly grown mycelia were seen on the piece, and then the number of live pieces was recorded. The proportion of live pieces to the total tested pieces was calculated for each isolate.
3. Results
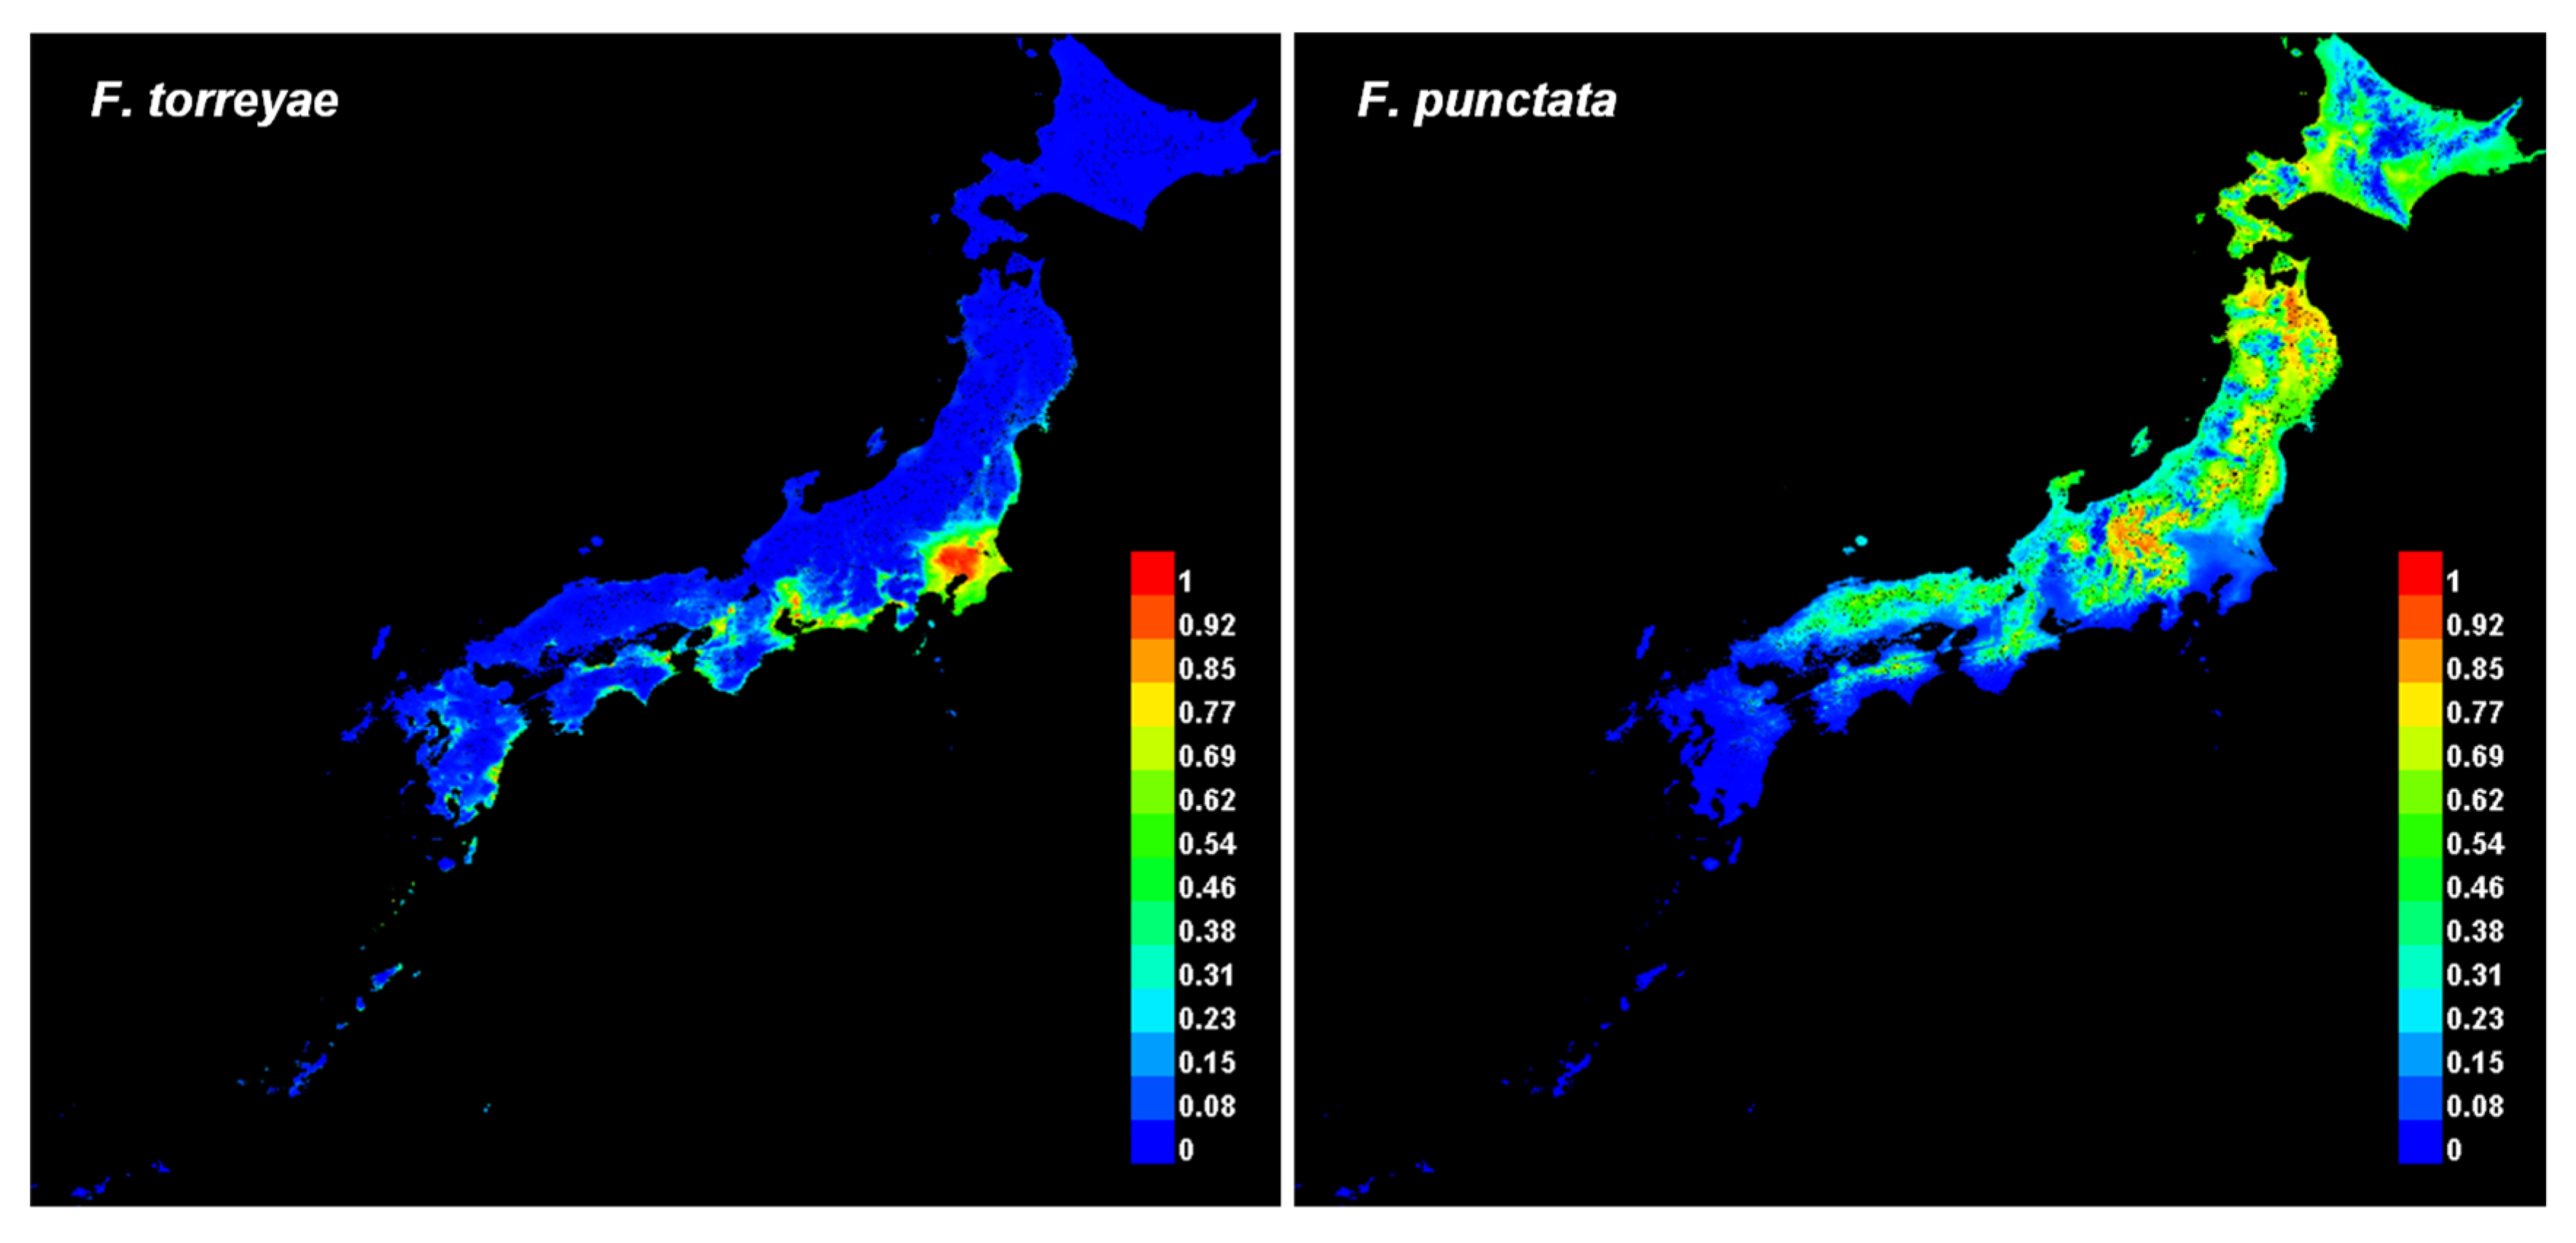
The presence probability of F. torreyae by Maxent analysis was higher in coastal areas along the Pacific Ocean from the middle part of the Tohoku region (around Sendai) toward southern Japan than in other areas (Figure 1 and Figure S1). Meanwhile, the probability of F. punctata was higher in mountainous areas from the middle parts of the Shikoku and Chugoku regions toward northern Japan (Figure 1 and Figure S1). The AUC values (average ± standard deviation) of F. torreyae and F. punctata predictions were 0.960 ± 0.006 and 0.889 ± 0.040, respectively.
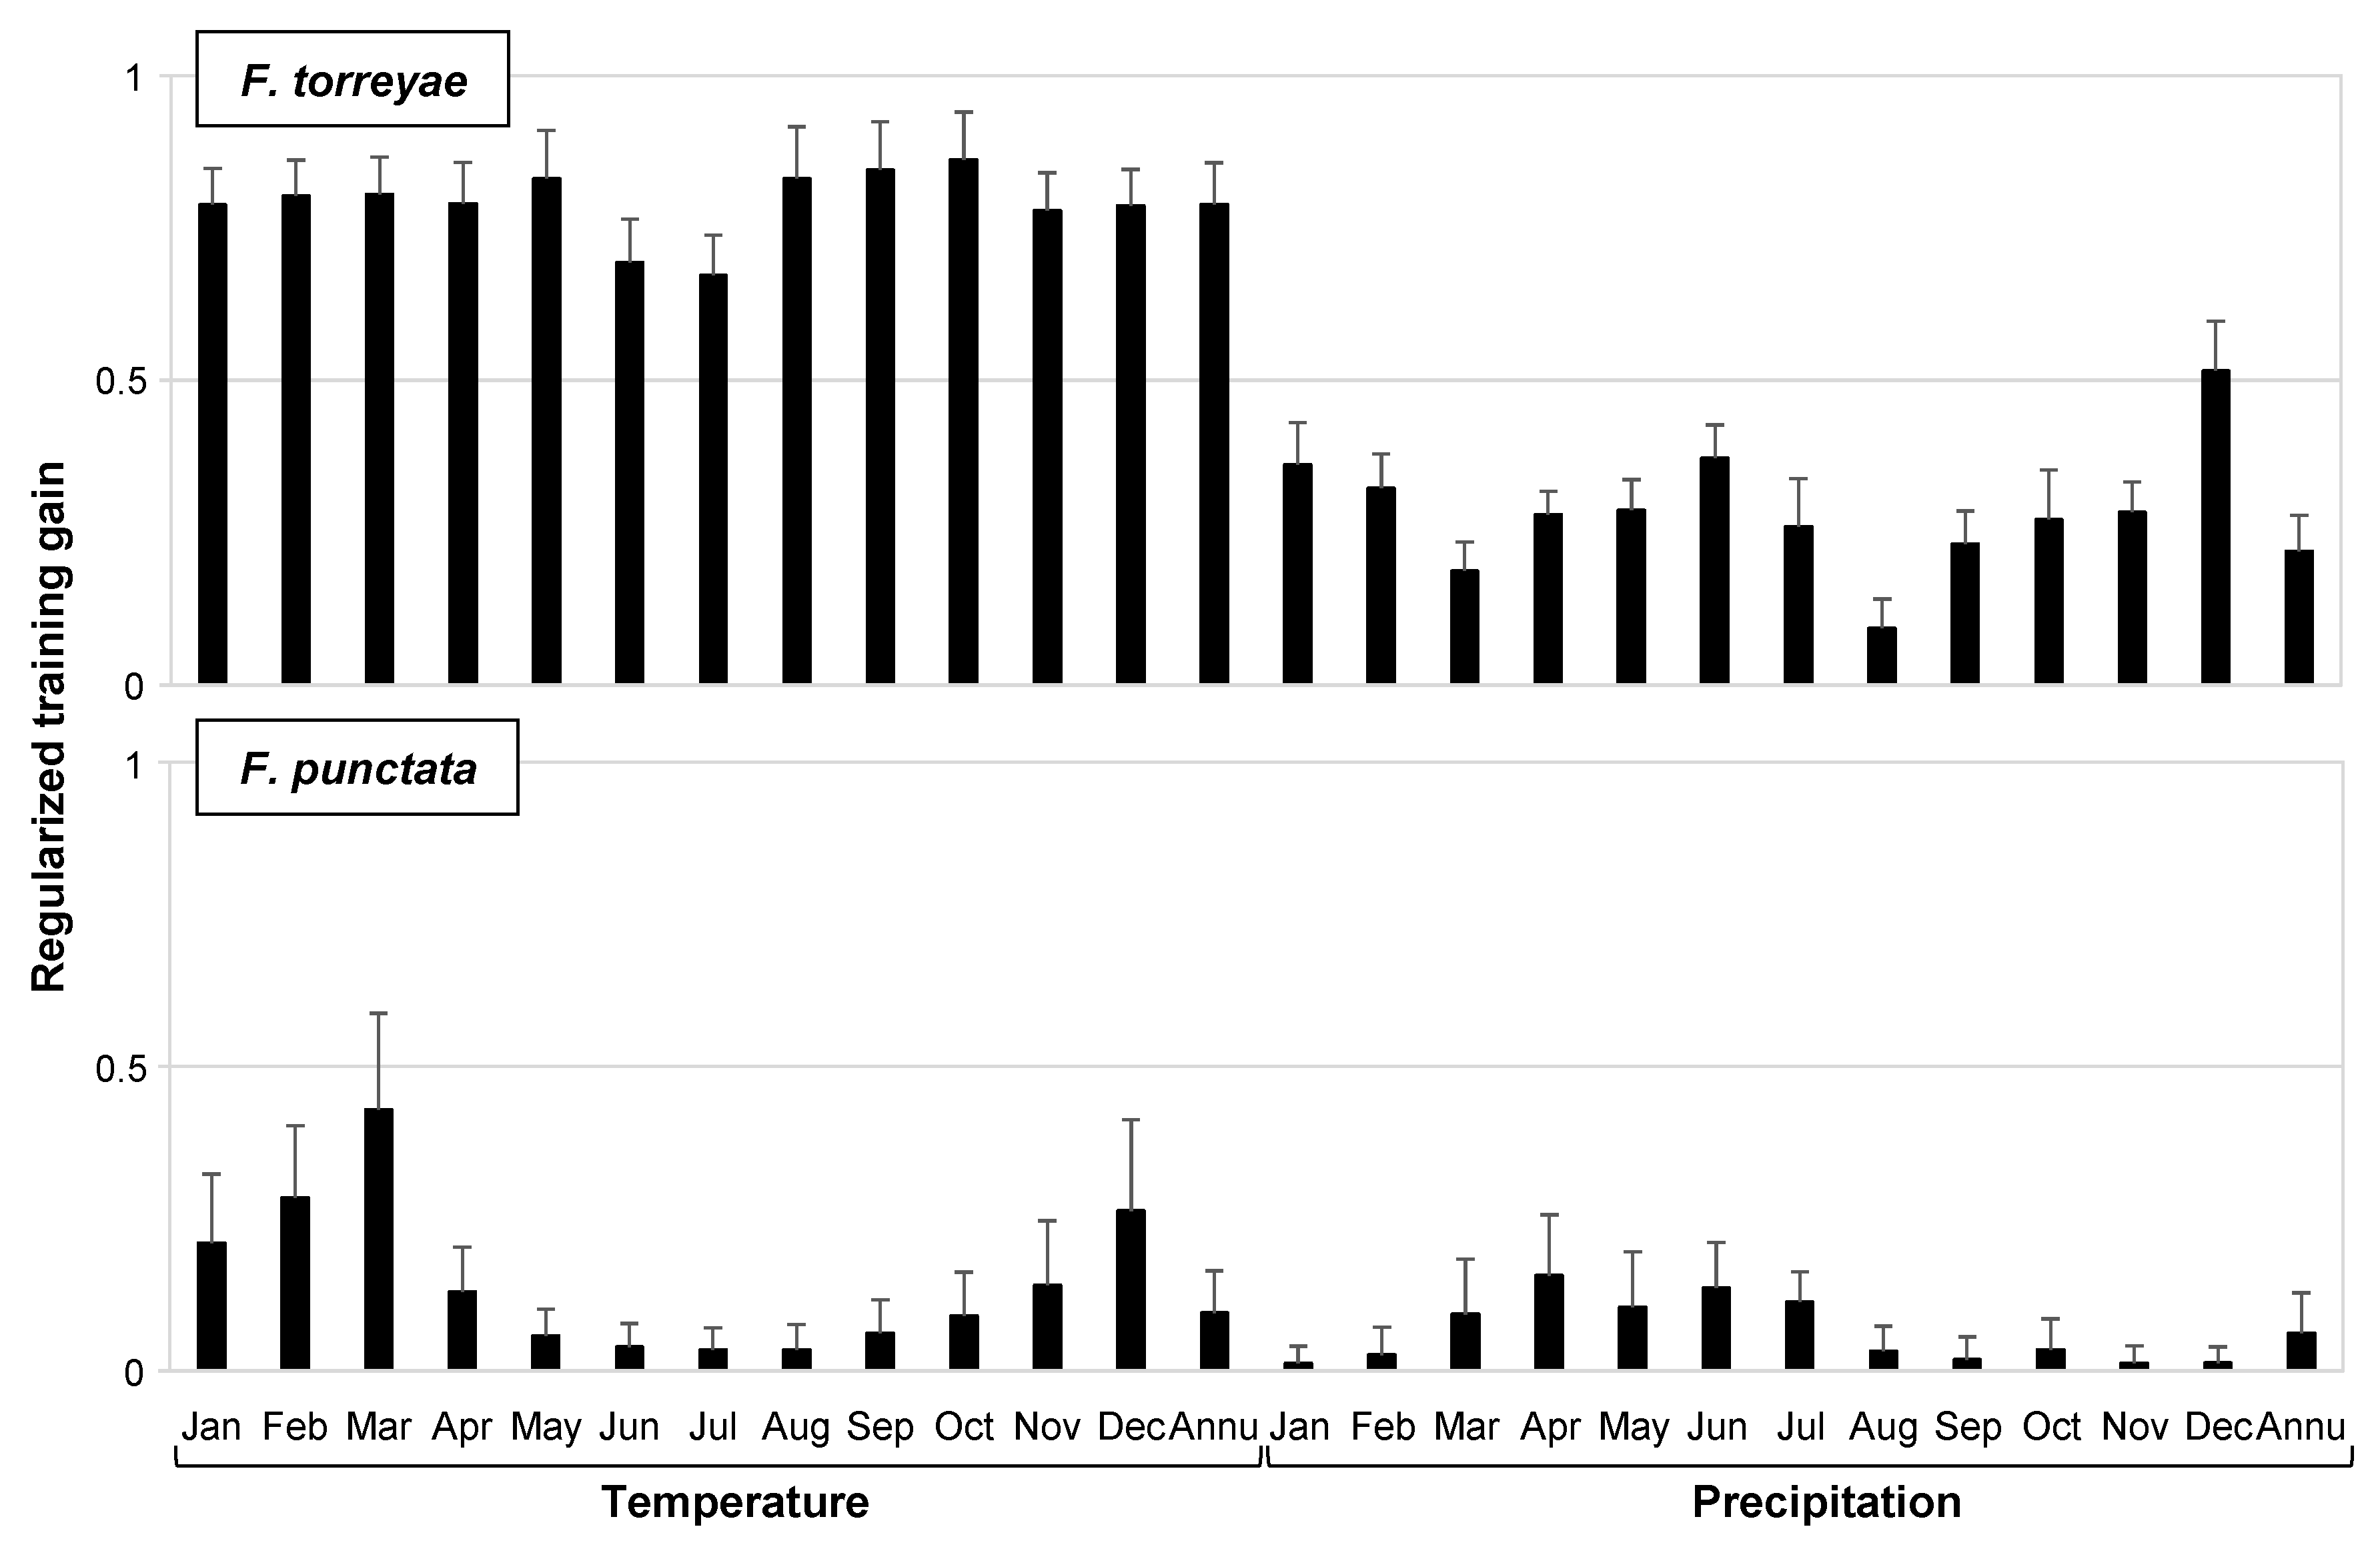
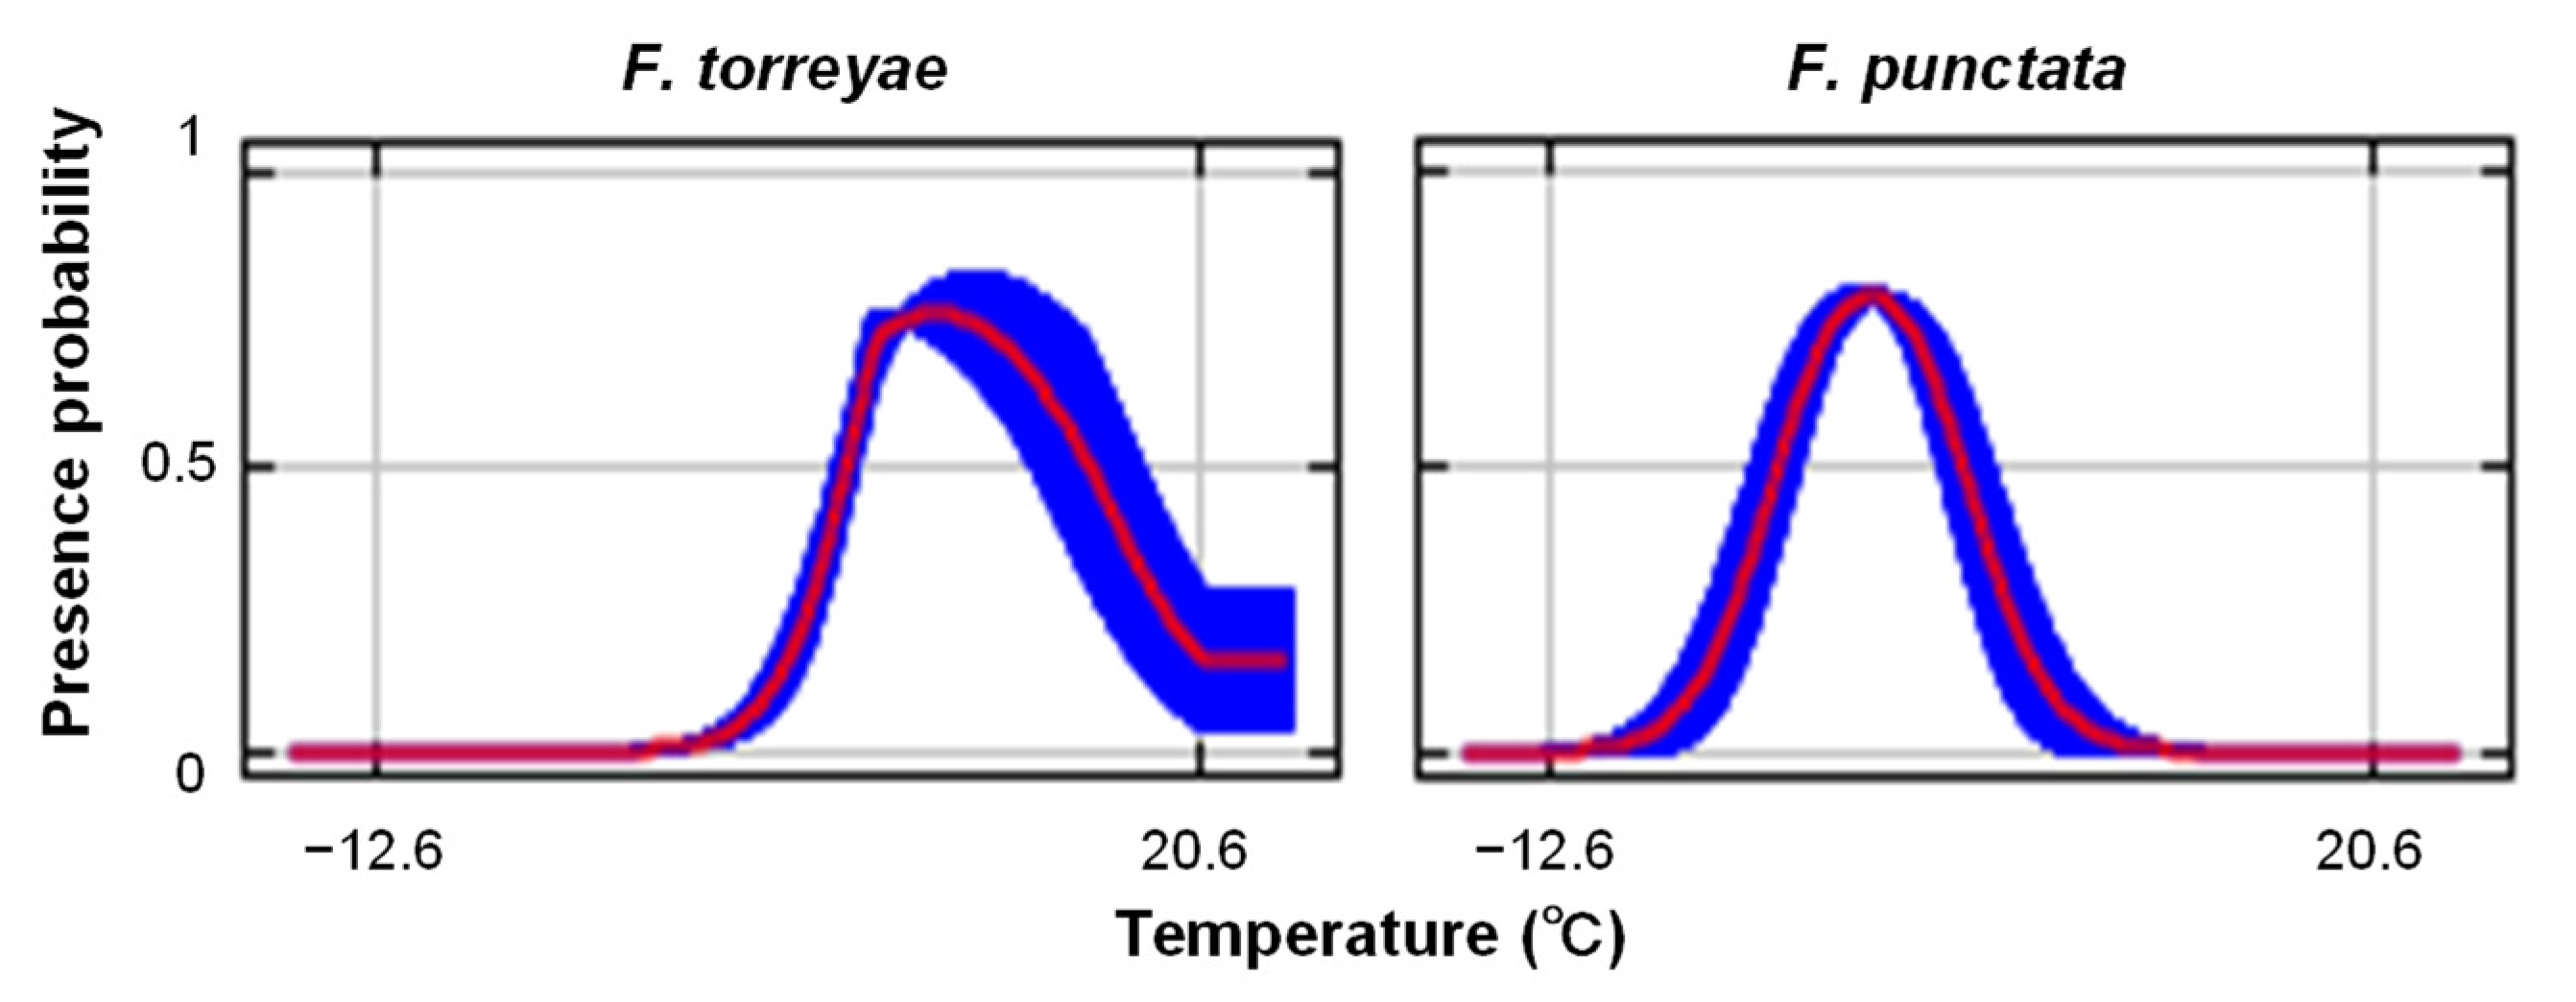
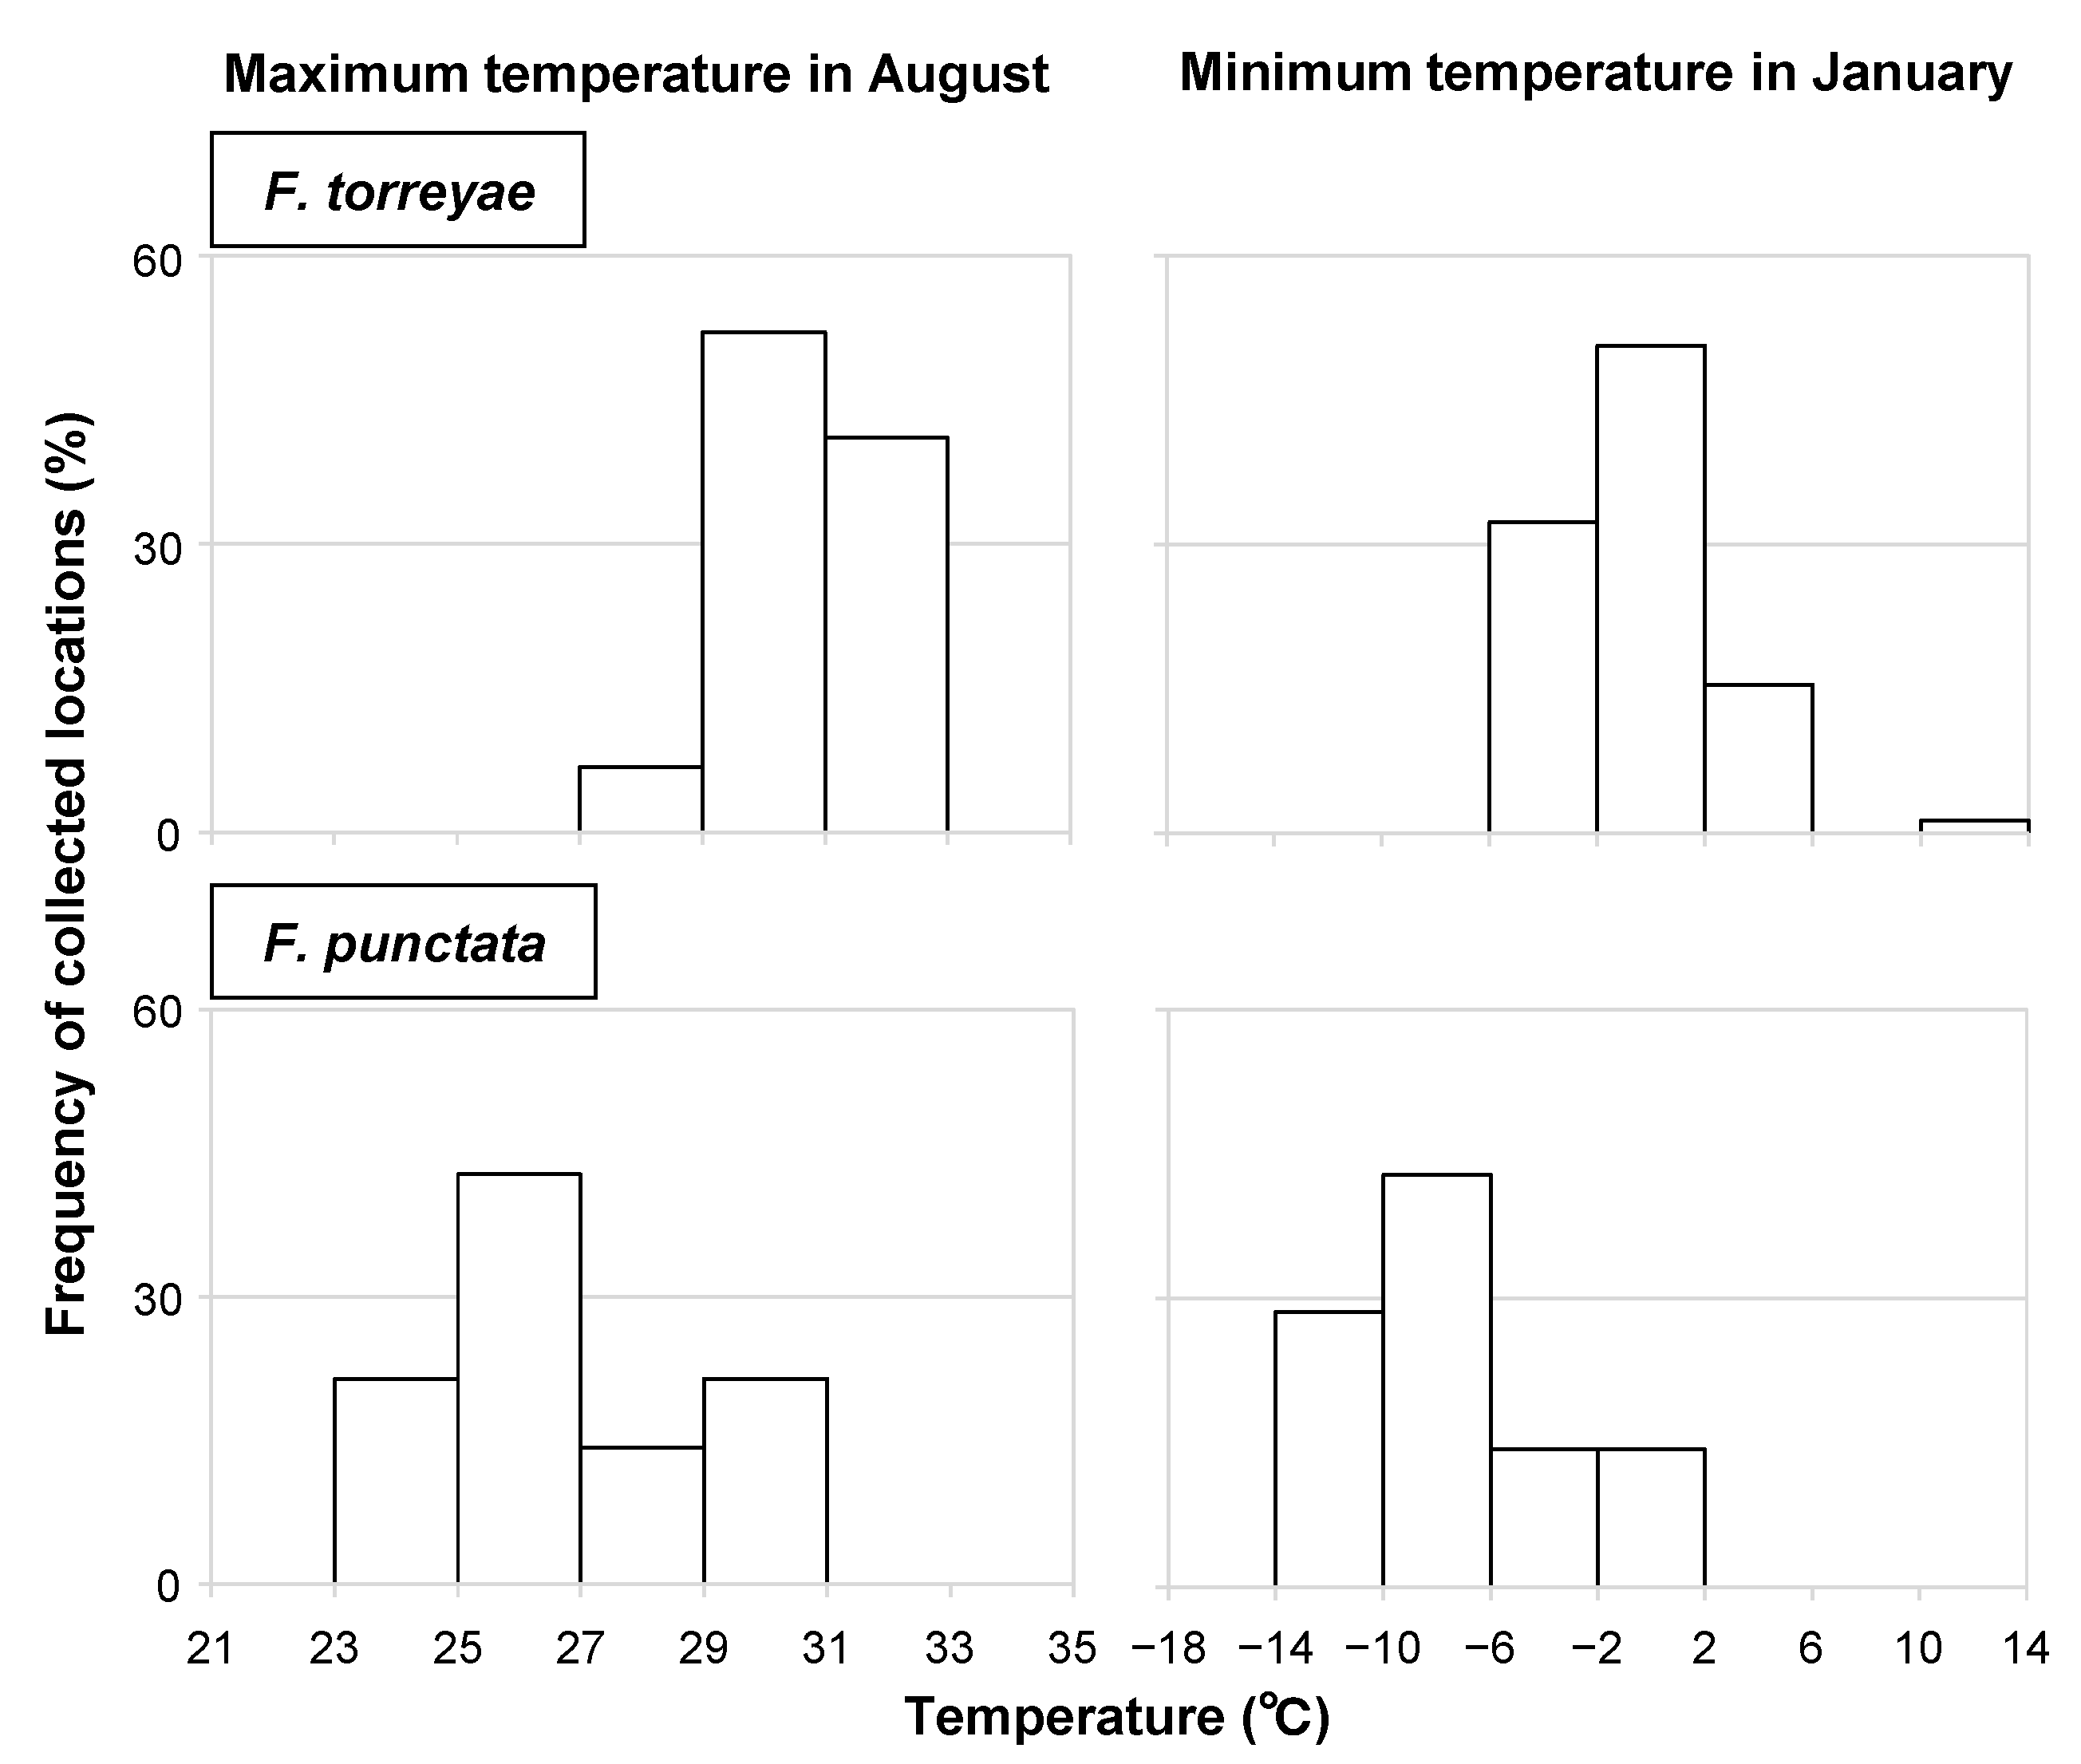
Among the climatic variables, all temperature variables (each monthly and annual average temperature) examined in the analysis had higher gains in the models based on jackknife analysis in the F. torreyae prediction (Figure 2). Meanwhile, monthly average temperatures from December to March had higher gains than other variables in the F. punctata prediction (Figure 2). Figure 3 presents representative patterns of the relationships between the presence probability and these temperature variables that had higher gains. The peaks of the presence probability of F. torreyae appeared at higher temperatures than those of F. punctata (Figure 3). The difference in temperature where the peaks were present between the two species was found in all temperature variables (data not shown). As a general pattern of seasonal climatic changes in Japan, the temperature is highest in August and lowest in January. To detect the limits of temperature ranges at collection locations of the two fungi, we determined the average maximum temperature recorded in August from 1981 to 2010 and the average minimum temperature recorded in January from 1981 to 2010 at the collection locations of these fungi (Figure 4). Fomitiporia torreyae was usually found in areas where the maximum temperature in August was >29 °C, but F. punctata was usually found in areas with maximum temperatures of ≤29 °C. Based on January temperatures, F. torreyae was always found in areas where the minimum temperature was >−6 °C, while F. punctata was often found at minimum temperatures of ≤−6 °C. For both the maximum temperature in August and the minimum temperature in January, temperatures at the collection locations of F. torreyae tended to be higher than those of F. punctata.
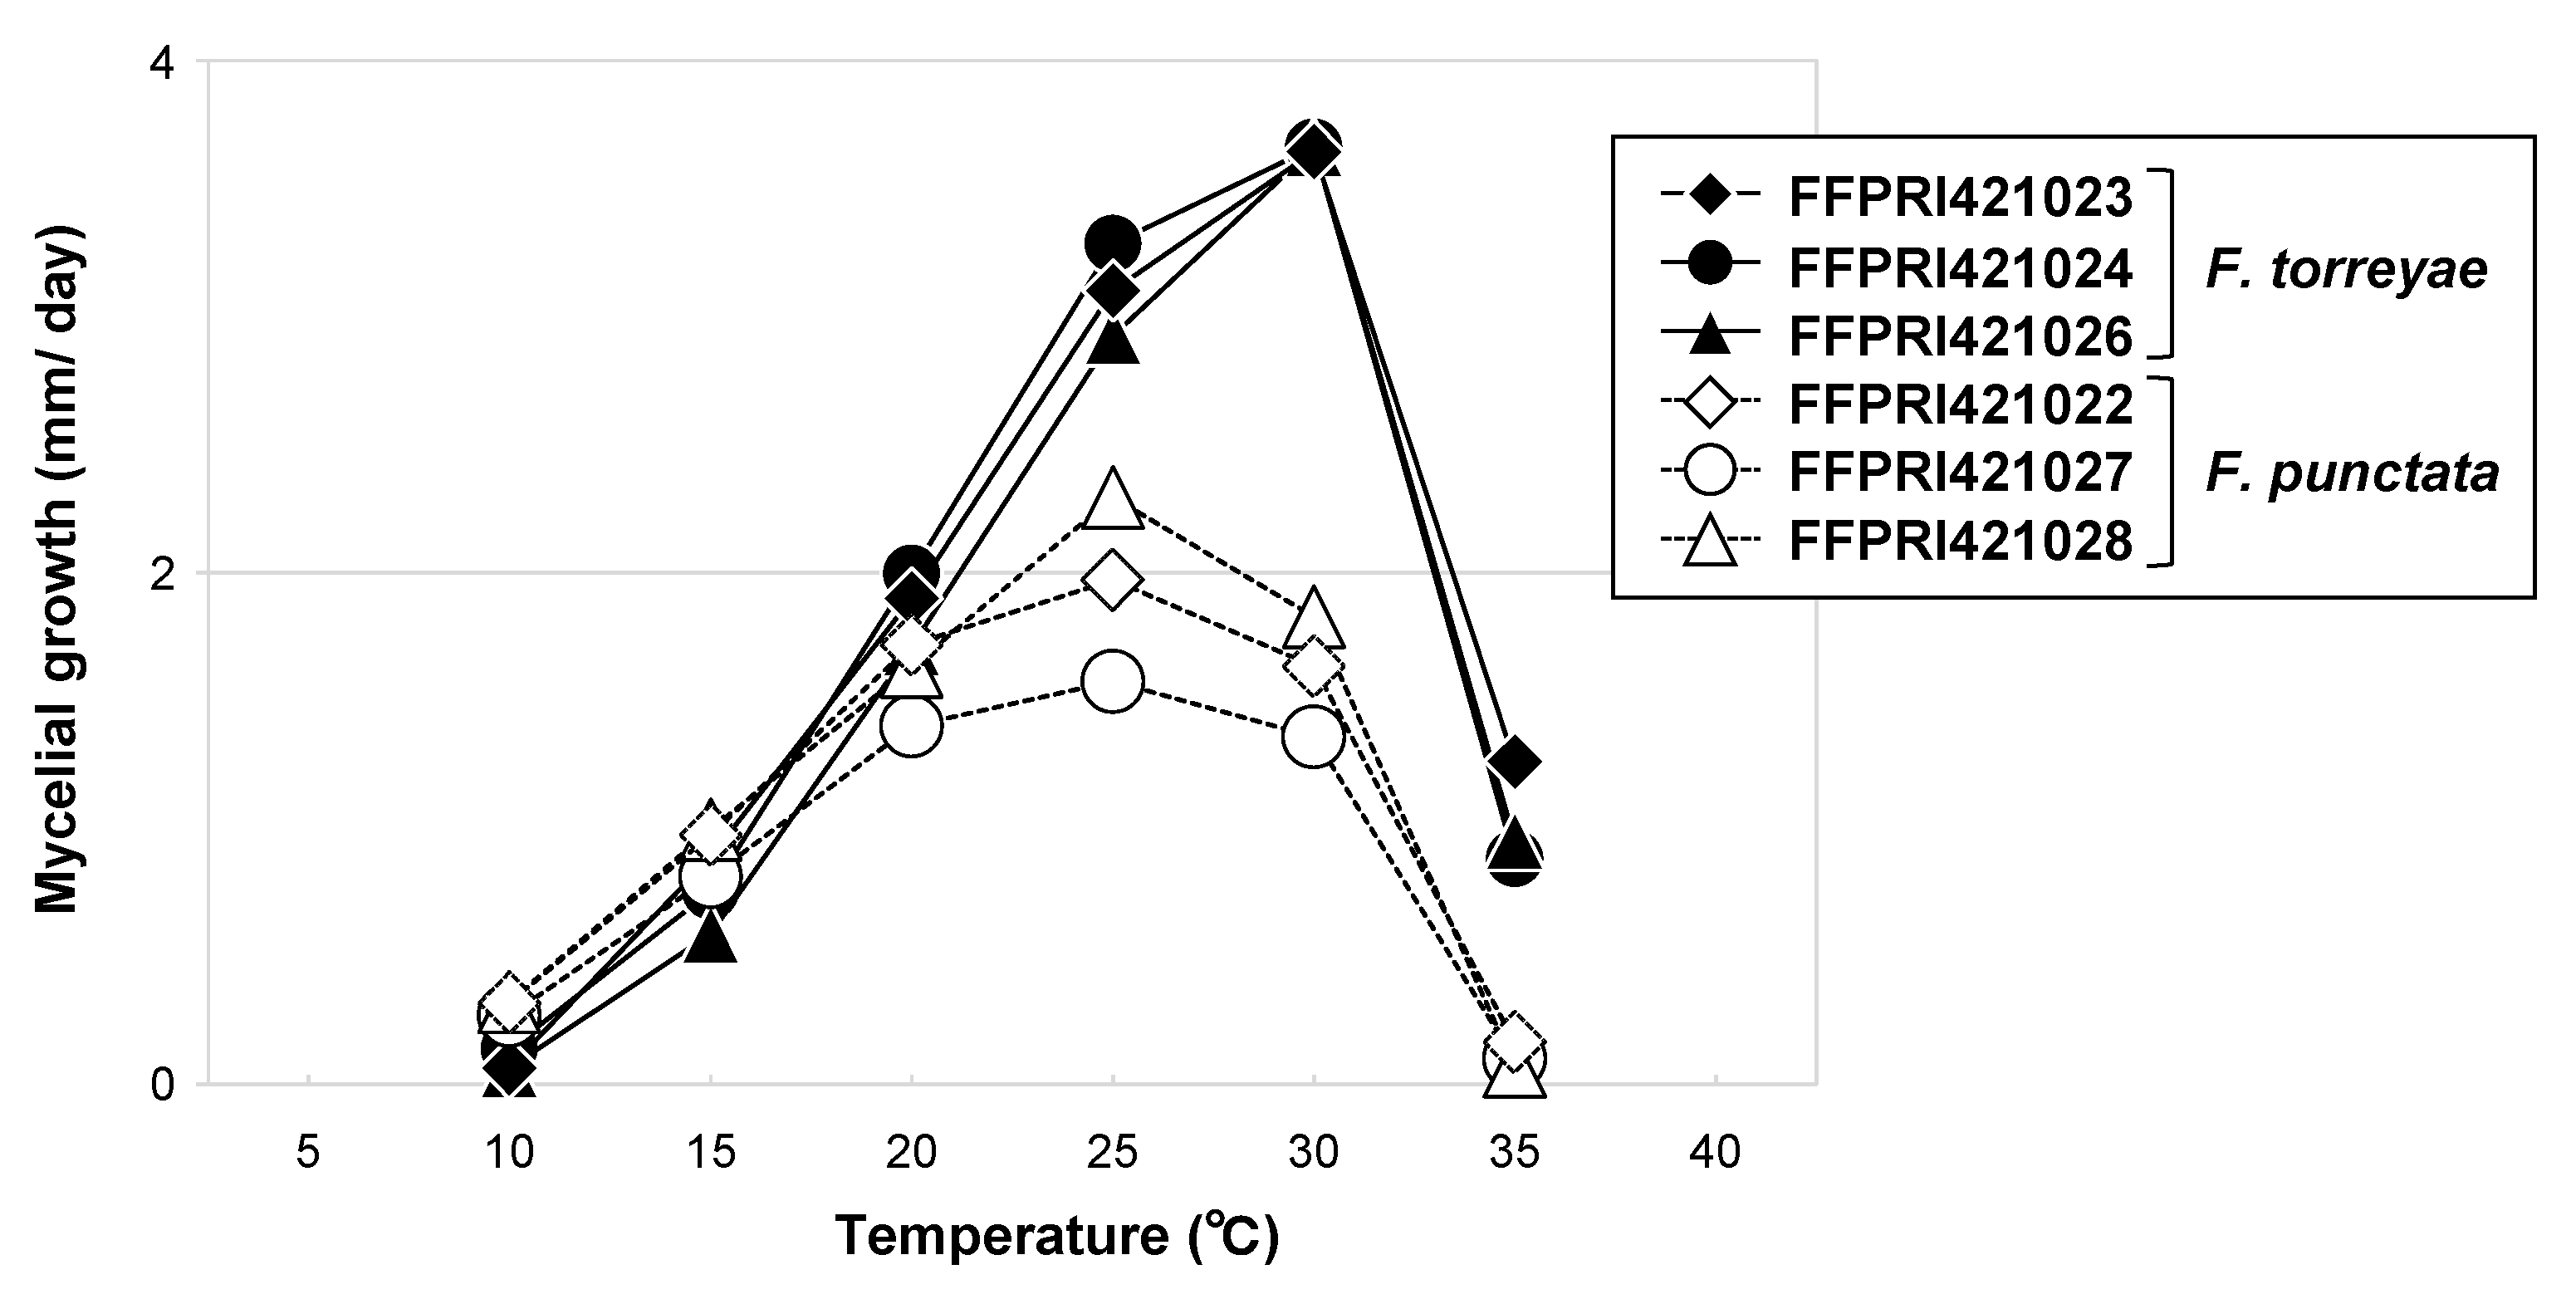
No mycelial growth was observed at 5 °C or 40 °C for either species. The optimal growth temperature was 30 °C for F. torreyae and 25 °C for F. punctata (Figure 5). Fomitiporia torreyae showed distinct mycelial growth at 35 °C, but F. punctata did not. No obvious difference was seen between the growth rates of the two species at 10 °C.
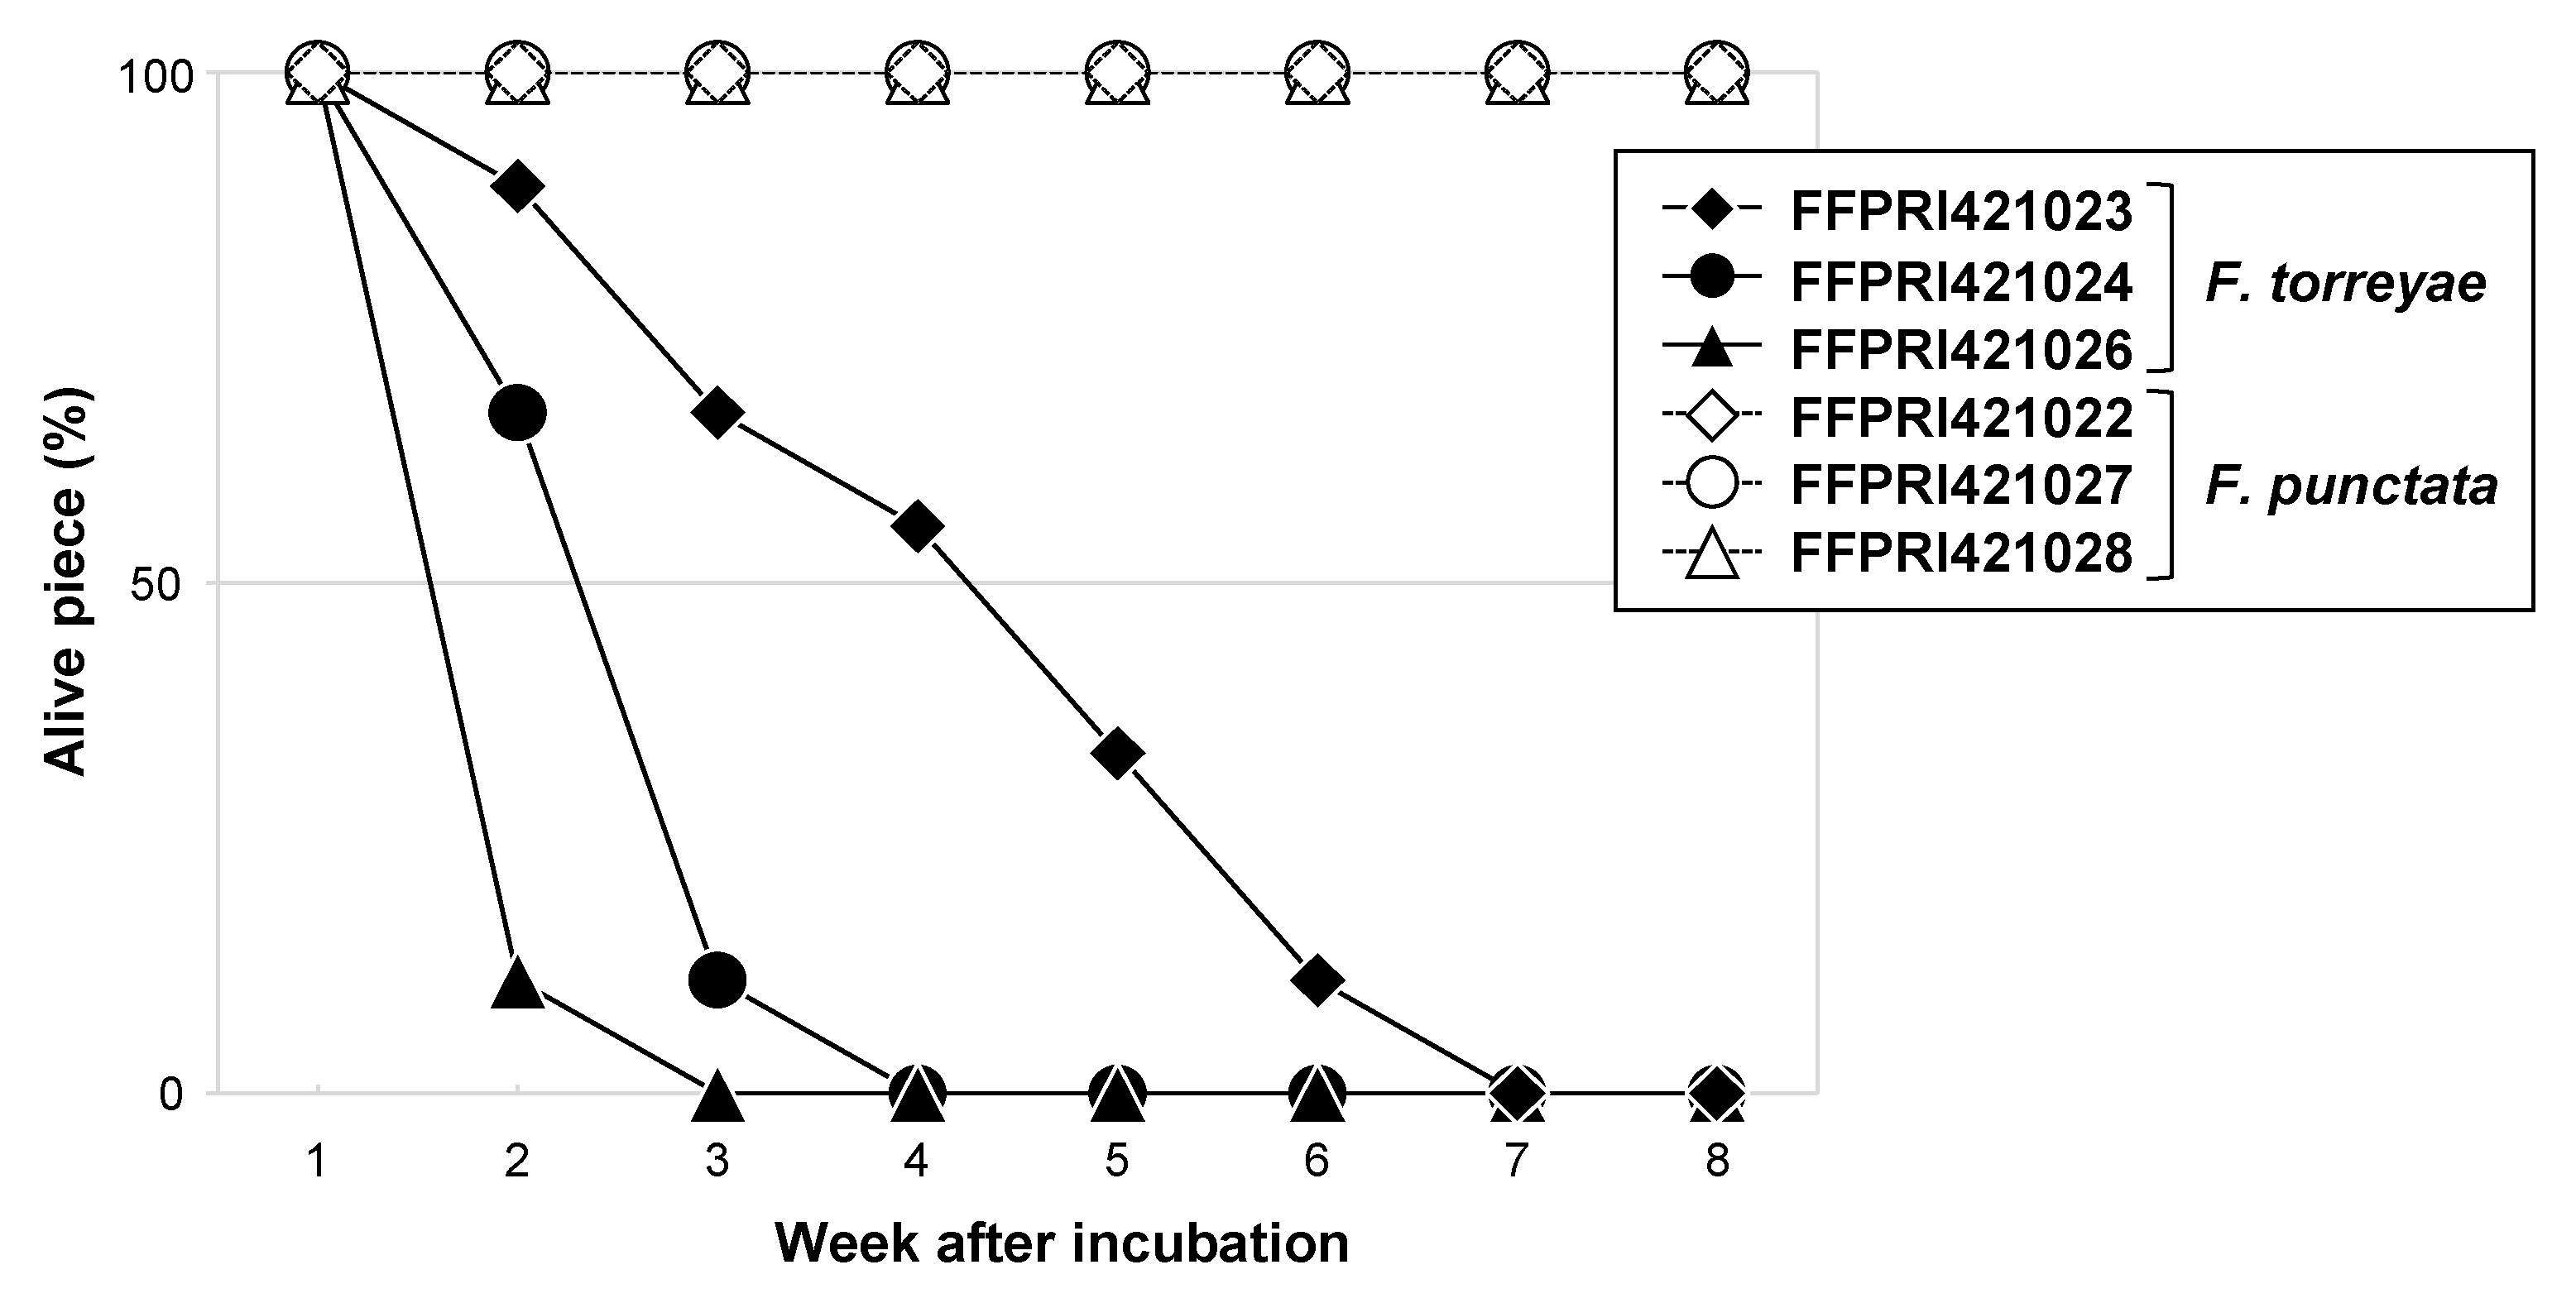
Both species survived at 0 °C for at least 2 months, irrespective of the isolate. Some mycelial pieces of F. torreyae were dead after 2 weeks of incubation at −5 °C, and the numbers of dead pieces increased with longer incubation (Figure 6). Meanwhile, no mycelial pieces of F. punctata died throughout the experiment, and the proportions of live pieces were always higher than those of the F. torreyae isolates.
4. Discussion
We predicted the potential distributions of F. torreyae and F. punctata by analyzing the effects of environmental variables on their distributions using Maxent, revealing temperature as an important factor related to their distribution. We also examined the effects of temperature on their mycelial growth and survival to complement their distribution characteristics. The predicted potential distributions showed that F. torreyae is mainly distributed in warm temperate areas, whereas F. punctata inhabits cool temperate to boreal or mountainous areas. Moreover, jackknife analysis suggested that temperature is a key determinant of their distributions in Japan. This conclusion is also supported by the results of mycelial growth characteristics. All of the collection locations for F. torreyae were situated within areas where the minimum temperature in January was above −6 °C, and its mycelium died when incubated at −5 °C for up to 2 months but survived at 0 °C. Fomitiporia punctata was not recorded from areas where the maximum temperature in August was higher than 31 °C, and its mycelial growth was sparse or not observed above 30 °C but was observed below 30 °C. Although thresholds of accurate temperatures for growth and survival were not examined in this study, the temperature ranges within the collection locations coincided well with the upper or lower limits of the temperatures for the growth and survival for both species. Thus, these results strongly support the prediction by Maxent analyses, indicating that their distributions can be explained by the temperatures at each collection site and temperature thresholds for fungal growth and survival.
Fungal species distribution is possibly affected not only by climatic conditions such as temperature, precipitation, and solar radiation but also by the distributions and conditions of host trees, e.g., [26,27,28,29,30]. The collection records of F. torreyae and F. punctata [7,10,11] suggest that their host and substrate preferences are likely to be broader than those of several wood-decay fungi distributed in temperate areas of Japan [31,32]. Thus, we suggest that their distributions are scarcely affected by host tree distribution. However, other climatic factors including an interaction between temperature and precipitation may affect their distributions as we only included temperature and precipitation variables as environmental variables in the Maxent analyses and, based on a jackknife test, separately evaluated the gain of each variable in the models.
Global warming may affect the phenology and physiology, as well as the geographical distribution, of fungi [33,34]. Generally, the distribution of a species is expected to shift poleward in latitude and upward in elevation with the warming trend. This study suggests that temperature may be a major determinant of the distribution of both species. Thus, global warming could affect their distributions, and F. torreyae may spread to northern and mountainous parts of Japan. Since both F. torreyae and F. punctata are tree pathogens, caution may be required due to shifting diseased areas by global warming. Because these fungi cause similar diseases on Japanese pear [5,8], F. torreyae may expand its distribution and perhaps displace F. punctata as the cause of Japanese pear dwarf in northern areas through global warming.
In this study, the AUC values of the Maxent predictions for both F. torreyae and F. punctata were near or above 0.9, suggesting that these predictions are accurate. However, sampling bias could be present in the records, especially those of F. torreyae, because most samples of this fungus were collected at relatively accessible locations such as parks, orchards, and urban forests. In Maxent analyses, sampling bias can cause the models to overfit environmental biases, and predicted distributions can be underestimated [35]. In fact, the high-probability areas of F. torreyae predicted in this study seemed to be restricted around the collection locations. Nevertheless, further field surveys for explorations of the two fungi may improve predictions and clarify their actual distributions. For further surveys, the maps provided by this study may help to find unreported diseased sites by these fungi. Our Maxent analyses extracted high-probability areas of distributions without collection records nearby, such as coastal areas along the Pacific Ocean in the Chubu region for F. torreyae and the northeastern part of the Tohoku region for F. punctata (Figure 1 and Figure S1).
This is the first report to predict fungal distribution on the basis of a species distribution model and evaluation of fungal physiological characteristics. The results of both methodologies suggest that temperature is a major determinant of the distributions of F. torreyae and F. punctata in Japan. Moreover, these results may support previous suggestions that F. torreyae is distributed in warm temperate to subtropical areas, while F. punctata is widespread in cool temperate to boreal areas [7], and that distribution can be a key characteristic for these fungi. This study provides several ecological and physiological characteristics of the two fungi, and this information shows that a future shift in the diseased areas by global warming can be predicted.
Supplementary Materials
The following are available online at https://0-www-mdpi-com.brum.beds.ac.uk/article/10.3390/f12111580/s1, Figure S1: Collection locations of Fomitiporia torreyae (blue circle) and Fomitiporia punctata (orange circle) used in the Maxent analyses; Table S1: Latitude and longitude data of the collection locations of Fomitiporia torreyae and Fomitiporia punctata used in Maxent analyses.
Author Contributions
Conceptualization, M.T., H.M. and T.H.; methodology, M.T. and H.M.; formal analysis, M.T. and H.M.; investigation, M.T. and H.M.; resources, M.T., H.M. and T.H.; data curation, M.T., H.M. and T.H.; writing—original draft preparation, M.T., H.M. and T.H.; writing—review and editing, M.T., H.M. and T.H. All authors have read and agreed to the published version of the manuscript.
Funding
This research was funded by Research Grant #201708 and #202005 of the Forestry and Forest Products Research Institute, Tsukuba, Ibaraki Prefecture, Japan.
Data Availability Statement
The latitude and longitude data used in this study are available in Table S1. Other data presented in this study are available on request from the corresponding author.
Acknowledgments
We thank Kazuko Komaru and Atsuko Matsumoto of the Forestry and Forest Product Research Institute for their assistance with molecular identification.
Conflicts of Interest
The authors declare no conflict of interest.
References
- Imazeki, R. A new disease of Sanbu-sugi, “Hi-akagaresei-mizogusare-byo” and its ecological prevention. For. Pest News 1960, 9, 240–245. (In Japanese) [Google Scholar]
- Aoshima, K.; Hayashi, Y.; Yonebayashi, H.; Kondo, H. “Hi-akagaresei-mizogusare-byo”, trunk rot on Sanbu-sugi. Trans. Jpn. For. Soc. 1964, 75, 394–397. (In Japanese) [Google Scholar]
- Terashima, Y. Influence of stem rot pathogen Fomitiporia sp. on “Sanbu-sugi” cultivar of the Japanese cedar Cryptomeria japonica. J. Wood Sci. 2013, 59, 80–87. [Google Scholar] [CrossRef]
- Sakuma, T.; Takamura, N.; Ochiai, M.; Kobayashi, T.; Abe, Y.; Tanaka, H.; Takanashi, K. Occurrence of Hypoxylon heart wood rot and pear dwarf on Japanese pear (Pyrus pyriforia Nakai). Bull. Fruit Tree Res. Stn. 1993, 24, 45–59. [Google Scholar]
- Shiota, A.; Kaneko, Y.; Nakamura, H.; Yasuda, F.; Oshida, M. Occurrence of Japanese pear dwarf symptom by Inoculation with Phellinus species isolated from diseased trees. Jpn. J. Phytopathol. 2008, 74, 37. (In Japanese) [Google Scholar]
- Hattori, T.; Tanaka, M.; Kuriu, T. Dieback of Sciadopitys verticillata caused by Fomitiporia sp. Abstr. Annu. Meet. For. Soc. Jpn. 2012, 123, pb053. (In Japanese) [Google Scholar]
- Ota, Y.; Hattori, T.; Nakamura, H.; Terashima, Y.; Lee, S.S.; Miyuki, Y.; Sotome, K. Taxonomy and phylogenetic position of Fomitiporia torreyae, a causal agent of trunk rot on Sanbu-sugi, a cultivar of Japanese cedar (Cryptomeria japonica) in Japan. Mycologia 2014, 106, 66–76. [Google Scholar] [CrossRef]
- Kaneko, Y.; Iwanami, Y.; Shiota, A.; Suzuki, T.; Suzuki, K.; Miyuki, Y.; Ushio, S. Reproduction of Japanese pear dwarf symptom by inoculation with Fomitiporia punctata isolates. Jpn. J. Phytopathol. 2014, 80, 24. (In Japanese) [Google Scholar]
- Yamaguchi, T. Sap rot and death of Prunus sargentii inoculated with Fomitiporia punctata. Abstr. Annu. Meet. For. Soc. Jpn. 2012, 123, pb041. (In Japanese) [Google Scholar]
- Dai, Y.C. Hymenochaetaceae (Basidiomycota) in China. Fungal Divers. 2010, 45, 131–343. [Google Scholar] [CrossRef]
- Nakamura, H.; Hattori, T. Host tree species of Fomitiporia torreyae among garden trees and the frequency of the occurrences. For. Pests 2020, 69, 33–39. (In Japanese) [Google Scholar]
- Terashima, Y. Physiological characteristics of the trunk sap rot pathogen Fomitiporia sp. on the “Sanbu-sugi” cultivar of Cryptomeria japonica. Mycoscience 2013, 54, 171–177. [Google Scholar] [CrossRef]
- Elith, J.; Leathwick, J.R. Species distribution models: Ecological explanation and prediction across space and time. Annu. Rev. Ecol. Evol. Syst. 2009, 40, 677–697. [Google Scholar] [CrossRef]
- Fink, S.; Gross, A.; Senn-Irlet, B.; Scheidegger, C. Citizen science data predict high potential for macrofungal refugia outside protected riparian areas. Fungal Ecol. 2021, 49, 100981. [Google Scholar] [CrossRef]
- Kujawska, M.B.; Rudawska, M.; Stasińska, M.; Pietras, M.; Leski, T. Distribution and ecological traits of a rare and threatened fungus Hericium flagellum in Poland with the prediction of its potential occurrence in Europe. Fungal Ecol. 2021, 50, 101035. [Google Scholar] [CrossRef]
- Phillips, S.J.; Anderson, R.P.; Schapire, R.E. Maximum entropy modeling of species geographic distributions. Ecol. Model. 2006, 190, 231–259. [Google Scholar] [CrossRef] [Green Version]
- Elith, J.; Graham, C.H.; Anderson, R.P.; Dudík, M.; Ferrier, S.; Guisan, A.; Hijmans, R.J.; Huettmann, F.; Leathwick, J.R.; Lehmann, A.; et al. Novel methods improve prediction of species’ distributions from occurrence data. Ecography 2006, 29, 129–151. [Google Scholar] [CrossRef] [Green Version]
- Wisz, M.S.; Hijimans, R.J.; Li, J.; Peterson, A.T.; Graham, C.H.; Guisan, A.; NCEAS Predicting Species Distributions Working Group. Effects of sample size on the performance of species distribution models. Divers. Distrib. 2008, 14, 763–773. [Google Scholar] [CrossRef]
- Kaneko, Y.; Shiota, A.; Suzuki, K.; Suzuki, T.; Miyuki, Y.; Ushio, S. The circumstances of infection and distribution of Fomitiporia sp., a causal fungus of Japanese pear dwarf in Chiba prefecture. Annu. Rep. Kanto-Tosan Plant Prot. Soc. 2013, 60, 67–70. (In Japanese) [Google Scholar]
- Suzuki, K.; Shiota, A.; Kaneko, Y.; Suzuki, T. Specific detection of the dwarf Japanese pear pathogen, Fomitiporia torreyae, by the polymerase chain reaction. Annu. Rep. Kanto-Tosan Plant Prot. Soc. 2015, 62, 67–72. (In Japanese) [Google Scholar]
- QGIS.org. QGIS Geographical Information System. Available online: http://www.qgis.org (accessed on 19 August 2021).
- De Marco, J.P.; Nóbrega, C.C. Evaluating collinearity effects on species distribution models: An approach based on virtual species simulation. PLoS ONE 2018, 13, e0202403. [Google Scholar] [CrossRef]
- Feng, X.; Park, D.S.; Liang, Y.; Pandey, R.; Papeş, M. Collinearity in ecological niche modeling: Confusions and challenges. Ecol. Evol. 2019, 9, 10365–10376. [Google Scholar] [CrossRef] [Green Version]
- Merow, C.; Smith, M.J.; Silander, J.A., Jr. A practical guide to MaxEnt for modeling species’ distributions: What it does, and why inputs and settings matter. Ecography 2013, 36, 1058–1069. [Google Scholar] [CrossRef]
- Phillips, S.; Dudík, M.; Schapire, R.E. Maxent Software for Modeling Species Niches and Distributions. Available online: http://biodiversityinformatics.amnh.org/open_source/maxent/ (accessed on 18 May 2021).
- Wollan, A.K.; Bakkestuen, V.; Kauserud, H.; Gulden, G.; Halvorsen, R. Modelling and predicting fungal distribution patterns using herbarium data. J. Biogeogr. 2008, 35, 2298–2310. [Google Scholar] [CrossRef]
- Yuan, H.S.; Wei, Y.L.; Wang, X.G. Maxent modeling for predicting the potential distribution of Sanghuang, and important group of medical fungi in China. Fungal Ecol. 2015, 17, 140–145. [Google Scholar] [CrossRef]
- Mair, L.; Harrison, P.J.; Jönsson, M.; Löbel, S.; Nordén, J.; Siitonen, J.; Lämås, T.; Lundström, A.; Snäll, T. Evaluating citizen science data for forecasting species responses to national forest management. Ecol. Evol. 2017, 7, 368–378. [Google Scholar] [CrossRef] [Green Version]
- Gange, A.C.; Heegaard, E.; Boddy, L.; Andrew, C.; Kirk, P.; Halvorsen, R.; Kuyper, T.W.; Bässler, C.; Diez, J.; Heliman-Clausen, J.; et al. Trait-dependent distributional shifts in fruiting of common British fungi. Ecography 2018, 41, 51–61. [Google Scholar] [CrossRef]
- Pietras, M.; Litkowiec, M.; Gołębiewska, J. Current and potential distribution of the ectomycorrhizal fungus Suillus lakei ((Murrill) A.H. Sm. and Thiers) in its invasion range. Mycorrhiza 2018, 28, 467–475. [Google Scholar] [CrossRef] [PubMed] [Green Version]
- Hattori, T. Diversity of wood-inhabiting polypores in temperate forests with different vegetation types in Japan. Fungal Divers. 2005, 18, 73–88. [Google Scholar]
- Yamashita, S.; Hattori, T.; Abe, H. Host preference and species richness of wood-inhabiting aphyllophoraceous fungi in a cool temperate area of Japan. Mycologia 2010, 102, 11–19. [Google Scholar] [CrossRef] [PubMed]
- Boddy, L.; Büntgen, U.; Egli, S.; Gange, A.C.; Heegaard, E.; Kirk, P.M.; Mohammad, A.; Kauserud, H. Climate variation effects on fungal fruiting. Fungal Ecol. 2014, 10, 20–33. [Google Scholar] [CrossRef]
- Andrew, C.; Diez, J.; James, T.Y.; Kauserud, H. Fungarium specimens: A largely untapped source in global change biology and beyond. Phil. Trans. R. Soc. B 2018, 374, 20170392. [Google Scholar] [CrossRef] [PubMed] [Green Version]
- Boria, R.A.; Olson, L.E.; Goodman, S.M.; Anderson, R.P. Spatial filtering to reduce sampling bias can improve the performance of ecological niche models. Ecol. Model. 2014, 275, 73–77. [Google Scholar] [CrossRef]
Figure 1.
Presence probability of Fomitiporia torreyae and Fomitiporia punctata predicted by Maxent. The vertical scale bar indicates the mean of the probability (100 bootstrap replicates) from 0 (blue, low probability) to 1 (red, high).
Figure 1.
Presence probability of Fomitiporia torreyae and Fomitiporia punctata predicted by Maxent. The vertical scale bar indicates the mean of the probability (100 bootstrap replicates) from 0 (blue, low probability) to 1 (red, high).

Figure 2.
Regularized training gain in Maxent models with each environmental variable alone. The gains were calculated by jackknife analysis for variable importance. Values are the mean + standard deviation (100 bootstrap replicates). Monthly and annual average temperature and monthly and annual precipitation were used as variables for the Maxent analyses and are shown on the x-axis.

Figure 3.
Relationships between presence probability and average temperature in March. Values were calculated in Maxent models using each variable alone. Red lines and blue shading show the mean of 100 bootstrap replicates and one standard deviation, respectively.
Figure 3.
Relationships between presence probability and average temperature in March. Values were calculated in Maxent models using each variable alone. Red lines and blue shading show the mean of 100 bootstrap replicates and one standard deviation, respectively.

Figure 4.
Frequency of collection locations of Fomitiporia torreyae and Fomitiporia punctata at different levels of maximum temperature in August and minimum temperature in January.
Figure 4.
Frequency of collection locations of Fomitiporia torreyae and Fomitiporia punctata at different levels of maximum temperature in August and minimum temperature in January.

Figure 5.
Mycelial growth of Fomitiporia torreyae and Fomitiporia punctata isolates at different temperatures. Values indicate means (n = 3).
Figure 5.
Mycelial growth of Fomitiporia torreyae and Fomitiporia punctata isolates at different temperatures. Values indicate means (n = 3).

Figure 6.
Survival of Fomitiporia torreyae and Fomitiporia punctata isolates at −5 °C during 8 weeks of incubation. We used three plates per isolate; three mycelial pieces excised from each plate were tested for survival. Values indicate the proportion of live pieces to total tested pieces (n = 9) for each isolate.


Table 1.
Origins of Fomitiporia torreyae and F. punctata isolates used in growth experiments.
| Species | Isolate No. | Location | Substrate | Year of Isolation | GenBank Accession No. of ITS Region |
|---|---|---|---|---|---|
| Fomitiporia torreyae | FFPRI 421023 (WD2641) | Kibune, Kyoto | decayed wood of hardwood | 2011 | LC651667, LC651668 |
| FFPRI 421024 | Kasumigaura, Ibaraki | decayed wood of Cryptomeria japonica | 2019 | LC651669 | |
| FFPRI 421026 | Sammu, Chiba | decayed wood of Cryptomeria japonica | 2019 | LC651671 | |
| F. punctata | FFPRI 421022 (WD2055) | Chino, Nagano | decayed wood of hardwood | 1998 | AB777696 * |
| FFPRI 421027 | Wajima, Ishikawa | decayed wood of conifer | 2019 | LC651672 | |
| FFPRI 421028 | Chihibu, Saitama | decayed wood of Cerasus sp. | 2020 | LC651673 |
* A sequence was analyzed by Ota et al. (2014).
Publisher’s Note: MDPI stays neutral with regard to jurisdictional claims in published maps and institutional affiliations. |
© 2021 by the authors. Licensee MDPI, Basel, Switzerland. This article is an open access article distributed under the terms and conditions of the Creative Commons Attribution (CC BY) license (https://creativecommons.org/licenses/by/4.0/).
Share and Cite
MDPI and ACS Style
Torii, M.; Masuya, H.; Hattori, T. Temperature Characteristics of Two Fomitiporia Fungi Determine Their Geographical Distributions in Japan. Forests 2021, 12, 1580. https://0-doi-org.brum.beds.ac.uk/10.3390/f12111580
AMA Style
Torii M, Masuya H, Hattori T. Temperature Characteristics of Two Fomitiporia Fungi Determine Their Geographical Distributions in Japan. Forests. 2021; 12(11):1580. https://0-doi-org.brum.beds.ac.uk/10.3390/f12111580
Chicago/Turabian StyleTorii, Masato, Hayato Masuya, and Tsutomu Hattori. 2021. "Temperature Characteristics of Two Fomitiporia Fungi Determine Their Geographical Distributions in Japan" Forests 12, no. 11: 1580. https://0-doi-org.brum.beds.ac.uk/10.3390/f12111580
Note that from the first issue of 2016, this journal uses article numbers instead of page numbers. See further details here.