Article

Phenotypic Diversity of Almond-Leaved Pear (Pyrus spinosa Forssk.) along Eastern Adriatic Coast

1
Institute of Forest Genetics, Dendrology and Botany, Faculty of Forestry and Wood Technology, University of Zagreb, Svetošimunska cesta 23, HR-10000 Zagreb, Croatia
2
Department of Biology, Faculty of Science, University of Zagreb, Marulićev trg 9a, HR-10000 Zagreb, Croatia
3
Centre of Excellence for Biodiversity and Molecular Plant Breeding, Svetošimunska cesta 25, HR-10000 Zagreb, Croatia
4
Department for Seed Science and Technology, Faculty of Agriculture, University of Zagreb, Svetošimunska cesta 25, HR-10000 Zagreb, Croatia
5
Institute of Forest Protection and Wildlife Management, Faculty of Forestry and Wood Technology, University of Zagreb, Svetošimunska cesta 23, HR-10000 Zagreb, Croatia
6
Croatian Forest Research Institute, Cvjetno naselje 41, HR-10450 Jastrebarsko, Croatia
7
Ministry of Economy and Sustainable Development, Institute for Environment and Nature, Nature Sector, Radnička cesta 80, HR-10000 Zagreb, Croatia
8
Institute of Adriatic Crops and Karst Reclamation, Put Duilova 11, HR-21000 Split, Croatia
*
Author to whom correspondence should be addressed.
Submission received: 29 October 2021 / Revised: 19 November 2021 / Accepted: 23 November 2021 / Published: 25 November 2021
(This article belongs to the Special Issue Population Genetic and Morphological Diversity of Woody Plants)

Abstract

:
Almond-leaved pear (Pyrus spinosa Forssk., Rosaceae) is a scientifically poorly researched and often overlooked Mediterranean species. It is an insect-pollinated and animal-dispersed spiny, deciduous shrub or a small tree, with high-quality wood and edible fruits. The aim of the study was to assess the phenotypic diversity of almond-leaved pear in the eastern Adriatic region. The examination of phenotypic diversity was based on a morphometric analysis of 17 populations using ten phenotypic traits of leaves. Varieties of multivariate statistical analyses were conducted to evaluate the within- and among-population diversity. In addition, the Mantel tests were used to test the correlations between geographic, environmental, and phenotypic differences among populations. High phenotypic variability was determined both among and within the studied populations. Leaf-size-related traits proved to be the most variable ones, in contrast to more uniform leaf shape traits. Furthermore, three groups of populations were detected using multivariate statistical analyses. The first group included trees from northern- and southernmost populations characterized by high annual precipitation. However, the trees from the second and third group were highly overlapped without a clear geographical pattern. In addition, we revealed that both environmental and geographical interactions proved to be responsible for the patterns of phenotypic variation between almond-leaved pear populations, indicating significant isolation by environment (IBE) and isolation by distance (IBD) patterns. Overall, our results provide useful information about phenotypic diversity of almond-leaved pear populations for further conservation, breeding, and afforestation programs.

1. Introduction

The genus Pyrus L., family Rosaceae, belongs to the subtribe Pyrinae that corresponds to the long-recognized subfamily Maloideae in which the fruit type is generally a pome [1,2]. The genus Pyrus is believed to have originated in Central Asia, the mountainous regions of western and southern China, from Asia Minor to India, and further diversified and moved both in eastern and western directions from the primary center of origin [3]. Today, species from this genus are naturally distributed in Europe, temperate Asia, and the mountainous area of northwest Africa [4,5]. With many ecological and human-related beneficial properties, all pear species are considered to be noble hardwood species. Early humans already recognized the value of pears as a source of food, and selection for improved fruit characters has been practiced for several thousand years. Today, pears are, along with apples, one of the most important deciduous tree fruit crops in the world [6]. It is estimated that there are more than 3000 pear varieties, with significant economic importance in temperate zones worldwide [7]. Pyrus is genetically quite a diverse genus, with considerable morphological variability and physiological adaptations [8]. Since pears hybridize easily, both cultivated and wild species [9,10,11], it is very difficult to determine the specific number of species and intermediate forms within this genus. The estimated number of species varies from 20 to 80 [1,4,9,10,12,13,14,15,16]. According to Bell and Itai [4], there are eight native species of pears in Europe, including naturally occurring interspecific hybrid taxa. Pear taxa native to Europe can be divided into the European and Circum-Mediterranean group [4]. Of our interest is a species associated with the latter group, almond-leaved pear (P. spinosa Forssk.), which is distributed in the Mediterranean Europe region, western Anatolia, Iran, and Bulgaria [4,15].
Almond-leaved pear is a spiny, deciduous shrub or a small tree that grows up to 6 (10) m. Morphologically, it is characterized by narrowly lanceolate or elliptic to obovate, 2.5–7 cm long and 1–3 cm wide leaves. The leaf edge is entirely or moderately crenate towards the apex, while leaf color varies from green on the upper side, to blue-green from below. The petiole is either absent or up to 1–2 cm long [15,17]. White and insect-pollinated flowers occur in late April to early May. The fruit, which ripens late in autumn, is a pome up to 3 cm big with a peduncle of the same length or longer. It is edible but astringent, containing many large sclereids [18,19,20].
There are many botanical synonyms and described varieties and forms [21,22] of almond-leaved pear, which can cause confusion. Today, almond-leaved pear is often described as P. amygdaliformis Vill. [4,17,22], which is considered conspecific with P. spinosa [23]. Furthermore, additional confusion might be caused by the synonym P. nivalis Lindl., while P. nivalis Jacq. is the accepted name for another species. Other synonyms include P. amygdaloides Link, P. angustifolia Decne. P. parviflora Desf., and Crataegus amygdaliformis (Vill.) Chalon. However, according to Zohary [24], it is possible that the name P. spinosa is applied to an entire group of morphologically similar yet different species. On the other hand, it is sometimes quite difficult to distinguish this species from other closely related narrow-leaved pear species from South-East Europe and Western Asia: P. elaeagnifolia Pall., P. nivalis, P. salicifolia Pall., and P. syriaca Boiss. All of the above-mentioned species have overlapping phenotypes with regard to leaf shape (lanceolate or elliptical leaves) and level of hairiness. Regardless, it is suggested that the narrow leaves in Pyrus are the result of the mesomorphic pear species adaptation to xerophytic habitats [25]. Evolution from broad- to narrow-shaped leaves in Pyrus, probably via intermediate-shaped leaves, has been confirmed by Korotkova et al. [26].
From an ecological point of view, the almond-leaved pear is a xerophyle species, with a high level of adaptability to different climatic and soil conditions, including extreme conditions like dry, warm, and degraded habitats [19,24,27,28]. It grows on sandy, clay, stony, and calcareous soils [7,29], sometimes even with a high salt level [30]. Almond-leaved pear can be found from the sea level to about 1000 m.a.s.l., whereas, on higher elevations, it is adapted to cold and snowy conditions as well [15,19]. This species mainly grows in discontinuous, widely spaced bush associations with open spaces in Mediterranean forests, usually called garrigue [24].
So far, various Pyrus species have been the subject of scientific research, mostly the economically important taxa such as P. pyraster (L.) Burgsd. [16,31,32,33], P. communis L. [34,35,36,37,38], P. pyrifolia (Burm.f.) Nakai [39,40], and P. ussuriensis Maxim. ex Rupr. [41,42]. To the best of our knowledge, there has been no research on the almond-leaved pear population variability to date. Scientific research on almond-leaved pear is rare [43] and mostly oriented towards its usage as a rootstock in the Mediterranean area [19,30]. However, more attention should be given to this pear species because of its valuable wood and edible fruits, as well as its great role in ecosystems, since many species of mammals feed on its fruit, such as foxes, badgers, and martens [44,45]. Furthermore, the possibility of its application in the afforestation of burned and risk areas in the Mediterranean should be examined, as it is one of the few species that tolerate repeated passages of fire (personal observations).
In the present study, the diversity of almond-leaved pear populations along the eastern Adriatic coast, one of the Mediterranean hotspots of biodiversity, was examined on the leaf material from 17 populations. Our main objectives were (1) to determine the intra- and interpopulation phenotypic diversity of almond-leaved pear and (2) to test whether the patterns of phenotypic divergence across the studied populations are better explained by geographical distances (isolation by distance—IBD) or by environment differentiation (isolation by environment—IBE). We hypothesized that (1) phenotypic variability was higher within populations than among them and (2) the influence of geographical and environmental factors has a positive relationship with phenotypic divergences of populations; therefore, we expected significant isolation by distance (IBD) and by environment (IBE).

2. Materials and Methods

2.1. Plant Material and Studied Leaf Traits

The material for this research was collected from 17 natural populations of almond-leaved pear along the eastern Adriatic coast (Figure 1, Table S1). This area is geomorphologically unique in the world and mostly karstic, with tectonically uplifted, rocky, and steep coastlines with a pronounced anthropogenic influence throughout history [46]. Belonging to the Mediterranean region, the covered area is characterized by hot drought summer periods with a cool and wet winter period [47].
In each of the studied populations, leaf morphometric material was collected from ten trees/shrubs. Leaves were collected only from short shoots, on the external, sunlit part of the tree’s crown, as those are generally considered to be the most uniform ones [48]. From each tree, approximately 30 to 50 fully developed and undamaged leaves were collected during the vegetation season in 2020. The leaves were transported to the laboratory, and then pressed and fully dried for further morphometric analysis. Finally, 20 leaf samples were randomly selected per each tree/shrub and subjected to morphometric analysis. Vouchers of the studied populations were deposited in the herbarium at the Faculty of Forestry and Wood Technology of the University of Zagreb (DEND).
A total of 3400 leaves were scanned and measured using the WinFolia program [49] with a measurement accuracy of 0.1 mm. Ten phenotypic traits were measured on each leaf: leaf area (LA); perimeter (P); form coefficient (FC); leaf length (LL); maximum leaf width (MLW); leaf length, measured from the leaf base to the point of maximum leaf width (PMLW); leaf blade width at 90% of leaf blade length (LWT); angle closed by the main leaf vein and the line defined by the leaf blade base and a point on the leaf margin, at 10% (LA1) and 25% (LA2) of leaf blade length (LA1); and petiole length (PL). Finally, 34,000 simple data values were obtained.

2.2. Environmental Data

Climate data were obtained from the WorldClim 2 database with a spatial resolution close to a square km [50,51]. Prior to the correlation analysis between morphometric, geographic, and environmental data, the correlations among all 19 WorldClim bioclimatic variables for all studied populations were calculated to exclude the highly correlated ones [52]. The following bioclimatic variables were used in the statistical analysis: BIO1 (Annual Mean Temperature); BIO3 (Isothermality (BIO2/BIO7) ×100)); BIO4 (Temperature Seasonality (standard deviation ×100)); BIO5 (Max Temperature of Warmest Month); BIO8 (Mean Temperature of Wettest Quarter); BIO9 (Mean Temperature of Driest Quarter); BIO12 (Annual Precipitation); BIO15 (Precipitation Seasonality (Coefficient of Variation)); BIO17 (Precipitation of Driest Quarter); and BIO19 (Precipitation of Coldest Quarter). Finally, ten bioclim variables, solar radiation in June (SOLAR6), and altitude were selected to describe the ecological characteristics of the studied populations, for the principal component (PC) analysis and for the calculation of environmental distances (Table S1).

2.3. Population Diversity and Phenotypic Traits

Descriptive statistics (arithmetic mean, standard deviation, minimum and maximum value, and coefficient of variation) were calculated for the particular trait for each population in order to determine the range of their variation [53,54]. To detect the level of among- and within-population variability, hierarchical analysis of variance was used. The analyzed factors were populations and trees within populations (tree factor nested inside the population factor).

2.4. Correlations between Geographic, Environmental, and Morphometric Data

The simple Mantel tests were performed in order to evaluate the correlation between multicharacter differences among populations [55,56]. Dissimilarity matrices were calculated to test correlations between geographic (latitude and longitude), environmental (ten bioclim, altitude, and solar radiation in June), and phenotypic differentiation (all studied leaf variables). Environmental and morphometric distance matrices were assessed as the Euclidian distances between the population means for the first three factors of the principal component analysis. Geographic distances were calculated as the Euclidian distance between the population sites (latitude and longitude). The significance level was assessed after 10,000 permutations, and the Mantel tests were performed with the R package “Vegan” [57].

2.5. Population Structure

Population differentiation was identified using multivariate statistical methods [58]. The K-means method was applied to detect phenotypic structure and define the number of K-groups that best explained the phenotypic variation of populations [59,60,61,62]. If the proportion of a specific population was equal to or higher than 0.7, that population was assumed to belong to one cluster, and if it was lower than 0.7, that population was considered to be of mixed origin. A dendrogram of the closest Euclidean distances on the basis of the unweighted pair-group method using arithmetic means (UPGMA) was constructed to check the structure between the studied populations. In addition, population structure was assessed using principal component (PC) analysis across all individuals and all studied traits. The input data in multivariate statistical methods were previously standardized, i.e., standardization of traits to zero mean and unit standard deviation was performed prior to each multivariate analysis. All statistical analyses were performed using the software packages STATISTICA version 13 [63] and R v.3.4.3 [64].

3. Results

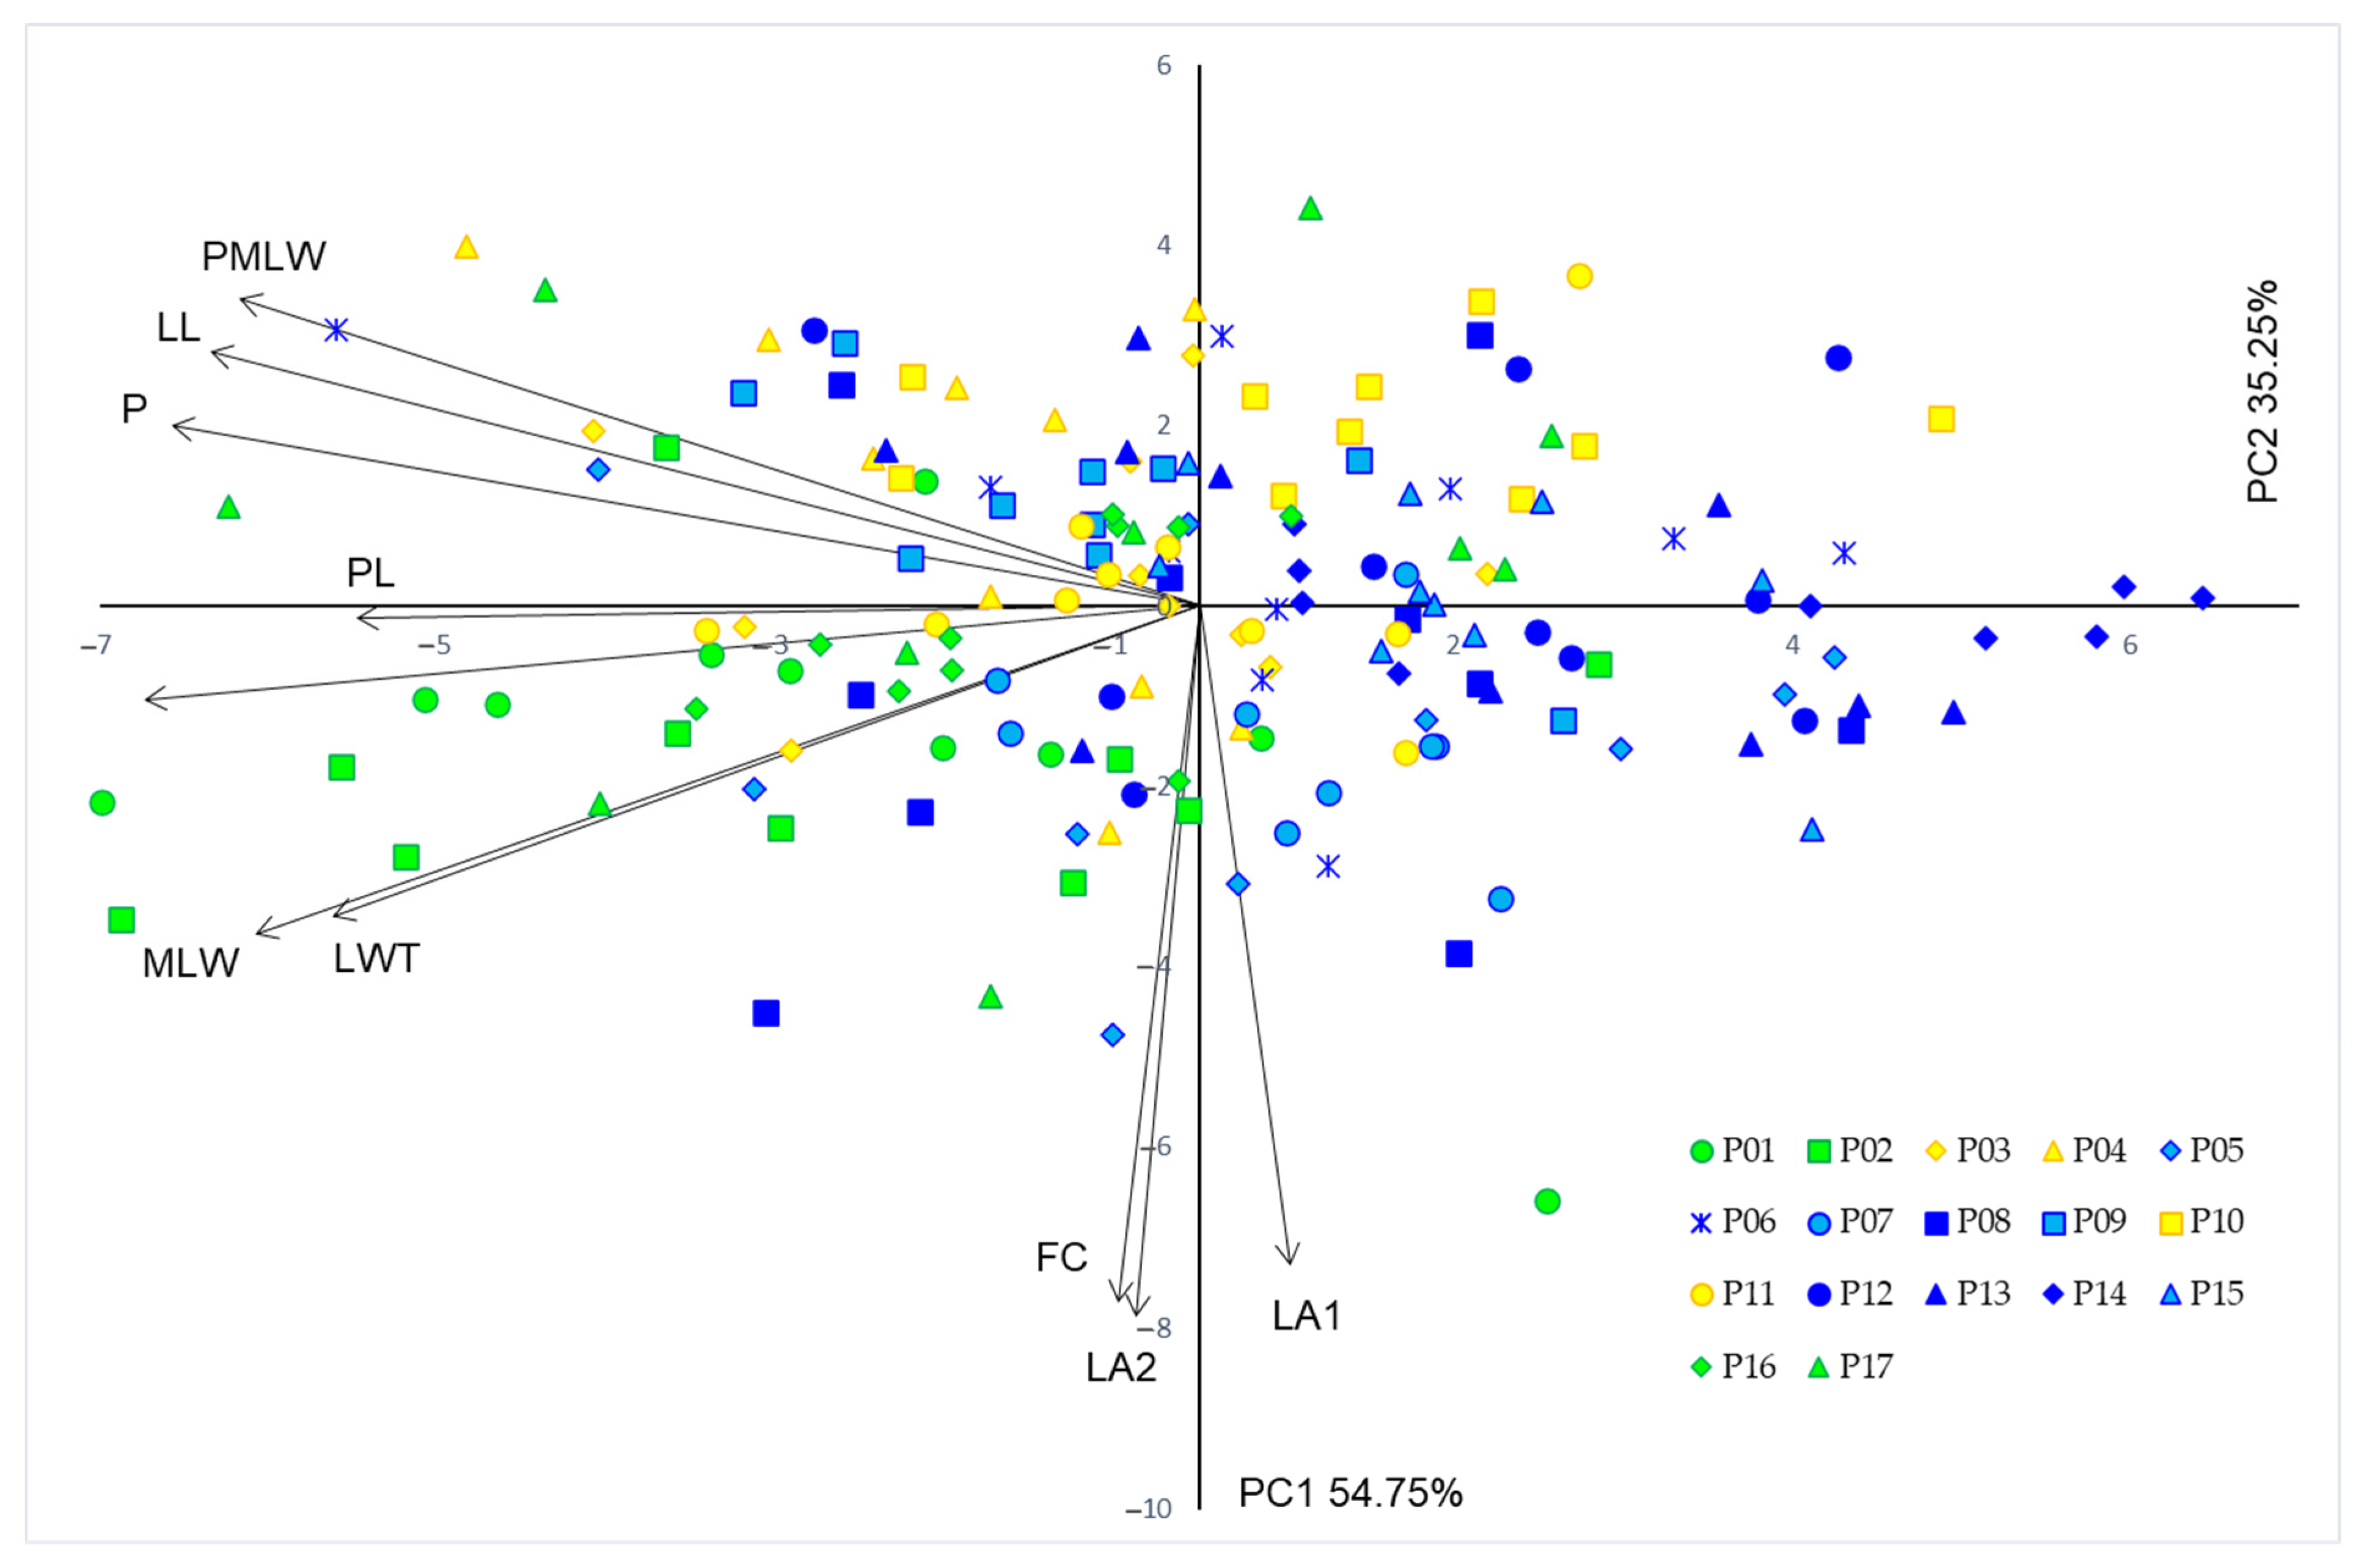
3.1. Population Diversity and Phenotypic Traits

The results of the conducted descriptive statistical analysis are shown for each studied population (Table S2), and for all populations together (Table 1). Of all measured leaf traits, leaf area (LA) and petiole length (PL) proved to be the most variable ones, with a coefficient of variation above 40%. Contrarily, the leaf trait with the lowest variability was the form coefficient (FC), with a coefficient of variation under 20%. In general, leaf traits related to its form (FC, LA1, and LA2) showed less variability compared to those relating to leaf size. The most variable was the southernmost population Konavle, while no population stands out as the least variable one. The population Žminj was distinguished by having the highest values for four out of the ten measured leaf traits (LA, FC, MPW, and LWT). On the other hand, population Hvar has the smallest value for the majority of measured variables (LA, P, LL, MLW, PMLW, LWT, and PL). The highest and the smallest values for traits considering leaf angles (LA1 and LA2) were noted for populations Krka and Muć, respectively. The already mentioned population Hvar, along with other southern island and coastal hinterland populations, was found to have generally smaller leaves. On the other hand, northern populations located in Istria and far southern coastal populations tend to have rather larger leaves.
Statistically significant differences among and within populations were confirmed for all studied leaf traits at a significant level p < 0.001. The percent of variation was significantly higher among the trees within populations compared to the one among populations (Figure 2). However, the component of error accounted for the greatest part of total variation for the majority of measured leaf traits.

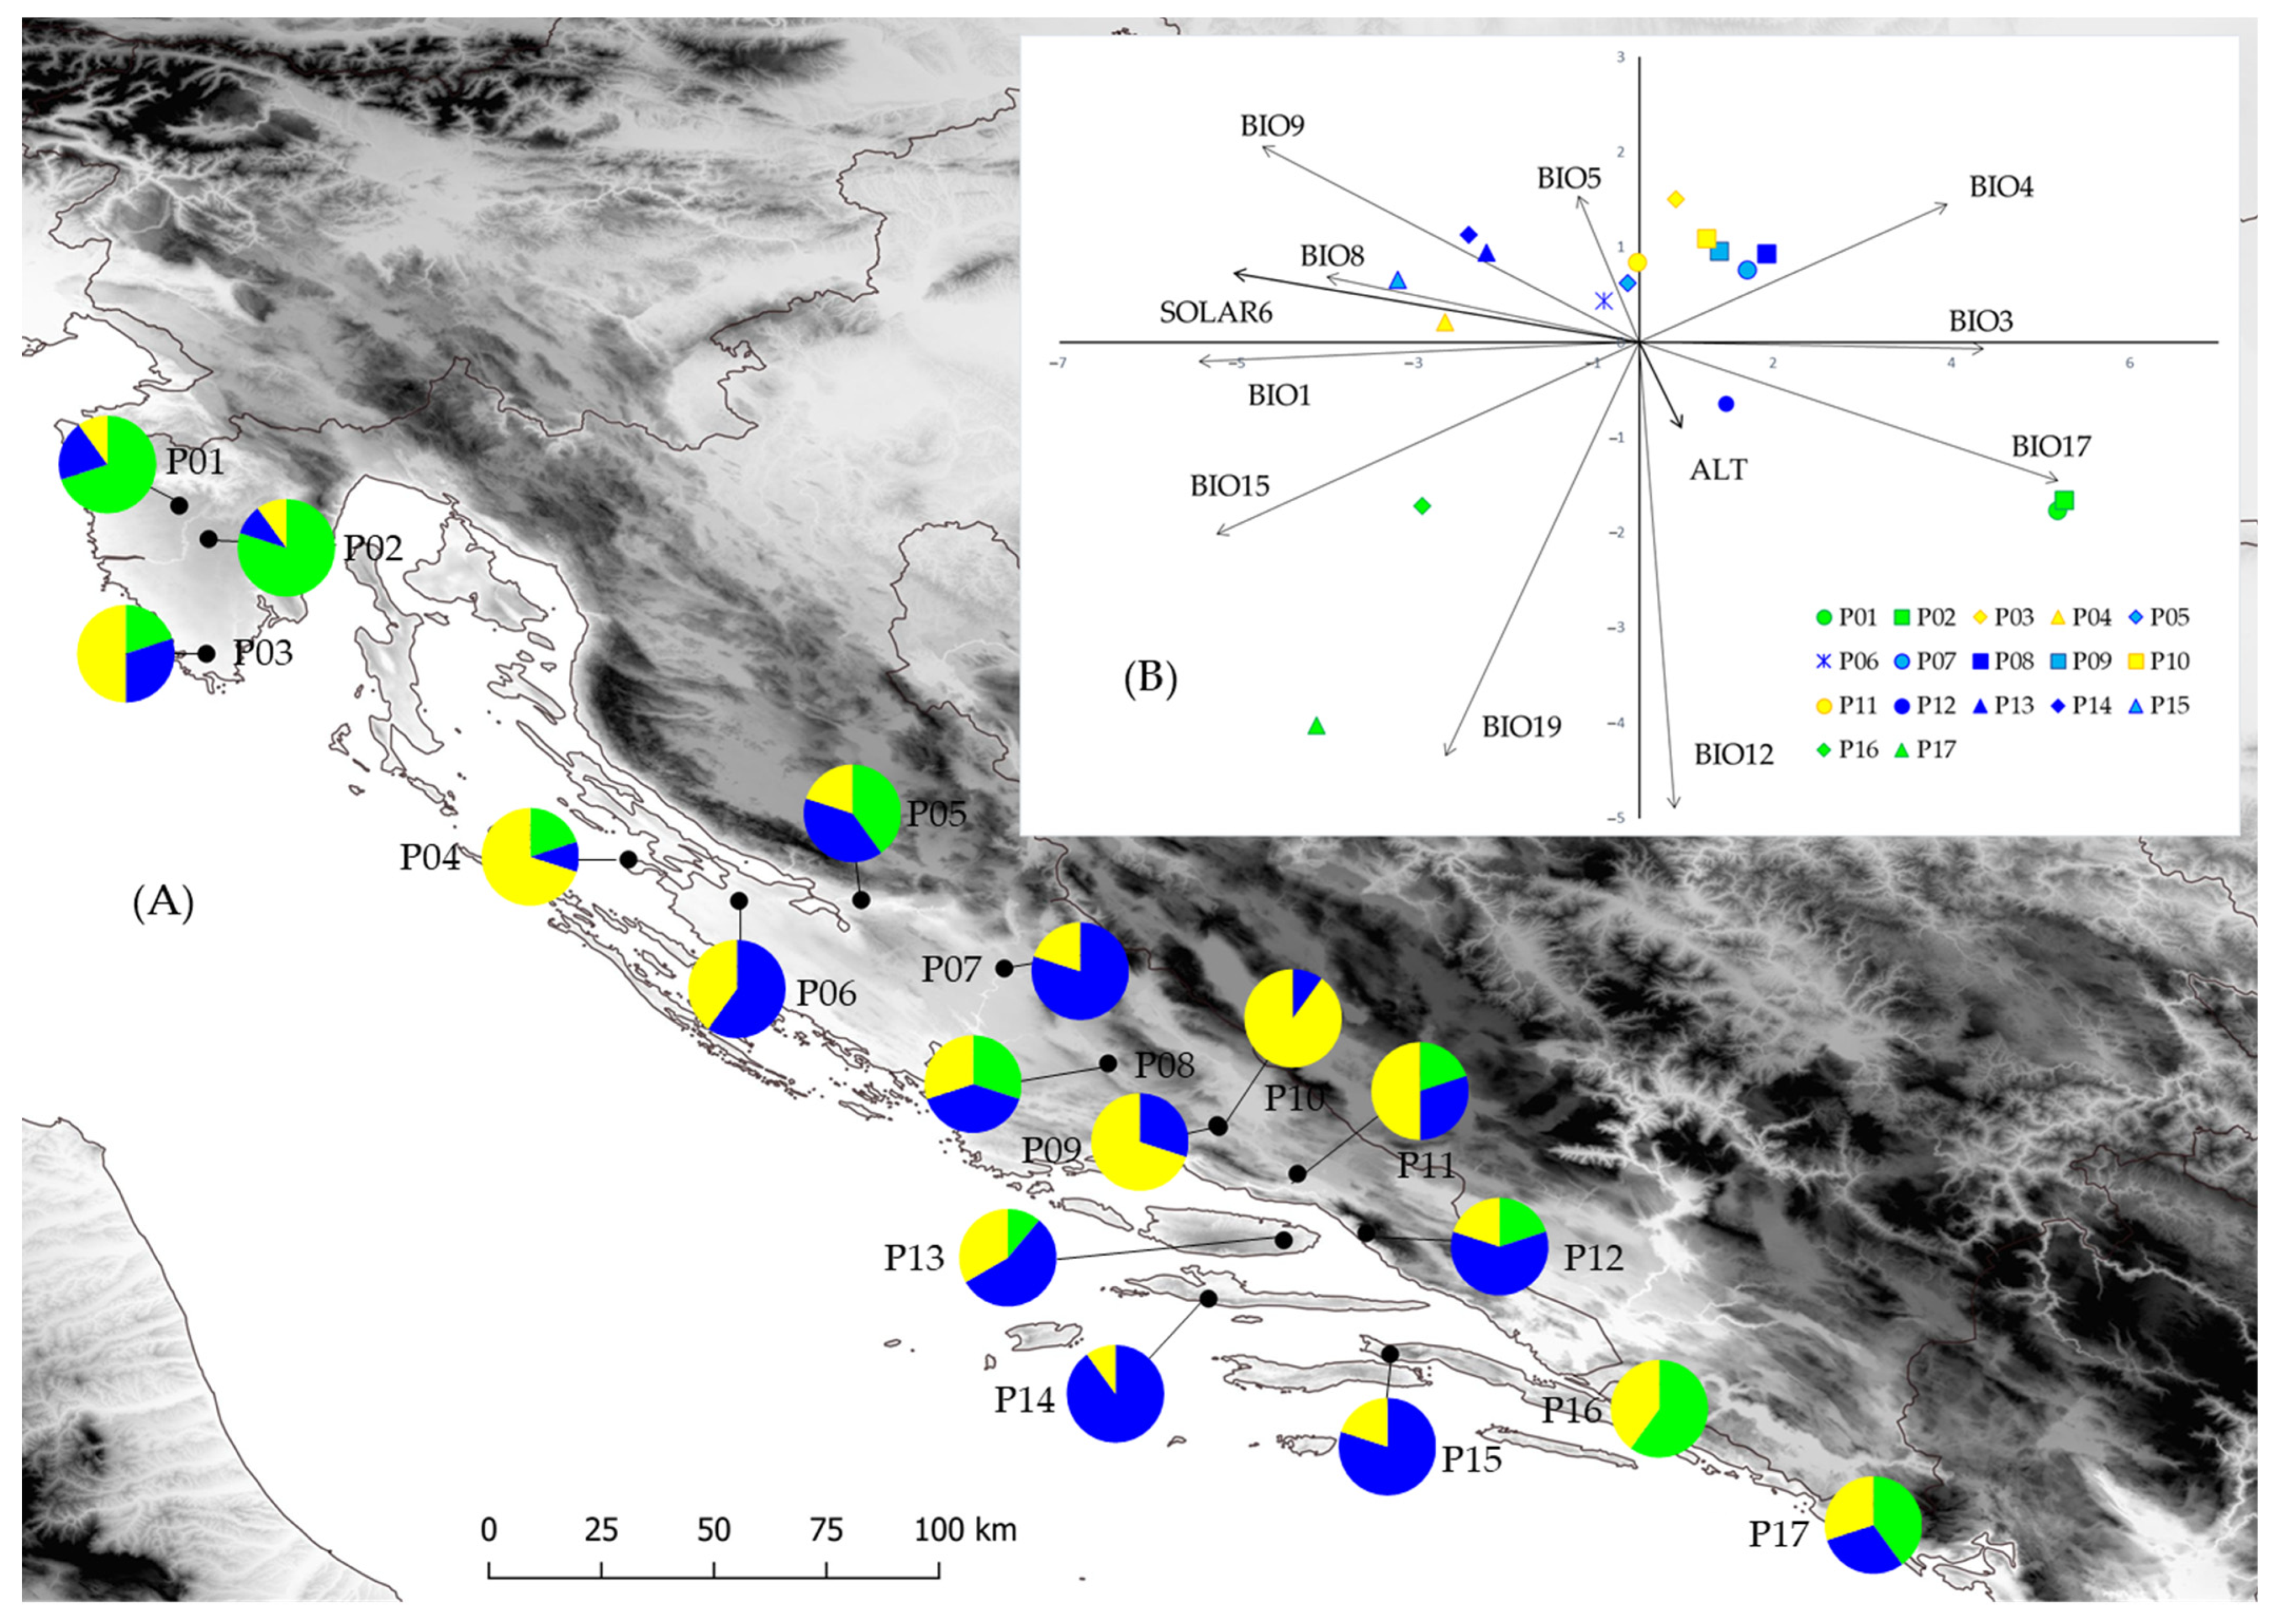
3.2. Climate Differences among Sampling Sites

The ten bioclim variables, solar radiation in June, and altitude varied across the sampling sites (Figure 1B). The principal components analysis revealed distinct climates based on the annual mean temperature (BIO1), seasonality of precipitation (BIO15), precipitation of driest quarter (BIO17), solar radiation in June (SOLAR6), and mean temperature of driest quarter (BIO9), along the first principal component. The second principal component was in negative correlation with the annual precipitation (BIO12) and precipitation of the coldest quarter (BIO19). The first two components accounted for 64.15% of the total variance (Table S3). These two principal components clearly distinguished the two northernmost and two southernmost populations that share high annual precipitation values from other studied populations.

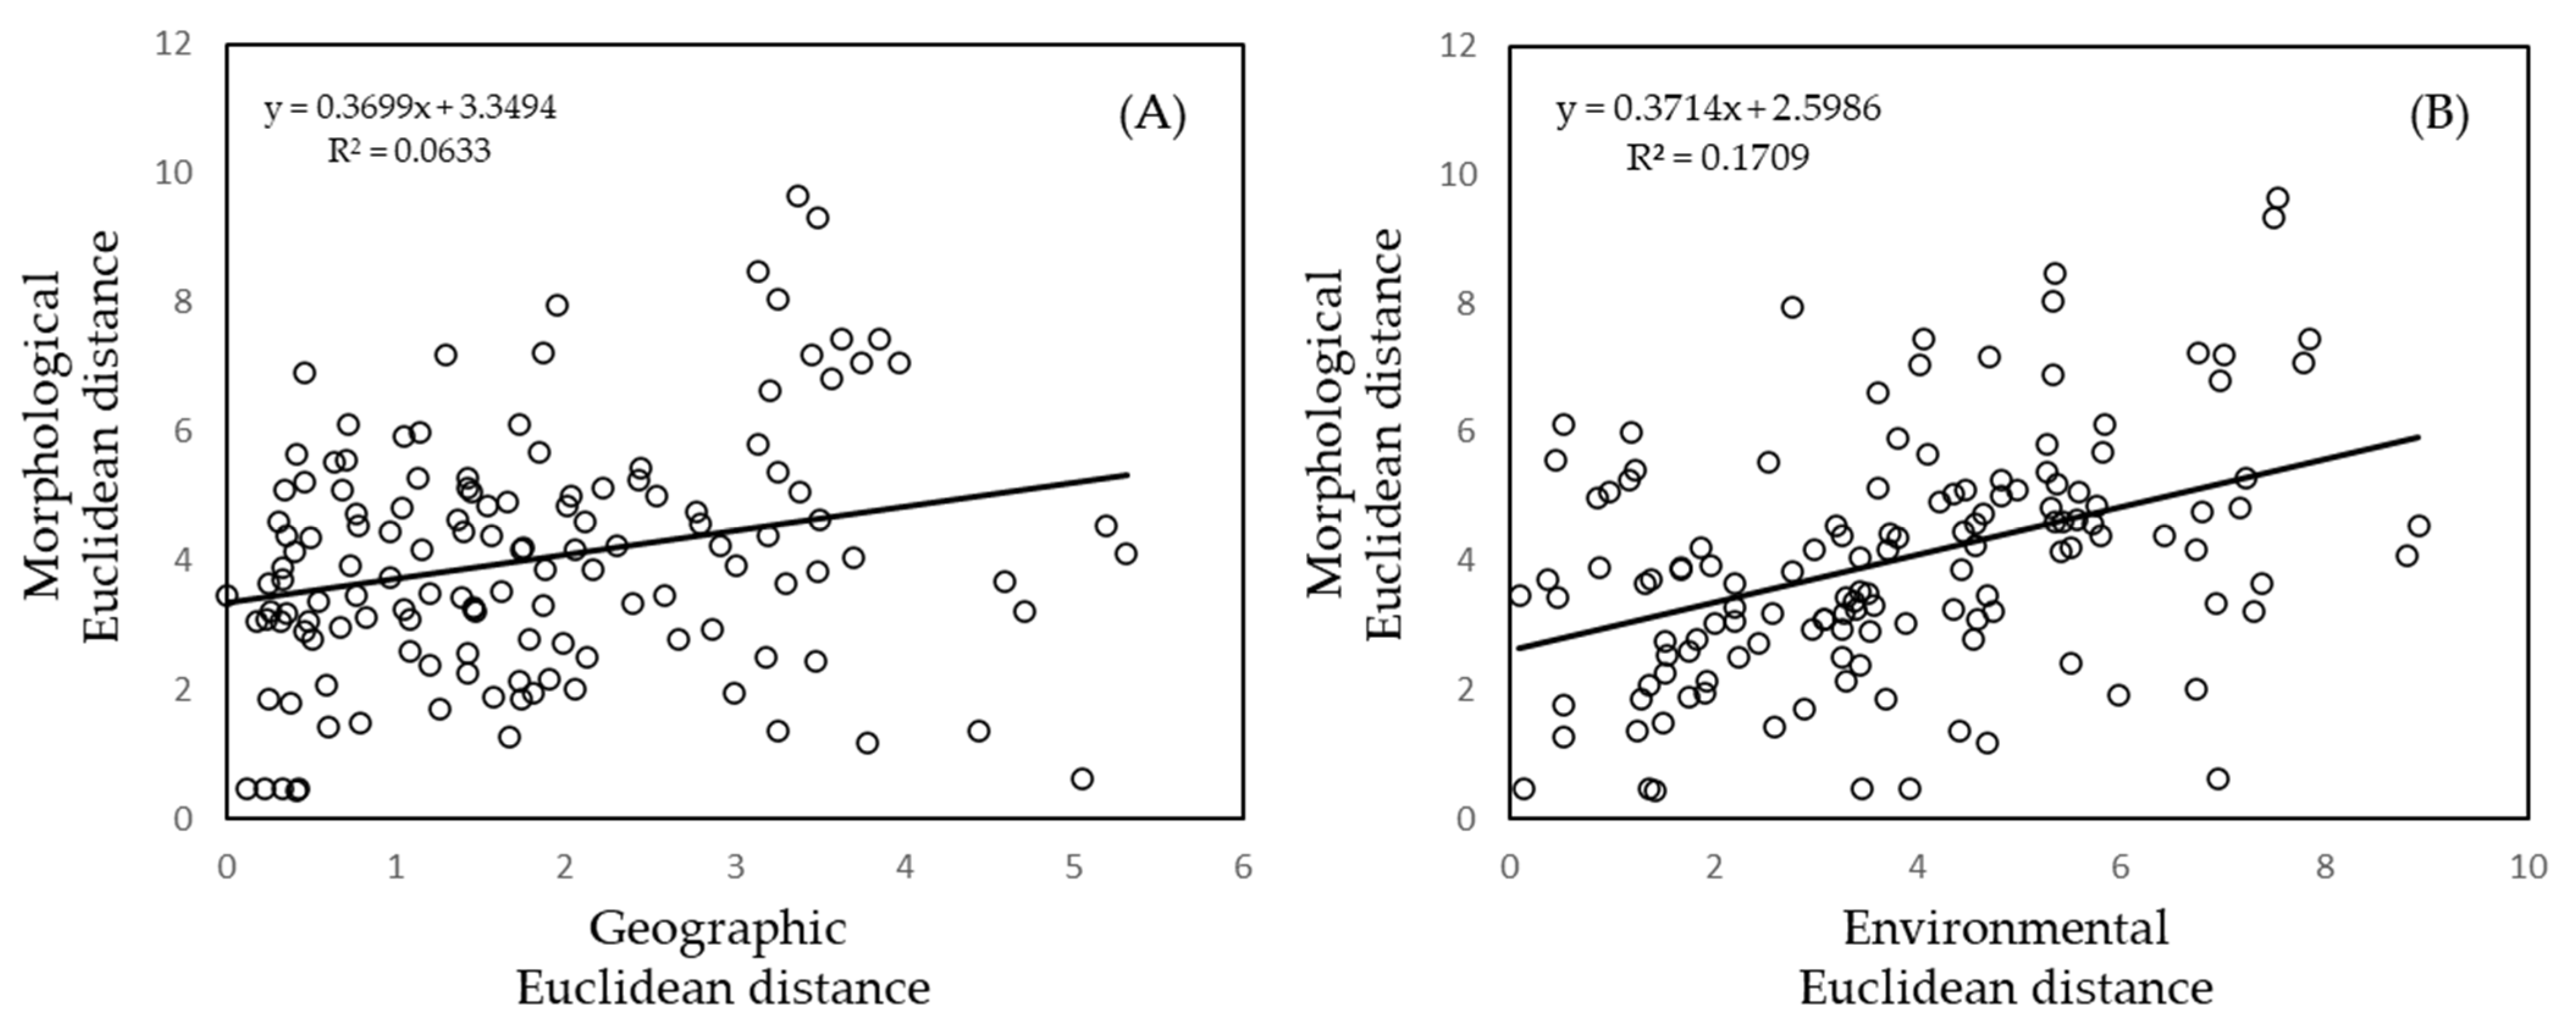
3.3. Correlations between Geographic, Environmental, and Morphometric Data

In order to determine whether the observed phenotypic variability was caused by geographical (IBD) or environmental distances (IBE) between the studied populations, the Mantel tests were performed. The results identified significant correlations between the phenotypic, geographical, and environmental distance matrices (Figure 3). Correlations were higher between phenotypic and environmental distance matrices (r = 0.4134, p = 0.002), and slightly smaller but still statistically significant between phenotypic and geographical distance matrices (r = 0.2516, p = 0.029). Therefore, leaf phenotypic traits in our populations show greater dependence on environmental than geographic factors, which explains why some geographically distant populations, such as Pula in the north and southernmost Konavle, share great similarities, despite being more than 440 km apart.

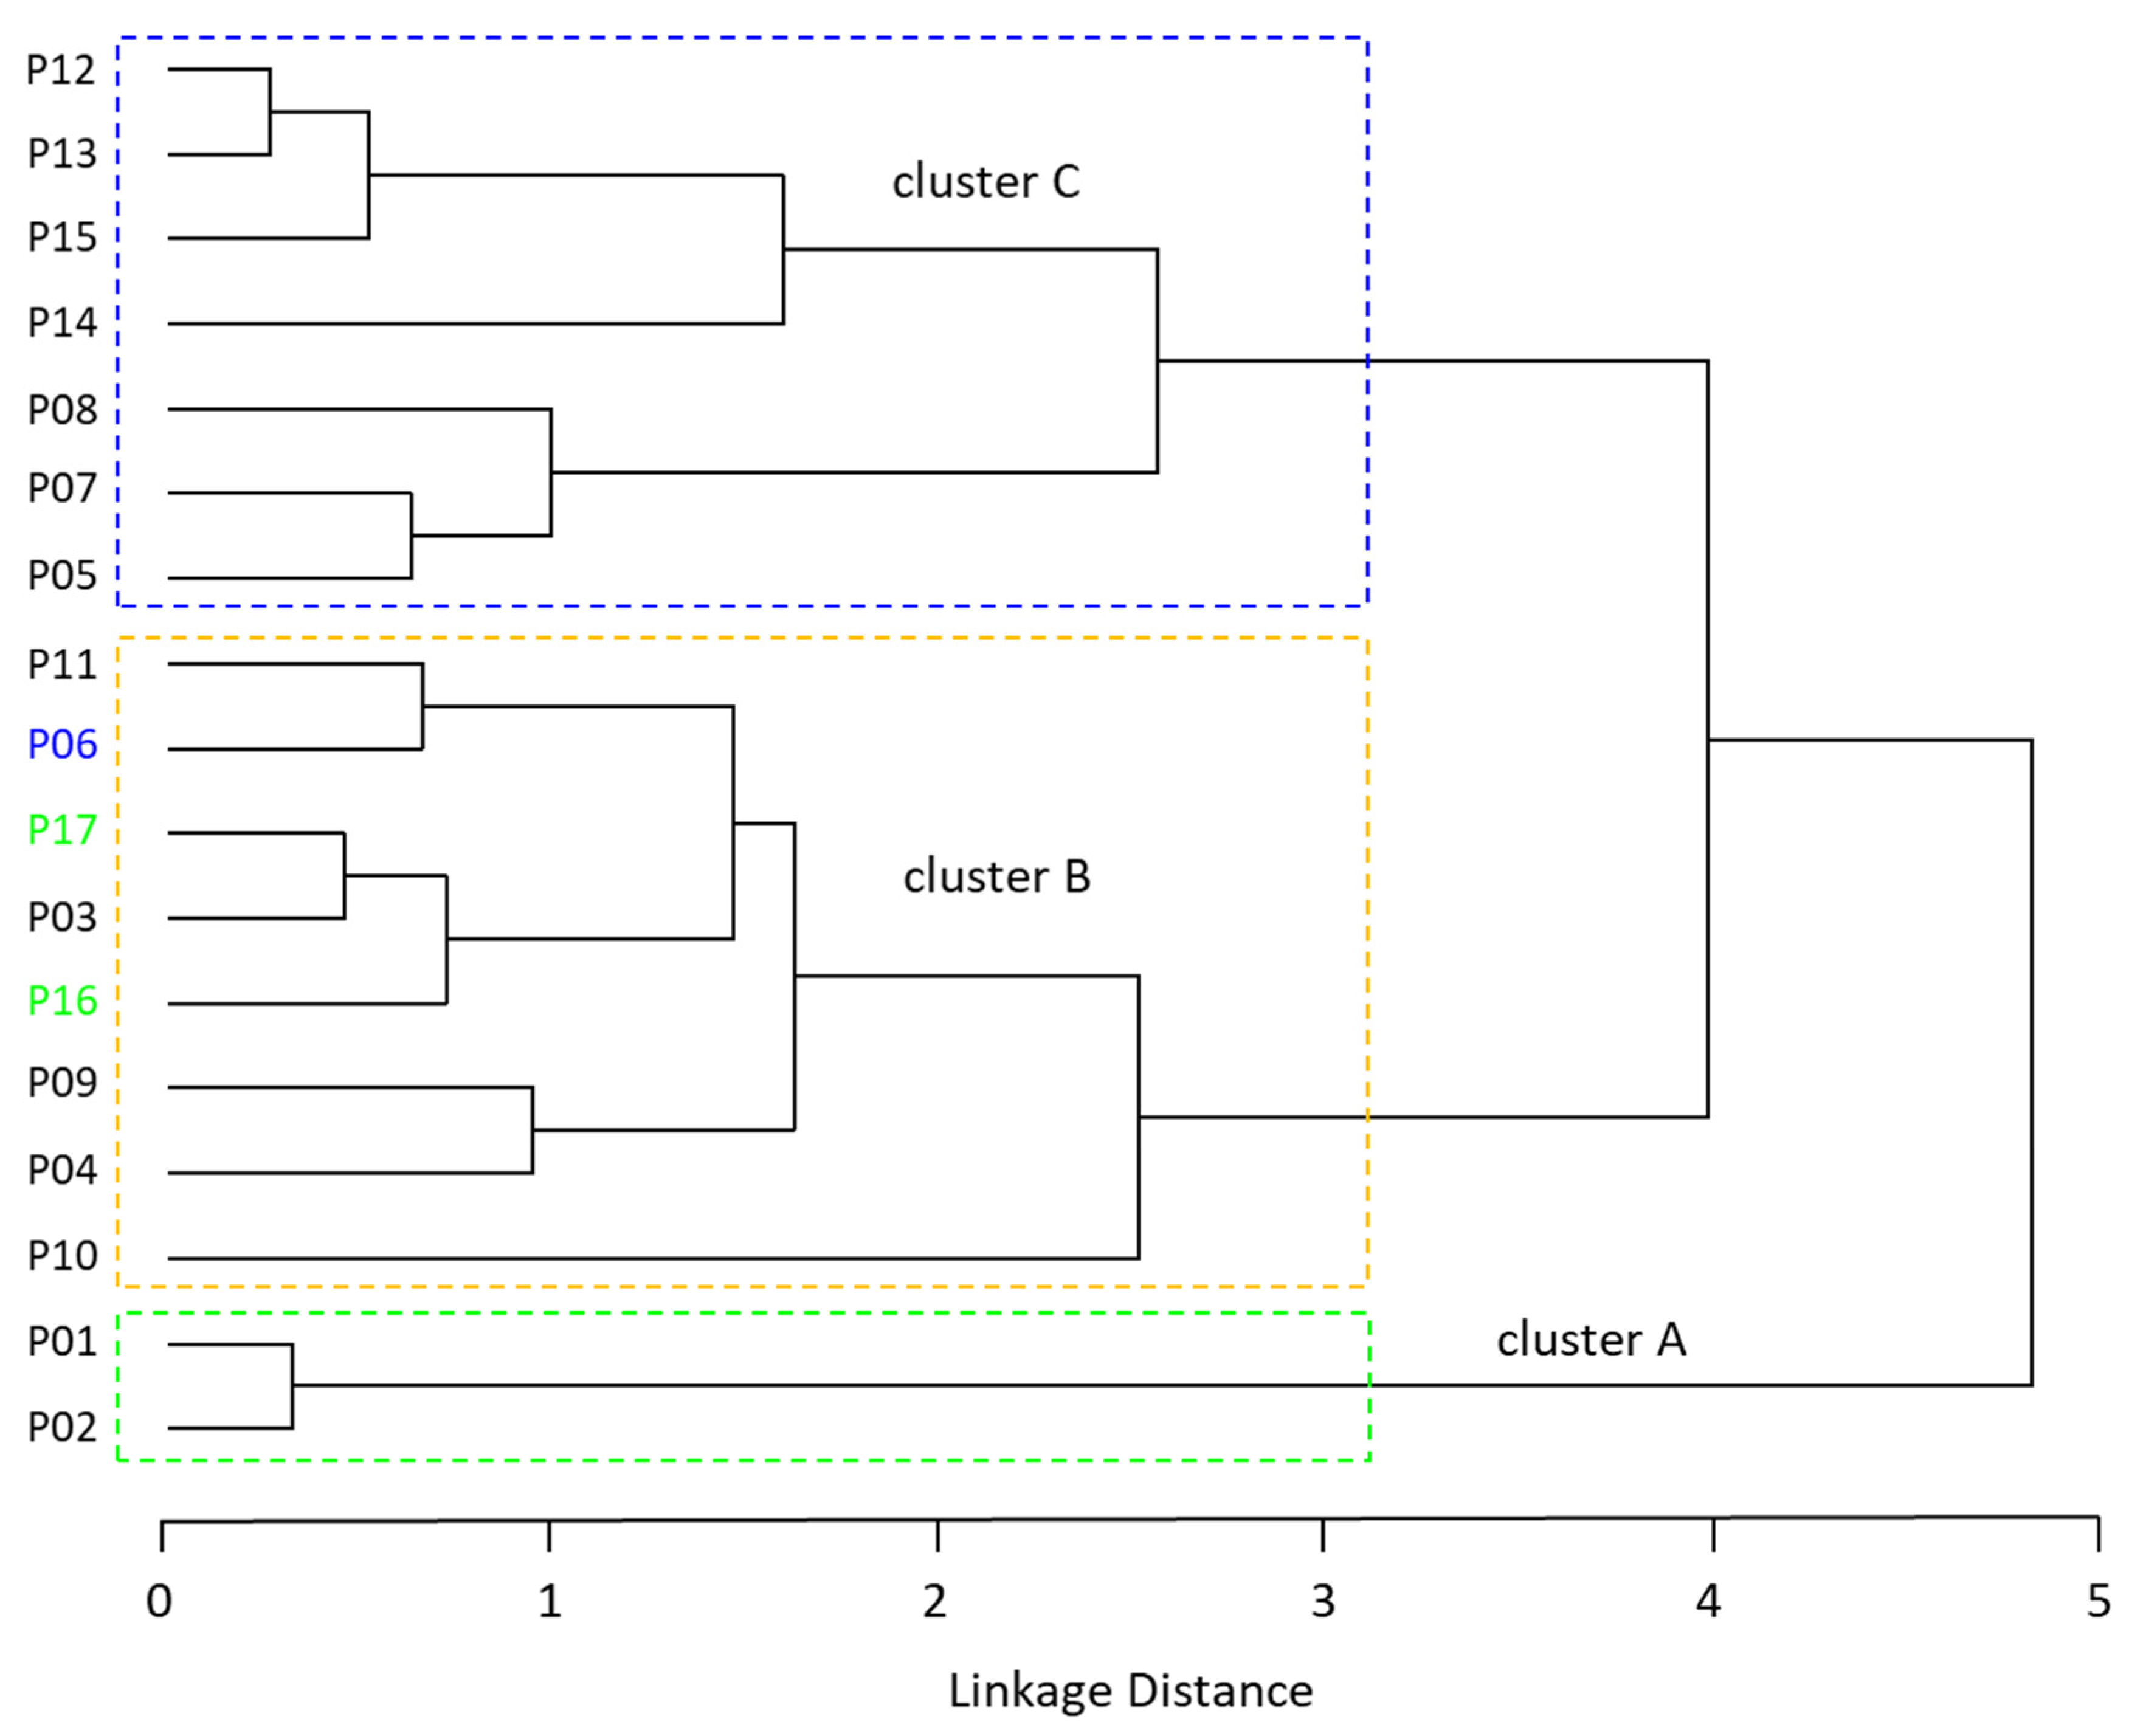
3.4. Population Structure

The structure of the 17 almond-leaved populations was illustrated by the K-means clustering method, which revealed the most probable division of populations into three groups (Figure 1A). Populations Škropeti and Žminj grouped together into the first cluster (A); populations Vir, Muć, and Sinj formed the second cluster (B); while populations Krka, Hvar, and Pelješac formed the third cluster (C). All of the other populations have showed mixed origin. Populations Slano and Konavle have the dominant proportion from Cluster A. Populations Pula and Blato na Cetini gravitate more towards Cluster B, while populations Biokovo, Brač, Drniš, and Nin have the most similarities with Cluster C. Population Obrovac was equally divided between Clusters B and C, with the smallest proportion from Cluster A.
To additionally analyze the relationships between the studied populations, a dendrogram was constructed using the UPGMA method of cluster analysis on the closest Euclidean distances between populations (Figure 4). The results are compliant with the results of the K-means clustering method, and the studied populations were divided into three major clusters. The first cluster (A) that stands out the most was formed by the northernmost populations Škropeti and Žminj. The second extensive cluster (B) was formed by populations Blato na Cetini, Nin, Konavle, Pula, Slano, Sinj, Vir, and Muć. Populations Biokovo, Brač, Pelješac, Hvar, Drniš, Krka, and Obrovac formed the third cluster (C). Populations Biokovo and Brač, with almost identical altitude, were shown to be the most similar ones, followed by populations Škropeti and Žminj, which share similar altitudes and almost identical precipitation values. Interestingly, populations Pula and Konavle, which are located at the opposite ends of the study area, showed great similarity, corresponding to similar environmental conditions.
PC analysis showed that 90.0% of the total variation is explained by the first two principal components (Table 2). The first principal component participates in the overall variance with 54.75% and is in highly negative correlation with the leaf size variables. In other words, individuals with larger leaves and longer petioles are grouped on the left side of the diagram, while those with smaller leaves and shorter petioles are grouped on the right side of the diagram (Figure 5). The second principal component accounts for 35.25% of the overall variance and is negatively correlated with leaf shape variables, i.e., leaf angles (LA1 and LA2), and form coefficient (FC). A significant overlap in PC diagram was observed between the studied populations.

4. Discussion

4.1. Population Diversity and Phenotypic Traits

According to available literature, almond-leaved pear is described to have 2.5–7 cm long and 1–3 cm wide leaves with 1–2 cm long petioles [15,17,21]. Although closer to the lower limit, our results are in accordance with these descriptions, with the leaf length and width ranges between 1.3–7.3 cm (average 3.4 cm) and 0.4–3.3 cm (average 1.3 cm), and petiole length between 0.1–3.6 cm (average 1.1 cm). Comparing the morphometric leaf characteristics between P. spinosa and other South-East European and Western Asian narrow-leaved pear species (P. elaeagnifolia, P. nivalis and P. syriaca), almond-leaved pear stands out as the one with the smallest and narrowest leaves [9,15,21,65]. However, all of the above-mentioned species have overlapping phenotypes with regard to leaf dimensions and shape, and the similarity between them is indisputable, especially considering that all species are described as highly variable. This was also confirmed in the study conducted by Korotkova et al. [26], where P. spinosa samples were divided into two separate clades. The same authors stated that the taxon concept of P. spinosa as used in Flora Europaea [66] might not define a natural entity. Although our study was not aimed at resolving the phylogenetic relationships between narrowed-leaved pear species from southern Europe and western Asia, it is quite evident that those species are not easily differentiated because of high phenotypic plasticity and gradual trait transitions.
Our research showed leaf area and petiole length as the most variable leaf traits. Such results are in agreement with previously conducted research on other Pyrus [67], Prunus L. [68,69,70,71], and Malus Mill. species [72]. Considering that leaf area plays a major role in effective light capture, water balance, and temperature regulation [73], and the petiole has an important role in the adjustment of foliage and its inclination angles for optimal light capture [74], such results are expected. In addition, our results confirmed that the leaf shape is genetically fixed in a particular type [75,76]. The least variable leaf traits in this study were those related to the shape of the leaf lamina (FC) and leaf blade base (leaf angles LA1 and LA2).
Although almond-leaved pear forms small and isolated populations, they were highly diverse. Based on the analysis of variance, statistically significant differences were confirmed for all measured leaf traits on inter- and intrapopulation levels. In general, intrapopulation variability was higher than interpopulation variability for all of the measured leaf traits, which indicates high gene flow between populations.
Compared to the studies conducted on other fruit species, such as Prunus avium (L.) L. (CV = 10.6–38.2%) [77], Sorbus domestica L. (CV 7.2–30.7%) [78], and S. torminalis (L.) Crantz (12.7–29.3%) [48], our results exhibit a significantly higher variability of leaf traits. Such results are noticeable even compared to other Pyrus species, such as P. mamorensis Trab. (CV 15.3–30.2%) [79], P. communis L. (CV 22.3–26.5%), P. pyrifolia (Burm.f.) Nakai (3.8–15.8%), and P. syriaca (11.3–41.5%) [80]. High phenotypic variability of almond-leaved pear leaves probably resulted from a combination of multiple indicators related to the diversity of environmental factors and genotypic variability [81]. The ability of a particular genotype to exhibit different phenotypic characteristics under diverse environmental conditions is usually described as phenotypic plasticity [82,83]. Phenotypic plasticity enables species to survive in a wide range of environmental conditions and reduces the risk of species loss due to climate change [84]. Such adaptation to changing environmental conditions is crucial for a species’ persistence [85] and could have a decisive role in the future global warming context [84]. Since heterogeneous species, such as pears, respond to climate change within their natural range, they are directly influenced by phenomena such as local adaptation, intra-specific diversity, and phenotypic plasticity [84], which contributes to genetic variation between populations [86]. This might explain the existing variability between our populations, as they grow under different bioclimatic conditions and therefore try to adapt in order to fully utilize available resources.

4.2. Correlations between Geographic, Environmental, and Morphometric Data

A significant relationship was found between both geographical and phenotypic distance matrices (isolation by distance—IBD) and environmental and phenotypic distance matrices (isolation by environment—IBE). The isolation by distance (IBD) model indicates that genetic differentiation between populations increases with geographical distances [87]. On the other hand, isolation by environment (IBE) explains genetic differentiation through environmental differences between populations, where phenotypic and environmental distances are positively correlated, independent of geographical distance [88]. As a consequence, populations often diverge in ways that are crucial to their interaction with the landscape, including dispersal patterns, habitat preference, and adaptation to different environmental conditions, all of which may influence patterns of gene flow. Today, ecologically driven diversification is progressively being acknowledged as the main driver of population diversification [89,90]. Our results show that the predominant pattern of phenotypic differentiation among P. spinosa populations is isolation by environment (IBE), that is, environmental effects play an important role in shaping population diversity and manifesting phenotypic differences between environmentally heterogeneous populations. Overall, our results suggest that reduction in leaf size is a likely outcome of almond-leaved pear growth in an environment with low precipitation during the vegetation season accompanied by higher temperatures and solar radiation. However, our results confirmed that phenotypic differentiation is correlated with both geographical distances and environmental differences between studied populations, that these adaptive and neutral processes are not mutually exclusive, and that natural populations are expected to experience them in combination [91,92].

4.3. Population Structure

The structure of researched populations followed IBD and IBE patterns to some extent. We obtained three clusters of populations. Interestingly, the first cluster consisted of two northernmost and partially two southernmost populations that share high annual precipitation values. The other two clusters of populations were highly intermixed, and they did not appear to follow any clear geographical or environmental pattern. Almond-leaved pear is an insect-pollinated and animal-dispersed species, which outlines the assumption that seeds are dispersed in any possible direction [93]. As there are no major geographical barriers between these populations, animals and birds that feed on almond-leaved pear fruit spread genetic material into other populations, even those on islands, causing mixed ancestry of populations. In addition, we cannot exclude the possibility that, despite the heterogeneous Mediterranean landscape and the low-density populations of P. spinosa in the study area, most of the adult trees formed part of an extensive network of pollen flow spanning discontinuous, widely spaced, open bush associations. This could possibly explain the similarity between geographically close populations. In any case, we assume that the selective pressure of the environment is strong for almond-leaved pear and likely explains the differences between the studied populations along the precipitation gradient. We suggest that the adaptability of P. spinosa to local climate affects its phenotypic traits.

5. Conclusions and Practical Implications

Almond-leaved pear showed great phenotypic diversity within and among natural populations distributed along the eastern Adriatic coast. The greatest diversity was found among phenotypic traits related to leaf size and water use efficiency, such as leaf area and petiole length, while mostly genetically driven leaf shape indicators were the least variable. In addition, we revealed that both geographical and environmental interactions play an important role in the patterns of phenotypic variation between almond-leaved pear populations. The predominant pattern of phenotypic differentiation among P. spinosa populations was isolation by environment (IBE), indicating that populations from similar environmental conditions exhibit similar phenotypes. This has reflected on population structure, where environmentally similar populations, as well as geographically close populations, were classified into three clusters, with relatively heterogeneous ancestry. The problematic taxonomy of this species requires comprehensive molecular and morphological research throughout its natural range. For now, this question remains open, which leaves room for future research.
The almond-leaved pear is of great importance for biodiversity in the xerophytic and thermophilic habitats of the Mediterranean area. Like other pears, the almond-leaved pear also has high quality wood, which can be used for the carving of small objects. However, on more favorable sites, it can reach bigger dimensions, so the wood can be used for furniture or as high-quality firewood. It has edible fruits that can be dried and used for tea or processed as desired. Various birds and mammals, such as martens, badgers, and foxes, feed on its fruit, which contributes to the normal functioning of the ecosystem. In addition, its currently most important use is as a rootstock for grafting various pear cultivars, especially in the Mediterranean area with calcareous soils, where drought resistance is a highly desirable trait. When collecting samples for this study, it was noticed that the species is highly fire-resistant and acts as a passive pyrophyte, indicating the potential use in afforestation of burned and other areas exposed to such risks. Consequently, the almond-leaved pear can be a potentially useful species in forestry in the Mediterranean area, especially taking into account the increasingly pronounced climate changes to which the area is highly exposed. Decreasing amounts of precipitation and increasing temperatures will force foresters to resort to new solutions in afforestation and forest management. In addition, by selection and crossbreeding, cultivars with desirable fruit traits could be obtained and could be commercially grown in such areas. It is also useful to mention its ornamental value, especially during autumn when fruits are ripening.

Supplementary Materials

The following are available online at https://0-www-mdpi-com.brum.beds.ac.uk/article/10.3390/f12121630/s1, Table S1: Sample size (n), geographic coordinates, altitudes and environmental variables for 17 Pyrus spinosa populations (n = 170). Environmental variables: BIO1 (Annual Mean Temperature); BIO3 (Isothermality (BIO2/BIO7) ×100)); BIO4 (Temperature Seasonality (standard deviation ×100)); BIO5 (Max Temperature of Warmest Month); BIO8 (Mean Temperature of Wettest Quarter); BIO9 (Mean Temperature of Driest Quarter); BIO12 (Annual Precipitation); BIO15 (Precipitation Seasonality (Coefficient of Variation)); BIO17 (Precipitation of Driest Quarter); BIO19 (Precipitation of Coldest Quarter); SOLAR 6 (Insolation in June). Table S2: Descriptive statistics of the measured phenotypic traits at the population level. Descriptive statistical parameters: M (Average Value); CV (Coefficient of Variation (%)). Leaf measured traits: LA (Leaf Area), P (Perimeter), FC (Form Coefficient), LL (Leaf Length), MLW (Maximal Leaf Width), PMLW (Position of Maximal Leaf Width), LWT (Leaf Blade Width at 90% of Leaf Blade Length), LA1 (Leaf Angle 1), LA2 (Leaf Angle 2), PL (Petiole Length). Acronyms of populations: P01—Škropeti; P02—Žminj; P03—Pula; P04—Vir; P05—Obrovac; P06—Nin; P07—Krka; P08—Drniš; P09—Sinj; P10—Muć; P11—Blato na Cetini; P12—Biokovo; P13—Brač; P14—Hvar; P15—Pelješac; P16—Slano; P17—Konavle. Table S3: Pearson correlation coefficients between 12 environmental variables and scores of the first four principal components.

Author Contributions

Conceptualization: A.V., Z.L., Z.Š., M.I. and I.P.; methodology, A.V., Z.L., Z.Š., M.I. and I.P.; software, Z.Š. and I.P.; investigation, A.V., M.I., I.V., I.Z., V.P., M.R. and I.P.; data curation, Z.L., Z.Š., M.I. and I.P.; writing—original draft preparation, A.V. and I.P.; writing—review and editing, Z.L., Z.Š., M.I., I.V., I.Z., V.P. and M.R.; visualization, I.P. All authors have read and agreed to the published version of the manuscript.

Funding

This research was funded by the project KK.01.2.2.03.0017 CEKOM 3LJ and financial support of the University of Zagreb.

Data Availability Statement

Not applicable.

Conflicts of Interest

The authors declare no conflict of interest. The funders had no role in the design of the study; in the collection, analyses, or interpretation of data; in the writing of the manuscript; or in the decision to publish the results.

References

  1. Potter, D.; Eriksson, T.; Evans, R.C.; Oh, S.; Smedmark, J.E.E.; Morgan, D.R.; Kerr, M.; Robertson, K.R.; Arsenault, M.; Dickinson, T.A.; et al. Phylogeny and classification of Rosaceae. Plant Syst. Evol. 2007, 266, 5–43. [Google Scholar] [CrossRef]
  2. Campbell, C.S.; Evans, R.C.; Morgan, D.R.; Dickinson, T.A.; Arsenault, M.P. Phylogeny of subtribe Pyrinae (formerly the Maloideae, Rosaceae): Limited resolution of a complex evolutionary history. Plant Syst. Evol. 2007, 266, 119–145. [Google Scholar] [CrossRef]
  3. Watkins, R. Apple and Pear. In Evolution of Crop Plants; Simmonds, N.W., Ed.; Longman Group Ltd.: London, UK, 1976; p. 339. [Google Scholar]
  4. Bell, R.L.; Itai, A. Pyrus. In Wild Crop Relatives: Genomic and Breeding Resources; Kole, C., Ed.; Springer: Berlin/Heidelberg, Germany, 2010; pp. 147–177. [Google Scholar] [CrossRef]
  5. Volk, G.M.; Cornille, A. Genetic diversity and domestication history in Pyrus. In The Pear Genome: Compendium of Plant Genomes; Korban, S., Ed.; Springer Nature Switzerland AG: Cham, Switzerland, 2019. [Google Scholar] [CrossRef]
  6. Erfani-Moghadam, J.; Zarei, A. Assessment of genetic structure among different pear species (Pyrus spp.) using apple-derived SSR and evidence of duplications in the pear genome. Biotechnol. Biotechnol. Equip. 2018, 32, 591–601. [Google Scholar] [CrossRef] [Green Version]
  7. Hancock, J.; Lobos, G. Pears. In Temperate Fruit Crop Breeding; Hancock, J.F., Ed.; Springer: Dordrecht, The Netherlands, 2008; pp. 299–336. [Google Scholar] [CrossRef]
  8. Bell, R.L.; Quamme, H.A.; Layne, R.E.C.; Skirvin, R.M. Pears. In Fruit Breeding: Tree and Tropical Fruits; Janick, J., Moore, J.N., Eds.; Wiley: New York, NY, USA, 1996; Volume 1, pp. 441–514. [Google Scholar]
  9. Aldasoro, J.J.; Aedo, C.; Muñoz Garmendia, F. The genus Pyrus L. (Rosaceae) in south-west Europe and North Africa. Bot. J. Linn. Soc. 1996, 121, 143–158. [Google Scholar] [CrossRef] [Green Version]
  10. Karimi, H.; Eslami, B.; Dehpouri, A.A.; Rad, A.S. Quantitative and qualitative analyses of genus Pyrus L. (Pear Tree) in West Azerbaijan province, Iran. Iran J. Sci. Technol. Trans. A Sci. 2019, 43, 715–724. [Google Scholar] [CrossRef]
  11. Kumar, S.; Kirk, C.; Deng, C.; Wiedow, C.; Knaebel, M.; Brewer, L. Genotyping-by-sequencing of pear (Pyrus spp.) accessions unravels novel patterns of genetic diversity and selection footprints. Hortic. Res. 2017, 4, 17015. [Google Scholar] [CrossRef] [PubMed] [Green Version]
  12. Challice, J.S.; Westwood, M.N. Numerical taxonomic studies of the genus Pyrus using both chemical and botanical characters. Bot. J. Linn. Soc. 1973, 67, 121–148. [Google Scholar] [CrossRef]
  13. Browicz, K. Concept and chorology of the genus Pyrus L. Arbor. Kórnickie 1993, 38, 17–33. [Google Scholar]
  14. Bassil, N.; Postman, J.D. Identification of European and Asian pears using EST-SSRs from Pyrus. Genet. Resour. Crop Evol. 2009, 57, 357–370. [Google Scholar] [CrossRef]
  15. Zamani, A.; Attar, F.; Maroofi, H. A synopsis of the genus Pyrus (Rosaceae) in Iran. Nord. J. Bot. 2012, 30, 310–332. [Google Scholar] [CrossRef]
  16. Reim, S.; Lochschmidt, F.; Proft, A.; Wolf, H.; Wolf, H. Species delimitation, genetic diversity and structure of the European indigenous wild pear (Pyrus pyraster) in Saxony, Germany. Genet. Resour. Crop Evol. 2016, 64, 1075–1085. [Google Scholar] [CrossRef]
  17. Idžojtić, M. Dendrology—Leaf; University of Zagreb, Faculty of Forestry: Zagreb, Croatia, 2009. [Google Scholar]
  18. Jovanović, B. Fam. Malaceae Lois.-Deslongch. In Flora Srbije; Josifović, M., Ed.; Serbian Academy of Sciences and Arts: Belgrade, Serbia, 1972; Volume 4, pp. 127–178. [Google Scholar]
  19. Procopiou, J.; Wallace, A. A wild pear native to calcareous soils that has a possible as a pear rootstock. J. Plant Nutr. 2000, 23, 1969–1972. [Google Scholar] [CrossRef]
  20. Idžojtić, M. Dendrology—Flower, Cone, Fruit, Seed; Academic Press: London, UK, 2013. [Google Scholar]
  21. Krüssmann, G. Handbuch der Laubgehölze; Paul Parkey in Berlin und Hamburg, Verlag für Landwirtschaft, Veterinärmedizin, Gartenbau und Forstwesen: Berlin, Germany, 1976; Volume 3. [Google Scholar]
  22. Dostálek, J. Pyrus spinosa und ihre Hybriden in Südwestbulgarien. Folia Geobot. Phytotax. 1980, 15, 59–73. [Google Scholar] [CrossRef]
  23. Kurtto, A. Rosaceae (pro Parte Majore). Euro+Med Plantbase—The Information Resource for Euro-Mediterranean Plant Diversity. 2009. Available online: http://ww2.bgbm.org/EuroPlusMed/ (accessed on 30 July 2021).
  24. Zohary, D. Wild apples and wild pears. Bocconea 1997, 7, 409–416. [Google Scholar]
  25. Fedorov, A.A. Caucasian Representatives of the Genus Pyrus L. (Morphological-Geographical Investigation); The Armenian Branch of the USSR Academy of Sciences: Yerevan, Armenia, 1943. [Google Scholar]
  26. Korotkova, N.; Parolly, G.; Khachatryan, A.; Ghulikyan, L.; Sargsyan, H.; Akopian, J.; Borsch, T.; Gruenstaeudl, M. Towards resolving the evolutionary history of Caucasian pears (Pyrus, Rosaceae)—Phylogenetic relationships, divergence times and leaf trait evolution. J. Systemat. Evol. 2018, 56, 35–47. [Google Scholar] [CrossRef]
  27. Falcinelli, F.; Moraldi, M. Il pero mandorlino (Pyrus amygdaliformis Villars.). For. Alberi Oggi 2001, 68, 39–42. [Google Scholar]
  28. Tsoulpha, P.; Alexandri, S.; Tsaktsira, M. Critical factors affecting an efficient micropropagation protocol for Pyrus spinosa Forskk. J. Appl. Hortic. 2018, 20, 190–195. [Google Scholar] [CrossRef]
  29. Riera Sensat, F.J.; Vloebergh, A. Las formas geográficas de Pyrus amygdaliformis (Willd. y Vild.). Anal. Esc. Peritos Agríc. Espec. Agropecu. Serv. Técn. Agric. ESAB 1948, 7, 87–96. [Google Scholar]
  30. Matsumoto, K.; Tamura, F.; Chun, J.-P.; Tanabe, K. Native Mediterranean Pyrus rootstock, P. Amygdaliformis and P. Elaeagrifolia, present higher tolerance to salinity stress compared with Asian natives. J. Jpn. Soc. Hortic. Sci. 2006, 75, 450–457. [Google Scholar] [CrossRef] [Green Version]
  31. Volk, G.M.; Richards, C.M.; Henk, A.D.; Reilley, A.A.; Bassil, N.V.; Postman, J.D. Diversity of wild Pyrus communis based on microsatellite analyses. J. Am. Soc. Hortic. Sci. 2006, 131, 408–417. [Google Scholar] [CrossRef] [Green Version]
  32. Wolko, Ł.; Antkowiak, W.; Lenartowicz, E.; Bocianowski, J. Genetic diversity of European pear cultivars (Pyrus communis L.) and wild pear (Pyrus pyraster (L.) Burgsd.) inferred from microsatellite markers analysis. Genet. Resour. Crop Evol. 2010, 57, 801–806. [Google Scholar] [CrossRef] [Green Version]
  33. Wolko, L.; Bocianowski, J.; Antkowiak, W.; Słomski, R. Genetic diversity and population structure of wild pear (Pyrus pyraster (L.) Burgsd.) in Poland. Open Life Sci. 2015, 10, 19–29. [Google Scholar] [CrossRef] [Green Version]
  34. Wünsch, A.; Hormaza, J.I. Characterization of variability and genetic similarity of European pear using microsatellite loci developed in apple. Sci. Hortic. 2007, 113, 37–43. [Google Scholar] [CrossRef]
  35. Kalkışım, O.; Okcu, M.; Okcu, Z.; Karabulut, B.; Yildirim, N.; Agar, G. Relationships among some pears genotypes (Pyrus communis L.) based on ISSR and RAPD analysis. Erwerbs Obstbau 2016, 58, 259–264. [Google Scholar] [CrossRef]
  36. Queiroz, A.; Assunção, A.; Ramadas, I.; Viegas, W.; Veloso, M.M. Molecular characterization of Portuguese pear landraces (Pyrus communis L.) using SSR markers. Sci. Hortic. 2015, 183, 72–76. [Google Scholar] [CrossRef]
  37. Queiroz, Á.; Bagoin Guimarães, J.; Sánchez, C.; Simões, F.; Maia de Sousa, R.; Viegas, W.; Veloso, M.M. Genetic diversity and structure of the Portuguese pear (Pyrus communis L.) germplasm. Sustainability 2019, 11, 5340. [Google Scholar] [CrossRef] [Green Version]
  38. Kocsisné, G.M.; Bolla, D.; Anhalt-Brüderl, U.C.M.; Forneck, A.; Taller, J.; Kocsis, L. Genetic diversity and similarity of pear (Pyrus communis L.) cultivars in Central Europe revealed by SSR markers. Genet. Resour. Crop Evol. 2020, 67, 1755–1763. [Google Scholar] [CrossRef]
  39. Bao, L.; Chen, K.; Zhang, D.; Cao, Y.; Yamamoto, T.; Teng, Y. Genetic diversity and similarity of pear (Pyrus L.) cultivars native to East Asia revealed by SSR (simple sequence repeat) markers. Genet. Resour. Crop Evol. 2007, 54, 959–971. [Google Scholar] [CrossRef]
  40. Song, Y.; Fan, L.; Chen, H.; Zhang, M.; Ma, Q.; Zhang, S.; Wu, J. Identifying genetic diversity and a preliminary core collection of Pyrus pyrifolia cultivars by a genome-wide set of SSR markers. Sci. Hortic. 2014, 167, 5–16. [Google Scholar] [CrossRef]
  41. Cao, Y.; Tian, L.; Gao, Y.; Liu, F. Genetic diversity of cultivated and Ussurian pear (Pyrus ussuriensis Maxim.) in China evaluated with M13-tailed SSR markers. Genet. Resour. Crop Evol. 2012, 59, 9–17. [Google Scholar] [CrossRef]
  42. Wuyun, T.; Amo, H.; Xu, J.; Ma, T.; Uematsu, C.; Katayama, H. Population structure of and conservation strategies for wild Pyrus ussuriensis Maxim. In China. PLoS ONE 2015, 10, e0133686. [Google Scholar] [CrossRef] [PubMed] [Green Version]
  43. Bennici, S.; Las Casas, G.; Distefano, G.; Di Guardo, M.; Continella, A.; Ferlito, F.; Gentile, A.; La Malfa, S. Elucidating the contribution of wild related species on autochthonous pear germplasm: A case study from Mount Etna. PLoS ONE 2018, 13, e0198512. [Google Scholar] [CrossRef] [PubMed] [Green Version]
  44. Debussche, M.; Isenmann, P. Fleshy fruit characters and the choices of bird and mammal seed dispersers in a Mediterrenean region. OIKOS 1989, 56, 327–338. [Google Scholar] [CrossRef]
  45. Pigozzi, G. Frugivory and seed dispersal by the European badger in a Mediterrenean habitat. J. Mammal. 1992, 73, 630–639. [Google Scholar] [CrossRef]
  46. Pikelj, K.; Juračić, M. Eastern Adriatic coast (EAC): Geomorphology and coastal vulnerability of a karstic coast. J. Coast. Res. 2013, 29, 944–957. [Google Scholar] [CrossRef]
  47. Joffre, R.; Rambal, S. Mediterranean Ecosystems; Macmillan Publishers Ltd.; Nature Publishing Group: London, UK, 2001. [Google Scholar] [CrossRef]
  48. Bednorz, L. Morphological variability of leaves of Sorbus torminalis (L.) Crantz in Poland. Acta Soc. Bot. Pol. 2006, 3, 233–243. [Google Scholar] [CrossRef] [Green Version]
  49. WinFolia TM, version PRO 2005b; Regent Instruments Inc.: Quebec City, QC, Canada, 2001.
  50. Hijmans, R.J.; Cameron, S.E.; Parra, J.L.; Jones, P.G.; Jarvis, A. Very high resolution interpolated climate surfaces for global land areas. Int. J. Climatol. 2005, 25, 1965–1978. [Google Scholar] [CrossRef]
  51. Fick, S.E.; Hijmans, R.J. WorldClim 2: New 1km spatial resolution climate surfaces for global land areas. Int. J. Climatol. 2017, 37, 4302–4315. [Google Scholar] [CrossRef]
  52. Temunović, M.; Franjić, J.; Šatović, Z.; Grgurev, M.; Frascaria-Lacoste, N.; Fernández-Manjarrés, J.F. Environmental heterogeneity explains the genetic structure of continental and Mediterranean populations of Fraxinus angustifolia Vahl. PLoS ONE 2012, 7, e42764. [Google Scholar] [CrossRef] [Green Version]
  53. Sokal, R.R.; Rohlf, F.J. Biometry: The Principles and Practice of Statistics in Biological Research, 4th ed.; W.H. Freeman and Co.: New York, NY, USA, 2012; p. 937. [Google Scholar]
  54. Koutecký, P. MorphoTools: A set of R functions for morphometric analysis. Plant Syst. Evol. 2015, 301, 1115–1121. [Google Scholar] [CrossRef]
  55. Mantel, N. The detection of disease clustering and a generalized regression approach. Cancer Res. 1967, 27, 209–220. [Google Scholar] [PubMed]
  56. Legendre, P.; Fortin, M.J. Spatial pattern and ecological analysis. Vegetatio 1989, 80, 107–138. [Google Scholar] [CrossRef]
  57. Oksanen, J.; Blanchet, F.G.; Friendly, M.; Kindt, R.; Legendre, P.; McGlinn, D.; Minchin, P.R.; O’Hara, R.B.; Simpson, G.L.; Solymos, P.; et al. Package ‘Vegan’: Community Ecology Package; Version 2.4-2. 2017. Available online: https://github.com/vegandevs/vegan (accessed on 24 June 2021).
  58. McGarigal, K.; Cushman, S.; Stafford, S. Multivariate Statistics for Wildlife and Ecology Research; Springer: New York, NY, USA, 2000; p. 283. [Google Scholar]
  59. Douaihy, B.; Sobierajska, K.; Jasińska, A.K.; Boratyńska, K.; Ok, T.; Romo, A.; Machon, N.; Didukh, Y.; Dagher-Kharrat, M.B.; Boratyński, A. Morphological versus molecular markers to describe variability in Juniperus excelsa subsp. excelsa (Cupressaceae). AOB Plants 2012, 2012, pls013. [Google Scholar] [CrossRef] [PubMed] [Green Version]
  60. Boratyński, A.; Jasińska, A.K.; Marcysiak, K.; Mazur, M.; Romo, A.M.; Boratyńska, K.; Sobierajska, K.; Iszkuło, G. Morphological differentiation supports the genetic pattern of the geographic structure of Juniperus thurifera (Cupressaceae). Plant Syst. Evol. 2013, 299, 773–784. [Google Scholar] [CrossRef] [Green Version]
  61. Sobierajska, K.; Boratyńska, K.; Jasińska, A.; Dering, M.; Ok, T.; Douaihy, B.; Dagher-Kharrat, M.B.; Romo, A.; Boratyński, A. Effect of the Aegean Sea barrier between Europe and Asia on differentiation in Juniperus drupacea (Cupressaceae). Bot. J. Linn. Soc. 2016, 180, 365–385. [Google Scholar] [CrossRef] [Green Version]
  62. Poljak, I.; Idžojtić, M.; Šapić, I.; Korijan, P.; Vukelić, J. Diversity and structure of Croatian continental and Alpine-Dinaric populations of grey alder (Alnus incana /L./ Moench subsp. incana); Isolation by distance and environment explains phenotypic divergence. Šumar. List 2018, 142, 19–31. [Google Scholar] [CrossRef]
  63. Statistica (Data Analysis Software System), version 13; TIBCO Software Inc.: Palo Alto, CA, USA, 2018; Available online: http://www.statsoft.com. (accessed on 15 September 2021).
  64. R Core Team. R: A Language and Environment for Statistical Computing; R Foundation for Statistical Computing: Vienna, Austria, 2016; Available online: http://www.R-project.org/. (accessed on 15 September 2021).
  65. Yilmaz, K.U.; Uzun, A.; Cam, M.; Ercisli, S. Some morphological and fruit characteristics of naturally grown Pyrus elaeagnifolia Pall. of Kayseri province (Central Anatolia, Turkey). Gen. Resour. Crop. Evol. 2015, 62, 711–720. [Google Scholar] [CrossRef]
  66. Terpó, J.; de Amaral Franco, J. Pyrus L. In Flora Europaea; Tutin, T.G., Heywood, V.H., Burges, N.A., Moore, D.M., Valentine, D.H., Walters, S.M., Webb, D.A., Eds.; Cambridge University Press: Cambridge, UK, 1968; pp. 65–66. [Google Scholar]
  67. Paganová, V. Taxonomic reliability of leaf and fruit morphological characteristics of the Pyrus L. taxa in Slovakia. Hortic. Sci 2003, 30, 98–107. [Google Scholar] [CrossRef] [Green Version]
  68. Čolić, S.; Rakonjac, V.; Zec, G.; Nikolić, D.; Fotirić Akšić, M. Morphological and biochemical evaluation of selected almond (Prunus dulcis (Mill.) D.A.Webb.) genotypes in Northern Serbia. Turk. J. Agric. For. 2012, 36, 429–438. [Google Scholar] [CrossRef]
  69. Khadivi-Khub, A.; Zamani, Z.; Reza Fatahi, M. Multivariate analysis of Prunus subgen. Cerasus germplasm in Iran using morphological variables. Genet. Resour. Crop Evol. 2012, 59, 909–926. [Google Scholar] [CrossRef]
  70. Farsad, A.; Esna-Ashari, M. Genetic diversity of some Iranian sweet cherry (Prunus avium) cultivars using microsatellite markers and morphological traits. Cytol. Genet. 2016, 50, 8–19. [Google Scholar] [CrossRef]
  71. Miljković, D.; Stefanović, M.; Orlović, S.; Stanković Neđić, M.; Kesić, L.; Stojnić, S. Wild cherry (Prunus avium (L.) L.) leaf shape and size variations in natural populations at different elevations. Alp. Bot. 2019, 129, 163–174. [Google Scholar] [CrossRef]
  72. Kumar, C.; Singh, S.K.; Pramanick, K.K.; Verma, M.K.; Srivastav, M.; Rakesh, S.; Bharadwaj, C.; Naga, K.C. Morphological and biochemical diversity among the Malus species including indigenous Himalayan wild apples. Sci. Hortic. 2018, 233, 204–219. [Google Scholar] [CrossRef]
  73. Kidner, C.A.; Umbreen, S. Why is leaf shape so variable? Int. J. Plant Dev. Biol. 2010, 4, 64–75. [Google Scholar]
  74. Niinemets, U. Adjustment of foliage structure and function to a canopy light gradient in two co-existing deciduous trees; Variability in leaf inclination angles in relation to petiole morphology. Trees 1998, 12, 446–451. [Google Scholar] [CrossRef]
  75. Kessler, S.; Sinha, N. Shaping up: The genetic control of leaf shape. Curr. Opin. Plant Biol. 2004, 7, 65–72. [Google Scholar] [CrossRef] [PubMed]
  76. Tsukaya, H. Leaf shape: Genetic controls and environmental factors. Int. J. Dev. Biol. 2005, 49, 547–555. [Google Scholar] [CrossRef] [PubMed] [Green Version]
  77. Popović, V.; Kerkez, I. Population variability of wild cherry (Prunus avium L.) in Serbia according to the leaf morphology. Šumar. List 2016, 140, 347–355. [Google Scholar] [CrossRef] [Green Version]
  78. Brus, R.; Ballian, D.; Bogunić, F.; Bobinac, M.; Idžojtić, M. Leaflet morphometric variation of service tree (Sorbus domestica L.) in the Balkan Peninsula. Plant Biosyst. 2011, 145, 278–285. [Google Scholar] [CrossRef]
  79. Said, A.A.; Oukabli, A.; Gaboun, F.; Simard, M.H.; El Modafar, C. Phenotypic biodiversity of an endemic wild pear, Pyrus mamorensis Trab. in North-western Morocco using morphological descriptors. Genet. Resour. Crop Evol. 2013, 60, 927–938. [Google Scholar] [CrossRef]
  80. Zarei, A.; Erfani-Moghadam, J.; Jalilian, H. Assessment of variability within and among four Pyrus species using multivariate analysis. Flora 2019, 250, 27–36. [Google Scholar] [CrossRef]
  81. Nadjat, T.; Tayeb, S. Effect of environmental conditions on morphological variability of leaves and fruits of five populations of Pistacia atlantica Desf. in North Algeria. Biodiv. Res. Conserv. 2020, 58, 1–12. [Google Scholar] [CrossRef]
  82. Garland, T., Jr.; Kelly, S.A. Phenotypic plasticity and experimental evolution. J. Exp. Biol. 2006, 209, 2344–2361. [Google Scholar] [CrossRef] [Green Version]
  83. Gratani, L. Plant phenotypic plasticity in response to environmental factors. Adv. Bot. 2014, 2014, 208747. [Google Scholar] [CrossRef] [Green Version]
  84. Benito Garzón, M.; Alía, R.; Robson, T.M.; Zavala, M.A. Intra-specific variability and plasticity influence potential tree species distributions under climate change. Glob. Ecol. Biogeogr. 2011, 20, 766–778. [Google Scholar] [CrossRef] [Green Version]
  85. Fox, R.J.; Donelson, J.M.; Schunter, C.; Ravasi, T.; Gaitán-Espitia, J.D. Beyond buying time: The role of plasticity in phenotypic adaptation to rapid environmental change. Philos. Trans. B 2019, 374, 20180174. [Google Scholar] [CrossRef] [PubMed]
  86. Savolainen, O.; Pyhäjärvi, T.; Knürr, T. Gene flow and local adaptation in trees. Ann. Rev. Ecol. Evol. Syst. 2007, 38, 595–619. [Google Scholar] [CrossRef]
  87. Wright, S. Isolation by distance. Genetics 1943, 28, 114–138. [Google Scholar] [CrossRef] [PubMed]
  88. Wang, I.J.; Bradburd, G.S. Isolation by environment. Mol. Ecol. 2014, 23, 5649–5662. [Google Scholar] [CrossRef]
  89. Nosil, P. Ecological Speciation; Oxford University Press: Oxford, UK, 2012. [Google Scholar] [CrossRef]
  90. Cortés, A.J.; Garzón, L.N.; Valencia, J.B.; Madriñán, S. On the causes of rapid diversification in the Páramos: Isolation by ecology and genomic divergence in Espeletia. Front. Plant Sci. 2018, 9, 1700. [Google Scholar] [CrossRef]
  91. Orsini, L.; Vanoverbeke, J.; Swillen, I.; Mergeay, J.; De Meester, L. Drivers of population genetic differentiation in the wild: Isolation by dispersal limitation, isolation by adaptation and isolation by colonization. Mol. Ecol. 2013, 22, 5983–5999. [Google Scholar] [CrossRef] [PubMed]
  92. Dewoody, J.; Trewin, H.; Taylor, G. Genetic and morphological differentiation in Populus nigra L.: Isolation by colonization or isolation by adaptation? Mol. Ecol. 2015, 24, 2641–2655. [Google Scholar] [CrossRef] [PubMed] [Green Version]
  93. Ribbens, E.; Silander, J.A.; Pacala, S.W. Seedling recruitment in forests: Calibrating models to predict patterns of tree seedling dispersion. Ecology 1994, 75, 1794–1806. [Google Scholar] [CrossRef]
Figure 1. Results of the multivariate statistical methods and locations of the 17 sampled Pyrus spinosa populations. (A) Geographical distribution of three groups of populations detected from K-means clustering method (the proportions of the ancestry of each population in each of the defined clusters are colour-coded: cluster A—green, cluster B—yellow, cluster C—blue); and (B) Principal component analysis of 12 environmental variables reveals heterogeneous environments at the 17 sampling locations. Acronyms of populations: P01—Škropeti; P02—Žminj; P03—Pula; P04—Vir; P05—Obrovac; P06—Nin; P07—Krka; P08—Drniš; P09—Sinj; P10—Muć; P11—Blato na Cetini; P12—Biokovo; P13—Brač; P14—Hvar; P15—Pelješac; P16—Slano; P17—Konavle.
Forests 12 01630 g001
Figure 2. Partitioning of total variance by hierarchical level for studied leaf phenotypic traits. Acronyms for leaf morphometric traits as in Table 1.
Forests 12 01630 g002
Figure 3. Isolation-by-distance (IBD) and isolation-by-environmental distance (IBE). Scatter plots of simple Mantel tests showing the relationships between: (A) geographic and phenotypic distances (r = 0.2516, p = 0.029); and (B) environmental and phenotypic distances (r = 0.4134, p = 0.002).
Forests 12 01630 g003
Figure 4. Tree diagram of researched 17 Pyrus spinosa populations. The unweighted pair-group method with arithmetic mean (UPGMA) was used to join the clusters, and the Euclidean distance to define the distance between the studied populations. Acronyms of populations: P01—Škropeti; P02—Žminj; P03—Pula; P04—Vir; P05—Obrovac; P06—Nin; P07—Krka; P08—Drniš; P09—Sinj; P10—Muć; P11—Blato na Cetini; P12—Biokovo; P13—Brač; P14—Hvar; P15—Pelješac; P16—Slano; P17—Konavle. The dashed rectangles on the dendrogram encompass distinct clusters that correspond to the clusters obtained by the K-means method (Figure 1), with the exception of populations P06, P16 and P17, which were clustered into blue and green clusters according to the K-means method, respectively.
Forests 12 01630 g004
Figure 5. Biplot of the principal component (PC) analysis based on ten leaf morphometric traits in studied Pyrus spinosa populations. Acronyms for leaf morphometric traits as in Table 1. Acronyms of populations: P01—Škropeti; P02—Žminj; P03—Pula; P04—Vir; P05—Obrovac; P06—Nin; P07—Krka; P08—Drniš; P09—Sinj; P10—Muć; P11—Blato na Cetini; P12—Biokovo; P13—Brač; P14—Hvar; P15—Pelješac; P16—Slano; P17—Konavle.
Forests 12 01630 g005
Table 1. Descriptive statistics for analyzed traits of Pyrus spinosa leaves from 17 studied populations. M—arithmetic mean; SD—standard deviation; Min—minimal value; Max—maximal value; CV—coefficient of variation (%).
TraitAcronymsMSDMinMaxCV (%)
Leaf area (cm2)LA3.311.510.4212.5345.62
Perimeter (cm)P8.221.993.3117.0924.16
Form coefficientFC0.600.110.270.9518.02
Leaf length (cm)LL3.410.861.347.3225.23
Maximal leaf width (cm)MLW1.320.360.403.2627.36
Position of maximal leaf width (cm)PMLW1.730.480.543.9727.69
Leaf width top (cm)LWT0.670.200.201.8629.81
Leaf angle 1 (°)LA136.158.1814.0067.0022.61
Leaf angle 2 (°)LA229.286.3812.0055.0021.81
Petiole length (cm)PL1.130.490.063.6243.22
Table 2. Pearson’s correlation coefficients between ten phenotypic traits and scores of the first three principal components.
TraitPC—Principal Component
PC1PC2PC3
Leaf area−0.972374−0.131015−0.101500
Perimeter−0.9482750.2506230.000705
Form coefficient−0.075091−0.965928−0.072853
Leaf length−0.9117060.3521560.005661
Maximal leaf width−0.870284−0.456680−0.098129
Position of maximal leaf width−0.8850130.426979−0.102035
Leaf width top−0.799420−0.430650−0.229308
Leaf angle 10.083034−0.9159720.117808
Leaf angle 2−0.058789−0.9860120.068873
Petiole length−0.776832−0.0168070.596121
Eigenvalue5.473.520.46
% Total variance54.7535.254.62
Publisher’s Note: MDPI stays neutral with regard to jurisdictional claims in published maps and institutional affiliations.

