Article

Spatiotemporal Evaluation and Driving Mechanism of Land Ecological Security in Yan’an, a Typical Hill-Gully Region of China’s Loess Plateau, from 2000 to 2018

1
School of Life Sciences, Yan’an University, Yan’an 716000, China
2
Yan’an Key Laboratory of Ecological Restoration, Yan’an 716000, China
3
Northwest Institute of Eco-Environment and Resources, Chinese Academy of Sciences, Lanzhou 730030, China
*
Author to whom correspondence should be addressed.
Submission received: 3 October 2021 / Revised: 8 December 2021 / Accepted: 10 December 2021 / Published: 12 December 2021
(This article belongs to the Special Issue Effects of Environmental Changes on Forest Growth and Stability)

Abstract

:
Forest landscape restoration and ecosystem of Loess Plateau have enhanced prominently, since the policy implementation (1999) of the Grain for Green Project in China. Land ecological security (LES) performs an extremely critical function for protecting vulnerable land resources and sustaining forest ecosystem stability. Predecessors’ studies substantially concentrate on biophysical and meteorologic variables using numerous grounded methodologies, little research has been launched on systematic natural-socio-economic-ecological relationships and how these contributions and regulations for LES evaluation. Here, pressure-state-response (PSR) model was used to establish the evaluation system of LES in regional-scale, and LES was classified into five levels measured by ecological security index (S), including high (S ≥ 0.75), medium−high (0.65 ≤ S < 0.75), medium (0.55 ≤ S < 0.65), medium−low (0.45 ≤ S < 0.55), and low (S < 0.45) level, for systematically analyzing its spatiotemporal distribution characteristic and response mechanism to explanatory variables in Yan’an, northwest China, from 2000 to 2018. The results demonstrated that: (1) LES status was mainly characterized by medium−high level and medium level, and maintained profound stability. (2) zone with medium−high LES level was mainly concentrated in western and southern regions, continuously expanding to northeast regions, and possessed the largest territorial area, accounting for 37.22–46.27% of the total area in Yan’an. (3) LES was primarily susceptible to normalized differential vegetation index, vegetation coverage, and land surface temperature with their optimal impacting thresholds of 0.20–0.64, 0.20–0.55, and 11.20–13.00 °C, respectively. (4) Normalized differential vegetation index and vegetation coverage had a significant synergistic effect upon LES based on their interactive explanation rate of 31% and had significant variation consistency (positive and negative) with LES, which were powerfully suggested to signal the intensification of the regional eco-security level in the persistent eco-greening process.

1. Introduction

Ecological security mainly refers to the balance of the internal ecosystem of land resources and the supply of ecological needs, ensuring the security of land quantity, quality, structural integrity, preserving the stability of the function of an ecosystem, due to its direct relationship with sustainable natural, economic and social development [1,2]. Forests, the Earth’s largest terrestrial ecosystems, provide crucial services to human society [3]. Statistically, global forest coverage of the earth’s terrestrial surface declined from 31.60% to 30.60% between 1990 and 2015, and every year, 10 million hectares (ha) of forest are lost [4]. Forest landscape restoration (FLR) is an effective approach to restore forest ecosystems, sustain the diverse ecosystem services, and break the socioeconomic loss [5,6], which was promoted by the Global Partnership on Forest and Landscape Restoration—the global network established in 2003 [7]. Large-scale ecological restoration programs have been implemented worldwide. Such as, the government of Germany and International Union for Conservation of Nature (IUCN) launched globally the Bonn Challenge in 2011 to achieve a restoration target of 150 million hectares (Mha) of land by 2020, and 350 Mha by 2030 [8,9]. The implementation of numerous existing multilateral environmental agreements, harmonizing together the Bonn Challenge, including the United Nation Convention on Biological Diversity (UNCBD); the Aichi Target 15 to restore 15% of degraded ecosystems by 2020 [9]; the United Nations Convention to Combat Desertification’s (UNCCD) and the United Nations Conference on Sustainable Development’s (“Rio + 20”) zero net land degradation goal [10]. India launched a program to increase its forests by an 8 million ha area by 2030 [11]. Additionally, the Global 2030 Agenda for Sustainable Development Goals (SDG 15) aims to protect, restore terrestrial ecosystems, forests manage sustainably, and halt land degradation and biodiversity loss, was accepted by all countries [12,13]. It focuses on the relationship between the sustainable management of natural resources and social and economic development [14]. In domestic, many large-scale ecological policies also have been implemented to mitigate unprecedented ecological degradation. such as the “Natural Forest Conservation Program” and the “Grain-for-Green Program” [15,16]. The policy implementation above generates positive ecological, societal, and economic effects in forest and ecosystem services valuation.
Land ecological security (LES) is a frontier regional hotspot in sustainable utilization of land resources [17], especially, in the western arid region of China due to its fragile and insecure ecological environment [18,19]. Thereby, it is urgently imperative to determine how to maintain and strengthen the security of the land ecosystem [20]. Since “land health” was proposed, relevant methods for the quantitative description of regional land safety have been unavoidably developed [21]. The international institute for applied systems analysis (IIASA) firstly defined ecological security in 1989, thereby laying the foundation for LES [22]. LES mainly involves the determination methods, indicator system, impact factors, and safety thresholds [23]. Numerous ways are established to evaluate LES, such as comprehensive index, entropy weight method, ecological footprint, landscape ecology, and ecosystem service value [24,25,26]. Yet, there is less objectivity due to the limitation of many evaluation methods because biophysical and meteorologic variables are just mentioned, and LES evaluation undoubtedly involves a wide range of aspects, both the socio, economic, and ecological aspects. In consequence, some models increasingly appear to improve the comprehensiveness of methods [27]. Such as, the pressure-state-response model (PSR) has been commonly used to establish a time-scale index system to assess LES, to thoroughly investigate how to determine the status of regional LES, the rationality of land use, and the management of land [28,29]. The function of three indicators in the PSR framework include: (1) pressure expressing pressures on environment originating from human economic and social activities, (2) state showing describing the status of environment and resources, and (3) response describing the societal response to environmental changes [30]. By establishing the spatiotemporal pattern of differing ecological landscapes to better realize the strength of the environment [31]. Indeed, using data from LES modeling, the contribution of security assessment factors can then be quantified, and crucial drivers and their spatial relationships can be determined, so regional environmental assessments can be fully addressed [32]. However, regional timing studies are primarily focused in much of the literature, the gap exists in comprehensive studies on spatiotemporal patterns and driving factors of LES [33]. Though the primary influencing factors of LES are frequently determined via the numerous multivariate approaches, neither the optimal threshold of primary influencing factor nor the contribution rate of each factor and interactions among them have yet to be determined [34]. For example, the proximities to the urban center, developed areas, sources of pollution, the density of built-up areas, and normalized difference vegetation index were identified as the explanatory factors for exploring LES status in Shanghai [15]; urban built-up area, transportation, vegetation cover, and ecosystem service were used as the spatial variables for assessing LES of Guangzhou [35]. Substantially explanatory variables (various constructions and landscape features) to LES were just acknowledged in these studies, the primary interactions and the contribution threshold of explanatory variables would necessarily explore further. Additionally, the natural-social-economic framework is another model useful for evaluating LES status [36,37]. It uses data from natural, economic, and social-ecological aspects of land to construct the index system to comprehensively convey regional LES [38]. In the light of land is a highly coupled social-economic-ecological complex, LES attaches importance to the dynamic interaction, action, and reaction processes between humans and land systems [39,40]. Therefore, establishing a robust, comprehensive human–land evaluation index can simultaneously systematically raise the accuracy of LES evaluation [41].
The Grain for Green Project in China was launched in 1999 and has significantly facilitated an environment with well-protected ecological restoration status on the Loess Plateau [42]. Yan’an city, a hill and gully region of Loess Plateau, was established as a representative experimental area with an area of 707 km2 for ecological rehabilitation [43]. Nevertheless, it still has prominent environmental problems and a fragile ecosystem influenced by human activities and economic growth, being recognized as the significant characterization indexes for ecological security [44,45]. Primary interactions and explanatory threshold of substantial environment variables for LES evaluation are still fuzzy. Furthermore, predecessors’ studies of ecological security in Yan’an largely concentrate on biophysical, meteorologic characteristics and quantification through models, little attention has been paid to natural-socio-economic-ecological relationships and how their contributions and influence mechanisms [46,47]. Given this consideration, here we analyzed the LES status of Yan’an during 2000–2018 (after the implementation of the “Grain for Green” policy) to explore two objectives: (1) Utilizing geographic information system (GIS) technology and PSR model to ascertain the spatiotemporal tendency and pattern of LES levels via integrated natural-socio-economic-ecological systems. (2) Utilizing canonical correspondence analysis (CCA), random forest model, and Venn diagram to lastly detect the vital driving factors of LES, with their optimal influence threshold and interactive interpretation rate. The aim here was to fundamentally provide a sound basis for stabilizing and improving forest landscape and ecosystem safety in Yan’an.

2. Materials and Methods

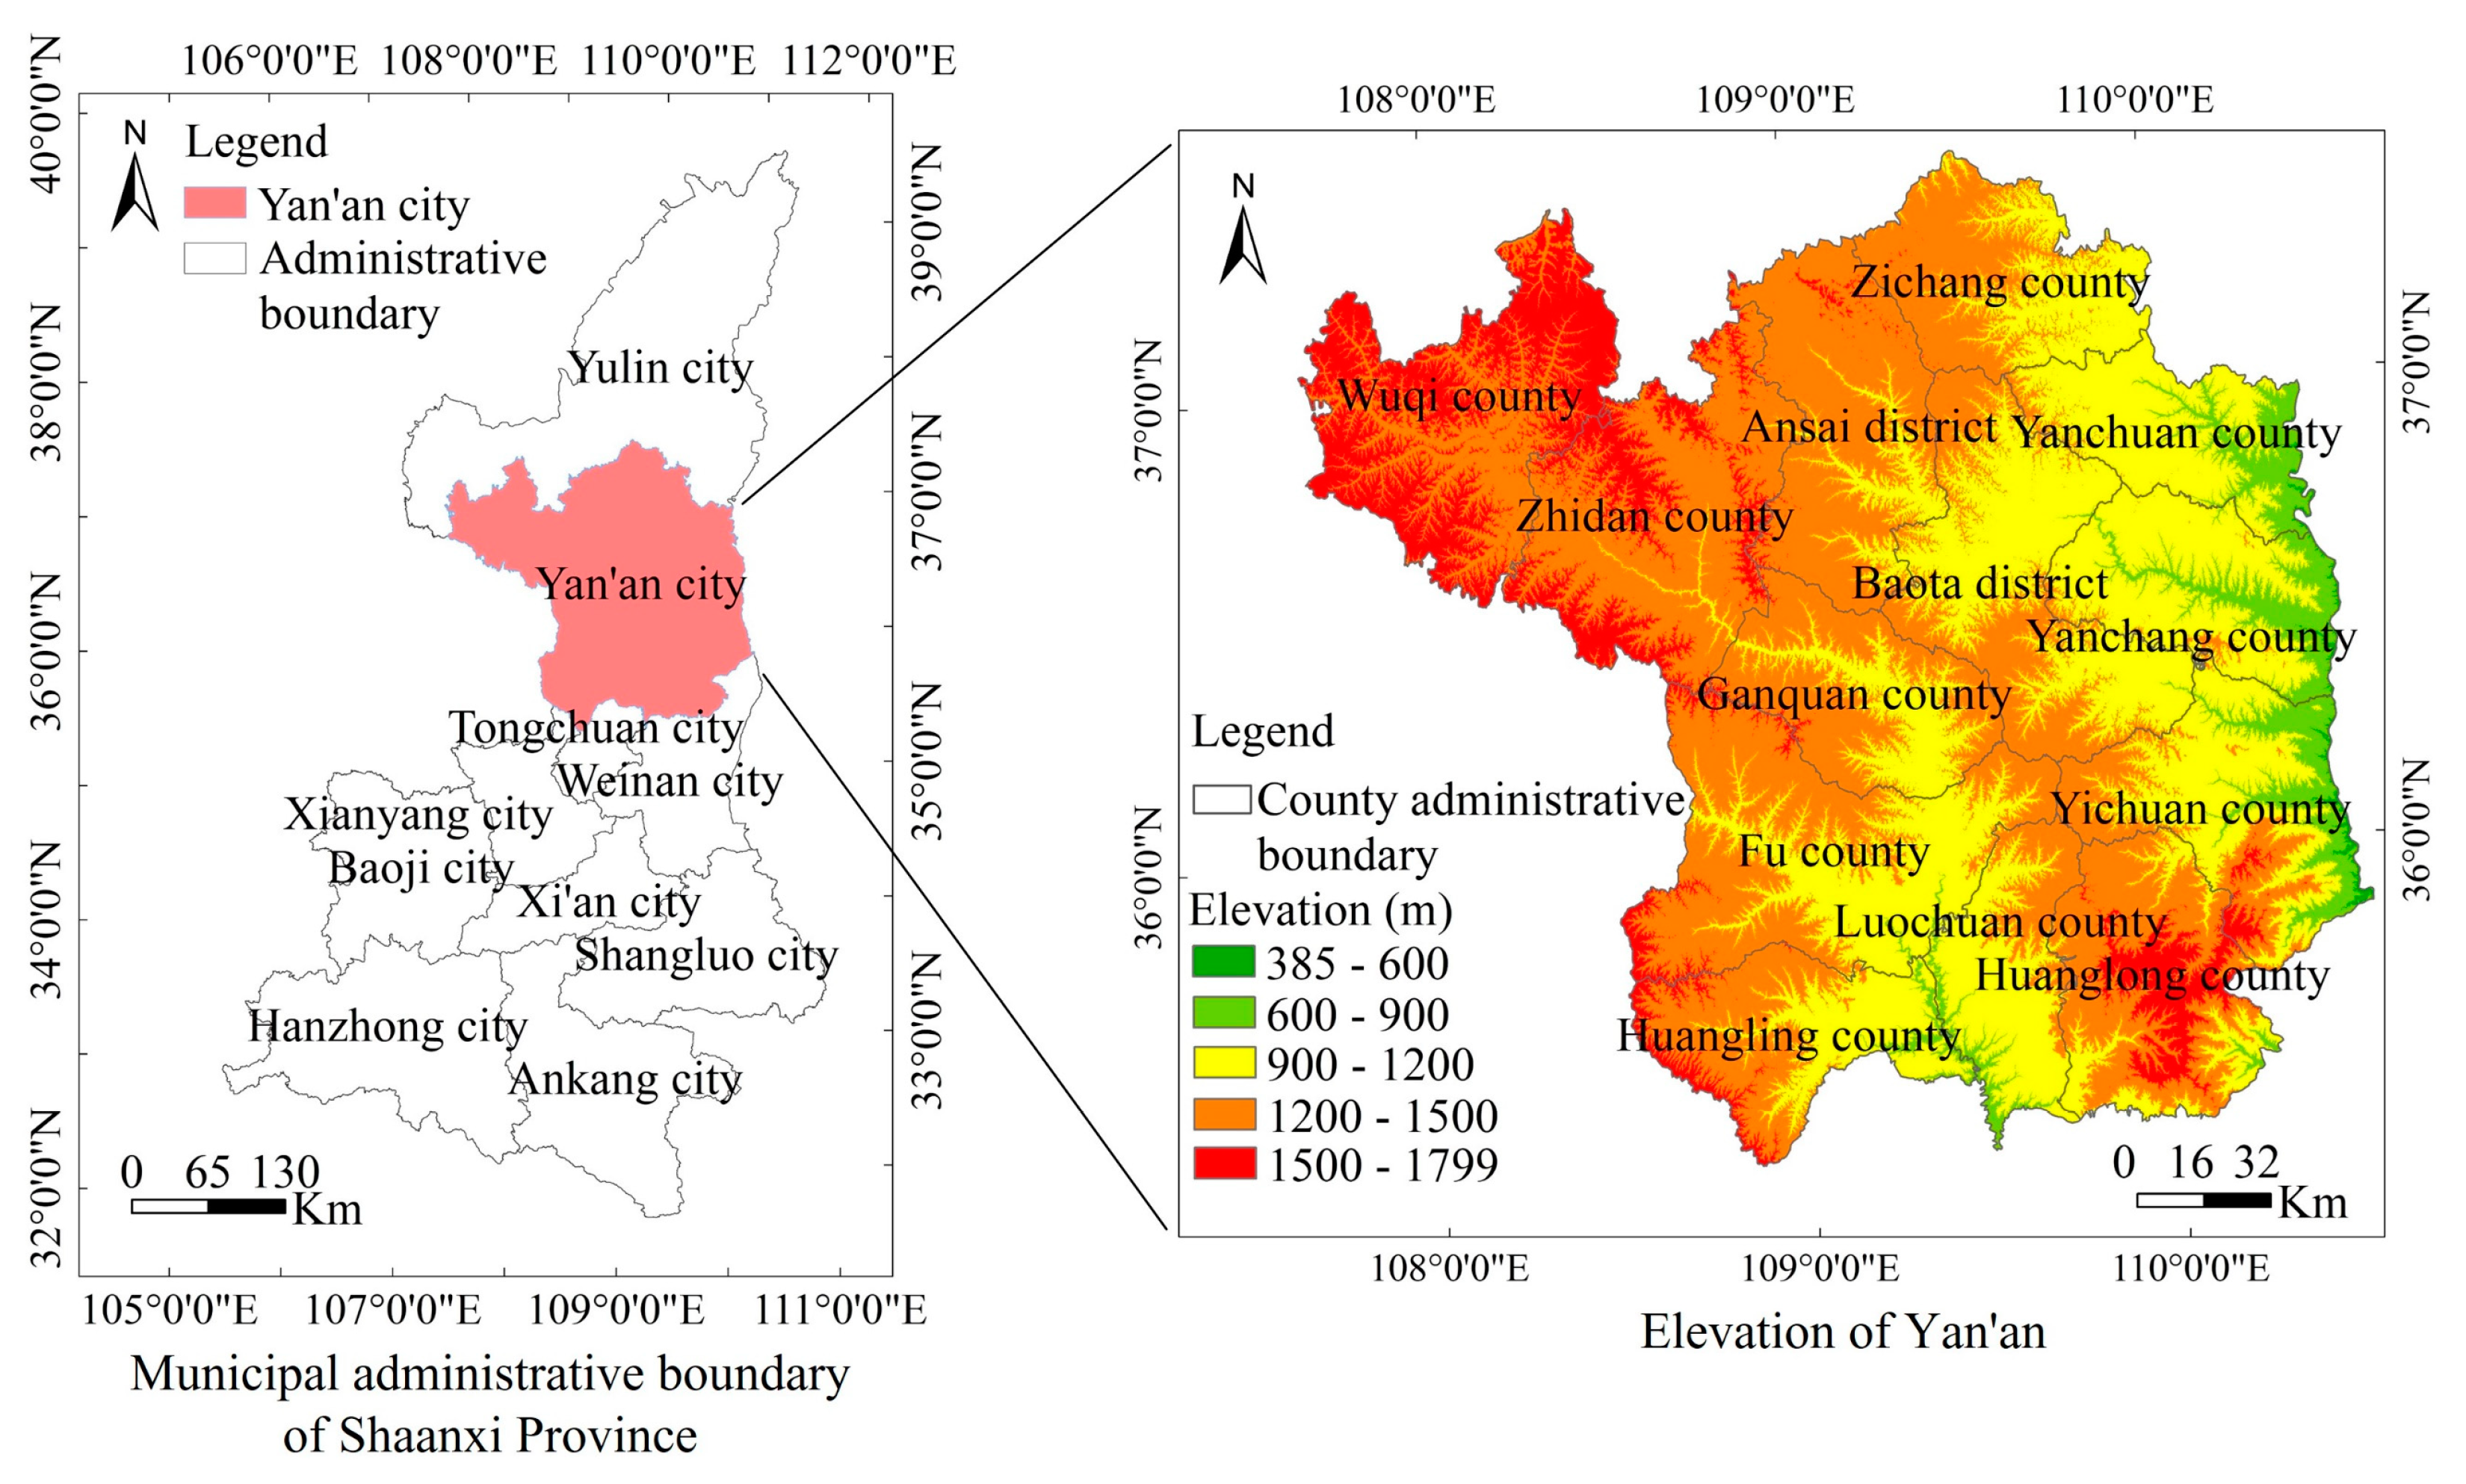
2.1. Overview of the Study Region

Yan’an, located in the central and southern region of Loess Plateau, northern Shaanxi Province (35°21′ N–37°31′ N, 107°41′ E–110°31′ E), has jurisdiction over two districts and 11 counties, encompassing 37,037 km2 (Figure 1). Yan’an is dominated by tableland and beam terrain, lying at an average elevation of 1200 m, within a monsoon climate that provides 2418 h of sunshine per year, large diurnal temperature differences, and an average annual frost-free period of 162 d. The annual average temperature is 7.7–10.6 °C and the annual average precipitation approximates 500 mm [48]. Based on the deterioration of ecosystems significantly threats land security in the process of urbanization and human activities, it has become a major implementation region of the National Returning Farmland to Forest Project [15]. Now, vegetation coverage exceeds 80%, forest coverage exceeds 46%, and forest and grass vegetation coverage exceeds 67% in Yan’an, benefiting from this policy implementation [49].

2.2. Establishment of Evaluation System

LES is closely related to resource and environmental problems, human population, social and economic conditions, and ecosystem health. The present research considers sustainable forest and land ecological management as the integration of biophysical, social, economic, and environmental elements. Preserving social, economic, and ecological values while simultaneously maintaining ecosystem security and sustainability is a global successful model based on experience in forest and land communities because provisioning ecosystem services from the forests and land contribute much to national society and economy [46]. For example, forest management modality determines the distribution of economic benefits, people living near forests receive the highest economic benefits; ecosystems productivity and richness are endowed with socio-demographic and socioeconomic levels [47]. Therefore, establishing a natural-socio-economic-ecological system by using grounded theory methodology to select the variables for LES evaluation is urgently necessary [50]. It integrates natural components (slope, vegetation coverage, land surface temperature, water coverage, land relief), social components (population density, human disturbance index, degree of land use, town buffer classification), economic components (GDP per capita, grain output per capita, economic density, Regional development index), and ecological components (Soil erosion sensitivity, ecosystem services, ecosystem resilience) to understand their interactions through management practices(Table 1).
Ecological problems are mounting in Yan’an because of its increasingly urban population and expanding urban construction, which puts pressure (population and urban expansion, economic growth, human activity, and changes in land structure) on the region’s already fragile ecological environment. Hence, based on the structure of the PSR model and data availability and practicability, 18 indexes of the natural-socio-economic-ecological system (dividing into three categories: regional environmental pressure, regional environmental status, and regional human response) are used to construct a comprehensive evaluation framework of Yan’an in PSR model (Table 1) [1,51,52].
Secondly, the entropy weight method is chosen to determine the Weightiness of each evaluation system (Table 1) [53]. This method uses the information of each index to determine its importance and then calculates each evaluation index accordingly, thereby effectively eliminating subjectivity [54].
The entropy value of each evaluation index is calculated by the way (2):
H i = K × i = 1 n C i j × I n ( C i j ) C i j = a i j i = 1 n a i j
where, i and j represent two random evaluation indexes in the evaluation system of LES (Table 1), Hi > 0, K > 0 (generally, K = 1 lnn−1) and 0 < Hi < 1, (i = 1, 2, …, n). When Cij = 0, lnCij has an infinite value, so it is necessary to correct Cij and shift the aij. The modified formula to calculate Cij is given by:
C i j = a i j + B i = 1 n ( a i j + B )
where i and j represent two random evaluation indexes in the evaluation system of LES (Table 1), B represents the translation amplitude, taking the fixed value of 0.1.
The weight of each evaluation index is shown below:
W i = 1 H i n i = 1 n H i
where i and j represent two random evaluation indexes in the evaluation system of LES (Table 1), Wi represents the entropy weight of the ith index, Hi represents the information entropy of the ith index, and n represents the number of index.

2.3. Data Source and Processing

Municipal, county-level administrative vector boundary, natural-socio-economic-ecological raster data are needed in this study to establish the evaluation system of the PSR model for LES assessment.
Municipal, and county-level administrative vector boundaries of China (the boundaries in 2015 is employed in this study) are collected from the Resources and Environmental Science Data Center, Chinese Academy of Sciences (http://www.resdc.cn, accessed on 19 May 2020) [55], the municipal, and county-level administrative vector boundary of Yan’an is obtained by editor tool and clip tool in ArcGIS 10.6 software exploited by the Environmental Systems Research Institute (ESRI), Inc., Redlands, CA, USA (the same below).
Raster data with a spatial resolution of 1000 m × 1000 m for remotely sensed monitoring of land use, NDVI, DEM, soil erosion in 2000, 2005, 2010, 2015, 2018 is collected from the Resources and Environmental Science Data Center, Chinese Academy of Sciences (http://www.resdc.cn, accessed on 4 June 2020) [55]. Satellite image of land use is derived from the remote sensing image of Landsat TM/ETM (obtaining from United States Geological Survey (https://earthexplorer.usgs.gov, accessed on 15 June 2020) [56], the details of collected satellite images with cloudage ≤ 5% are shown in Table 2) and is based on the completion of artificial visual interpretation (including radiation correction, geometric correction, seamless mosaic and extract, classification), the classification and description of different types of land use by artificial visual interpretation are shown in Table 3. For ensuring the precision of land use data derived from the Resources and Environmental Science Data Center, Chinese Academy of Sciences, Majority/Minority tool of ENVI 5.3 software is used to process the tiny patches of raster data of five stages (2000–2018) by comparing the high-resolution images obtained by Google Earth, and adjusted raster classification of land use is obtained. Then, the confusion matrix and ROC curve method are selected to evaluate the precision of adjusted raster classification (total precision and Kappa coefficient are the precision indexes) [57]. Finally, the average total precision and Kappa coefficient of revised raster classification in five stages (2000–2018) are 89.40% and 0.872, respectively (both exceeding 0.75), indicating that adjusted raster classification of land use has excellent precision, and can evaluate LES further. Meanwhile, raster data of NDVI is derived from the SPOT/VEGETATION and MODIS satellite and is based on the method of maximum value composite [52]; raster data of DEM is based on SRTM (Shuttle Radar Topography Mission) data and the method of resampling; raster data of slope and land relief is extracted from DEM using ArcGIS 10.6 software [49]; land surface temperature (annual mean value) is calculated based on Band 6 of Landsat 5 TM and band 10 of Landsat 8 OLI_TIRS (obtaining from the Geospatial Data Cloud by http://www.gscloud.cn, accessed on 24 September 2020, cloudage ≤ 5%) using image inversion of remote sensing, radiometric calibration, atmospheric correction, and seamless mosaic and extract are completed [52]; human disturbance index, town buffer classification, water coverage, the value of ecosystem services, ecosystem resilience, and regional development index are calculated and rasterized based on raster data of land use and grounded methodology using ArcGIS 10.6 software.
Socio-economic data of 2000, 2005, 2010, 2015, 2018, including population density, economic density, cultivated area per capita, GDP per capita, grain output per capita, are orderly derived and calculated from the statistics yearbook of Shaanxi Province and the statistical yearbook of Yan’an [55]. Then, they are added to the property sheet in all counties of Yan’an using ArcGIS 10.6 software and are converted to raster graphics.
Finally, raster graphics above in Yan’an is obtained from the extraction tool of ArcGIS 10.6 software by municipal, county-level administrative vector boundaries, and are resampled to the spatial resolution of 30 m × 30 m by using the resample tool for greatly improving the resolution of raster data and elevating the evaluation precision of LES.
Yet, due to different dimensions of evaluation indexes used, data is standardized by using Equation (1) [49]:
Positive   correlation   index :   a i j = x i j x min x max x min Negative   correlation   index :   a i j = x max x i j x max - x min
where aij represents the value of the jth index of ith unit after the standardization; Xij represents the original value of the jth index of the ith unit; Xmax represents the maximum value of the jth index of the ith unit, and Xmin represents the minimum value of the jth index of the ith unit.

2.4. Establishment of Evaluation Level of LES

After rasterized and standardized indexes of LES evaluation were obtained, a grid map of LES in Yan’an in 2000, 2005, 2010, 2015, and 2018 is generated, according to the weight of each index.
These data are combined with the PSR model, to quantify the ecological security index (S) of Yan’an, which could then be divided into five evaluation levels according to reported scholarly findings (Table 4) [58]. A higher value of S indicates better ecological security. Comprehensive evaluation criteria and LES status are shown as follows: high LES level represents zone is far away from the urban center, the ecosystem of land resource is undisturbed and undamaged, with high vegetation coverage, reasonable structure and function; medium−high LES level represents zone maintain a considerable distance away from the urban center, land ecosystem is less damaged, with higher vegetation coverage and ecosystem structure; medium LES level represents zone maintain a short distance away from the urban center, service structure and function of land resource ecosystem have been degraded, land have medium vegetation coverage; medium−low LES level represents zone is greatly close to the urban center with low vegetation coverage, land ecosystem is subject to man-made disturbance and destruction, the ecological problem frequently appear; low LES level represents zone is located in the urban center with a little vegetation coverage, the structure of the ecosystem is incomplete, the function has been lost, which is extremely difficult to restore [15]. The evaluation level is slightly higher than that of the study by Feng et al. [15] and He et al. [52], due to the hill-gully terrain complexity and ecosystem vulnerability in Yan’an.

2.5. Analysis Methods

Principal component analysis (PCA), stepwise regression analysis, and canonical correspondence analysis (CCA) are adopted to cross-verify primary variables highly affecting LES status. Path analysis (PA) and correlation analysis are adopted to determine the influence degree of primary variables on LES. A random forest model is selected to determine the regulatory threshold range of primary variables required by advanced LES status (high level and medium−high level). Venn diagram is used to determine the single and synergistic contribution rates of primary driving variables to LES.

3. Results

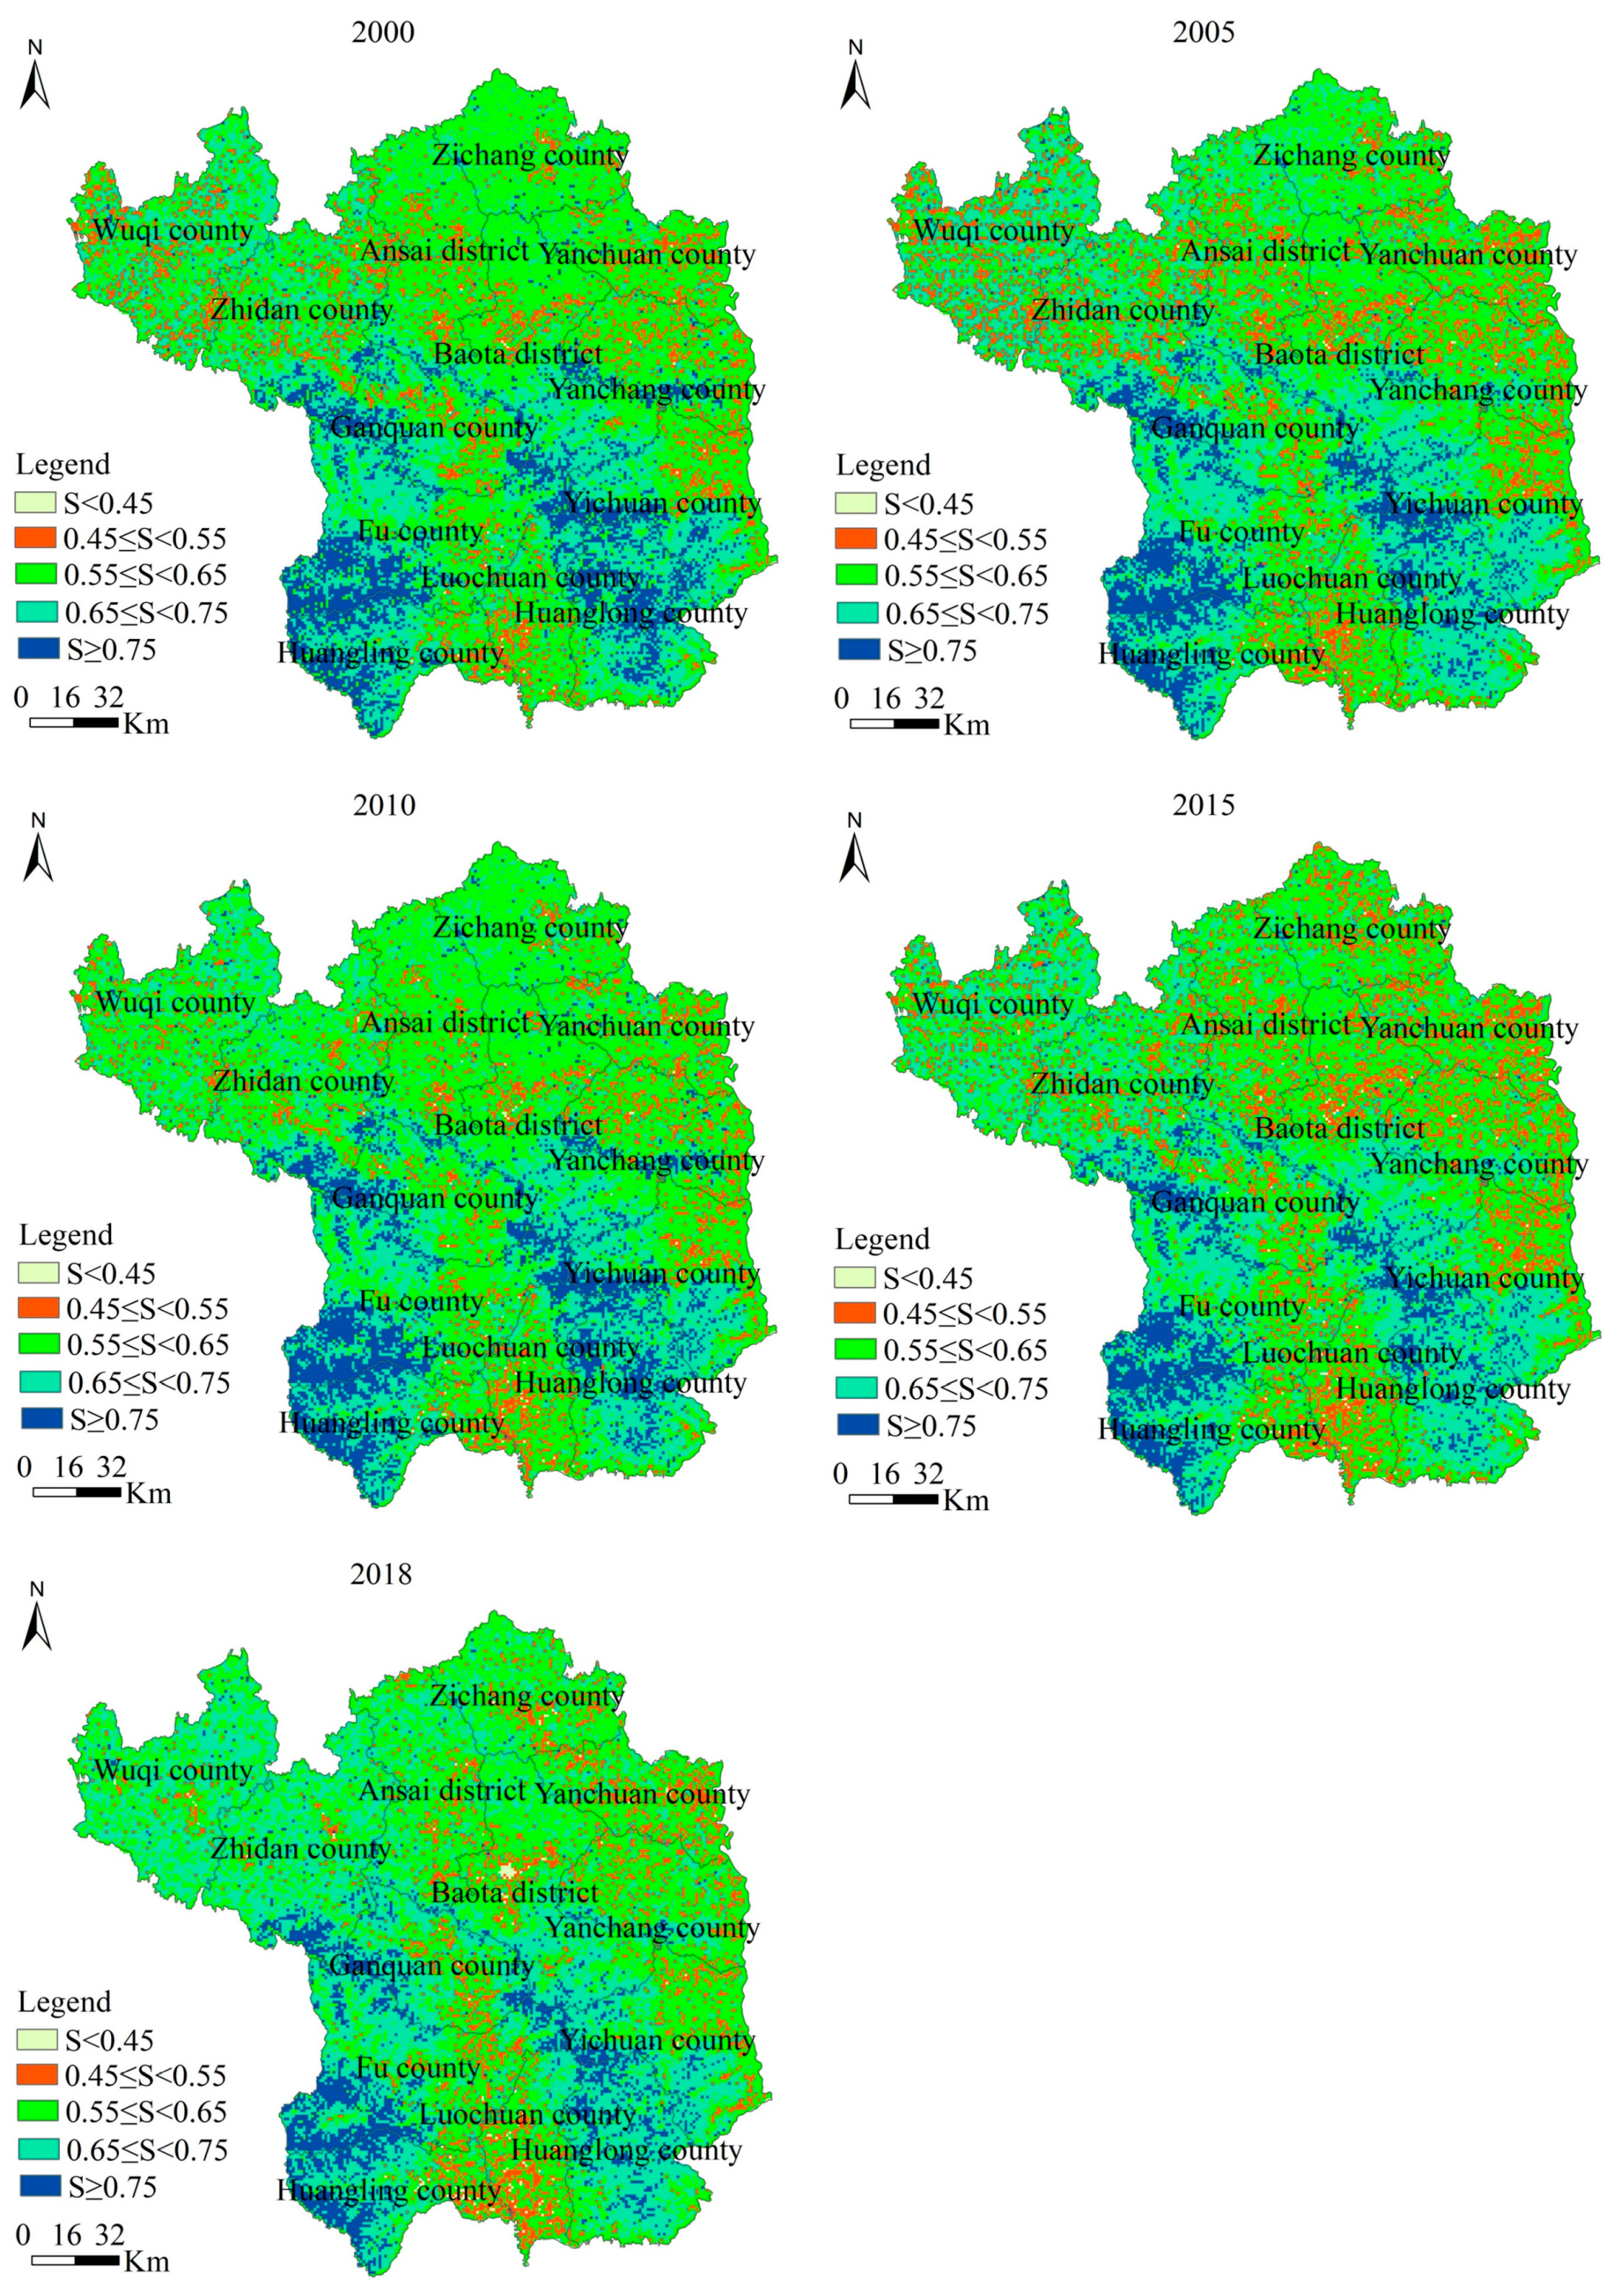
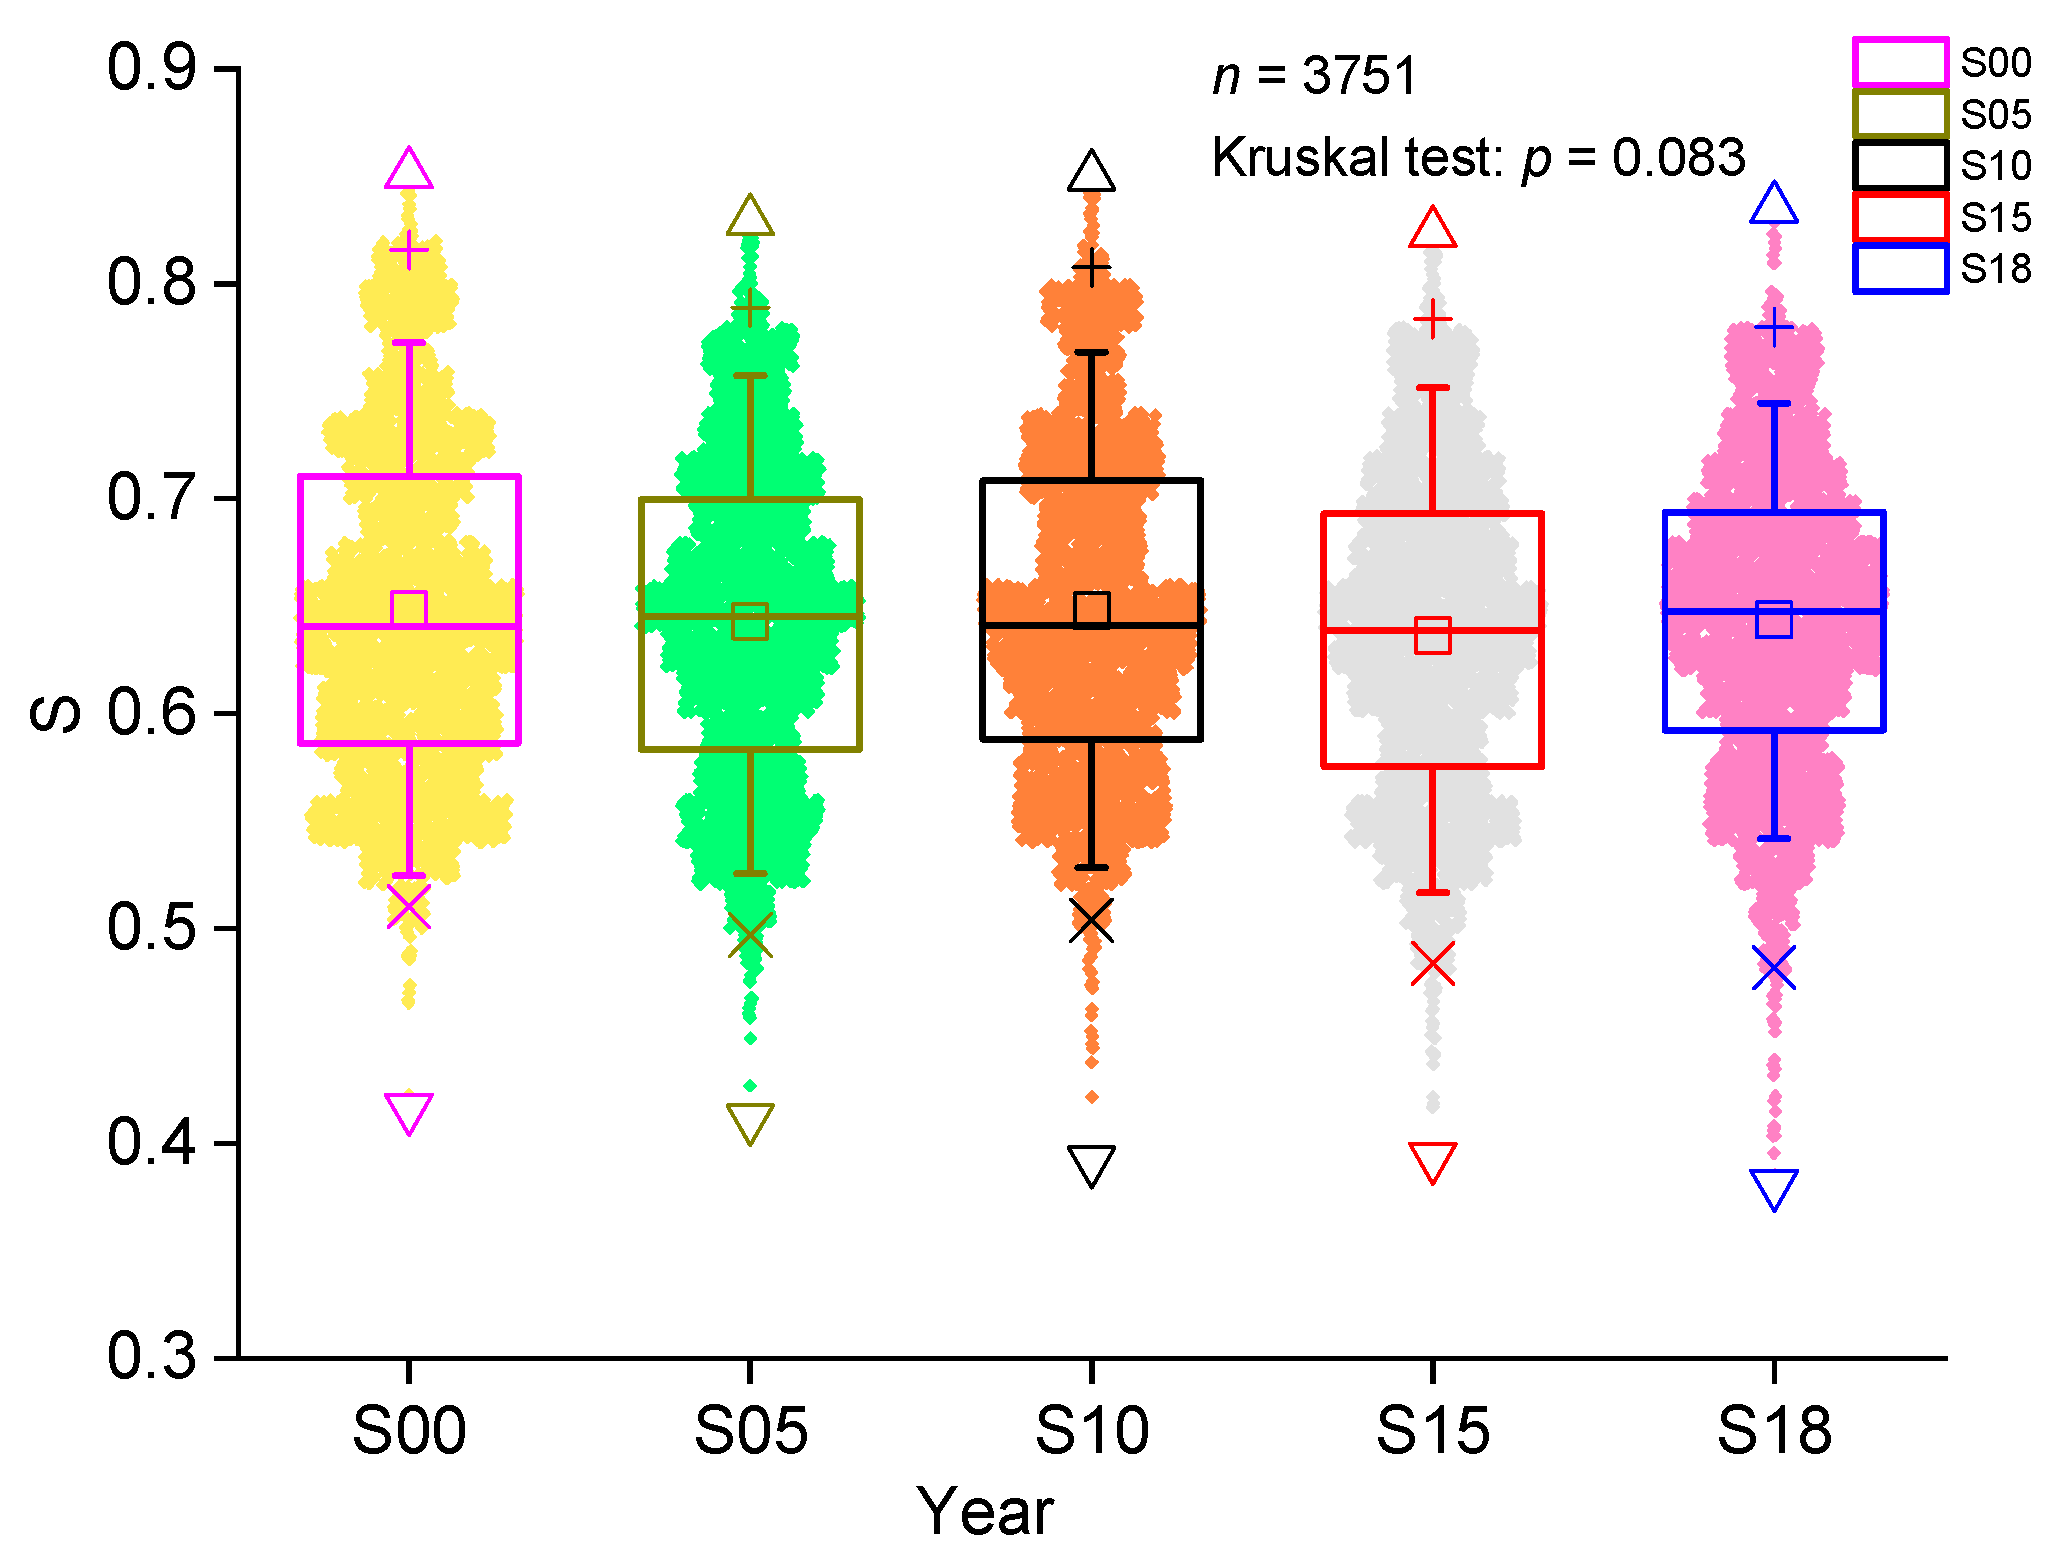
3.1. Evaluation Level of Land Ecological Security (LES)

Intuitively, zone with high LES level was mainly distributed in southern Yan’an, where it was concentrated in Fu county, Huangling county, Huanglong county, Yichuan county, and Ganquan county, while the ecologically secure area of Fu county significantly exceeded that of other districts and counties (Figure 2). In 2000, the ecologically secure area of Fu county was 1128 km2, but it had been reduced to 924 km2 in 2018. Spatially, the zones with medium−high LES levels were primarily concentrated in western and southern regions of Yan’an, including Wuqi county, Zhidan county, Fu county, and Huanglong county; the average area of ecological security zones from 2000 to 2018 exceeded 1500 km2. Followed by Baota district, Yichuan county, Huangling county, and Ganquan county. In short, the southwest and south lands of Yan’an had a better LES status. In Wuqi county and Zhidan county, the area of LES increased significantly since 2010, reaching 2074 km2 and 2075 km2 in 2018, respectively. Both Fu county and Huanglong county, area of LES zone were tended to be stable after 2015, fluctuating between 1785 km2 and 1629 km2, respectively. Additionally, in the northeast of Yan’an, namely, Ansai district, Zichang county, Yanchuan county, and Yanchang county, the area of the zone with medium-high LES level increased steadily since 2000. This finding indicated that the zone in a medium-high LES level was expanding from the west and south to the northeast. The zone with the medium LES level had a widely distributed area and is primarily located in the central and northern regions of Yan’an, and it fluctuated over the years and maintained relative stability. The zones with a low LES level were mainly located in Luochuan county, Baota district, and Huangling county and their areas continuously increased, respectively, reaching 32 km2, 36 km2, and 28 km2 in 2018 (Figure 2). However, generally, the ecological security index (S) of Yan’an from 2000 to 2018 was insignificant, indicating that the level of LES was extremely stable (Figure 3).

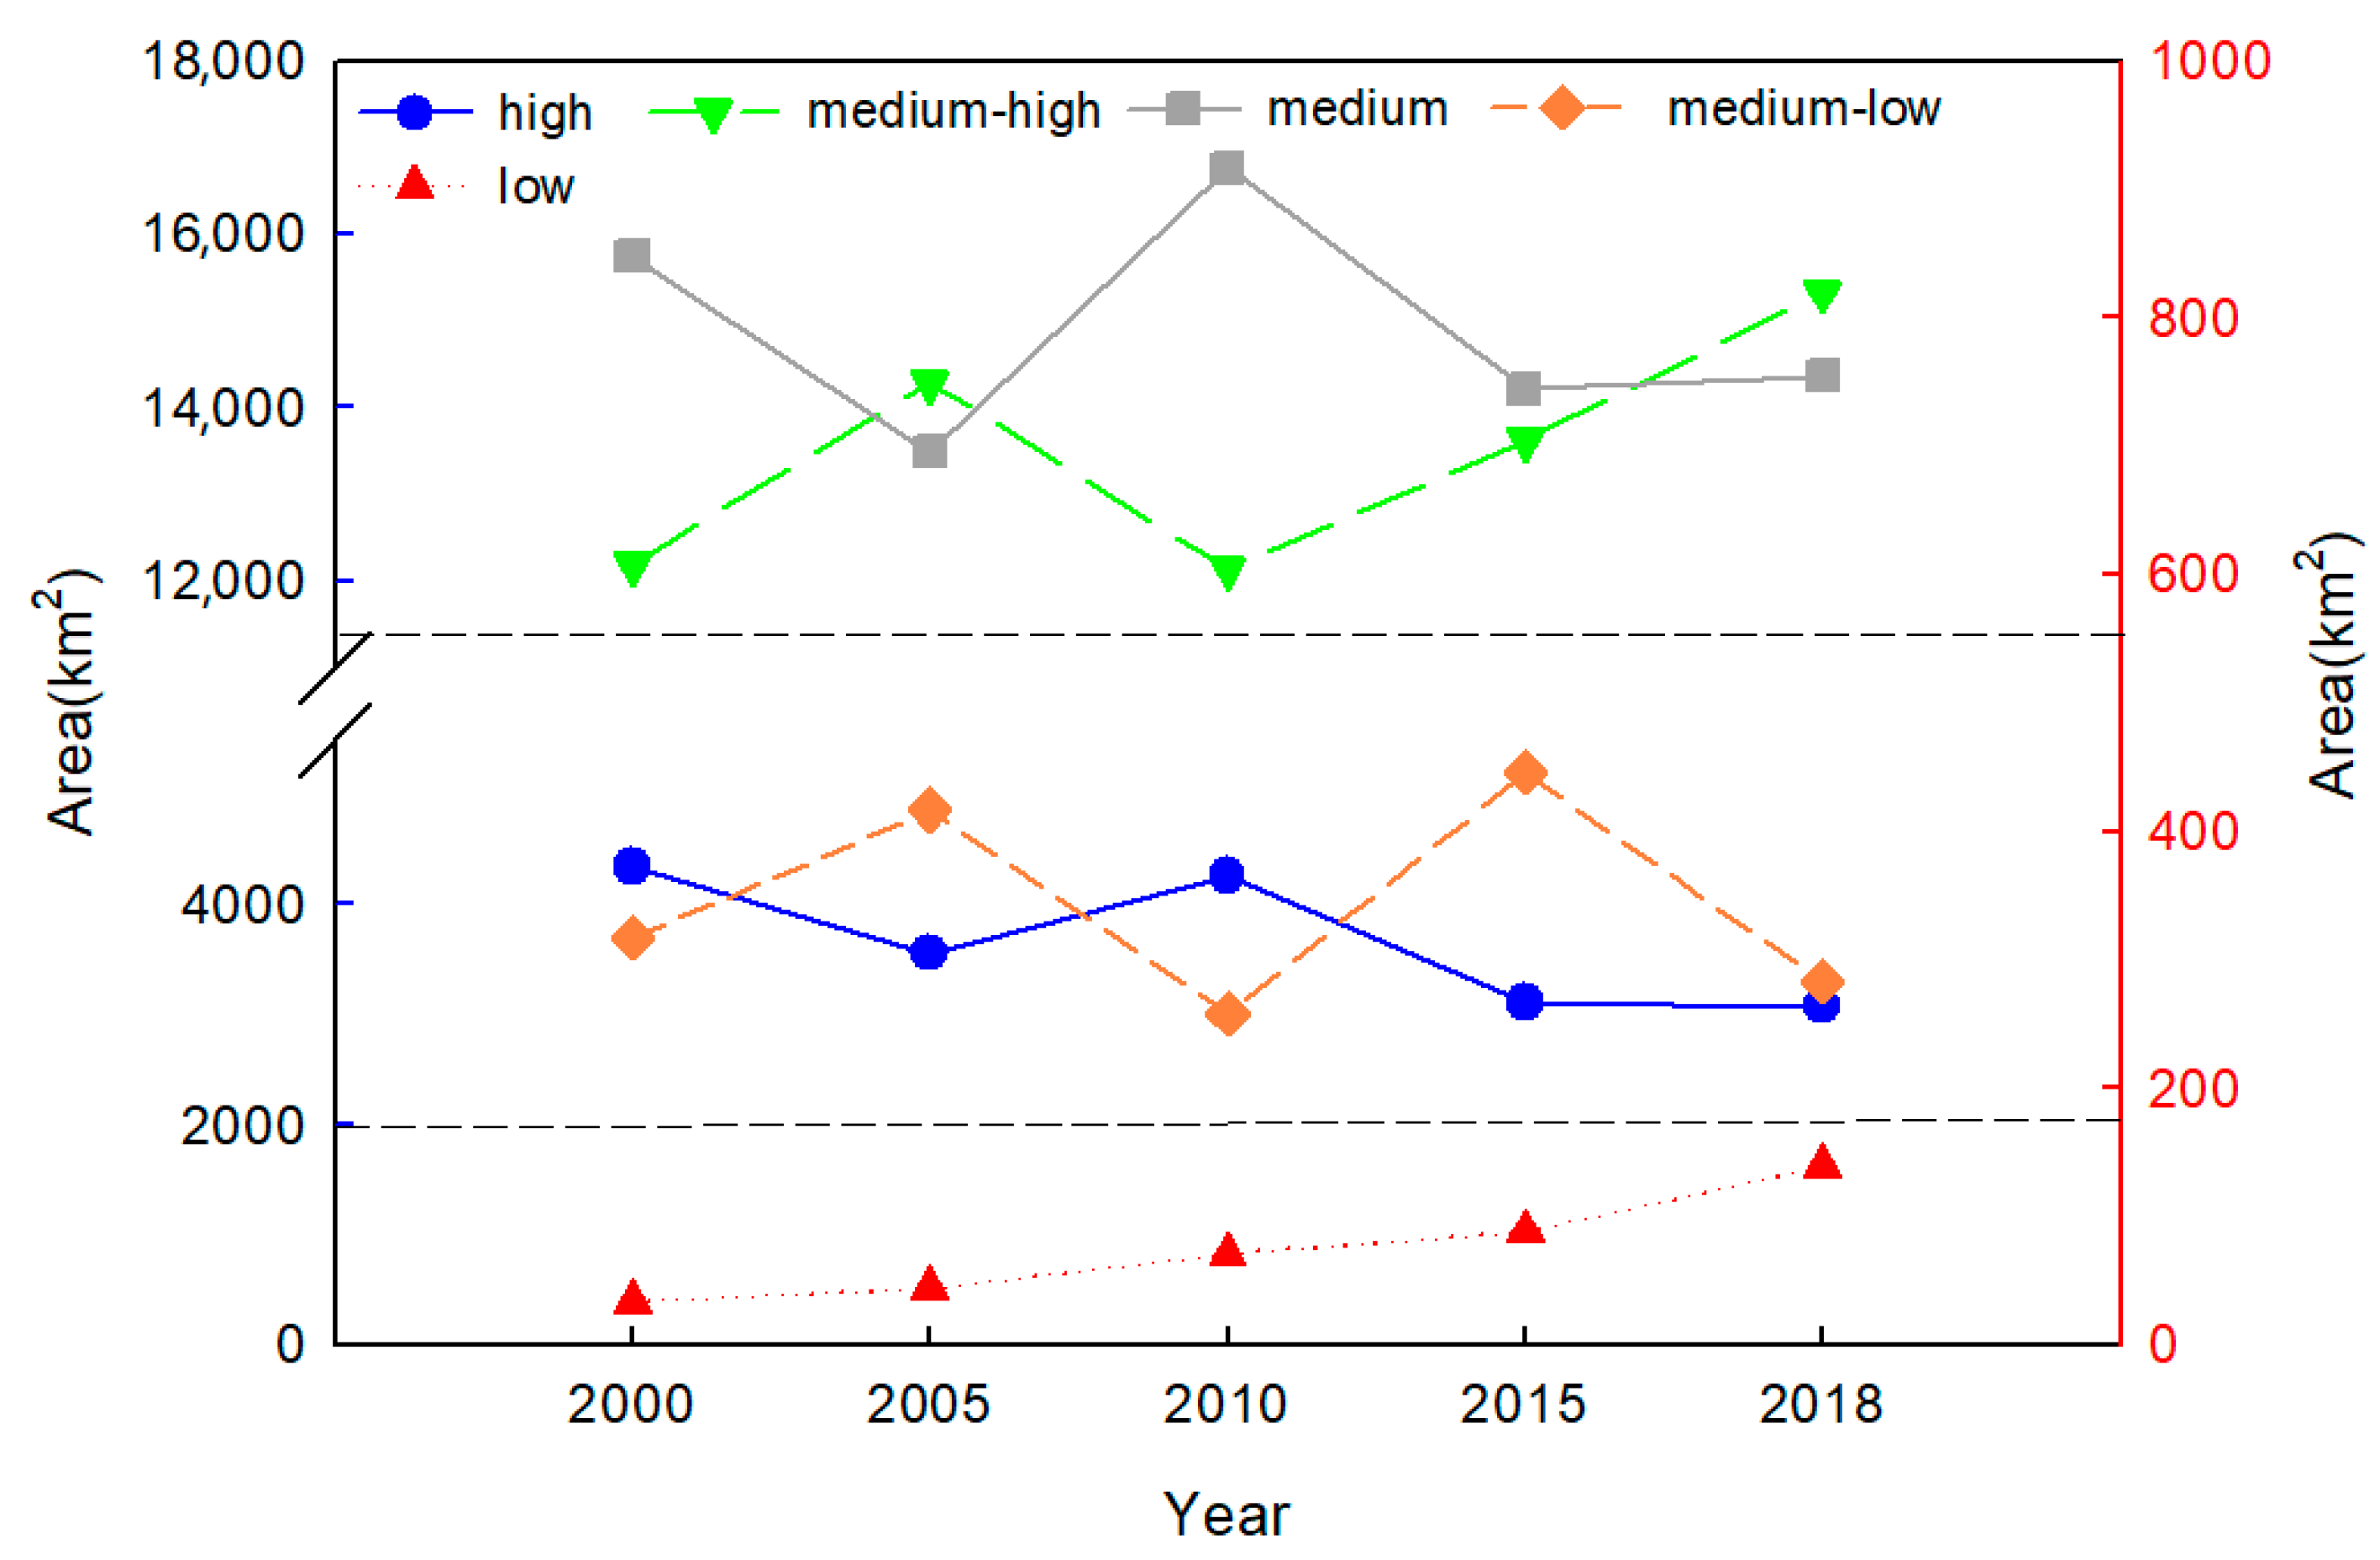
3.2. Area Variation of Zones with Different Levels of Land Ecological Security

From 2000 to 2018, the area of zones with medium-high and medium levels of LES were the largest, accounting for 37.22–46.27% and 33.49–42.33% of the total area of Yan’an, respectively. The second-largest area was the zone with high and medium-low levels of LES, corresponding to the proportion thresholds of 8.49–12.07% and 8.29–14.35% of total land area. For a zone with a low LES level, its area was the smallest, accounting for only 0.09–0.38% of the total area (Figure 4). These results indicated that LES was mainly characterized by medium−high and medium levels with the widest distribution in Yan’an. As a result, there was tremendous space to improve its LES status.
Overall, the temporal change of LES status in Yan’an from 2000 to 2018 was as follows: visually, the area of the zone with a high LES level continually shortened by 29.25% from 2000 to 2018. The area of the zone with a medium-high LES level increased significantly, expanding by 25.83% from 2000 to 2018, and reaching 15,329 km2 in 2018. Conversely, those areas of zones having medium level and medium−low of LES remained relatively steady over the past 18 years, fluctuating slightly around 14,914.60 km2 and 4010.60 km2, respectively. Finally, the area of the zone with the low LES level increased significantly, amounting to 139 km2 by 2018 (Figure 3).
In sum, land security tended to stabilize, but a gap from high level still existed significantly, ecological greening projects would need to be further deepened to scientifically regulate and guide land use structure, human activities, forest and vegetation coverage.

4. Discussion

4.1. Spatiotemporal Pattern of Land Ecological Security

Land ecosystems are an important part of the terrestrial ecosystem, but in the context of rapid urbanization, human activities have caused a persistent alteration in land cover on a regional scale that has led to weaker ecological security [59]. Accordingly, it is of great significance to systematically evaluate the LES level for ensuring the sustainable development of the land ecosystem. Yan’an is one of the most vulnerable and sensitive regions on the Loess Plateau. Because of its various ecological environments and complex topography, LES may be influenced by multiple differing factors, and there are varying levels of ecological security throughout this region [60]. Within this context, it was necessary to comprehensively investigate LES and its driving factors in Yan’an. As a whole, its regional land use types changed markedly, eco-environmental quality gradually improved in most regions, and ecological vulnerability was superior than anticipated [61]. The results obtained in our study were heterogeneous from the spatial perspective, which would discriminate the most important region of change [62].
In sum, our research confirmed that the LES level was extremely desirable stable from 2000 to 2018 (Figure 3). LES in Yan’an was best characterized by zones at the medium-high and medium levels. Spatially, the zones with high LES levels were mainly distributed in southern Yan’an, including Fu county, Huangling county, Huanglong county, Yichuan county, and Ganquan county. The zones with medium-high LES levels were mainly located in the western and southern regions of Yan’an, such as Wuqi county, Zhidan county, Fu county, and Huanglong county. Consequently, the ecological status of land in southern and southwestern Yan’an was superior compared to the rest of region. The zone with the medium-high LES level continued to expand from the west and south to the northeast. The zones with medium LES levels were the most widely distributed in the central and northern regions of Yan’an. In stark contrast, the zone with the low LES level was limited and scattered. Hou et al. [61] stated that the ecological vulnerability of four northern counties (Baota district, Ansai county, Zichang county, and Yanchuan county) was higher than that of four southern counties (Fu county, Ganquan county, Huangling county, and Luochuan county). For most of the study area, the range of ecological vulnerability indexes decrease gradually from north to south, indicating that the safety of the ecological environment increased from north to south. Temporally, the area of the zone with a high LES level continuously decreased from 2000 to 2018. Whereas, that of zones at a medium level and medium−low level of LES showed little fluctuation with relatively stable changes over years, while for zones at medium−high and low levels of LES, it increased significantly. The ecological vulnerability of Huangling county and Fu county was minimal from 1997 to 2011, and that of most regions has gradually decreased over years [61]. The results above illustrated the security and stability of the regional ecological environment, which was deeply responsible for the policy of returning farmland to forest.
The decreased area of the zone with a high LES level in Yan’an may be caused by changes in land-use types. Other research has shown that from 1990 to 2018, the total area of cropland, grassland, wetland, and unused land underwent a considerable reduction. The area of land used for construction increased while the amounts of degraded areas of forest, grassland, and wetland expanded, resulting in the deterioration of environmental quality. The unstable trend of land cover change in the Loess Plateau and sandy loess hills declined [60]. However, from 1999 onward, land conversion from farmland and unused land into forest and grassland was widely implemented, which drove an improvement in the quality of the ecological environment. All land-use types converted into dry land, forest, and unused land showed improvements, indicating that ecological protection has achieved noteworthy effects. However, potential degradation risks still exist in parts of Yan’an. Hence, the policy of returning farmland to forest would need to be continually implemented to maintain the balance of the land ecosystem.

4.2. Driving Mechanism of Land Ecological Security

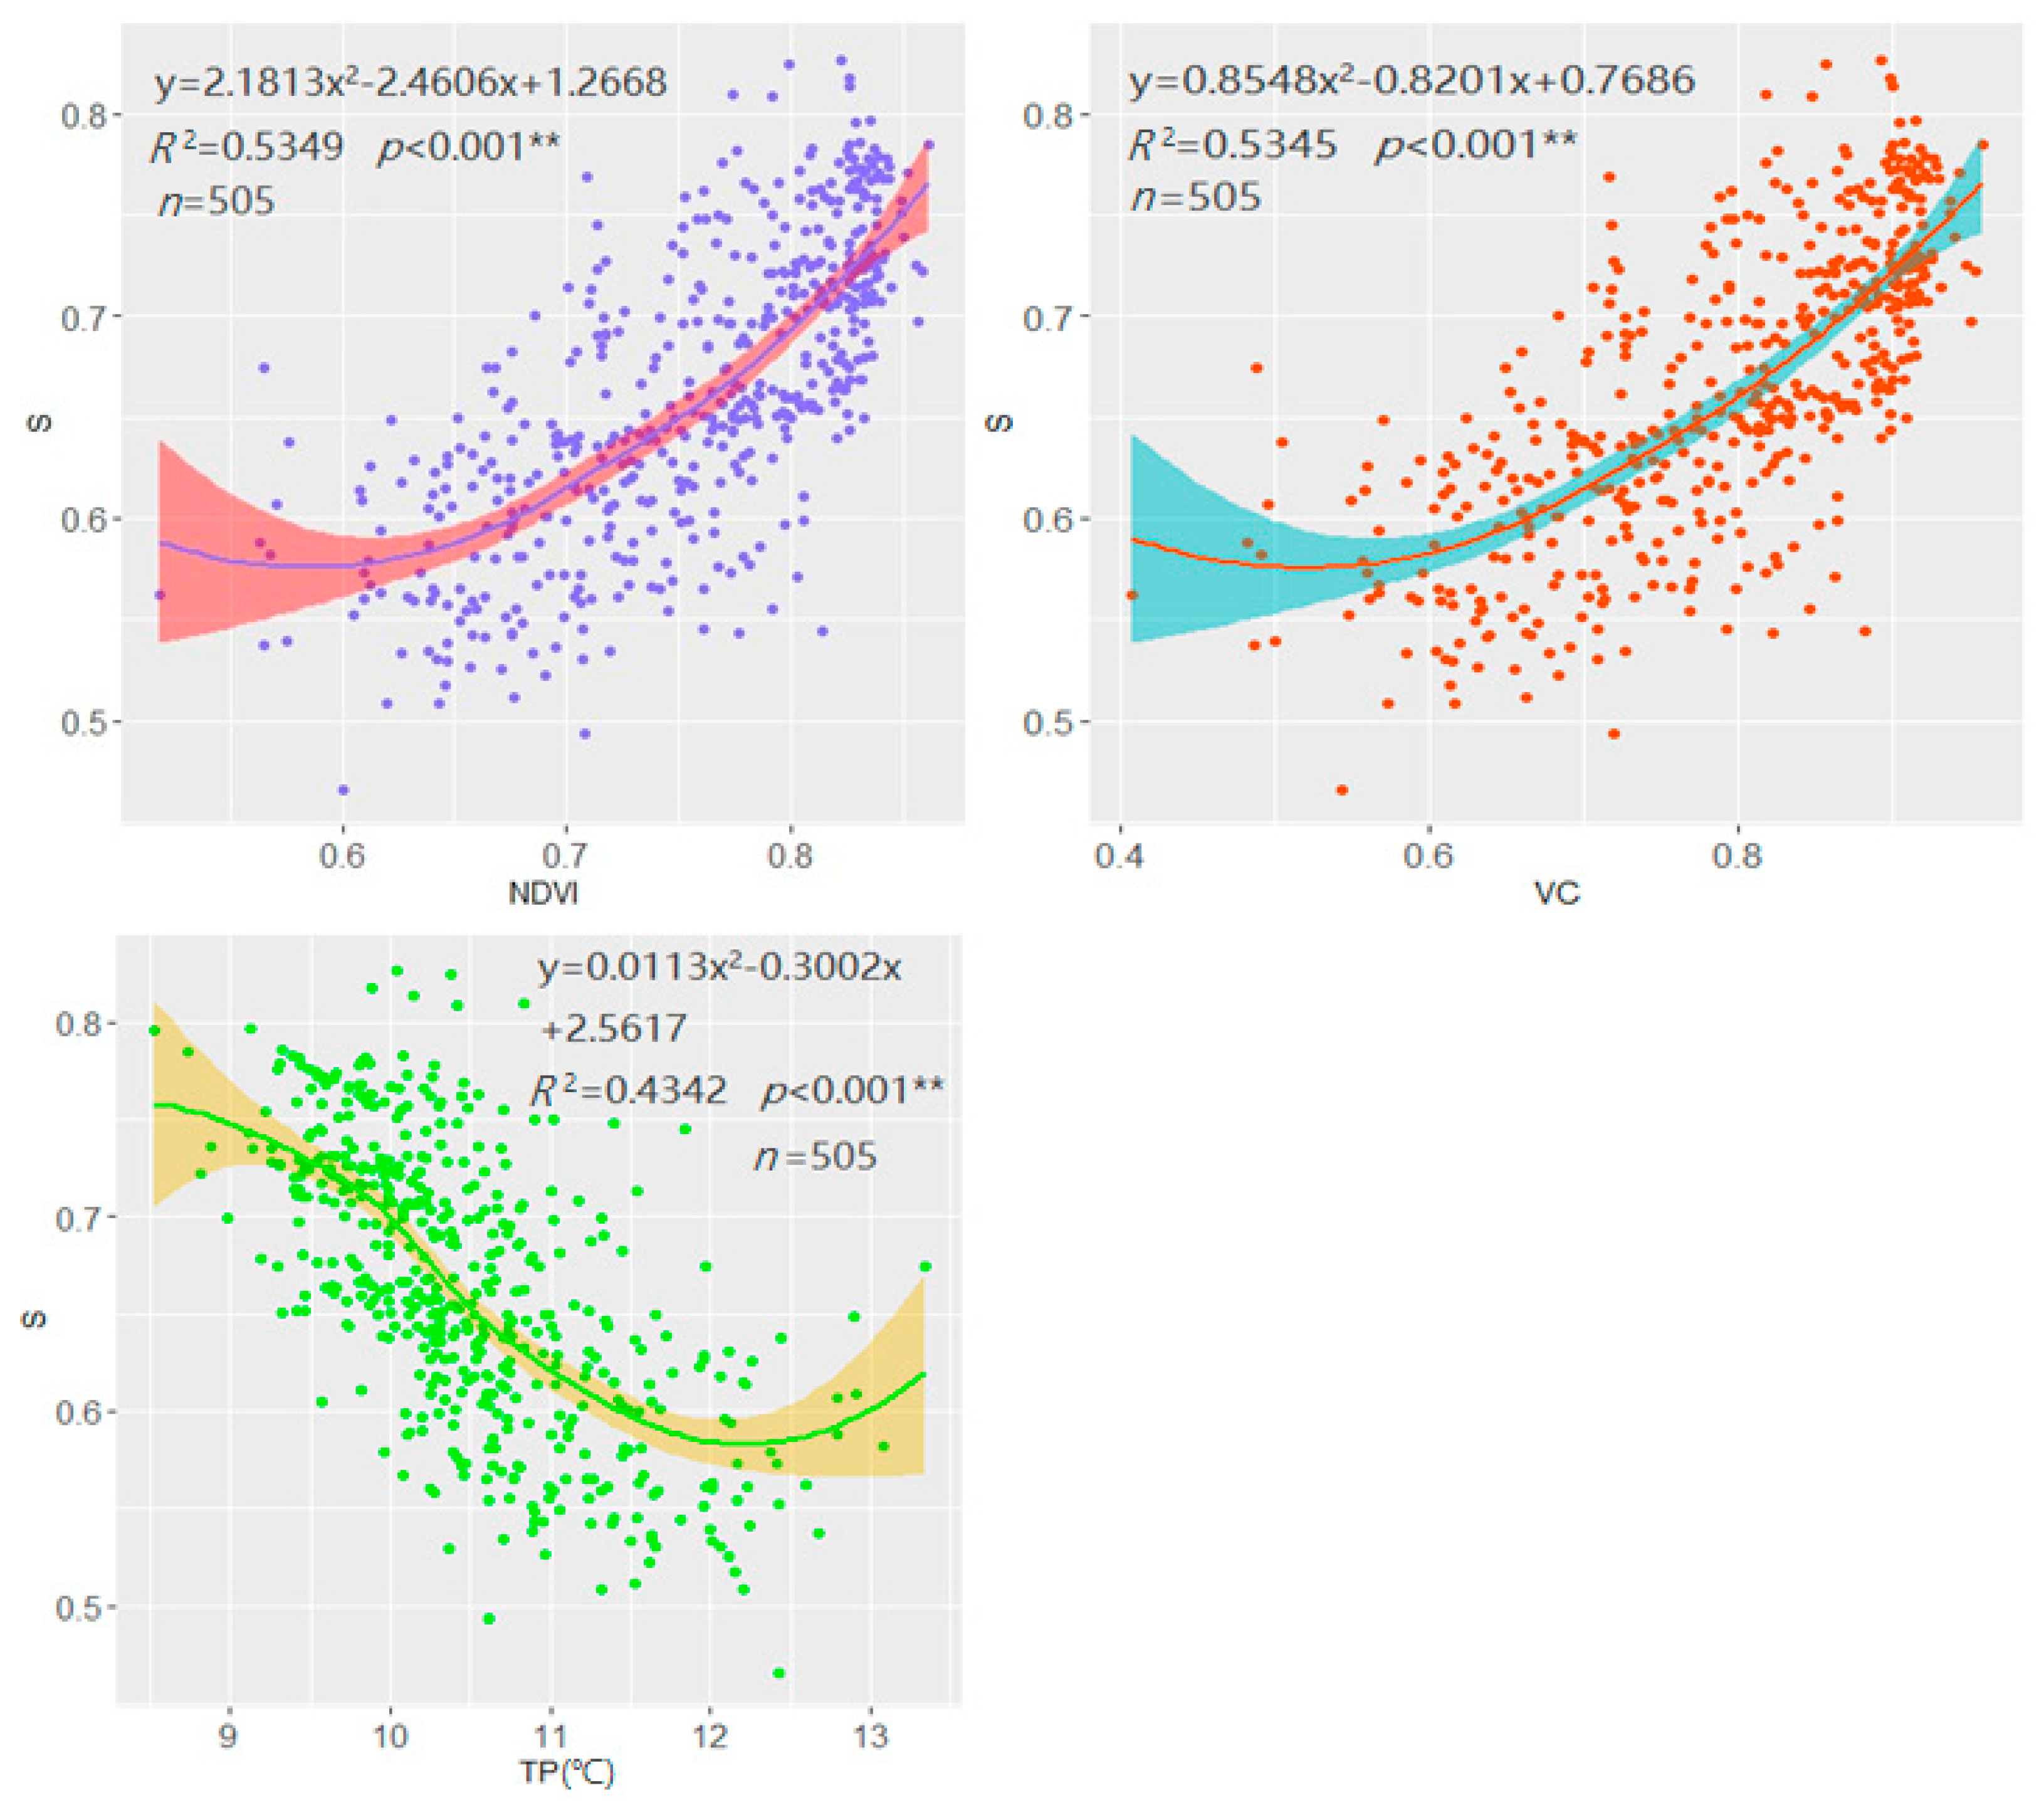
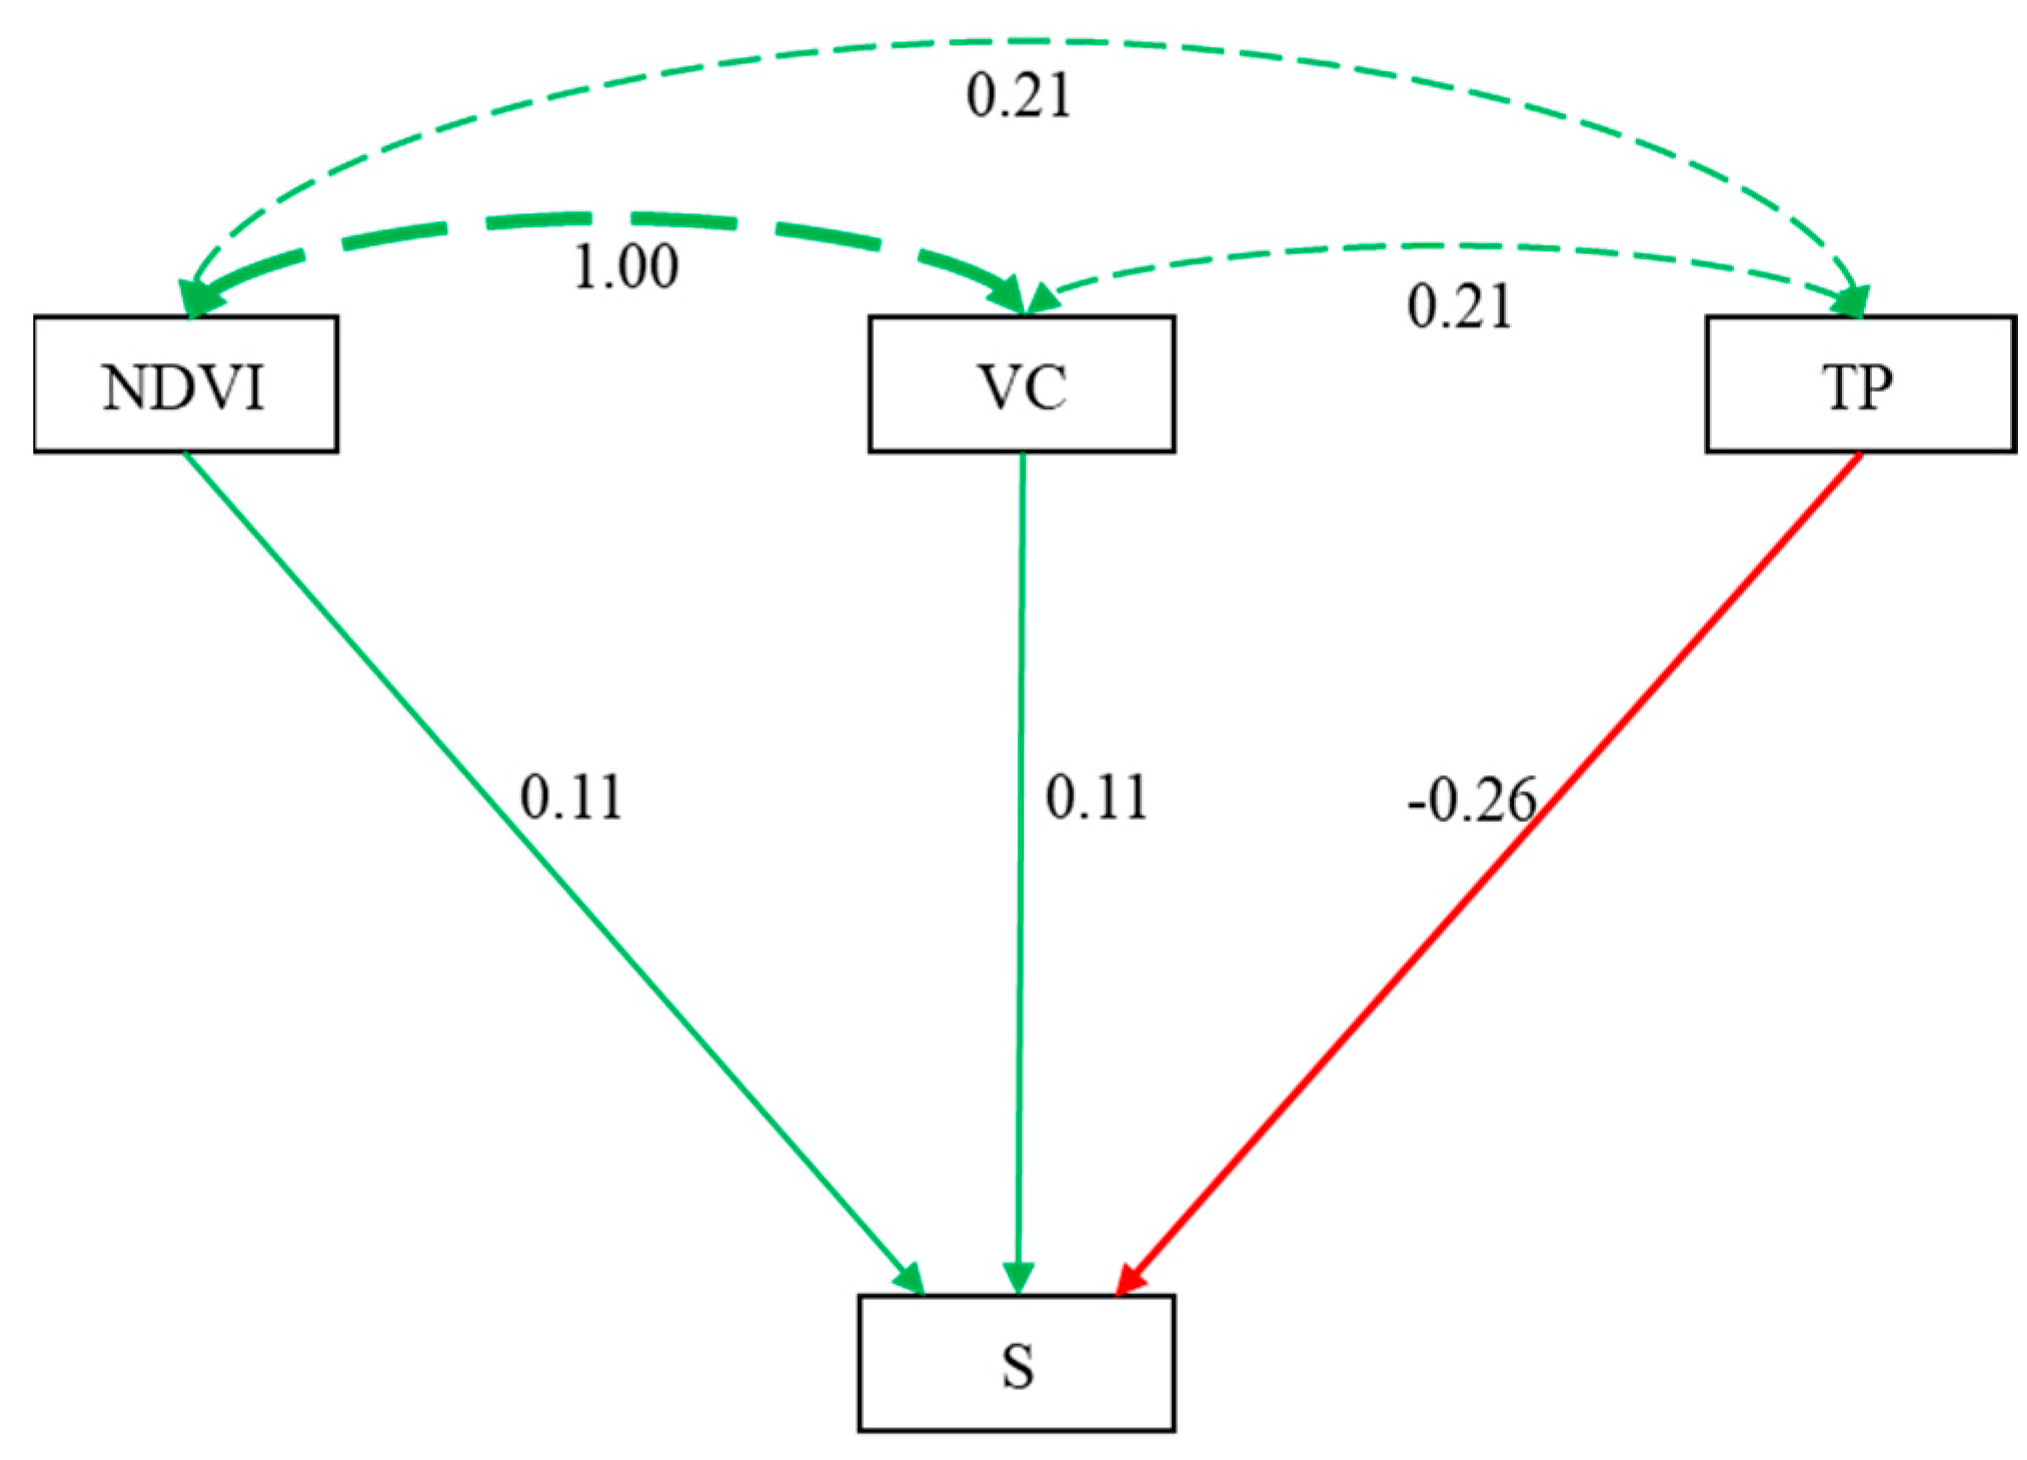
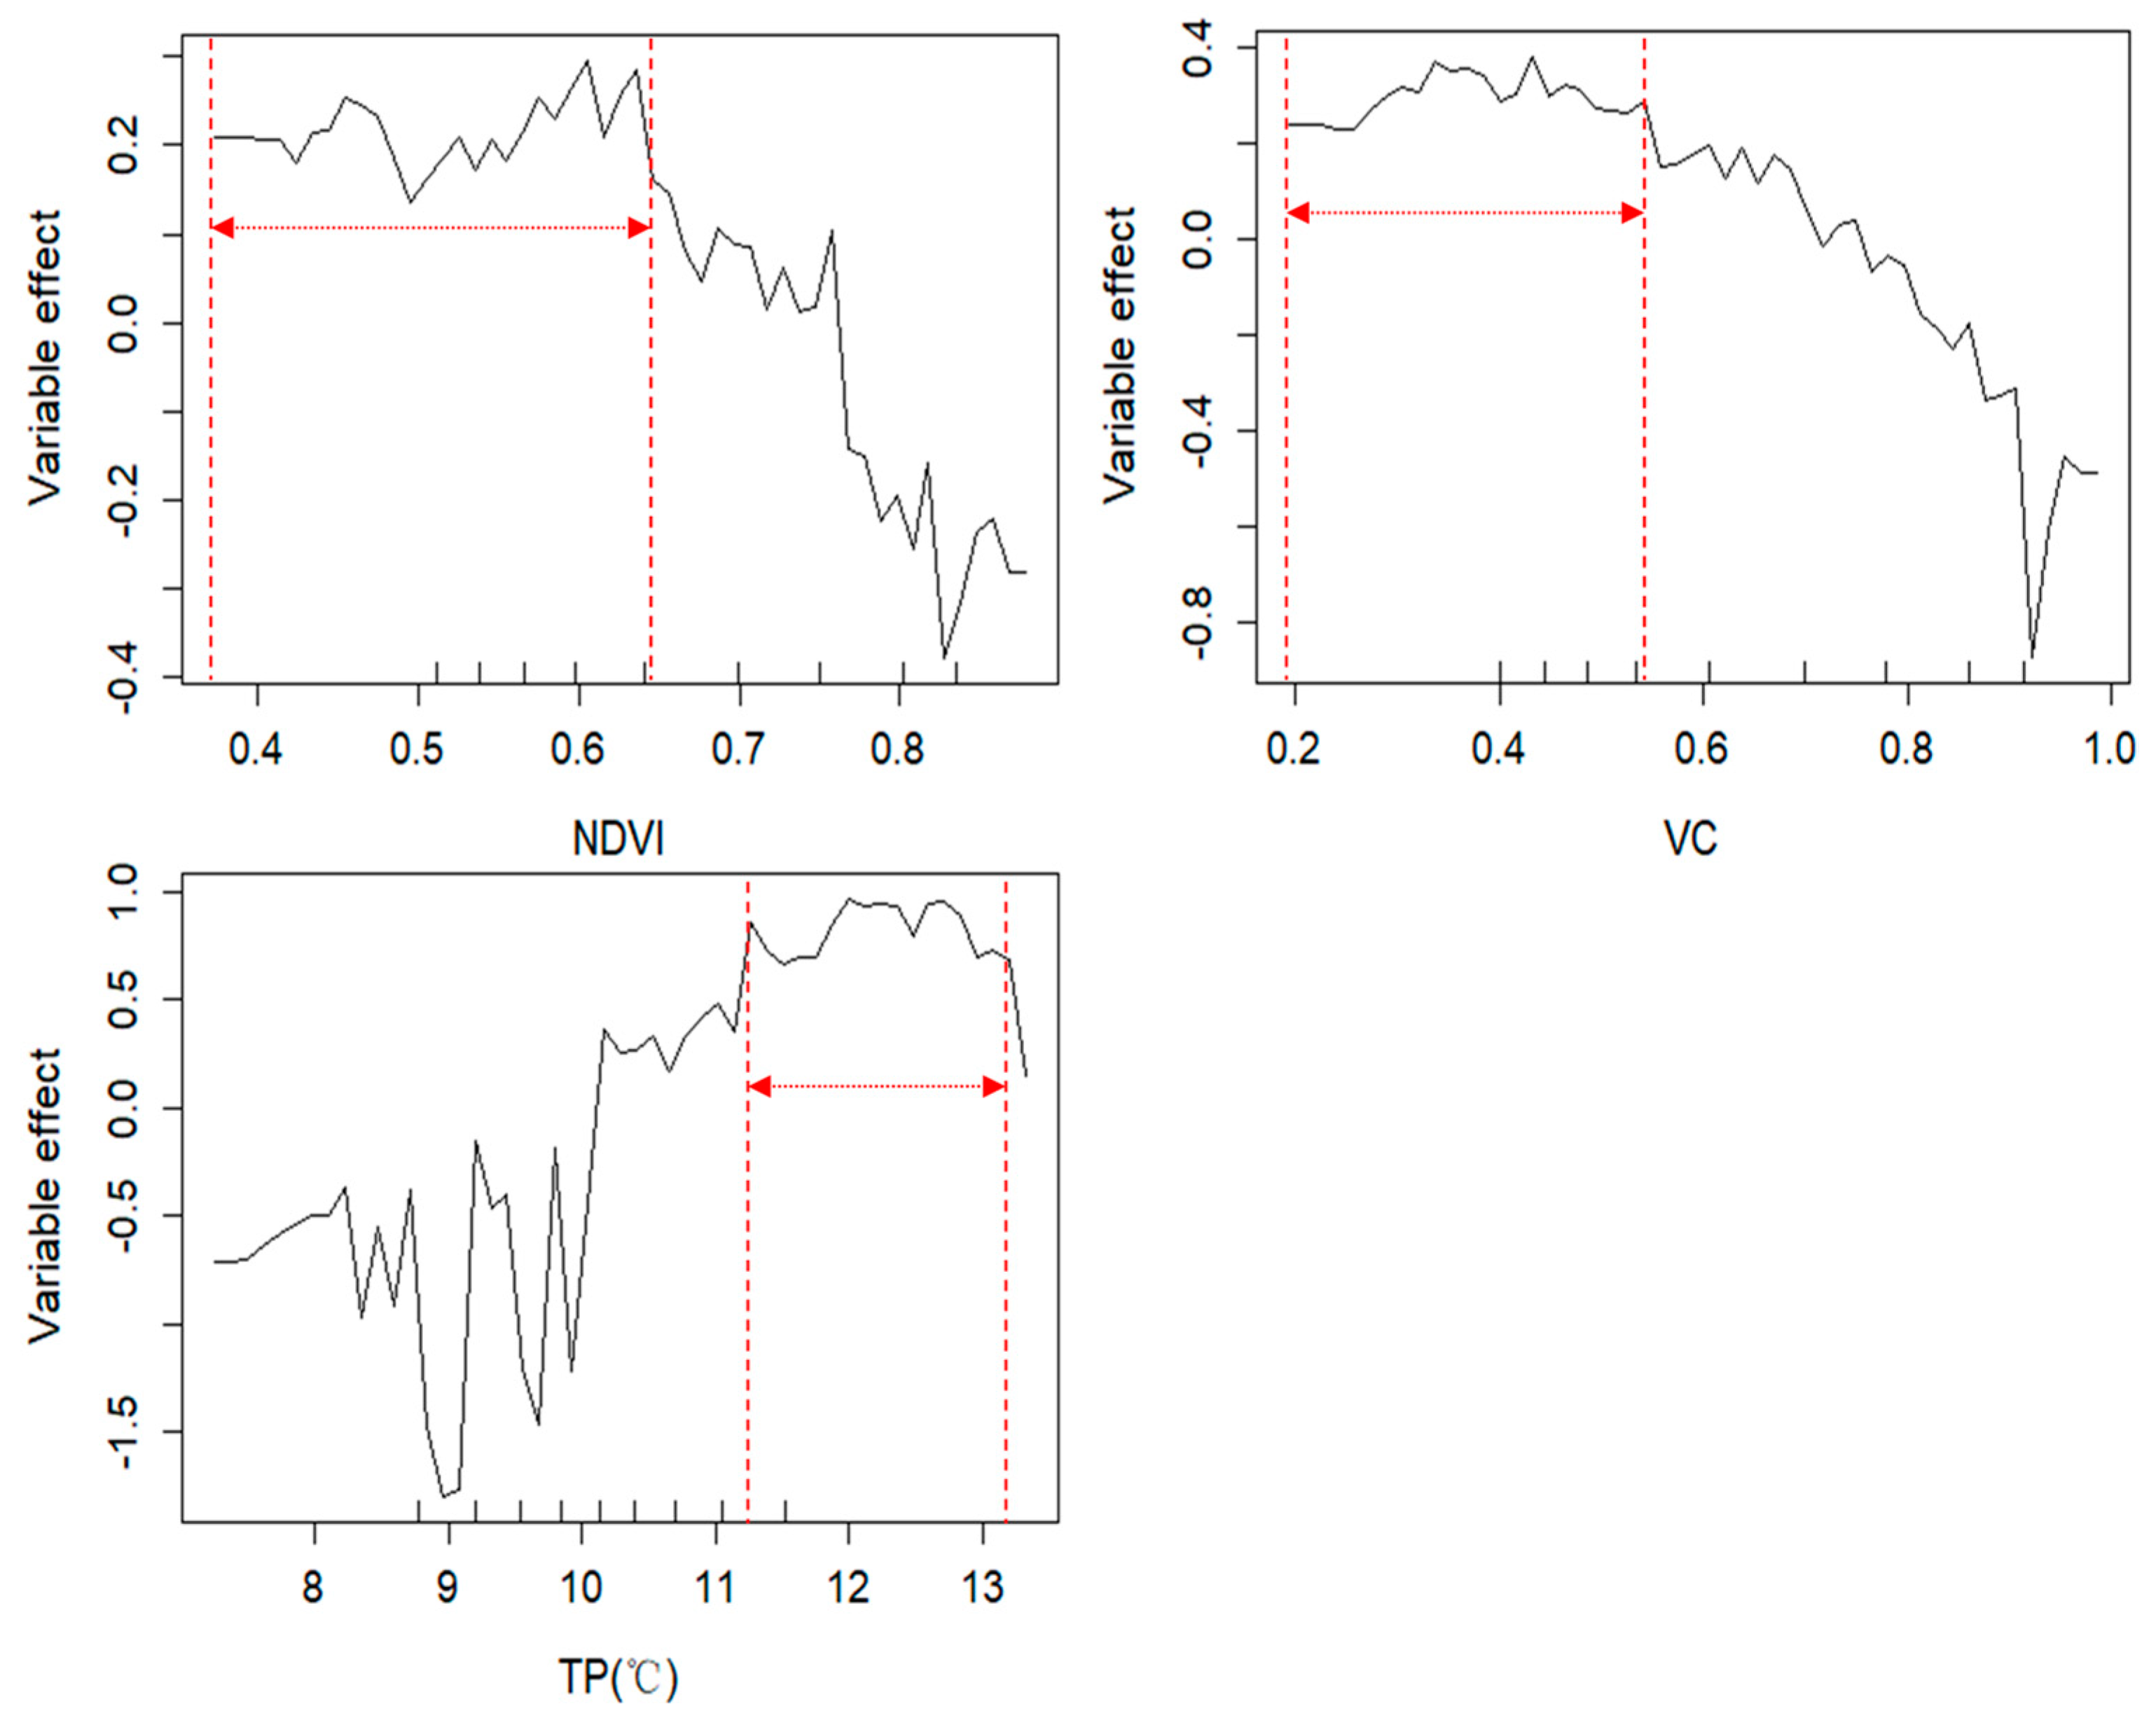
4.2.1. Response of Primary Driving Variables to Land Ecological Security

Ecological land is a basic resource for human beings to survive, and ecological land use is a strategy to manage land resources. Hence, ecologically-sustainable land use is essential for humanity’s survival. Various climatic factors, such as temperature, precipitation, and solar radiation, will affect the growing conditions of vegetation [63]. Incontestably, in quantifying vegetation status, NDVI can gauge changes in biomass, VC, and ecosystem parameters. Vegetation succession generally follows the process from low level to high level structural complexity [64]. So, applying NDVI to study VC is paramount [65], and has been widely utilized to analyze the change in VC on landscape [66]. Yan’an is an ecologically fragile zone that is extremely sensitive to climate [25]. According to the results illustrated in Figure 5, it was released that, from 2000 to 2018, factors dramatically influencing LES in Yan’an were NDVI, VC, TP, gross domestic product, economic density, human disturbance index, degree of land use, regional development index, arable land per capita, the value of ecosystem service, the elasticity of ecological environment, with correlativity, which was also verified by stepwise regression analysis (Table 5). The structure and function of land ecological security were strongly influenced by the evaluation model of the natural-social-economic framework. NDVI, VC, TP belonged to the natural ecological aspect, other influence indexes belonged to the economic, and social-ecological aspects, deeply confirming that coupled natural-social-economic relationship was greatly critical to LES [67]. Based on this, and the collinearity of influence factors was considered, so NDVI, VC, TP was finally identified as the primary factors highly influencing LES by canonical correlation analysis, which was coincident with results above (Figure 6), indicating the natural ecological index critically affected LES, comparing to the economic, and social-ecological aspects.
For change characteristics of NDVI, VC, and TP, Qu et al. [68] found that NDVI followed a significant upward trend, increasing at a rate of 0.15% per year, from 1985 to 2015. The trend of a human-induced increase in NDVI was consistent with the spatial distribution of increasing forest areas in the eastern part of the Loess Plateau, which was driven mainly by restoration projects. In addition, variation in NDVI during 1985–2015 in the hill-gully region of Loess Plateau, indicated that the area of this region was significantly, moderately, and slightly improved was 52,921.90 km2, 56,792.70 km2, and 25,889.80 km2, respectively, which was significantly greater than degraded region [68]. Furthermore, the last few decades have also produced evidence of an accelerating trend of climate change in this region, and VC has been increasing on the Loess Plateau [69,70]. This finding corresponds to the result conducted by Cao et al. [71], which found that VC increased rapidly over the past 30 years. Much of the Loess Plateau had a moderately high VC in 2015. In the valley and mountain regions, more than 90% of the area had high or moderately high VC and of the valley plain area, 96.26% (6.16 × 10⁴ km2) of it had high or moderately high VC. VC of 2001–2015 was 5.7 times higher than that reported for 1985–2000. Therefore, the LES of Yan’an can be mainly characterized by medium-high and medium levels of LES. ZThe zones with medium-high LES levels continued to expand from the west and south to the northeast, and their areas increased significantly with the years. Nevertheless, VC evidently decreased in the hilly and gully regions of Loess Plateau [69]. In the degraded region, increased VC did not meet expectations, indicating that anthropogenic activity, such as land-use change, urbanization, and agricultural production, negatively or indeterminately impacted the region and may have led to vegetation degradation. The area of 71.53% was positively distributed, mainly in the hill-gully Loess regions. Thereby, the area of the zone with high LES levels continued to decrease, while that of the zone with a low LES level continued to expand.

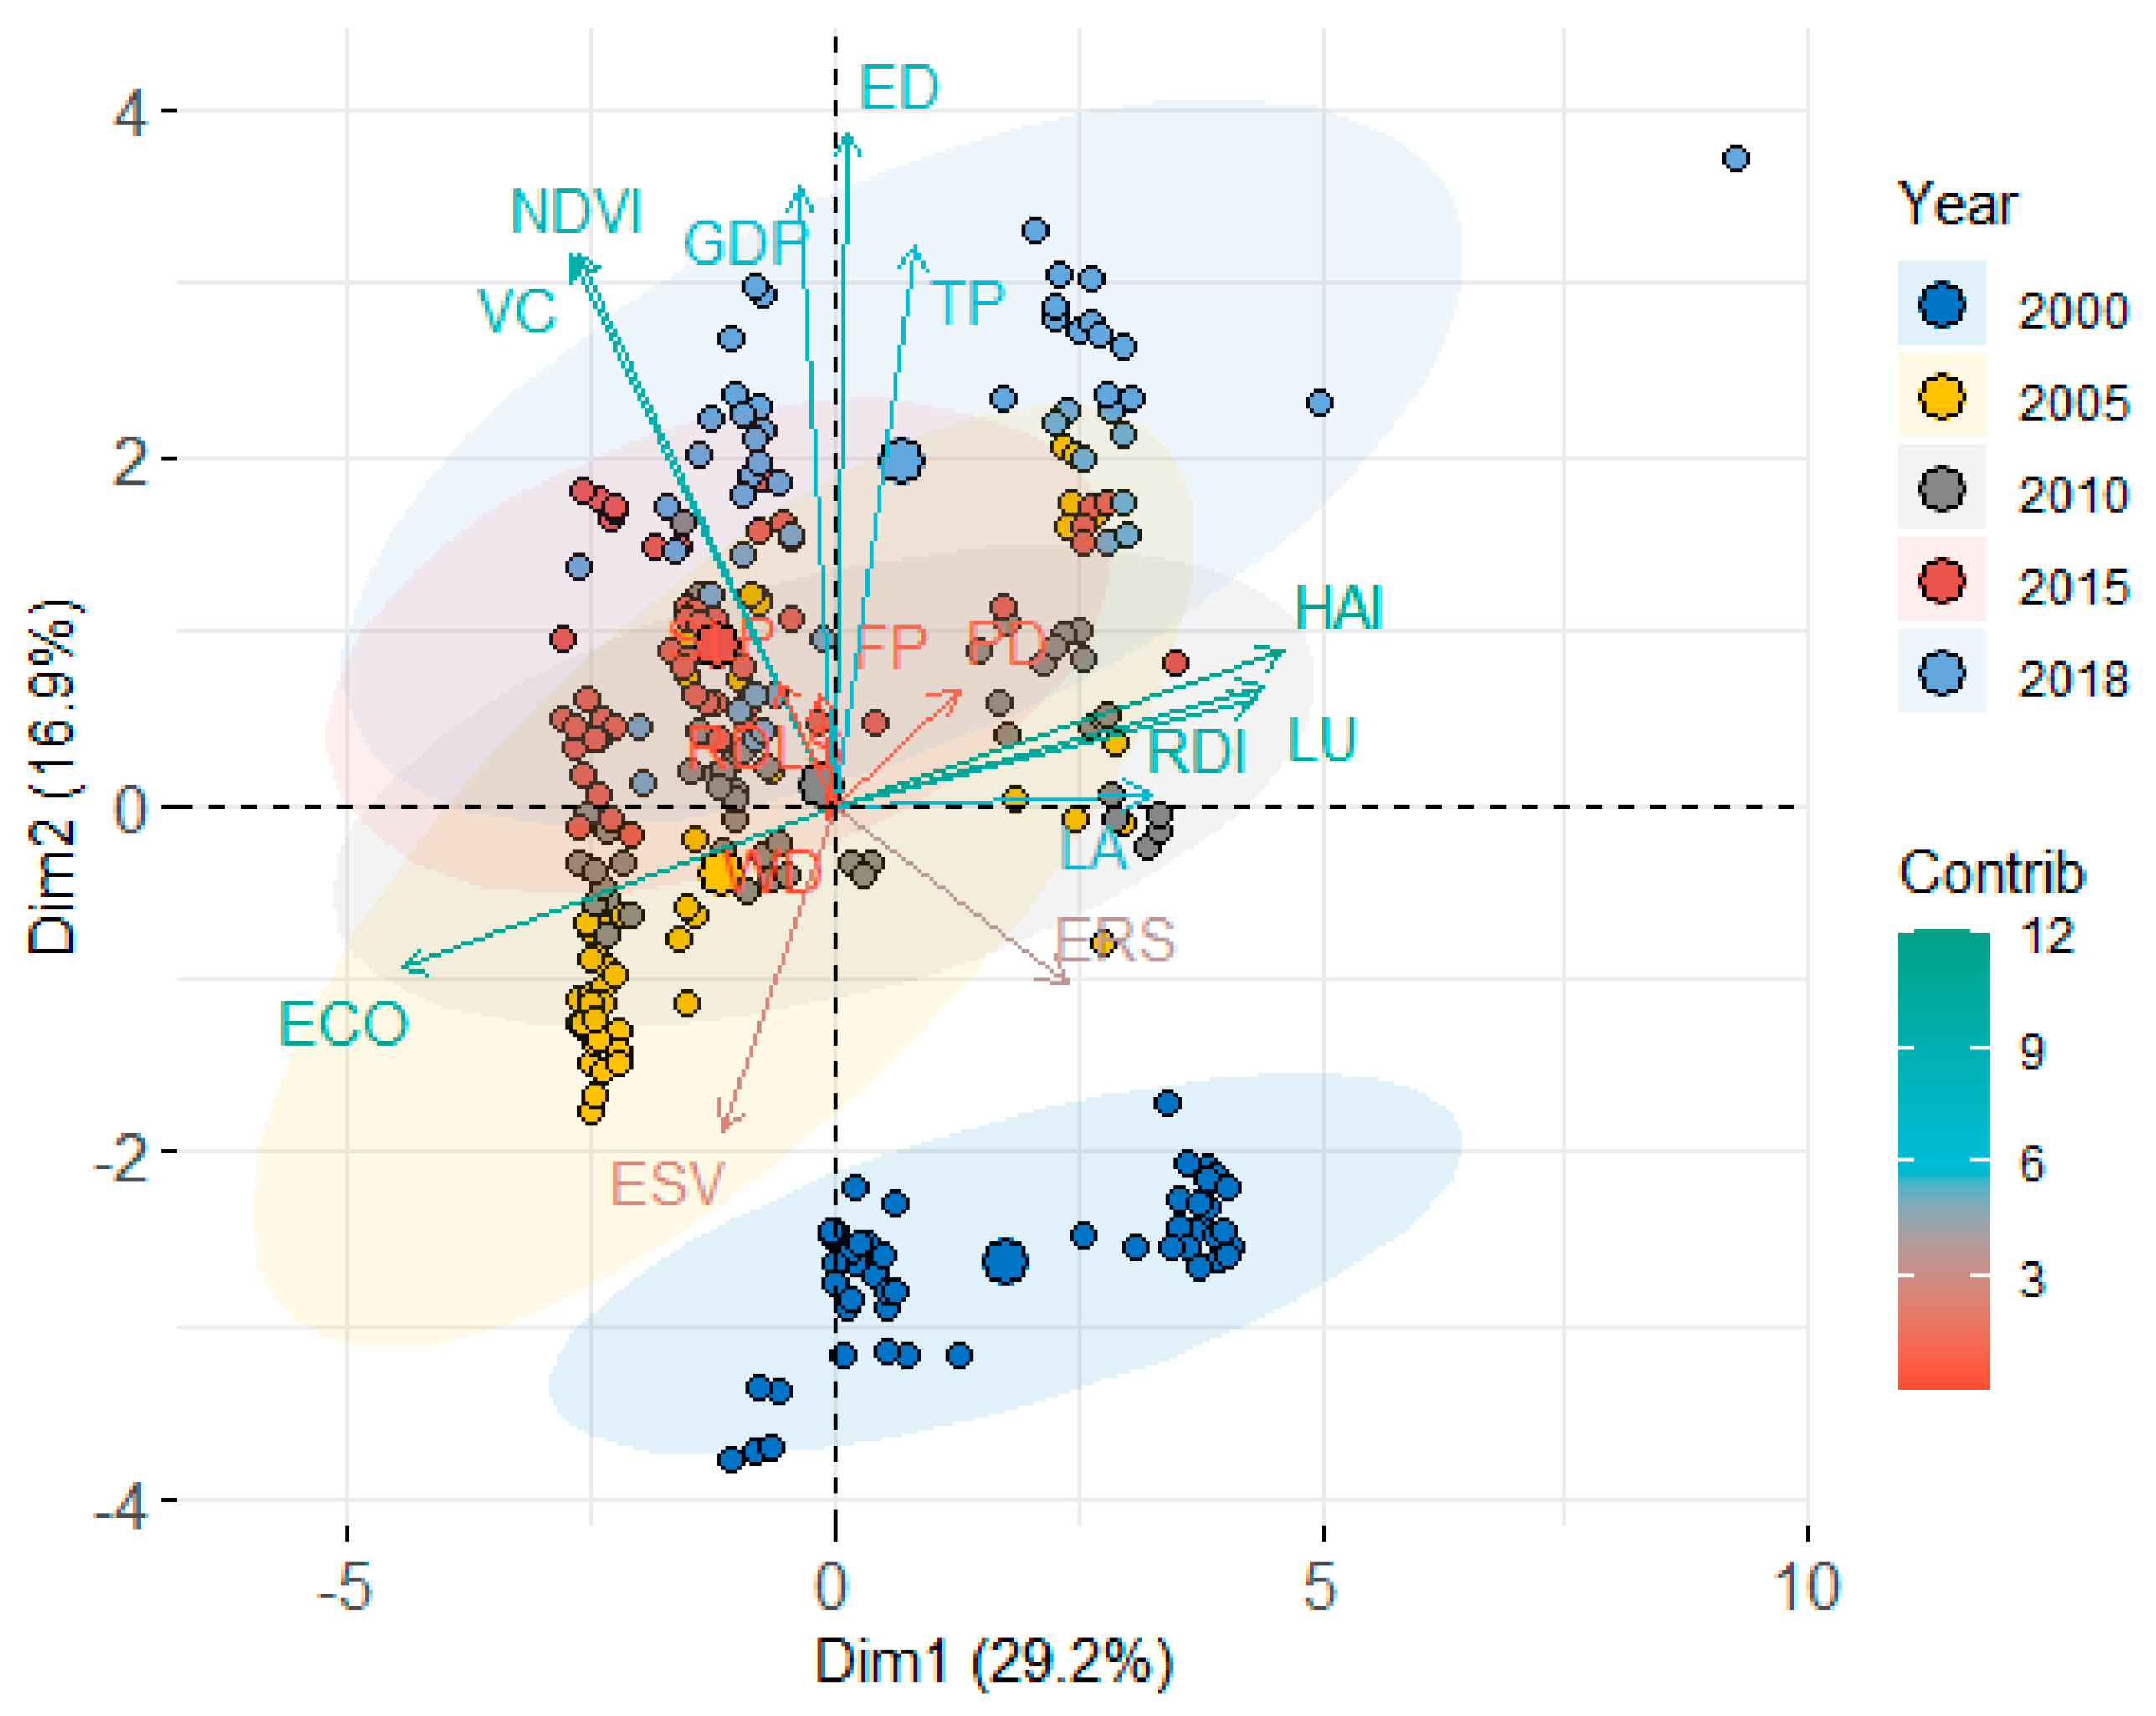
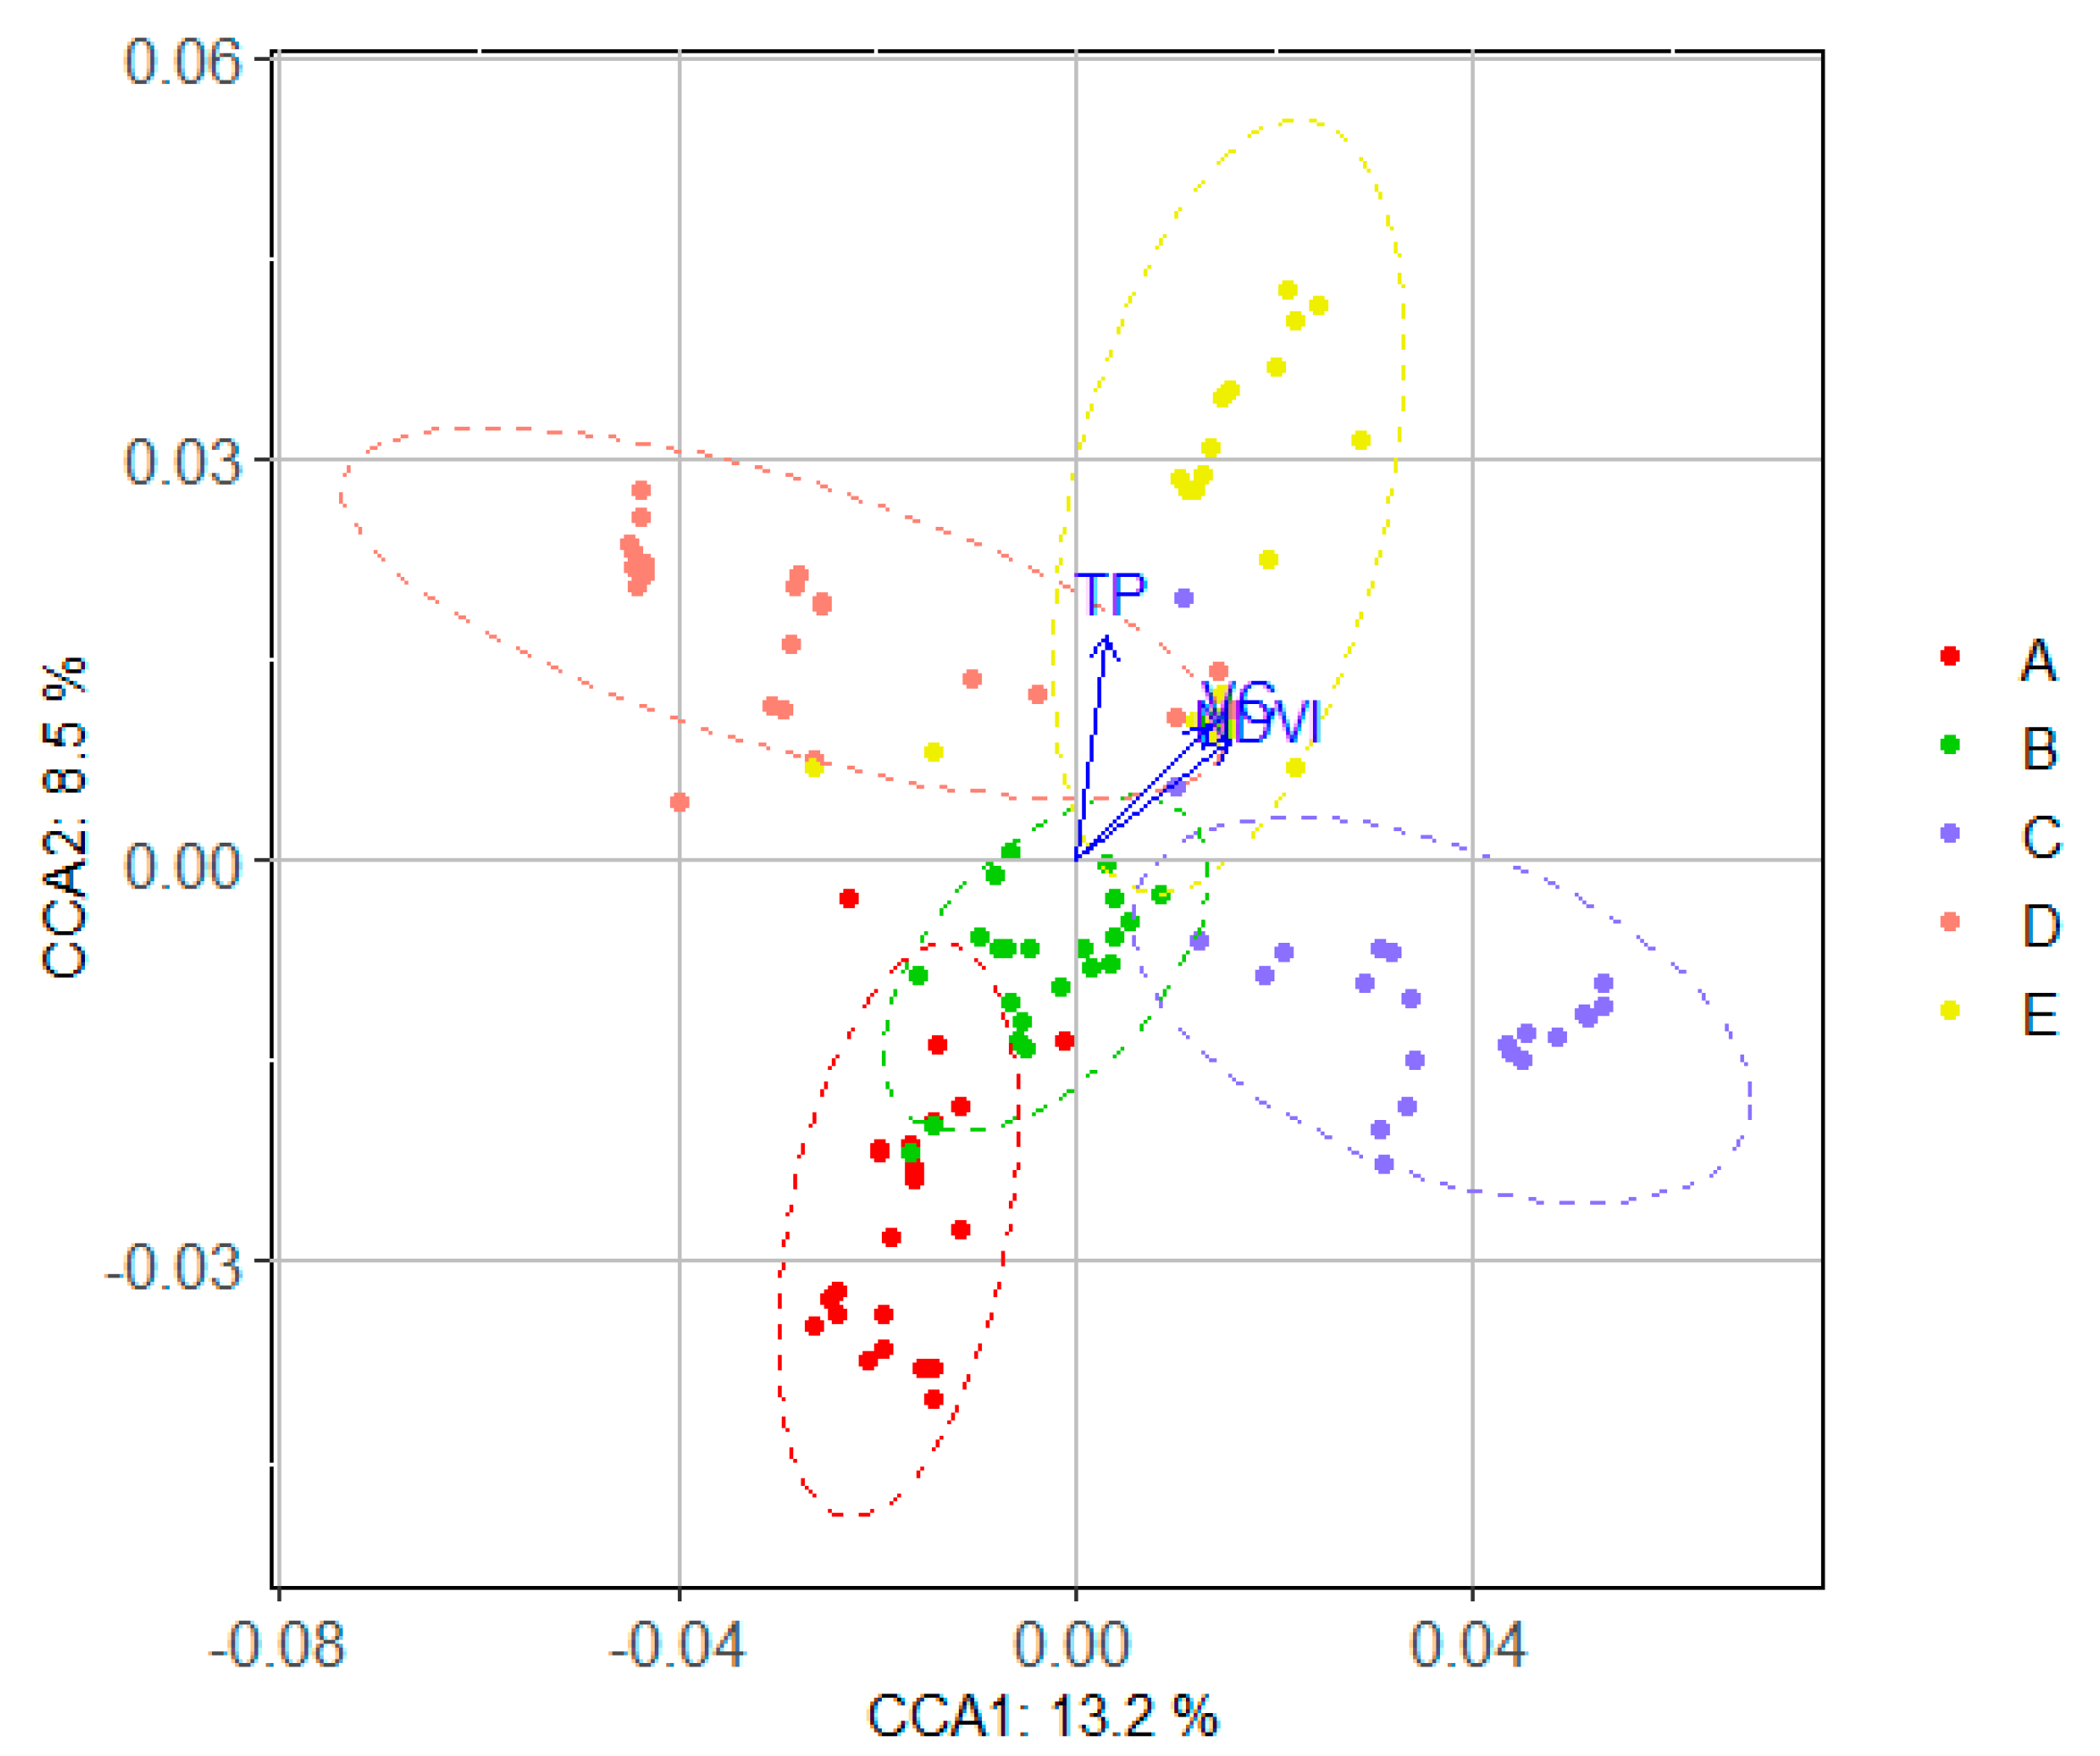
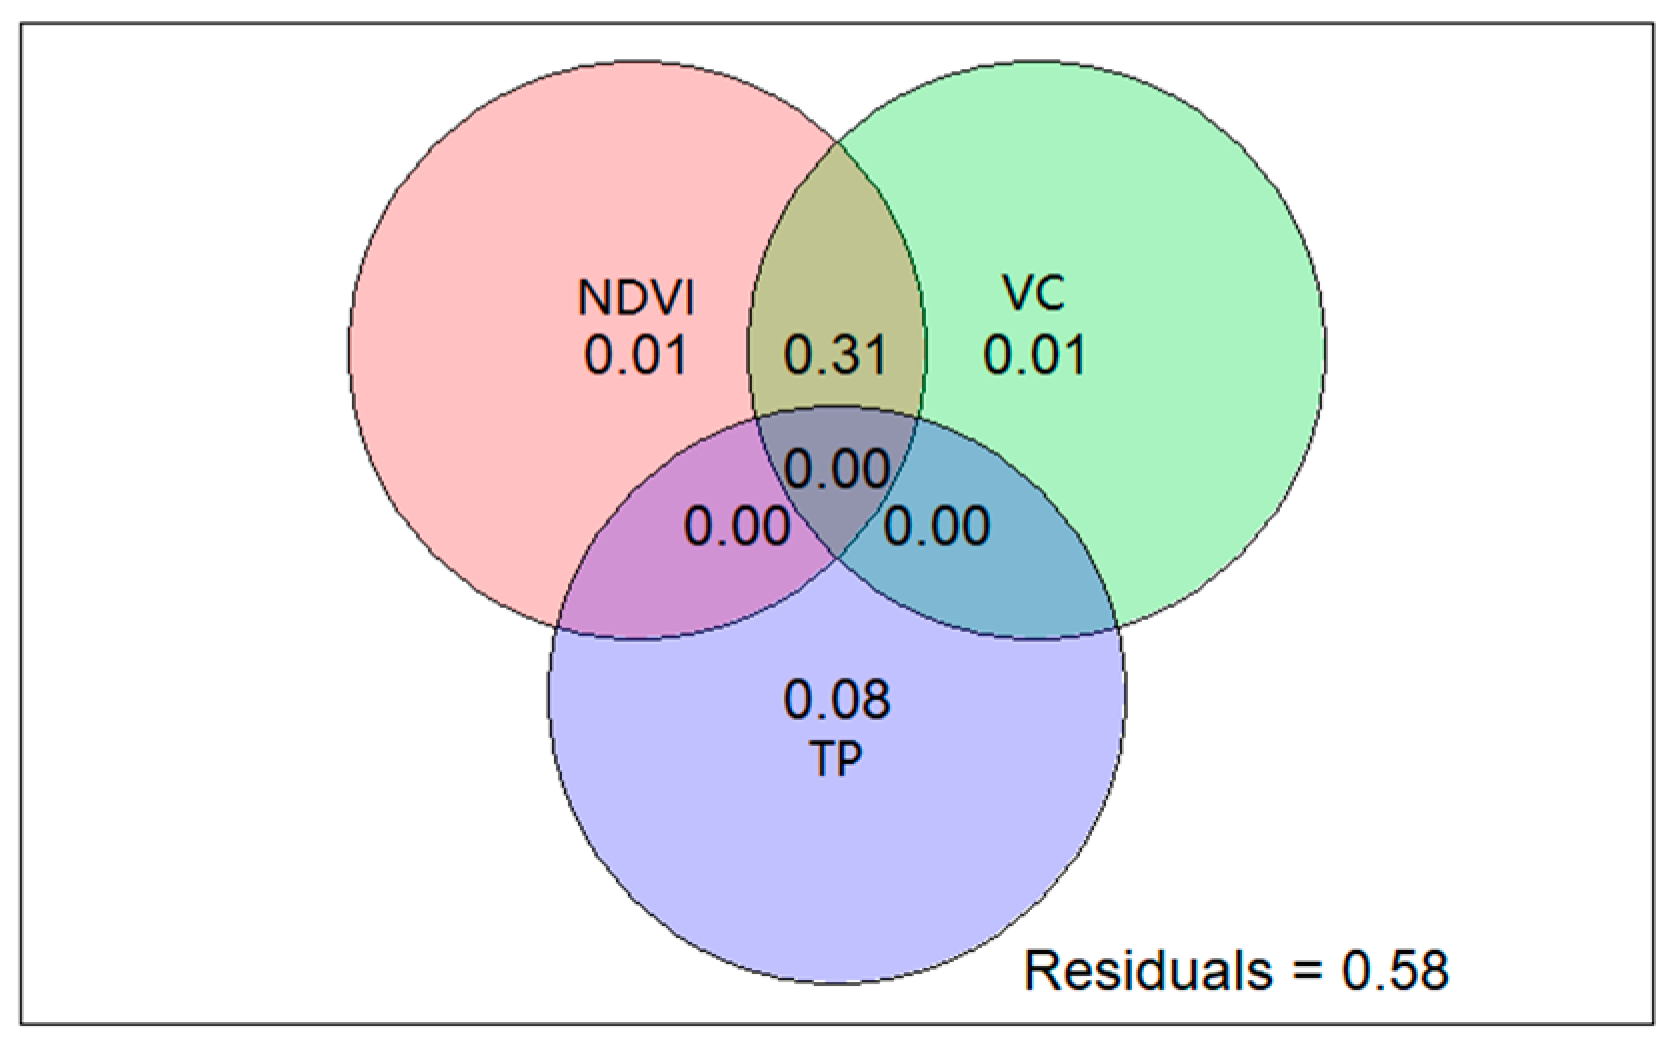
4.2.2. Influence Status (Interaction, Explanatory Threshold, Contribution Degree) of Driving Variables on Land Ecological Security

Land ecology performs an extremely critical function for promoting ecosystem stability. Many implements of multilateral policies and agreements to forest landscape restoration were promoted by the Global Partnership to restore forest and land ecosystems. such as the Bonn Challenge policy, the Aichi Target 15, the Global 2030 Agenda, and Grain-for-Green Program, dramatically sustaining the environmental management [8,9,12,16]. Vegetation is a fundamental indicator of the regional ecological environment, and NDVI is a vegetation index that can be used to accurately monitor vegetation growth, such that NDVI is positively correlated with VC [72]. TP and precipitation are closely related to NDVI, which features a lag effect and significant spatial heterogeneity [73]. Among these factors, TP is the most direct driving force affecting the change in NDVI. Changes in land use and land cover drastically alter surface temperature, and NDVI during the growing season of plants is the most sensitive to temperature, and the correlation between the two is mostly strongly correlated and extremely correlated at the 95% significance level [74,75]. In Yan’an, elevation ranges from 385 m to 1799 m and has significant differences between western and eastern regions. Among them, elevation in the districts and counties along the eastern Yellow River, concentrating on Yichuan county, Yachang county, and Yanchang county are lower than 1200 m. The elevation of the northwest region (including Zhidan county, Wuqi county, Ansai district) fluctuates between 1200 m and 1799 m, significantly exceeding that in the east (Figure 1). Remarkable spatial differences and gradients of elevation result in a diversity of climate, vegetation, and land-use patterns [61]. It was found through analysis that the ecological security index was significantly positively correlated with NDVI and VC, but was significantly negative with TP (Figure 7), which was deeply responsible for LES status.
Given the regional differences, the degree of correlation of NDVI, VC, and TP is also different [76,77]. In Yan’an, the path coefficient of NDVI, VC, and TP affecting ecological security index was 0.11, 0.11, and 0.26 (Figure 8) indicating that the direct effect of TP on ecological security index is greater than NDVI and VC. Meanwhile, a random forest model was used to simulate the effects of NDVI, VC, and TP on advanced LES status (high level and medium-high level) (Figure 9). The optimal threshold of NDVI, VC, and the temperature was 0.20–0.64, 0.20–0.55, and 11.2–13 °C, respectively, which contributed to advanced LES status (high level and medium-high level). Furthermore, the Venn diagram is committed to analyzing and quantifying the individual and common interpretation of multiple environmental variables [78]. As shown in Figure 10, LES was explained separately by NDVI, VC, and TP with 1%, 1%, and 8%, respectively. Together, NDVI and VC jointly explained 31% of LES, which were co-correlated and had a significant synergistic effect on it. Based on the 2030 agenda aim for sustainable development, natural resources and social and economic development are needed to be consistent thoroughly with healthy ecosystem cycles [13,79]. Therefore, the effect of driving variables with their significant synergistic interactions, explanatory threshold, and contribution rate on land ecological security must be regulated chronically for achieving regional ecological stability and sustainable development [80].

5. Conclusions

Spatiotemporal distribution characteristic and response mechanism of land ecological security (LES) to the driving variables in Yan’an were launched during the policy implementation (1999) of Grain for Green Project, using pressure-state-response (PSR) model based on the systematic natural-socio-economic-ecological relationships in the land ecosystem.
LES of Yan’an was mainly characterized by medium−high level and medium level from 2000 to 2018. The zone with high LES levels was mainly distributed in southern regions (concentrated in the counties of Fu, Huangling, Huanglong, Yichuan, and Ganquan), nevertheless, the area of these zones decreased over the years. Zone with medium-high LES level was mainly concentrated in western and southern regions (including the counties of Wuqi, Zhidan, Fu, and Huanglong), and continuously expanded to northeast regions. In consequence, the superior land ecological status appeared in the southwest and south of Yan’an. Additionally, the zone with the largest area appeared in medium-high LES levels, distributed in the central and northern regions, accounting for 37.22–46.27% of the total area of Yan’an. Thereby, the ecological greening projects are suggested to be persistently implemented for achieving the higher status of forest landscape ecosystem by rational regulation of land use structure, human activities, and vegetation coverage.
Normalized differential vegetation index, vegetation coverage, and land surface temperature were the primary explanatory variables of LES, separately possessing the optimal threshold of 0.20–0.64, 0.20–0.55, and 11.2–13 °C, respectively, for advanced LES status (including high level and medium-high level). Meanwhile, normalized differential vegetation index and vegetation coverage had a significant synergistic effect upon LES based on their interactive explanation rate of 31% for ecological security index and had a significantly positive and negative consistency with LES. The results of the LES evaluation combined with the influence mechanism of explanatory variables are recommended to provide profound insights into the intensification and sustainability of regional ecosystem safety.

Author Contributions

Conceptualization, methodology, validation, software, formal analysis, writing—original draft, Z.H.; methodology, validation, data curation, visualization, X.S.; investigation, supervision, funding acquisition, T.Z. All authors have read and agreed to the published version of the manuscript.

Funding

This research was funded by the Natural Science Foundation of China (41371053, 30972422, 51669034, 51809224), National Key Research and Development Project of China (2017YFC0506706, 2017YFC0504704), Project of Science and Technology Department of Shaanxi Province (202070117), and Science Research Launch Project of Ph.D. (205040305).

Institutional Review Board Statement

Not applicable.

Informed Consent Statement

Not applicable.

Data Availability Statement

Not applicable.

Acknowledgments

We thank the editors and reviewers for their detailed and constructive comments to improve the quality of the manuscript. All authors have consented to this acknowledgement.

Conflicts of Interest

The authors declare no competing interest.

Abbreviations

LESland ecological security
PSRpressure-state-response model
Secological security index
DEMdigital elevation model
NDVInormalized differential vegetation index
VCvegetation coverage
TPsurface temperature
ERSsoil erosion
ESVvalue of ecosystem service
HAIhuman disturbance index
SLPsurface slope
RDLStopographic relief
ECOthe elasticity of ecological environment
BZbuffer zone
RDIregional development index
EDeconomic density
GDPgross domestic product
LUdegree of land use
LAarable land per capita
WDwater coverage
PDdensity of population
FPgrain yield

References

  1. He, D.; Hou, K.; Wen, J.F.; Wu, S.Q.; Wu, Z.P. A coupled study of ecological security and land use change based on GIS and entropy method—A typical region in Northwest China, Lanzhou. Environ. Sci. Pollut. Res. 2021, 8, 1–13. [Google Scholar] [CrossRef] [PubMed]
  2. Moarrab, Y.; Salehi, E.; Amiri, M.J.; Hovidi, H. Spatial–temporal assessment and modeling of ecological security based on land-use/cover changes (case study: Lavasanat watershed). Int. J. Environ. Sci. Technol. 2021, 7, 1–16. [Google Scholar] [CrossRef]
  3. Zulu, L. Ultimately, What is Forest Landscape Restoration in Practice? Embodiments in Sub-Saharan Africa and Implications for Future Design. Environ. Manag. 2020, 68, 619–641. [Google Scholar]
  4. Chazdon, R.L.; Brancalion, P.; Laestadius, L.; Bennett-Curry, A.; Buckingham, K.; Kumar, C.; Moll-Rocek, J.; Vieira, I.C.G.; Wilson, S.J. When is a forest a forest? Forest concepts and definitions in the era of forest and landscape restoration. Ambio 2016, 45, 538–550. [Google Scholar] [CrossRef] [PubMed]
  5. Laestadius, L.; Buckingham, K.; Maginnis, S.; Saint-Laurent, C. Before bonn and beyond: The history and future of forest landscape restoration. Unasylva Landsc. Restor. 2015, 66, 11–18. [Google Scholar]
  6. Acharya, R.P.; Maraseni, T.N.; Cockfield, G. An Ecosystem Services Valuation Research Framework for Policy Integration in Developing Countries: A Case Study from Nepal. Sustainability 2020, 12, 8250. [Google Scholar] [CrossRef]
  7. Pistorius, T.; Carodenuto, S.; Wathum, G. Implementing forest landscape restoration in Ethiopia. Forests 2017, 8, 61. [Google Scholar] [CrossRef] [Green Version]
  8. Dave, R.; Saint-Laurent, C.; Murray, L.; Daldegan, G.; Brouwer, R.; Scaramuzza, C.A.D.M.; Raes, L.; Simonit, S.; Catapan, M.; Contreras, G.G.; et al. Second Bonn Challenge Progress Report: Application of the Barometer in 2018; IUCN: Gland, Switzerland, 2019; pp. 1–80. [Google Scholar]
  9. Pistorius, T.; Freiberg, H. From Target to Implementation: Perspectives for the International Governance of Forest Landscape Restoration. Forests 2014, 5, 482–497. [Google Scholar] [CrossRef] [Green Version]
  10. Chasek, P.; Safriel, U.; Shikongo, S.; Fuhrman, V.F. Operationalizing Zero Net Land Degradation: The next stage in international efforts to combat desertification? J. Arid. Environ. 2015, 112, 5–13. [Google Scholar] [CrossRef]
  11. Borah, B.; Bhattacharjee, A.; Ishwar, N. Bonn Challenge and India: Progress on Restoration Efforts across States and Land-Scapes; IUCN: Gland, Switzerland, 2018; pp. 44–48. [Google Scholar]
  12. United Nations. The 2030 Agenda for Sustainable Development-SDGs 15; United Nations: New York, NY, USA, 2015; p. 15. [Google Scholar]
  13. United Nations. Transforming Our World: The 2030 Agenda for Sustainable Development; United Nations: New York, NY, USA, 2015; p. 116. [Google Scholar]
  14. Rimal, B.; Keshtkar, H.; Stork, N.; Gijal, S. Forest Cover and Sustainable Development in the Lumbini Province, Nepal: Past, Present and Future. Remote Sens. 2021, 13, 4093. [Google Scholar] [CrossRef]
  15. Feng, Y.J.; Liu, Y.; Liu, Y. Spatially explicit assessment of land ecological security with spatial variables and logistic regression modeling in Shanghai, China. Stoch. Environ. Res. Risk Assess. 2017, 31, 2235–2249. [Google Scholar] [CrossRef]
  16. Wang, B.; Gao, P.; Niu, X.; Sun, J.N. Policy-driven China’s Grain to Green Program: Implications for ecosystem services. Ecosyst. Serv. 2017, 27, 38–47. [Google Scholar] [CrossRef]
  17. Wang, C.X.; Yu, C.Y.; Chen, T.Q.; Feng, Z.; Hu, Y.C.; Wu, K.N. Can the establishment of ecological security patterns improve ecological protection? An example of Nanchang, China. Sci. Total Environ. 2020, 740, 140051. [Google Scholar] [CrossRef] [PubMed]
  18. Yan, J.F.; Wang, M.H.; Su, F.Z.; Zhang, X.X.; Gao, S.S.; Xu, M.R. Changes in land cover and ecological stress in Borneo based on remote sensing and an ecological footprint method. Landsc. Ecol. Eng. 2020, 16, 319–333. [Google Scholar] [CrossRef]
  19. Goodarzi, M.; Haghtalab, N.; Saeedi, I.; Moore, N.J. Structural and functional improvement of urban fringe areas: Toward achieving sustainable built–natural environment interactions. Environ. Dev. Sustain. 2020, 22, 6727–6754. [Google Scholar] [CrossRef]
  20. Pilar, M.A.; Marta, O.; Carlos, L.P. A procedure of landscape services assessment based on mosaics of patches and boundaries. J. Environ. Manag. 2016, 180, 214–227. [Google Scholar]
  21. Sarkodie, S.A. Environmental performance, biocapacity, carbon & ecological footprint of nations: Drivers, trends and mitigation options. Sci. Total Environ. 2021, 751, 141912. [Google Scholar] [PubMed]
  22. Popkova, E.G.; Shakhovskaya, L.S.; Abramov, S.A.; Natsubize, A.S. Ecological clusters as a tool of improving the environ-mental safety in developing countries. Environ. Dev. Sustain. 2016, 18, 1049–1057. [Google Scholar] [CrossRef]
  23. Guo, K.; Zhang, X.C.; Liu, J.M.; Wu, Z.F.; Chen, M.; Zhang, K.X.; Chen, Y.Y. Establishment of an integrated decision-making method for planning the ecological restoration of terrestrial ecosystems. Sci. Total Environ. 2020, 741, 139852. [Google Scholar] [CrossRef]
  24. Feng, Y.J.; Yang, Q.Q.; Tong, X.H.; Chen, L.J. Evaluating land ecological security and examining its relationships with driving factors using GIS and generalized additive model. Sci. Total Environ. 2018, 633, 1469–1479. [Google Scholar] [CrossRef] [PubMed]
  25. Milovanović, A.; Milovanović Rodić, D.; Maruna, M. Eighty-year review of the evolution of landscape ecology: From a spatial planning perspective. Landsc. Ecol. 2020, 35, 2141–2161. [Google Scholar] [CrossRef]
  26. Xie, H.L.; Zhang, Y.W.; Zeng, X.J.; He, Y.F. Sustainable land use and management research: A scientometric review. Landsc. Ecol. 2020, 31, 1–31. [Google Scholar] [CrossRef]
  27. Adegboyega, S.A.; Oloukoi, J.; Olajuyigbe, A.E.; Ajibade, O.E. Evaluation of unsustainable land use/land cover change on ecosystem services in coastal area of Lagos state, Nigeria. Appl. Geomat. 2018, 11, 97–110. [Google Scholar] [CrossRef]
  28. Bai, X.R.; Tang, J.C. Ecological Security Assessment of Tianjin by PSR Model. Procedia Environ. Sci. 2010, 2, 881–887. [Google Scholar] [CrossRef] [Green Version]
  29. Hu, X.S.; Xu, H.Q. A new remote sensing index based on the pressure-state-response framework to assess regional ecological change. Environ. Sci. Pollut. Res. 2019, 26, 5381–5393. [Google Scholar] [CrossRef]
  30. Wolfslehner, B.; Vacik, H. Evaluating sustainable forest management strategies with the Analytic Network Process in a Pressure-State-Response framework. J. Environ. Manag. 2008, 88, 1–10. [Google Scholar] [CrossRef]
  31. Yang, J.; Zeng, C.; Cheng, Y.J. Spatial influence of ecological networks on land use intensity. Sci. Total Environ. 2020, 717, 137151. [Google Scholar] [CrossRef] [PubMed]
  32. Ma, L.B.; Bo, J.; Li, X.Y.; Fang, F.; Cheng, W.J. Identifying key landscape pattern indices influencing the ecological security of inland river basin: The middle and lower reaches of Shule River Basin as an example. Sci. Total Environ. 2019, 674, 424–438. [Google Scholar] [CrossRef] [PubMed]
  33. Yu, J.; Li, F.T.; Wang, Y.; Lin, Y.; Peng, Z.W.; Cheng, K. Spatiotemporal evolution of tropical forest degradation and its impact on ecological sensitivity: A case study in Jinghong, Xishuangbanna, China. Sci. Total Environ. 2020, 727, 138678. [Google Scholar] [CrossRef] [PubMed]
  34. Dong, H.W.; Feng, Z.M.; Yang, Y.Z.; Li, P.; You, Z. Dynamic assessment of ecological sustainability and the associated driving factors in Tibet and its cities. Sci. Total Environ. 2021, 759, 143552. [Google Scholar] [CrossRef] [PubMed]
  35. Gong, J.Z.; Liu, Y.S.; Xia, B.C.; Zhao, G.W. Urban ecological security assessment and forecasting, based on a cellular automata model: A case study of Guangzhou, China. Ecol. Model. 2009, 220, 3612–3620. [Google Scholar] [CrossRef]
  36. Wu, X.T.; Wang, S.; Fu, B.J.; Feng, X.M.; Chen, Y.Z. Socio-ecological changes on the Loess Plateau of China after Grain to Green Program. Sci. Total Environ. 2019, 678, 565–573. [Google Scholar] [CrossRef]
  37. Scavarda, A.; Daú, G.; Scavarda, L.F.; Azevedo, B.D.; Korzenowski, A.L. Social and ecological approaches in urban interfaces: A sharing economy management framework. Sci. Total Environ. 2020, 713, 134407. [Google Scholar] [CrossRef]
  38. Adimassu, Z.; Langan, S.; Johnston, R. Understanding determinants of farmers’ investments in sustainable land management practices in Ethiopia: Review and synthesis. Environ. Dev. Sustain. 2015, 18, 1005–1023. [Google Scholar] [CrossRef]
  39. Li, G.Y.; Jiang, C.H.; Du, J.; Jia, Y.P.; Bai, J. Spatial differentiation characteristics of internal ecological land structure in rural settlements and its response to natural and socio-economic conditions in the Central Plains, China. Sci. Total Environ. 2020, 709, 135932. [Google Scholar] [CrossRef] [PubMed]
  40. Li, H.Q.; Zhao, Y.Y.; Zheng, F. The framework of an agricultural land-use decision support system based on ecological en-vironmental constraints. Sci. Total Environ. 2020, 717, 137149. [Google Scholar] [CrossRef]
  41. Xing, L.; Hu, M.S.; Wang, Y. Integrating ecosystem services value and uncertainty into regional ecological risk assessment: A case study of Hubei Province, Central China. Sci. Total Environ. 2020, 740, 140126. [Google Scholar] [CrossRef] [PubMed]
  42. Fu, B.J.; Wang, S.; Liu, Y.; LIU, J.B.; Liang, W.; Miao, C.Y. Hydrogeomorphic ecosystem responses to natural and anthropo-genic changes in the Loess Plateau of China. Annu. Rev. Earth Planet. Sci. 2017, 45, 223–243. [Google Scholar] [CrossRef]
  43. Dang, X.H.; Liu, G.B. Emergy measures of carrying capacity and sustainability of a target region for an ecological restoration programme: A case study in Loess Hilly Region, China. J. Environ. Manag. 2012, 102, 55–64. [Google Scholar] [CrossRef]
  44. Wu, L.; Li, P.; Ma, X.-Y. Estimating nonpoint source pollution load using four modified export coefficient models in a large easily eroded watershed of the loess hilly–gully region, China. Environ. Earth Sci. 2016, 75, 1056. [Google Scholar] [CrossRef]
  45. Yang, B.; Wang, W.L.; Guo, M.M.; Guo, W.Z.; Wang, W.X.; Kang, H.L.; Zhao, M.; Chen, Z.X. Soil erosion of unpaved loess roads subjected to an extreme rainstorm event: A case study of the Jiuyuangou watershed on the Loess Plateau, China. J. Mt. Sci. 2019, 16, 1396–1407. [Google Scholar] [CrossRef]
  46. Acharya, R.P.; Maraseni, T.N.; Cockfield, G. Local users and other stakeholders’ perceptions of the identification and priori-tization of ecosystem services in fragile mountains: A case study of chure region of Nepal. Forests. 2019, 10, 421. [Google Scholar] [CrossRef] [Green Version]
  47. Acharya, R.P.; Maraseni, T.; Cockfield, G. Assessing the financial contribution and carbon emission pattern of provisioning ecosystem services in Siwalik forests in Nepal: Valuation from the perspectives of disaggregated users. Land Use Policy 2020, 95, 104647. [Google Scholar] [CrossRef]
  48. Chen, D.; Lan, Z.; Li, W. Construction of land ecological security in Guangdong province from the perspective of ecological demand. J. Ecol. Rural Environ. 2019, 35, 826–835. [Google Scholar]
  49. Wen, J.F.; Hou, K.; Li, H.H.; Zhang, Y.; He, D.; Mei, R.C. Study on the spatial-temporal differences and evolution of ecological security in the typical area of the Loess Plateau. Environ. Sci. Pollut. Res. 2021, 28, 23521–23533. [Google Scholar] [CrossRef] [PubMed]
  50. De La Mora, G.D.L.M.; Sánchez-Nupan, L.O.; Castro-Torres, B.; Galicia, l. Sustainable community forest management in Mex-ico: An integrated model of three socio-ecological frameworks. Environ. Manag. 2021, 68, 900–913. [Google Scholar] [CrossRef] [PubMed]
  51. Xie, H.L.; He, Y.F.; Choi, Y.P.; Chen, Q.R.; Cheng, H. Warning of negative effects of land-use changes on ecological security based on GIS. Sci. Total Environ. 2020, 704, 135427. [Google Scholar] [CrossRef]
  52. He, W.; Wen, Y.; Xiong, Z. Spatial-temporal dynamics and scenario simulation of land ecological security: A case study of Deyang, Sichuan Province, China. Environ. Sci. Pollut. Res. 2021, 28, 20209–20221. [Google Scholar] [CrossRef]
  53. Sun, T.T.; Lin, W.P.; Chen, G.S.; Guo, P.P.; Zeng, Y. Wetland ecosystem health assessment through integrating remote sensing and inventory data with an assessment model for the Hangzhou Bay, China. Sci. Total Environ. 2016, 566, 627–640. [Google Scholar] [CrossRef] [PubMed]
  54. Gao, C.L.; Li, S.C.; Wang, J.; Li, L.P.; Lin, P. The Risk Assessment of Tunnels Based on Grey Correlation and Entropy Weight Method. Geotech. Geol. Eng. 2017, 36, 1621–1631. [Google Scholar] [CrossRef]
  55. Hou, K.; Li, X.; Wang, J.J.; Zhang, J. An analysis of the impact on land use and ecological vulnerability of the policy of returning farmland to forest in Yan’an, China. Environ. Sci. Pollut. Res. 2016, 23, 4670–4680. [Google Scholar] [CrossRef] [PubMed]
  56. Stanturf, J.A.; Kleine, M.; Mansourian, S.; Parotta, J.; Madsen, P.; Kant, P.; Burns, J.; Bolte, A. Implementing forest landscape restoration under the Bonn Challenge: A systematic approach. Ann. Forest Sci. 2019, 76, 50. [Google Scholar] [CrossRef]
  57. Hua, T.; Zhao, W.W.; Cherubini, F.; Xu, X.P. Sensitivity and future exposure of ecosystem services to climate change on the Tibetan Plateau of China. Landsc. Ecol. 2021, 36, 3451–3471. [Google Scholar] [CrossRef]
  58. Lu, S.S.; Li, J.P.; Guan, X.L.; Gao, X.J.; Gu, Y.H.; Zhang, D.H.; Mi, F.; Li, D.D. The evaluation of forestry ecological security in China: Developing a decision support system. Ecol. Indic. 2018, 91, 664–678. [Google Scholar] [CrossRef]
  59. Li, Y.; Sun, X.; Zhu, X.; Cao, H. An early warning method of landscape ecological security in rapid urbanizing coastal areas and its application in Xiamen, China. Ecol. Model. 2010, 221, 2251–2260. [Google Scholar] [CrossRef]
  60. Feng, D.R.; Wang, J.M.; Fu, M.C.; Liu, G.C.; Tang, R.B. Spatiotemporal variation and influencing factors of vegetation cover in the ecologically fragile areas of China from 2000 to 2015: A case study in Shaanxi Province. Environ. Sci. Pollut. Res. 2019, 26, 28977–28992. [Google Scholar] [CrossRef] [PubMed]
  61. Li, L.F.; Khan, S.U.; Xia, X.L.; Zhang, H.L.; Guo, C.H. Screening of agricultural land productivity and returning farmland to forest area for sensitivity to rural labor outward migration in the ecologically fragile Loess Plateau region. Environ. Sci. Pollut. Res. 2020, 27, 26442–26462. [Google Scholar] [CrossRef]
  62. Fan, M.; Shibata, H.; Wang, Q. Optimal conservation planning of multiple hydrological ecosystem services under land use and climate changes in Teshio river watershed, northernmost of Japan. Ecol. Indic. 2016, 62, 1–13. [Google Scholar] [CrossRef]
  63. Fu, B.; Burghe, R.I. Riparian vegetation NDVI dynamics and its relationship with climate, surface water and groundwater. J. Arid Environ. 2015, 113, 59–68. [Google Scholar] [CrossRef]
  64. Zhe, M.; Zhang, X.Q. Time-lag effects of NDVI responses to climate change in the Yamzhog Yumco Basin, South Tibet. Ecol. Indic. 2021, 124, 107431. [Google Scholar] [CrossRef]
  65. Meng, M.; Ni, J.; Zong, M. Impacts of changes in climate variability on regional vegetation in China: NDVI-based analysis from 1982 to 2000. Ecol. Res. 2011, 26, 421–428. [Google Scholar] [CrossRef]
  66. Liu, Q.; Yang, A.P.; Han, F.; Wang, Z.G.; Wang, C.R. NDVI-based vegetation dynamics and their response to recent climate change: A case study in the Tianshan Mountains, China. Environ. Earth Sci. 2016, 75, 1189. [Google Scholar] [CrossRef]
  67. Zhou, D.; Lin, Z.L.; Ma, S.L.; Qi, J.M.; Yan, T.T. Assessing an ecological security network for a rapid urbanization region in Eastern China. Land Degrad. Dev. 2021, 32, 2642–2660. [Google Scholar] [CrossRef]
  68. Qu, L.L.; Huang, Y.X.; Yang, L.F.; Li, Y.R. Vegetation Restoration in Response to Climatic and Anthropogenic Changes in the Loess Plateau, China. Chin. Geogr. Sci. 2020, 30, 89–100. [Google Scholar] [CrossRef] [Green Version]
  69. Xin, Z.B.; Xu, J.X.; Zheng, W. Spatiotemporal variations of vegetation cover on the Chinese Loess Plateau (1981–2006): Impacts of climate changes and human activities. Sci. China Ser. D 2007, 37, 1504–1514. [Google Scholar] [CrossRef]
  70. Li, Y.R.; Cao, Z.; Long, H.L. Dynamic analysis of ecological environment combined with land cover and NDVI changes and implications for sustainable urban–rural development: The case of Mu Us Sandy Land, China. J. Clean. Prod. 2017, 142, 697–715. [Google Scholar] [CrossRef]
  71. Cao, Z.; Li, Y.R.; Liu, Y.S.; Chen, Y.F.; Wang, Y.S. When and where did the Loess Plateau turn ‘green’? Analysis of the tendency and breakpoints of the normalized difference vegetation index. Land Degrad. Dev. 2018, 29, 162–175. [Google Scholar] [CrossRef]
  72. Xu, Y.F.; Yang, J.; Chen, Y.N. NDVI-based vegetation responses to climate change in an arid area of China. Theor. Appl. Climatol. 2016, 126, 213–222. [Google Scholar] [CrossRef]
  73. Huang, S.; Huang, Q.; Leng, G.; Zhao, M.; Meng, E. Variations in annual water-energy balance and their correlations with vegetation and soil moisture dynamics: A case study in the Wei River Basin, China. J. Hydrol. 2017, 546, 515–525. [Google Scholar] [CrossRef]
  74. Yang, Z.P.; Gao, J.X.; Zhou, C.P.; Shi, P.L.; Zhao, L.; Shen, W.S.; Wang, W.X. Spatio-temporal changes of NDVI and its relation with climatic variables in the source regions of the Yangtze and Yellow rivers. J. Geogr. Sci. 2011, 21, 979–993. [Google Scholar] [CrossRef]
  75. Guan, Q.Y.; Yang, L.Q.; Guan, W.Q.; Wang, F.F.; Liu, Z.Y.; Xu, C.Q. Assessing vegetation response to climatic variations and human activities: Spatiotemporal NDVI variations in the Hexi Corridor and surrounding areas from 2000 to 2010. Theor. Appl. Clim. 2018, 135, 1179–1193. [Google Scholar] [CrossRef]
  76. Wang, J.; Wang, K.L.; Zhang, M.Y.; Zhang, C.H. Impacts of climate change and human activities on vegetation cover in hilly southern China. Ecol. Eng. 2015, 81, 451–461. [Google Scholar] [CrossRef]
  77. Chu, H.; Venevsky, S.; Wu, C.; Wang, M. NDVI-based vegetation dynamics and its response to climate changes at Amur-Heilongjiang River Basin from 1982 to 2015. Sci. Total Environ. 2019, 650, 2051–2062. [Google Scholar] [CrossRef] [PubMed]
  78. Bhattacharjee, R.; Chakraborty, M.K.; Choudhury, L. Venn Diagram with Names of Individuals and Their Absence: A Non-classical Diagram Logic. Log. Univers. 2018, 12, 141–206. [Google Scholar] [CrossRef]
  79. Liu, J.G.; Ouyang, Z.Y.; Yang, W.; Xu, W.H.; Li, S.X. Evaluation of Ecosystem Service Policies from Biophysical and Social Perspectives: The Case of China. Encycl. Biodivers. 2013, 372–384. [Google Scholar]
  80. Acharya, R.P.; Maraseni, T.; Cockfield, G. Global trend of forest ecosystem services valuation–An analysis of publications. Ecosyst. Serv. 2019, 39, 100979. [Google Scholar] [CrossRef]
Figure 1. Location of the study region. Including the municipal administrative boundary of Shaanxi Province (left), and the elevation of Yan’an (right).
Forests 12 01754 g001
Figure 2. Spatiotemporal pattern of land ecological security (LES) in Yan’an. S represents the ecological security index measuring LES level. S ≥ 0.75 represents the high level, 0.65 ≤ S < 0.75 represents the medium−high level, 0.55 ≤ S < 0.65 represents the medium level, 0.45 ≤ S < 0.55 represents the medium−low level, and S < 0.45 represents the low level.
Forests 12 01754 g002
Figure 3. Variation of S from 2000 to 2018. S00, S05, S10, S15, S18 represents S of 2000, 2005, 2010, 2015, and 2018, respectively. Kruskal test method was used because of the non–normality of S (p = 0, in Shapiro–Wilk test). S represents the ecological security index measuring the level of LES. ▽ represents minimum value; ◊ represents value of 1%; □ represents median; + represents value of 99%; △ represents maximum value.
Forests 12 01754 g003
Figure 4. The area of the zone in different LES levels from 2000 to 2018: high, medium−high, medium, medium−low, and low levels. The right Y-axis represents the area variation of the low level of LES, the left Y-axis represents the area variation of the other four levels of LES.
Forests 12 01754 g004
Figure 5. Principal component analysis of land ecological security in Yan’an from 2000 to 2018. Contrib. represents contribution rate of each factor to LES; LES represents land ecological security; TP represents land surface temperature; VC represents vegetation coverage; NDVI represents normalized differential vegetation index; ERS represents soil erosion; ESV represents the value of the ecosystem service; HAI represents human disturbance index; SLP represents slope; RDLS represents topographic relief; ECO represents the elasticity of ecological environment; BZ represents buffer zone; RDI represents regional development index; ED represents economic density; GDP represents gross domestic product; LU represents the degree of land use; LA represents arable land per capita; WD represents water coverage; PD represents the density of the population; FP, grain yield.
Forests 12 01754 g005
Figure 6. Canonical correspondence analysis of LES in Yan’an from 2000 to 2018. A, B, C, D, E represents the years 2000, 2005, 2010, 2015, and 2018, respectively. NDVI represents normalized differential vegetation index; VC represents vegetation coverage; TP represents land surface temperature.
Forests 12 01754 g006
Figure 7. Relationship between NDVI, VC, TP, and S with 95% CI. ** represents a significant correlation at 0.01 level (bilateral). S represents ecological security index; LES represents land ecological security; NDVI represents normalized differential vegetation index; VC represents vegetation coverage; TP represents land surface temperature; CI represents confidence interval. Shaded areas represent 95% confidence intervals.
Forests 12 01754 g007
Figure 8. Path analysis between NDVI, VC, TP, and S of LES. The numerical value represents path coefficient; S represents ecological security index; LES represents land ecological security; NDVI represents normalized differential vegetation index; VC represents vegetation coverage; TP represents land surface temperature.
Forests 12 01754 g008
Figure 9. Influences of NDVI, VC, and TP on advanced LES status (high level and medium−high level) based on the random forest model. LES represents land ecological security; NDVI represents normalized differential vegetation index; VC represents vegetation coverage; TP represents land surface temperature. The value between the red dotted lines represents the optimal threshold range of NDVI, VC, and TP required by the advanced LES status.
Forests 12 01754 g009
Figure 10. Contribution rates of NDVI, VC, and TP to LES. NDVI represents normalized differential vegetation index; VC represents vegetation coverage; TP represents land surface temperature.
Forests 12 01754 g010
Table 1. The evaluation system of land ecological security (LES) in Yan’an. LES represents land ecological security. 18 indexes of natural-socio-economic-ecological systems are divided into environmental pressure, environmental status, and human response based on the structure of the PSR model to evaluate LES.
Target LayerRule LayerIndex LayerTrendWeight
The evaluation of regional ecological securityRegional environmental pressure C1x1   Population density (P km−2) C11negative0.0964
x2   Economic density (Yuan km−2) C12negative0.0576
x3   Cultivated area per capita (hm2 P−1) C13negative0.0576
x4   Human disturbance index C14negative0.0374
x5   Town buffer classification C15negative0.0530
x6   Degree of land use C16negative0.0527
Regional environmental status C2x7   Slope C21negative0.0530
x8   Land Relief C22negative0.0576
x9   NDVI C23positive0.0144
x10  Vegetation coverage C24negative0.0577
x11  Soil erosion sensitivity C25negative0.0579
x12  Land surface temperature C26negative0.1046
x13  Water coverage C27positive0.0388
x14  Value of ecosystem services C28positive0.0576
x15  Ecosystem resilience C29positive0.0576
Regional human response C3x16  GDP per capita (Yuan P−1) C31positive0.0576
x17  Grain output per capita C33positive0.0576
x18  Regional development index C34negative0.0308
Table 2. The details of collected satellite images (cloudage ≤ 5%) for the classifications of land use types, including path/row, acquisition time (day month year), and spatial resolution of satellite data.
Path/RowSatelliteAcquisition TimeSpatial ResolutionPath/RowSatelliteAcquisition TimeSpatial Resolution
126/034Landsat 527 April 200030 m127/035Landsat 518 April 200030 m
Landsat 512 June 200530 mLandsat 519 June 200530 m
Landsat 512 July 201030 mLandsat 517 June 201030 m
Landsat 8 OLI_TIRS8 Jule 201530 mLandsat 8 OLI_TIRS1 July 201530 m
Landsat 8 OLI_TIRS29 April 201830 mLandsat 8 OLI_TIRS22 May 201830 m
126/035Landsat 527 April 200030 m128/034Landsat 59 April 200030 m
Landsat 512 June 200530 mLandsat 59 May 200530 m
Landsat 512 July 201030 mLandsat 524 June 201030 m
Landsat 8 OLI_TIRS8 June 201530 mLandsat 8 OLI_TIRS24 July 201530 m
Landsat 8 OLI_TIRS31 May 201830 mLandsat 8 OLI_TIRS29 May 201830 m
127/034Landsat 55 June 200030 m128/035Landsat 511 May 200030 m
Landsat 53 June 200530 mLandsat 526 June 2005 30 m
Landsat 519 July 201030 mLandsat 524 June 201030 m
Landsat 8 OLI_TIRS1 July 201530 mLandsat 8 OLI_TIRS24 July 201530 m
Landsat 8 OLI_TIRS23 June 201830 mLandsat 8 OLI_TIRS14 June 201830 m
Table 3. The classification and description of six types of land use.
Type IType IIDescription
CroplandPaddy fieldCultivated land with a water supply and irrigation facilities, which can be irrigated normally in general years for plant aquatic crops.
DrylandCultivated land without irrigation water sources and facilities, growing crops by precipitation; Dry cropland that can be irrigated normally in general years with water and irrigation facilities.
Forest landForestlandNatural forests and plantations with canopy density > 30%.
ShrublandDwarf woodland and shrubby woodland with canopy density > 40% and height below 2 m.
Open forest landForest land with 10–30% canopy density.
Other forest landUndeveloped forest land, nurseries, and gardens.
Grassland High coverage grassland (coverage > 50%), high coverage grassland (20% < coverage < 50%), high coverage grassland (5% < coverage < 20%)
Water Graff, lakes, reservoir pits, permanently glacial snow, rhoals, beach.
Built-up land Urban and rural residential land, other construction lands.
Unused land Desert, gobi, saline-alkali soil, wetland, bare land, bare rock.
Table 4. Evaluation level of LES. S represents the ecological security index. LES represents land ecological security.
Ecological Security IndexS < 0.450.45–0.550.55–0.650.65–0.75≥0.75
LES level Low securityMedium−low securityMedium securityMedium−high securityHigh security
Table 5. Stepwise regression analysis of factors affecting LES. LES represents land ecological security. ANOVA represents the analysis of variance.
CoefficientANOVA
IndexStandardized CoefficientTpR2Fp
(Constant) 50.04500.809538.7400
VC0.20213.956
TP−0.305−23.398
HAI−0.195−15.219
GDP−0.049−3.756
LA−0.151−10.411
ESV0.0453.556
ED−0.077−6.245
ECO0.0611.700
NDVI0.5274.589
RDI0.1952.099
LU0.0852.090
Publisher’s Note: MDPI stays neutral with regard to jurisdictional claims in published maps and institutional affiliations.

